Article

Anodic Stripping Voltammetry with the Hanging Mercury Drop Electrode for Trace Metal Detection in Soil Samples

Department of Chemistry, School of Engineering Science in Chemistry, Biotechnology and Health, KTH Royal Institute of Technology, Teknikringen 30, SE-100 44 Stockholm, Sweden
*
Authors to whom correspondence should be addressed.
Submission received: 21 April 2021 / Revised: 8 May 2021 / Accepted: 9 May 2021 / Published: 13 May 2021
(This article belongs to the Special Issue Modern Directions in Ion Electroanalysis for Real World Applications)

Abstract

:
The widely spread use of the hanging mercury drop electrode (HMDE) for multi-ion analysis is primarily ascribed to the following reasons: (i) excellent reproducibility owing to the easy renewal of the electrode surface avoiding any hysteresis effect (i.e., a new identical drop is generated for each measurement to be accomplished); (ii) a wide cathodic potential window originating from the passive hydrogen evolution and solvent electrolysis; (iii) the ability to form amalgams with many redox-active metal ions; and (iv) the achievement of (sub)nanomolar limits of detection. On the other hand, the main controversy of the HMDE usage is the high toxicity level of mercury, which has motivated the scientific community to question whether the HMDE deserves to continue being used despite its unique capability for multi-metal detection. In this work, the simultaneous determination of Zn2+, Cd2+, Pb2+, and Cu2+ using the HMDE is investigated as a model system to evaluate the main features of the technique. The analytical benefits of the HMDE in terms of linear range of response, reproducibility, limit of detection, proximity to ideal redox behavior of metal ions and analysis time are herein demonstrated and compared to other electrodes proposed in the literature as less-toxic alternatives to the HMDE. The results have revealed that the HMDE is largely superior to other reported methods in several aspects and, moreover, it displays excellent accuracy when simultaneously analyzing Zn2+, Cd2+, Pb2+, and Cu2+ in such a complex matrix as digested soils. Yet, more efforts are required towards the definitive replacement of the HMDE in the electroanalysis field, despite the elegant approaches already reported in the literature.

1. Introduction

Anodic stripping voltammetry (ASV) is an electrochemical technique traditionally employed for the detection of metal ions at trace levels. Metal ions are first preconcentrated onto the working electrode surface, which advantageously results in significantly lower limits of detection (LOD) as compared to direct voltammetry measurements (i.e., (sub)nanomolar versus micromolar levels) [1]. This is indeed crucial when analyzing real (and complex) samples, for example, environmental waters, biofluids, and tissues. Another attractive feature of ASV techniques is the possibility to perform multi-ion analysis by means of a sole scan [2], identifying each (redox active) ion according to its formal redox potential (E0). Thus, multi-ion analysis is achievable provided that the difference in E0 of the considered target ions is wide enough to avoid peak overlapping but also, that the formation of intermetallic compounds does not occur. Metal ions commonly and simultaneously determined through ASV include Zn2+, Cd2+, Pb2+, Cu2+, and Hg2+ [3,4,5,6]. Furthermore, ASV allows for metal speciation, distinguishing different oxidation states of a metal (e.g., As(III) and As(V) [7,8]) as well as between the free metal ion and inorganic and organic complexes [9]. The latter is particularly relevant in environmental analysis, because it makes possible to investigate metal bioavailability, reactivity and toxicity [10].
In general terms, the performance of ASV measurements is highly influenced by the selected working electrode [11]. For many years, ASV was the synonym of mercury electrodes, primarily in the form of the hanging mercury drop electrode (HMDE) and, to a lesser extent, the mercury thin-film electrode (MTFE) [2,11]. Specifically, the HMDE displays many attractive features such as: (i) easy renewal of the electrode surface, which provides high reproducibility; (ii) a wide cathodic potential window resulting from the kinetically unfavored hydrogen evolution and solvent electrolysis; and (iii) the ability to form amalgams with many different metal ions [12,13]. On the other hand, MTFE avoids some inconveniences related to the handling of liquid mercury, providing hence a more suitable approach for flow-mode and on-site measurements [11].
Despite the excellent performance of the HMDE and MTFE, the high toxicity of mercury has encouraged the development of alternative electrodes for metal ion determination, in which the use of mercury in the preparation/measurement approach is totally avoided [11]. Accordingly, a great variety of electrodes have been proposed in the past decades for the ASV determination of trace metal ions, including metal film electrodes based on less toxic metals such as Bi or Sb [14,15], chemically modified electrodes [11,16], as well as electrodes based on different types of nanomaterials (e.g., carbon nanoallotropes, metal nanoparticles) [17]. However, despite all the great efforts reported in the literature at the time of writing, the HMDE is still today the recommended analytical approach in reference laboratory analysis [18]. This fact highlights the difficulty in finding a new electrode that features the performance of the HMDE for trace metal detection and therefore being proposed as the definitive replacement.
In this work, the simultaneous determination of Zn2+, Cd2+, Pb2+ and Cu2+ is investigated with the HMDE operating with ASV measurements. The performance of the HMDE coupled to modern potentiostat instrumentation and data treatment is compared to that observed with alternative electrodes that have been reported in the literature for the same kind of multi-ion analysis. A critical assessment of the HMDE features is aimed to be herein provided. Both experimental conditions and analytical characteristics are widely discussed, concluding that, even though the HMDE has been criticized as an ‘outdated’ and ‘toxic’ approach to accomplish the task for metal detection in real samples, its accuracy and multi-analyte feature are still superior to any other electrochemical method considering solid electrode materials.

2. Experimental

2.1. Reagents and Instrumentation

Aqueous solutions were prepared in deionized water (18.2 MΩ). Lead nitrate, copper nitrate, zinc nitrate and cadmium nitrate were purchased from Sigma Aldrich. The HMDE experiments were conducted with a Multi-Mode Electrode Pro system (MME pro Model 6.1246.120) installed in a 663 VA stand (HMDE Station, Metrohm Autolab B.V., Utrecht, The Netherlands). The reference electrode was the Ag/AgCl/3M KCl (Model 6.0728.x20) electrode and the counter electrode was a glassy carbon (Model 6.1248.040) [19]. The 663 VA stand connected to an IME663 interface (Metrohm Autolab B.V.) in conjunction with an Autolab potentiostat (PGSTAT101, Metrohm, Switzerland) was employed to control nitrogen flux and stirrer. The electrochemical protocol for the ASV was programmed in the NOVA 2.0 software (Metrohm, Switzerland), which was also used for data acquisition and visualization. A conventional three-electrode voltammetric cell was used.

2.2. Measurements with the HMDE

The HMDE was prepared according to the manufacturer instructions and placed into the electrochemical cell together with the reference and counter electrodes and the finely control of the mercury drop was experimentally confirmed. Subsequently, inner atmosphere of ca. 1.0 bar of N2 was plugged with the electrode, and the protocol in the 663 VA stand was selected for the HMDE to generate identical mercury drop (radius 0.1 cm) for each measurement by the instrument stand. After that, the sample to be analyzed was placed in the electrochemical cell and a constant flow of N2 was purged for 10 min to remove the O2 from the solution. Finally, the ASV protocol was applied. Notably, during the deposition step, the stirrer was turned on to generate a stable and reproducible movement of the sample solution without altering the mercury drop.

2.3. Protocol for the Analysis of Soil Samples

A total of 19 soil samples were collected from an anonymized area that used to be heavily industrialized. The ground was dug up to a depth of ca. 40 cm, and then at least 500 g of soil were collected from different positions. The extraction of the organic matter in each soil sample was carried out as follows: 10 g of each sample was treated with 1 g of dried MgSO4 and 30 mL hexane/acetone (1:1) solution for an hour (under stirring). Then the samples were left to allow the gravel to sink to the bottom of the recipient (beaker). Next, the solutions were passed through filter papers (150 mm Ø, Whatman™). The soil samples were then stored in the fridge until the next step was accomplished. Approximately 30 g of each sample was placed in a new beaker with 150 mL of deionized water and the solution was vigorously stirred for 30 min. Subsequently, 20 g of each sample was treated with 100 mL of 5 M HNO3 for 60 min (under stirring). Finally, the samples were suction filtered (150 mm Ø, Whatman™) and transferred to falcon tubes, which were kept in the fridge until measured.
For the ASV measurements, an aliquot of 10 µL of each sample was diluted with HNO3 until a final volume of 20 mL. This solution was then placed into the voltammetric cell, and deaerated with N2 for 10 min. Subsequently, metal ions were deposited for 120 s, at −1.1 V under stirring and, after 30 s of equilibration time, the potential was scanned from −1.1 to 0.15 V using a frequency of 40 Hz, pulse amplitude of 25 mV, and pulse step of 4 mV in square wave ASV (SWASV) mode. Baseline subtraction was accomplished prior to peak integration using Matlab software. An example of this procedure is presented in Figure 1 using a set of real data.
For each individual peak, baseline was determined by fitting a polynomic curve from manually selected points. Then, the calculated baseline was subtracted from the raw data, and peak intensity was calculated as the maximum of the resulting peaks. While raw voltammograms are shown in the results and discussion section, in all the cases, the provided peak height and related calculations are referred to corrected voltammograms. Inductively coupled plasma atomic emission spectroscopy (ICP-AES) measurements of soil samples were additionally performed with a Thermo Scientific iCAP 6000 series instrument for validation.

3. Results and Discussion

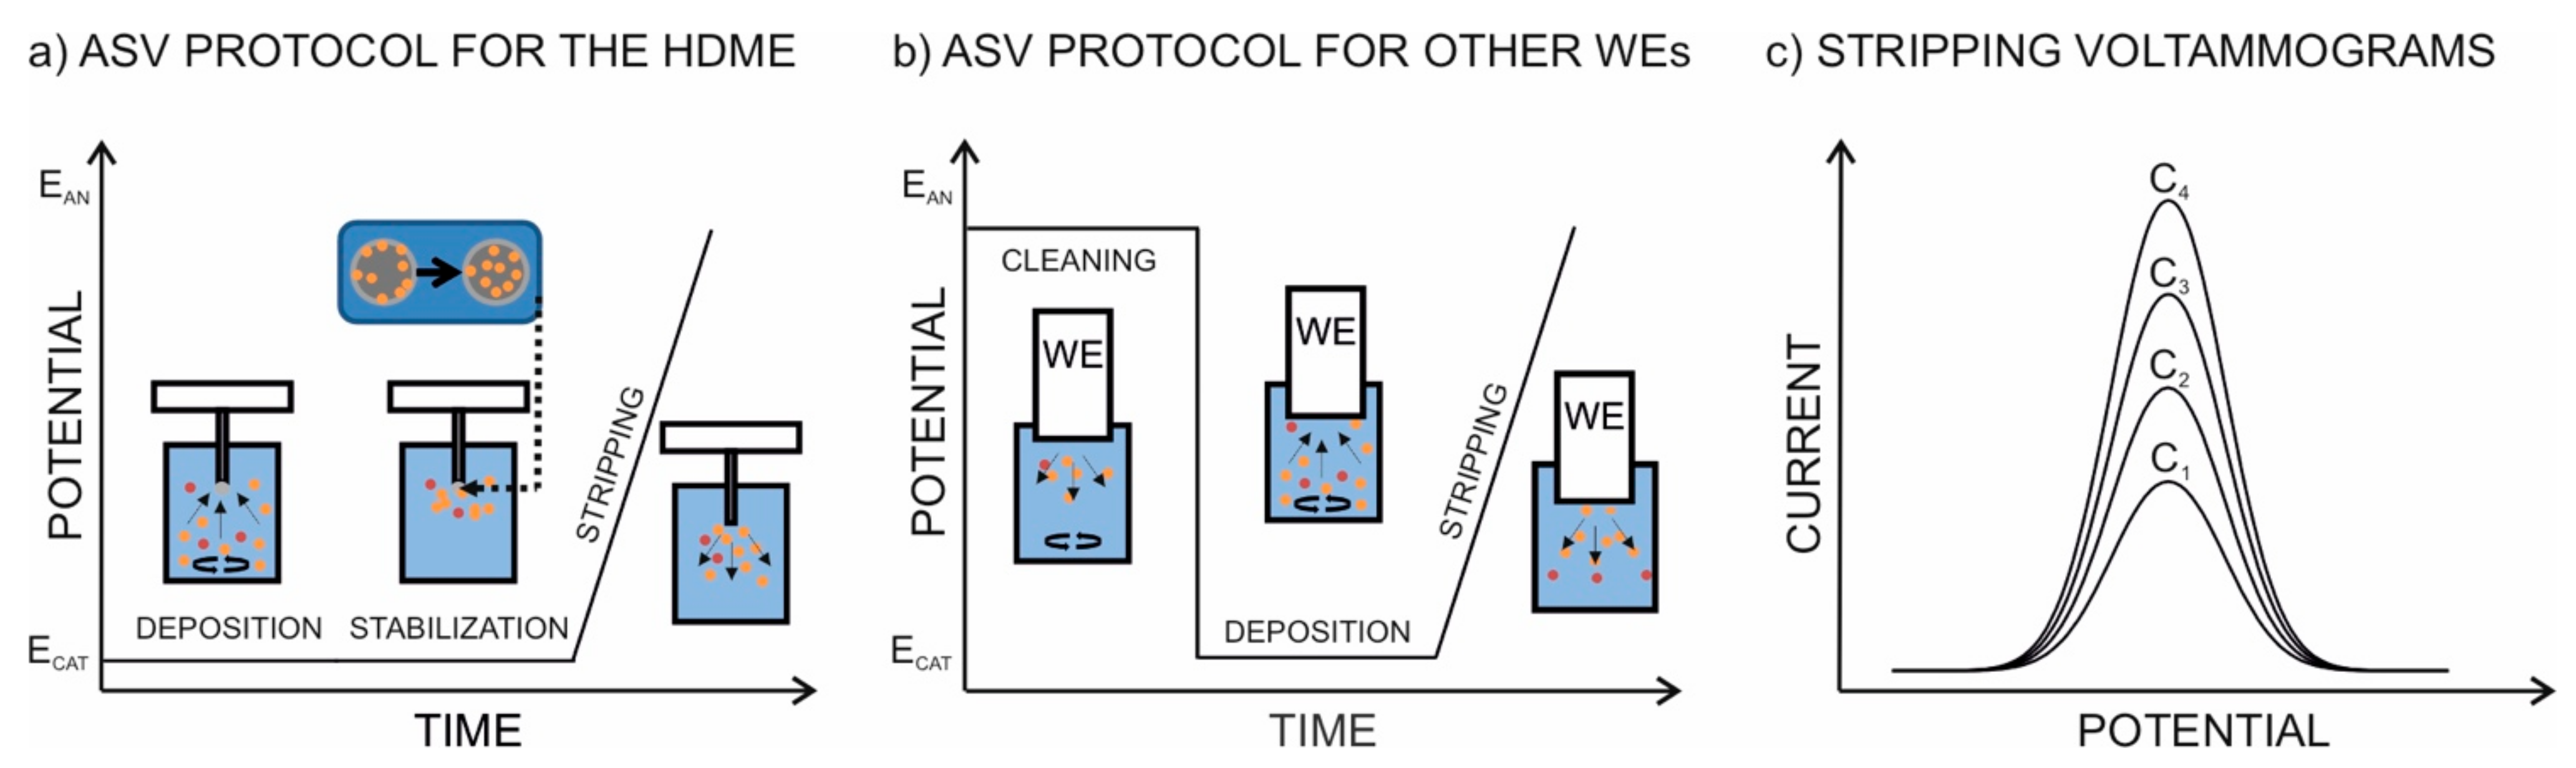
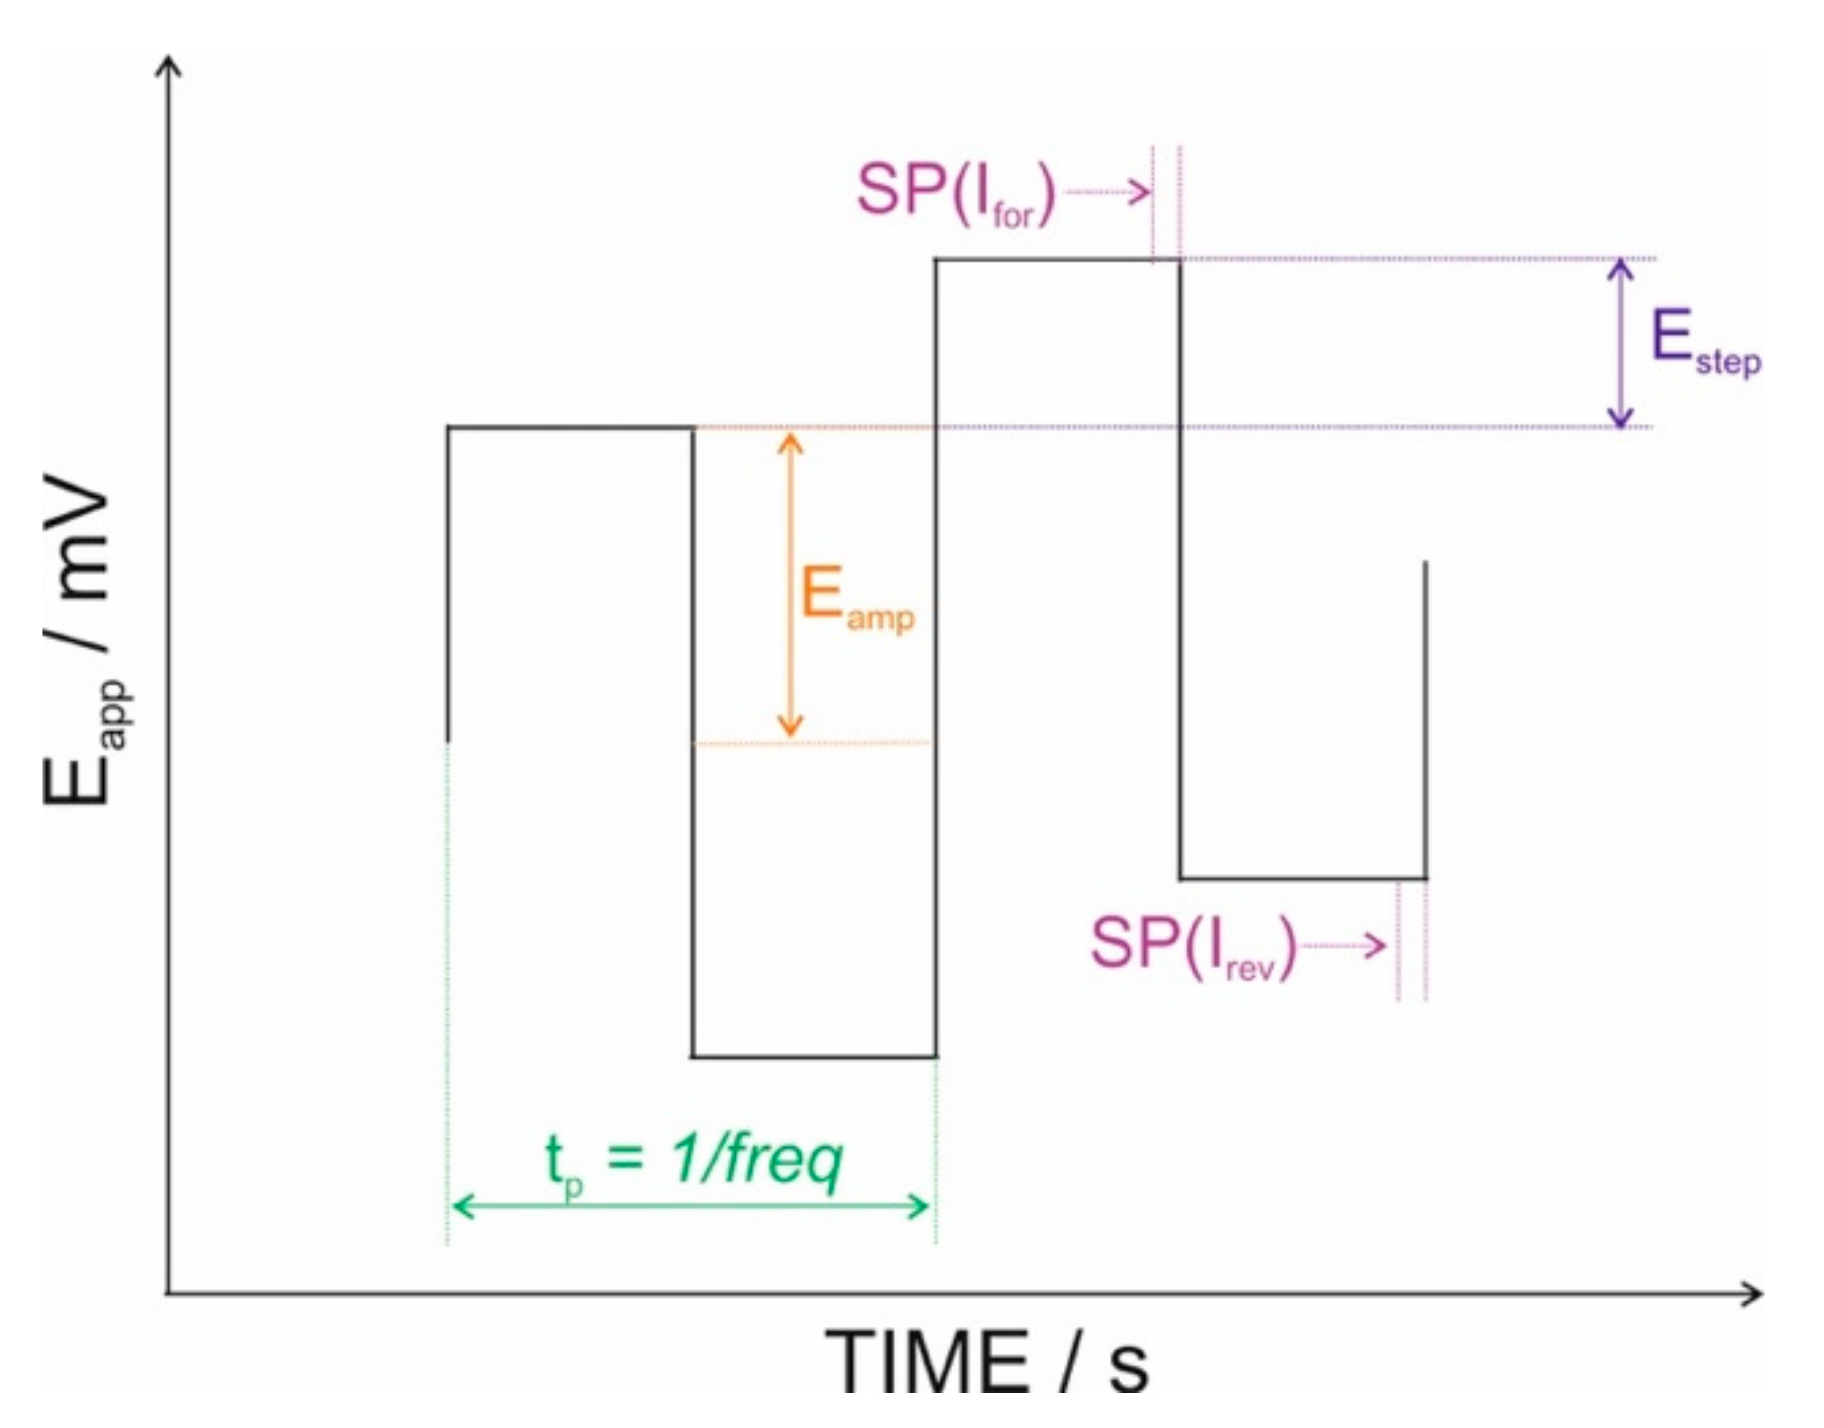
3.1. Fundaments of ASV Measurements

In classical ASV measurements performed with the HMDE, metal ions are first electrodeposited on the working electrode (i.e., the HMDE) during the so-called ‘deposition step.’ In this step, a cathodic potential is applied to the HMDE with the solution under stirring conditions to reduce metal ions to their elemental form and accumulate them onto the electrode surface (i.e., the mercury drop). Subsequently, the oxidation of the accumulated metals occurs upon sweeping the potential in the anodic direction, which results in metals being stripped from the electrode to the solution: the stripping step. These two steps (accumulation and posterior stripping) are traditionally separated by a stabilization period, in which the application of the cathodic potential is maintained but the solution is no longer stirred to allow the homogeneous distribution of the preconcentrated metal within the mercury drop [1]. The described protocol is illustrated in Figure 2a.
Slight variations of this experimental protocol are often implemented when working electrodes other than the HMDE are used. Firstly, the stabilization period (that is ca. 30 s in the HMDE) may be significantly shortened and even omitted with most other electrodes, as there is no longer requirement to obtain a uniform metal-mercury amalgam [1]. Then, contrary to the HMDE using a new mercury drop for each measurement, solid working electrodes are reutilized for several measurements. Therefore, it is necessary to ensure that no metals remain on the electrode surface prior to a new measurement, which is usually translated into the addition of an initial conditioning step (sometimes referred as ‘cleaning step’) maintaining the electrode at an anodic potential to remove any accumulated metal [11]. These variations in the ASV protocol are illustrated in Figure 2b. Interestingly, for many of the reported electrodes other than the HMDE, the interference of oxygen is not as dramatic as for the HMDE [14,15,16]. This avoids the need of solution deaeration, which clearly facilitates the implementation of ASV measurements to on-site analysis and also helps in the reduction of the total analysis time. Whatever the electrode used and the applied ASV protocol, the voltammogram must manifest well-defined stripping peaks that increase with increasing analyte concentration in the sample solution (Figure 2c).
Theoretical models defining the working mechanism of the HMDE are well-entrenched in the literature and allow for the prediction of the shape, position and height of the stripping voltammetric peaks [1,2]. Essentially, the concentration of the metal that is preconcentrated in the mercury drop ( c M * ) depends on the depositing current ( i d ), the deposition time ( t d ), and the radius of the mercury drop ( r 0 ) according to Equation (1):
c M * = i d t d n F 4 / 3 π r 0 3 ,
where n is the number of electrons involved in the metal reduction, and F is the Faraday constant [1]. In Equation (1), i d is calculated according to the Levich equation (Equation (2)) [2], with A representing the electrode surface in cm2, D M the diffusion coefficient of each metal in cm2 s−1, w the rate of electrode rotation or solution stirring in rad/s, ϑ the kinematic viscosity of the solution in cm2 s−1, and c t the concentration of each metal in the bulk solution at a time t in mol cm−3.
i d t = 0.62 n F A D M 2 3 w 1 2 ϑ 1 6 C t ,
Then, whether the scan rate ( v ) in the stripping step is high enough to ensure that the concentration in the middle of the mercury drop remains at c M * at the completion of the scan, the behaviour of the stripping current can be described as a semi-infinite diffusion process. Under such conditions, and considering the spherical shape of the mercury drop, the peak current ( i p ) of the resulting voltammogram is defined by Equation (3) [1,20],
i p = A D M 1 / 2 C M * 2.69 × 10 5 n 3 / 2 v 1 / 2 0.725 × 10 5 n D M 1 / 2 r 0 ,
where v is expressed in V s−1. At high scan rates (generally > 20 mV s−1), the second term in Equation (3) (corresponding to the spherical diffusion) can be omitted, resulting hence in a typical linear diffusion behaviour with i p proportional to v 1 / 2 . Interestingly, practical measurements are often carried out at >20 mV s−1, which greatly simplifies calculations and shorten the analysis time. Notably, Equation (3) may change depending on the type of scan employed in the stripping step. For example, in SWV, the peak current is defined by Equation (4):
i p = n   F   A   D M 1 2   c M *   π 1 2 t p 1 2   Δ Ψ p ,
where Δ Ψ p is the dimensionless peak current, a tabulated parameter that depends on n , the pulse amplitude and pulse step, and t p stands for the pulse width in seconds [1].
Importantly, i p is proportional to c M * and, therefore, it will depend on the applied deposition time and current (see Equation (1)). Furthermore, Equation (3) can be applied to each individual stripping peak when the HMDE measures solutions containing multiple ions. In this case, the different behaviors for the ions will be mainly ascribed to the different D M of each of them.
Theoretical models also allow for the prediction of peak width at any fraction of the peak total height ( w h ). For a reversible system, w h is calculated by means of Equation (5) [21]:
w h = R   T n   F   l n b + b 2 a b b 2 a ,
where ‘a’ and ‘b’ parameters are provided by Equations (6) and (7) respectively, and being h the height fraction of the peak, and E a m p l i t u d e the pulse amplitude.
a = 4 1 h 2 1 + e x p n   F   E a m p l i t u d e R T ,
b = 1 h 1 + e x p n   F   E a m p l i t u d e R T + 2 e x p n   F   E a m p l i t u d e 2 R T ,

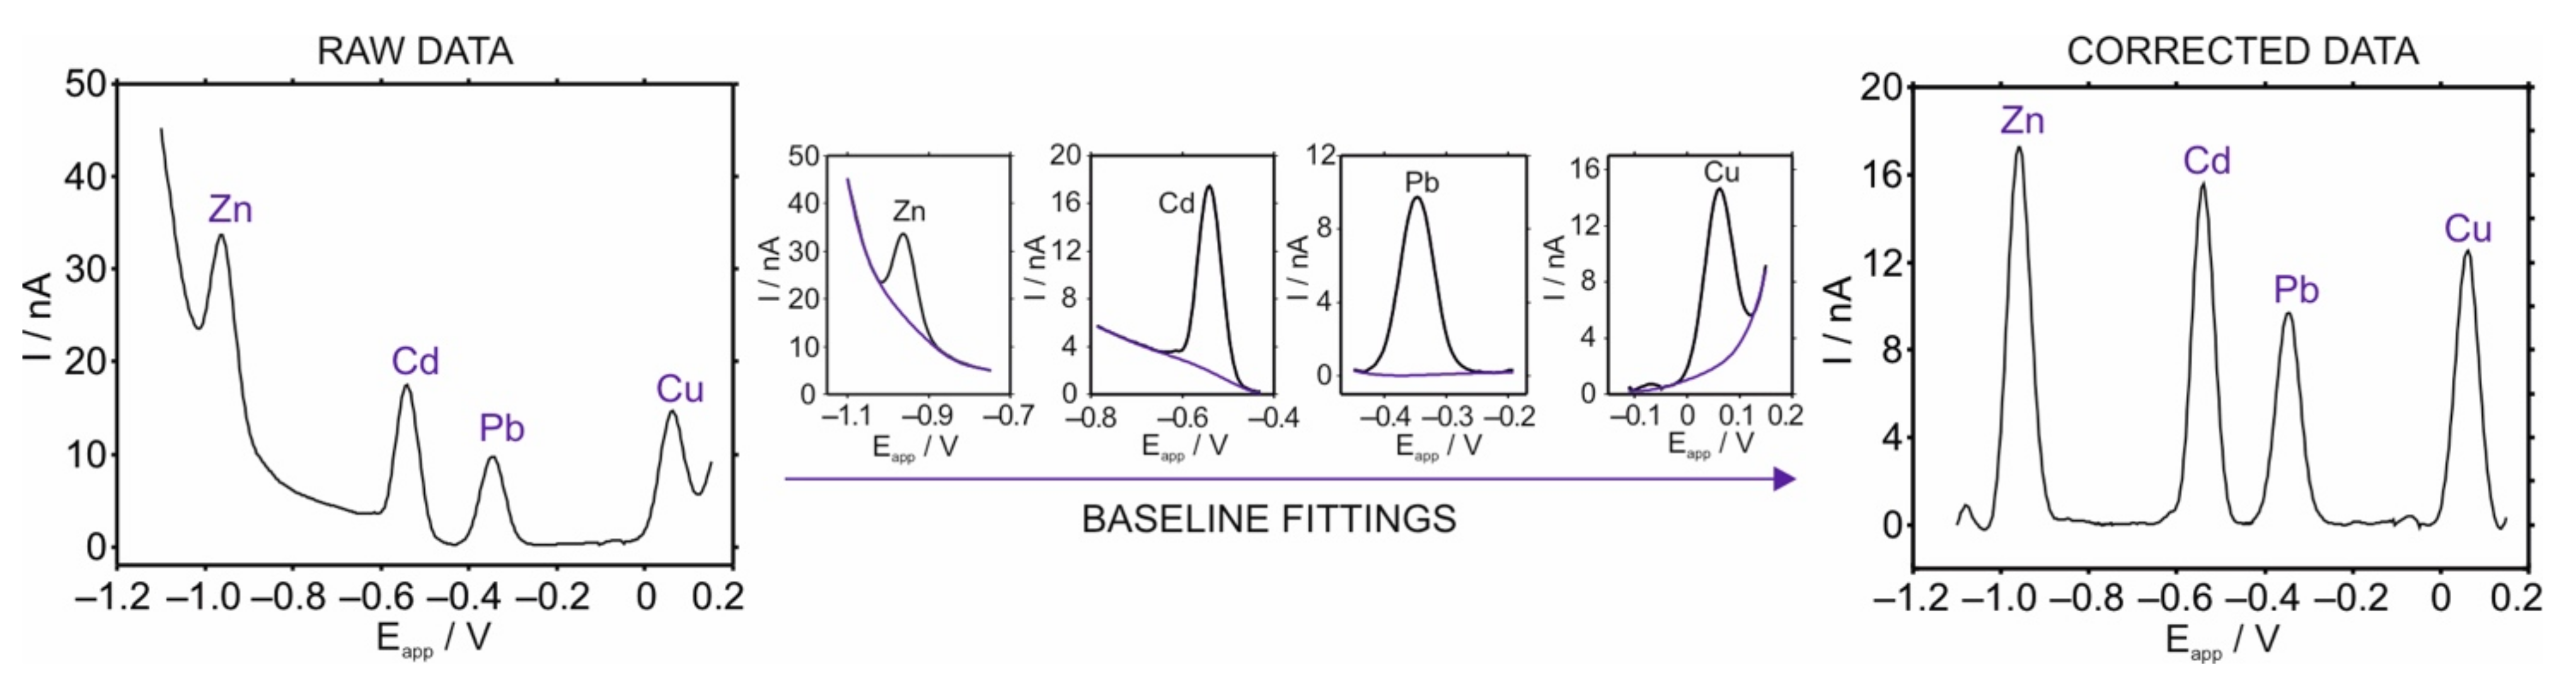
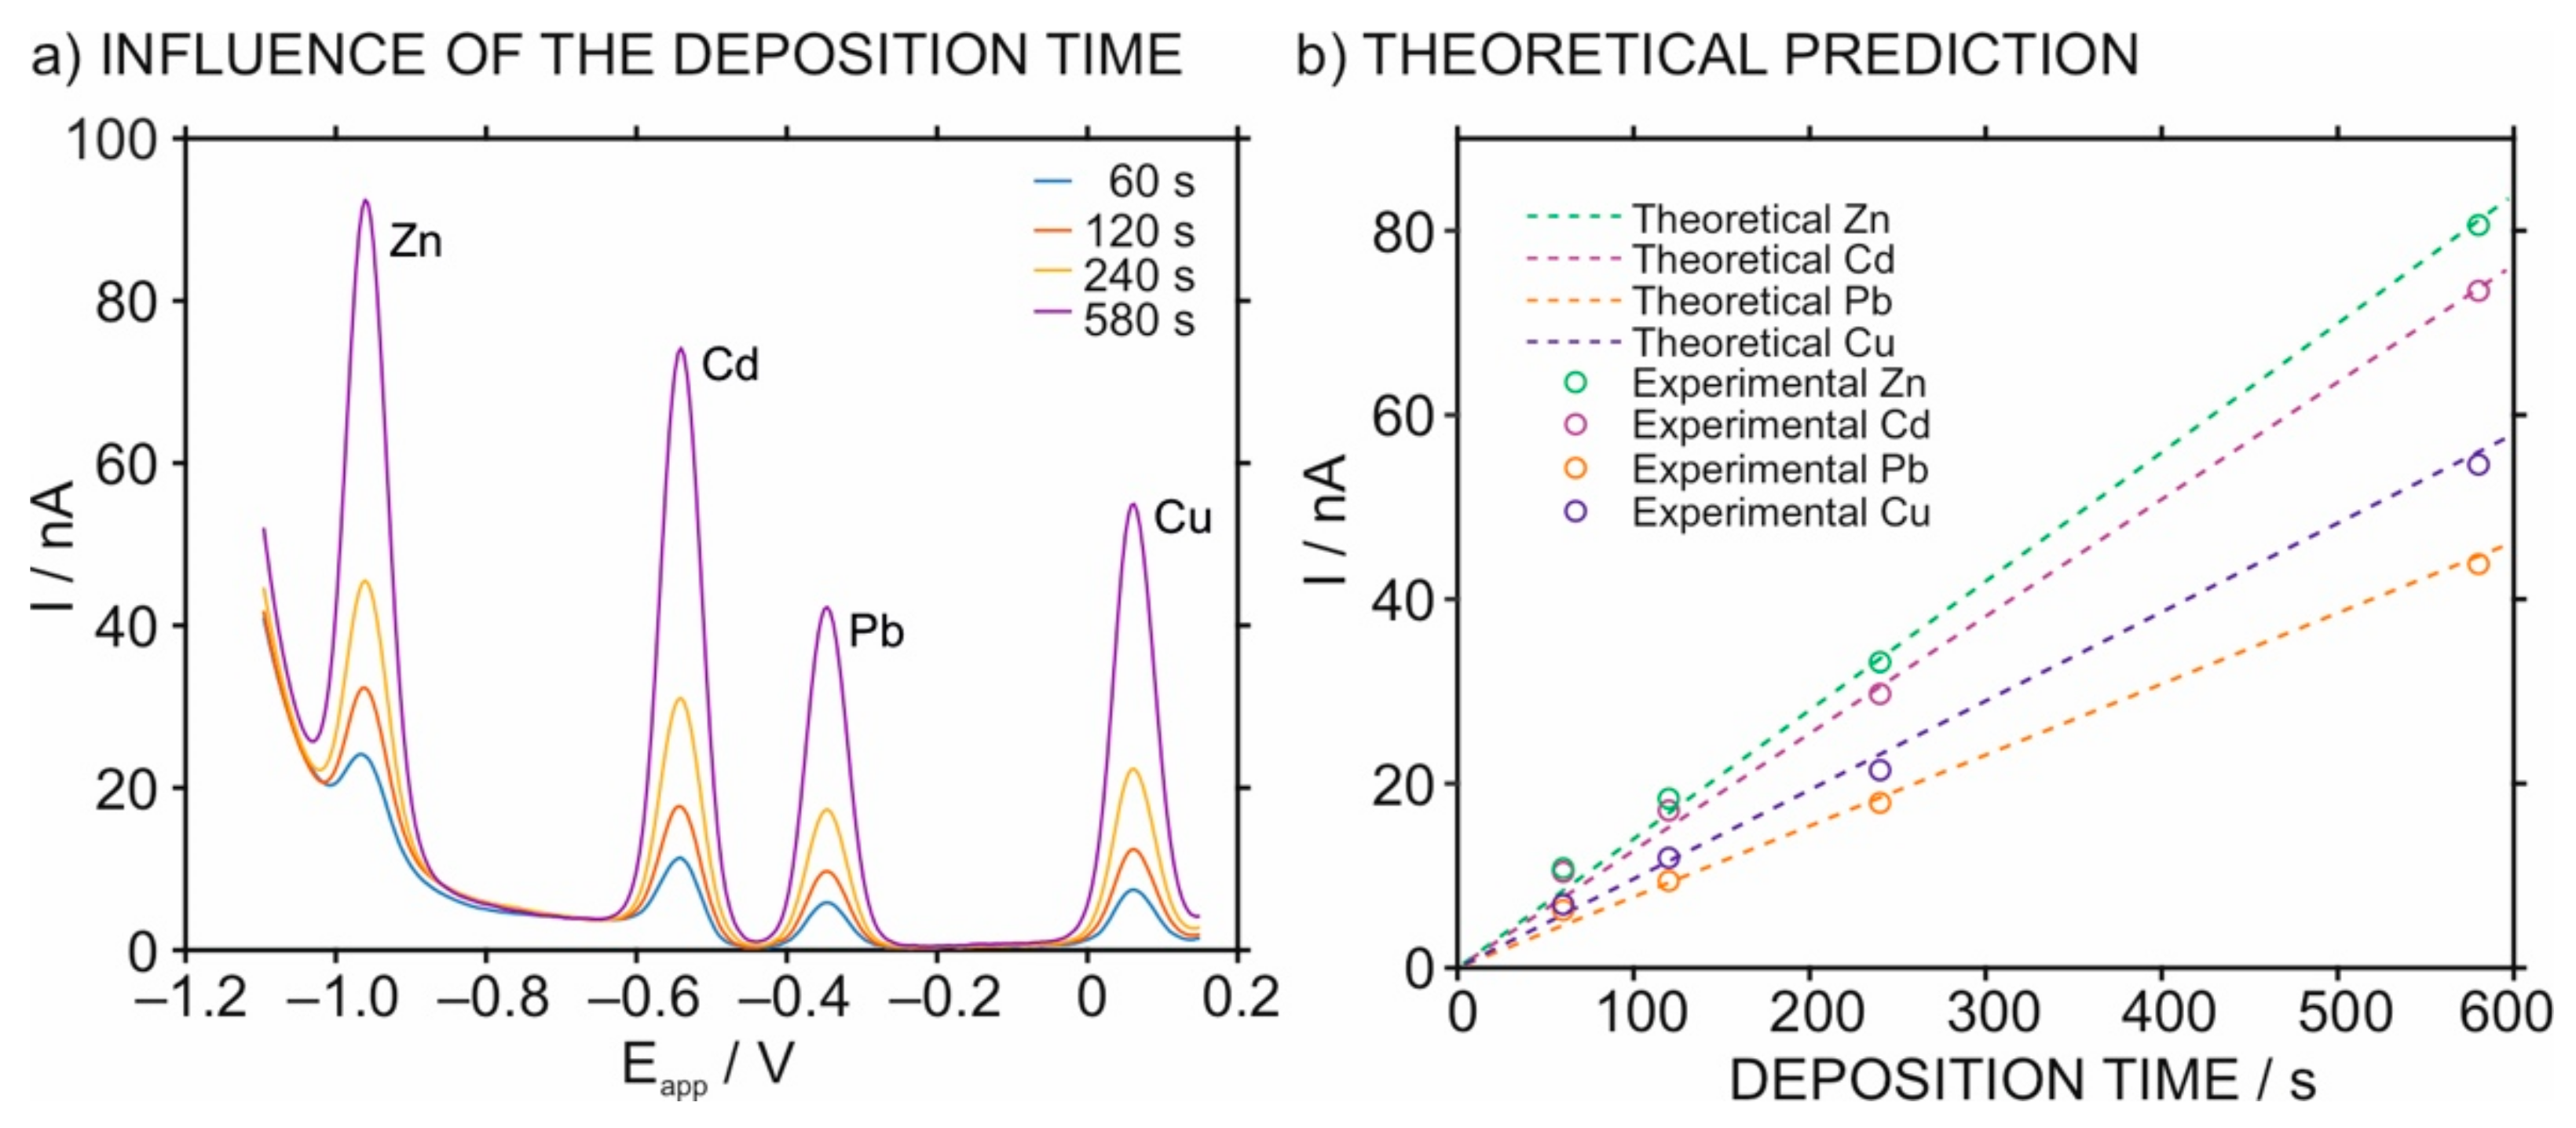
3.2. Optimization of the Stripping Peaks in the HMDE for Multi-Ion Detection

Figure 3a presents the stripping voltammograms obtained with the HMDE at increasing deposition times with a solution containing 50 nM concentration of Zn2+, Cd2+, Pb2+, and Cu2+ in 0.01 M NaNO3/HNO3 pH 2 and using the following ASV protocol: Ed = −1.1 V, td = 120 s, tr = 30 s, Ei = −1.1 V, and Ef = 0.15 V. Peak identification was confirmed with individual standard solutions of each metal ion: the peak for Zn2+ appears at ca. −0.96 V, Cd2+ at ca. −0.54 V, Pb2+ at ca. −0.35 V and Cu2+ at ca. +0.06 V. Then, the peak current increased with the deposition time and this increase can be predicted by means of Equation (4), as observed in Figure 3b. Theoretical calculations were carried out considering deposition times from 0 to 600 s and using the following parameters: r 0 = 0.006 cm; w = 300 rpm; n = 2; t p = 0.025 s; Δ Ψ p = 0.9245 (tabulated value for n = 2, E a m p = 25 mV, and E p u l s = 4 mV [1]); D M ,   Z n = 1.67 · 10−5 cm2 s−1; D M ,   C d = 1.53 · 10−5 cm2 s−1; D M ,   P b = 9.70 · 10−6 cm2 s−1; D M ,   C u = 1.19 · 10−5 cm2 s−1 [22]; c Z n = c C d = c P b = c C u = 50 nM. Notably, theoretical curves show a linear response between peak current and deposition time, which will only happen under ideal conditions, that is, no electrode saturation, no intermetallic formation (as above described).
The parameters selected for the equilibration and stripping steps also affect the obtained voltammograms and were hence optimized towards the simultaneous detection of Zn2+, Cd2+, Pb2+, and Cu2+ in complex soil samples. Figure 4 displays the multi-ion stripping voltammograms at varying equilibration time as well as frequency, pulse step and pulse amplitude in the SWV stripping step. Regarding the equilibration time in the resting step (Figure 4a), longer periods resulted in more intense peaks (inset of Figure 4a). However, to generate a significant increase in the peak current, it would be necessary to considerably increase the stabilization time at the cost of sacrificing the total analysis time. As a result, a time of 30 s was selected for further experiments to balance the observed peak currents with the analysis time.
Inspecting now the stripping step, the voltammetric response will depend on the selected type of scan, including linear sweep voltammetry (LSV), differential pulse voltammetry (DPV) or square wave voltammetry (SWV) as the main techniques to be selected. In particular, a pulse-based protocol is typically preferred over LSV in the ASV determination of metal ions because they provide an enhanced faradaic/non-faradaic current relationship, which results in lower LODs [23]. Then, there is no clear preference to select between DPV and SWV. In particular, potential-excitation signals based on the application of pulses are defined by certain parameters, including pulse amplitude, pulse potential step, and pulse time (DPV) or frequency (SWV) [23]. In SWV, which is the technique used in our studies, the pulse amplitude is defined as the height of the SW pulse in mV; the potential step is the staircase step size in mV; and the frequency accounts for the number of SW cycles performed at every second [23]. The scan rate is in turn defined by both the frequency and pulse potential, with faster scan rates (i.e., larger pulse potential and frequency) expected to result in more intense peaks until a maximal peak intensity is reached, as in any voltammetric technique [23]. The definition of all these parameters is illustrated in Figure 5.
Accordingly, the influence of these parameters in the stripping voltammogram for Zn2+, Cd2+, Pb2+, and Cu2+ were investigated (Figure 4b–d). The effect of the frequency in the peak current was found to be much larger than that observed for the potential step applied in the pulse. Indeed, it is very common to find in the literature a really wide range of frequencies suitable for the HMDE: from 1 to 125 Hz [23]. A frequency of 40 Hz and a potential step of 4 mV were selected for further experiments aiming at optimized peak currents. It should be noted that, although higher frequencies provided larger current peaks, increasing the frequency will also result in poorer signal-to-noise ratios [24].
Of particular interest is the effect of the pulse amplitude. This parameter was found to have a large influence on the peak shape and resolution, with higher amplitudes resulting in wider and poorly defined voltammetric peaks (Figure 4d). This is a result of the net signal in SWV being calculated by subtracting the forward and backward currents of a single potential pulse. This subtraction is commonly done considering the plotted potential (i.e., the one corresponding to the staircase ramp) instead of the actual potential. At larger pulse amplitudes, the difference between these two potentials becomes significant, therefore affecting the shape of the voltammetric peak [25]. As a result, a potential amplitude of 25 mV was selected for further studies to provide well-resolved and separate peaks for Zn2+, Cd2+, Pb2+, and Cu2+ in the same scan.

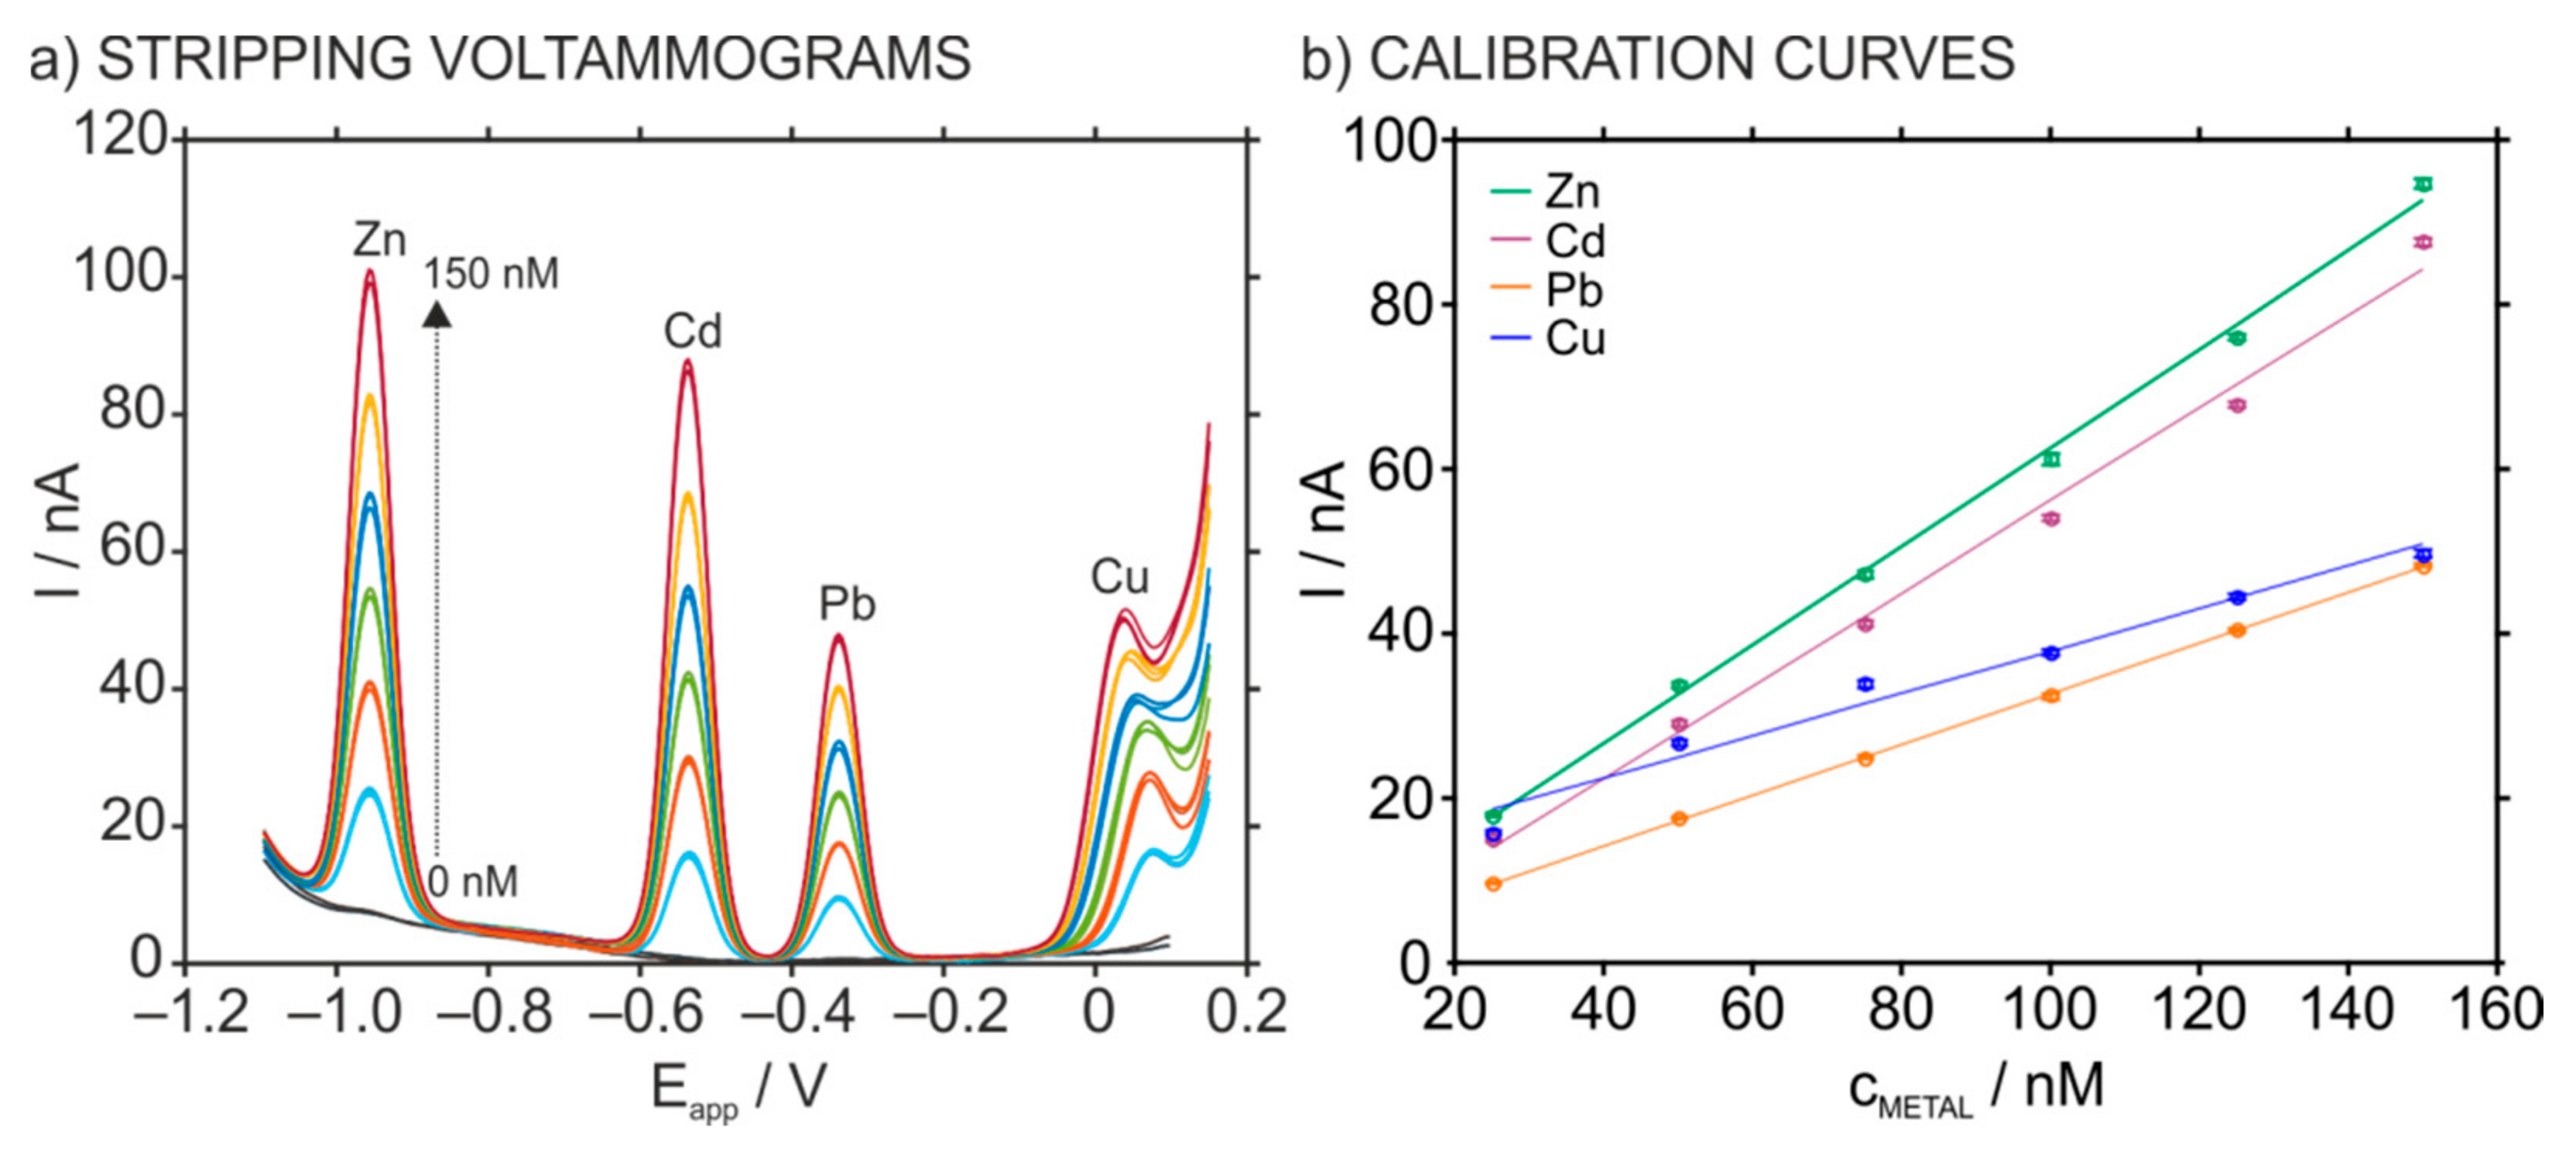
3.3. The Analytical Characteristics of the HMDE for Multi-Ion Analysis

According to all the results based on the variation of the parameters affecting the stripping peaks, the final protocol for the ASV measurements of Zn2+, Cd2+, Pb2+ and Cu2+ was selected to be: Ed = −1.1 V, td = 120 s, tr = 30 s, Ei = −1.1 V, Ef = 0.15 V, freq = 40 Hz, Eamp = 25 mV and Epuls = 4 mV. Figure 6a depicts triplicate stripping voltammetric peaks at increasing concentrations of Zn2+, Cd2+, Pb2+ and Cu2+ from 0 to 150 nM. Figure 6b shows the corresponding calibration graphs for each metal with the following linear fittings (Equations (8)–(11)), with ‘I ‘expressed in nA and ‘cMETAL’ in nM:
IZn = 0.601 cZn + 2.668; R2 = 0.997,
ICd = 0.565 cCd − 0.159; R2 = 0.993,
IPb = 0.308 cPb + 2.022; R2 = 0.999,
ICu = 0.259 cCu + 12.16; R2 = 0.974,
These calibration graphs are the basis for the following discussion about the analytical performance of the HMDE in the optimized conditions for multi-metal analysis in comparison with other electrodes reported in the literature.
The first feature that should be highlighted is the wide potential window of the HMDE, which is limited by the hydrogen evolution and the oxidation of mercury at the cathodic and anodic ends, respectively [23]. Advantageously, this window allows the measurement of metal ions with very despair redox potentials, as is the case of Zn2+ and Cu2+ presenting −0.763 V and +0.345 V for Zn2+/Zn(Hg) and Cu2+/Cu(Hg), respectively [26]. However, metal ions that present a more positive redox potential (e.g., Ag+, Hg2+) cannot be determined with the HMDE because their signal overlaps with the oxidation of mercury. In addition, other metal ions are not able to form stable amalgams with mercury in their elemental states (e.g., Ni2+, Co2+, Cr4+), which hinders their determination by ASV with the HMDE. In these cases, adsorptive stripping voltammetry has been positioned in the past years as the alternative solution [23].
Importantly, the vast majority of electrodes proposed in the literature as alternatives for the HMDE fail to determine either Zn2+ or Cu2+. For example, substrates based on noble metals (such as platinum and silver) have a limited cathodic potential window due to H2 formation at low potentials, which hinders the determination of Zn2+ [23]. On the other hand, metal film-based electrodes constituted of less toxic metals (such as Bi or Sb) usually present a narrower anodic window, limited by the oxidation of the metal film per se, and this prevents the determination of Cu2+ [14,15]. A solution for this latter limitation is to deposit the metal film in-situ, which means that the metal film is electrodeposited at the same time than the target metal ion [14,15]. For example, Sosa et al. reported an in-situ antimony film deposited on a carbon screen-printed electrode for the simultaneous determination of Cd2+, Pb2+ and Cu2+ that provided a well-defined voltammetric peak for Cu2+ at Ed = −1.2 V, td = 120 s, and pH 4.5 [27].
Another aspect that should be commented for multi-metal determination is the peak resolution, which is influenced by the position and shape of consecutive peaks: that is, the standard redox potential of the metal together with the width and symmetry of the voltammetric peak. As observed in Figure 6a, the simultaneous ASV determination of Zn2+, Cd2+, Pb2+ and Cu2+ using the HMDE results in four well-resolved voltammetric peaks at ca. −0.96, −0.54, −0.35 and +0.06 V respectively. Importantly, Zn2+, Cd2+, and Pb2+ present a Gaussian shape at a very stable potential that remains unchanged with increasing concentrations. Furthermore, the widths at the half peak height were of 65.9, 60.6, 62.6 and 57.3 mV for 25 nM Zn2+, Cd2+, Pb2+ and Cu2+ respectively, and 63.9, 62.8, 63.4 and 71.3 mV for 150 nM Zn2+, Cd2+, Pb2+ and Cu2+. Considering that for all the considered metal ions n is equal to 2 and considering Equations (5)–(7) at 20 °C (room temperature), the expected width at half peak (with h = 0.5) is calculated to be 64.3 mV, which is in agreement with the experimental values observed for Zn2+, Cd2+, and Pb2+. In the case of Cu2+, peak broadening at higher concentrations together with a potential shift from 74 mV (25 nM) to 35 mV (150 nM) likely manifests that this is a non-reversible system, most likely due to the formation of intermetallic compounds, as above-mentioned.
Table 1 summarizes the peak positions and shapes reported for other electrodes rather than the HMDE reported in the literature for the simultaneous ASV determination of the four metal ions together with Hg2+. Evidently, the main advantage of avoiding the use of mercury in the electrode relates to ‘greener approaches’ but also the possibility of analysing Hg2+, which is not feasible with the HMDE. Then, in the vast majority of the works, the determination of Zn2+ was not reported, which manifests the difficulty of obtaining the same (and wide) cathodic window offered by the HMDE. In addition, peak-shoulders and/or double peaks are common in many of the inspected works, which particularly affects to Pb2+. This fact has been attributed to the formation of intermetallic compounds, which are frequent in the presence of Cu2+ (e.g., Pb-Cu [28,29] and Cu-Hg [30]). Indeed, this effect has been also observed for other tandems, such as Cd-Hg [29]. Moreover, the formation of intermetallic compounds also influences electrode sensitivity [28,29]. Other aspect is that, in contrast to the HMDE, many of the reported electrodes presented a shift of the peak potential as the metal ion concentration was increased, which has been associated to the type of metal-surface interaction during the deposition step. For example, for chemically modified electrodes in which metal ion determination is based on the formation of labile metal complexes during the accumulation step, a progressive shift of the peak potential was displayed as the bound metal fraction increased [31].
As shown in Figure 6, the HMDE presents and excellent reproducibility, in principle inferred by the use of a new mercury drop for each voltammetric scan. Indeed, the reproducibility calculated for three consecutive measurements performed with the HMDE in a solution containing 25 nM Zn2+, Cd2+, Pb2+ and Cu2+ was in the range of 2.3–2.5% for all metal ions. Then, the variation coefficients for the slope of the calibration graphs were as low as 0.93% for Zn2+, 0.91% for Cd2+, 0.94% for Pb2+, and 3.34% for Cu2+. In contrast, other electrodes are very often reutilized for several measurements and, therefore, two sorts of reproducibility studies are found in the literature: (i) consecutive measurements using the same electrode (also called as repeatability); and (ii) measurements using twin electrodes (commonly referred as reproducibility). As a general trend, measurements using different twin electrodes larger differ from each other in comparison to consecutive measurements: that is, better repeatability than reproducibility (Table S1 in the Supporting Information). Notably, it is difficult to compare studies from different papers, since the related calculations are accomplished using differently planned experiments. Importantly, good results in repeatability and reproducibility studies are connected to the implementation of an initial conditioning (or cleaning) step to remove metals accumulated on the electrode surface, as illustrated in Figure 2b.
Another remarkable feature of the HMDE is the wide linear range of response (LRR) for the determination of each metal ion, from 25 to 150 nM in our case. This is important because it allows the determination of separate samples that present different metal concentrations and, more importantly, samples that present several metal ions in different concentration levels. The latter situation is not uncommon, because Zn2+ and Cu2+ are essential metal ions found at much higher levels than toxic metal ions such as Pb2+ and Cd2+ [10]. In the case of electrodes with a narrow LRR, the simultaneous determination of multiple ions is only possible by analysing each sample more than once, that is, using different dilution protocols, which obviously increases the required analysis time.
As collected in Table 1, the LRRs reported in the literature for electrodes other than the HMDE are very disparate, with some few electrodes being able to measure in the nanomolar range (for example from 5 to 100 nM [34,36]) and the large majority being in the micromolar levels [29,33,41,43]. Notably, it is a common practice that LRR values are usually reported in the determination of trace metal ions and somehow hindering that these are a result of optimized conditions for each individual metal determination. Very promising results were reported by Zhou et al., displaying LLRs in the ranges of 4.45–177.94 nM for Cd2+, 0.24–96.60 nM for Pb2+, 0.79–314.96 nM for Cu2+, and 2.49–99.70 nM for Hg2+, but unfortunately lacking the possibility for Zn2+ measurements [36]. The electrode was based on a glassy carbon electrode modified with N,N-dimethyl-N-2-propenyl-2-propen-1-aminium chloride homopolymer ionic liquid doped into magnesium(II)-aluminium(III) layered double and thus, the accumulation step relies on the formation of complex in the electrode surface. Overall, whether a different strategy rather than the direct electroreduction of the metal ion in the electrode surface is selected as part of the accumulation protocol, this originates in the deterioration of the LRR (and hence the LOD, see below) of the technique.
Finally, the LOD is another important analytical parameter in the determination of trace metal ions. In the literature, there is not a consensus on how to calculate the LOD in ASV. Some authors establish the LOD from three times the standard deviation of a blank signal (i.e., no analyte) [28,34,38]. Other authors defined the LOD as the concentration that provides a current equal to three times the signal-to-noise ratio (S/N) [35,37,43]. Other approaches utilize the standard deviation of the intercept over the slope of the calibration curve [45]. No matter the calculation method employed, this should always be clarified, and LOD values should be experimentally confirmed. In the case of the HDME, LOD values calculated as the standard deviation of the intercept over the slope of the calibration curve were 4.2, 6.2, 2.2, and 12.0 nM for Zn2+, Cd2+, Pb2+ and Cu2+, respectively. These LODs may be improved by using longer deposition or equilibration times if needed, although this would result in significantly longer analysis time. Other electrodes reported in the literature usually provide LODs in the level of nanomolar (see Table S1 in the Supporting Information). A few authors claim to reach picomolar levels [34,38], but these LODs were not demonstrated experimentally. All in all, the HMDE is the best working electrode reported for the time being to compete with the prestation of ICP measurements in terms of the LOD, that is, in the (sub)nanomolar levels.

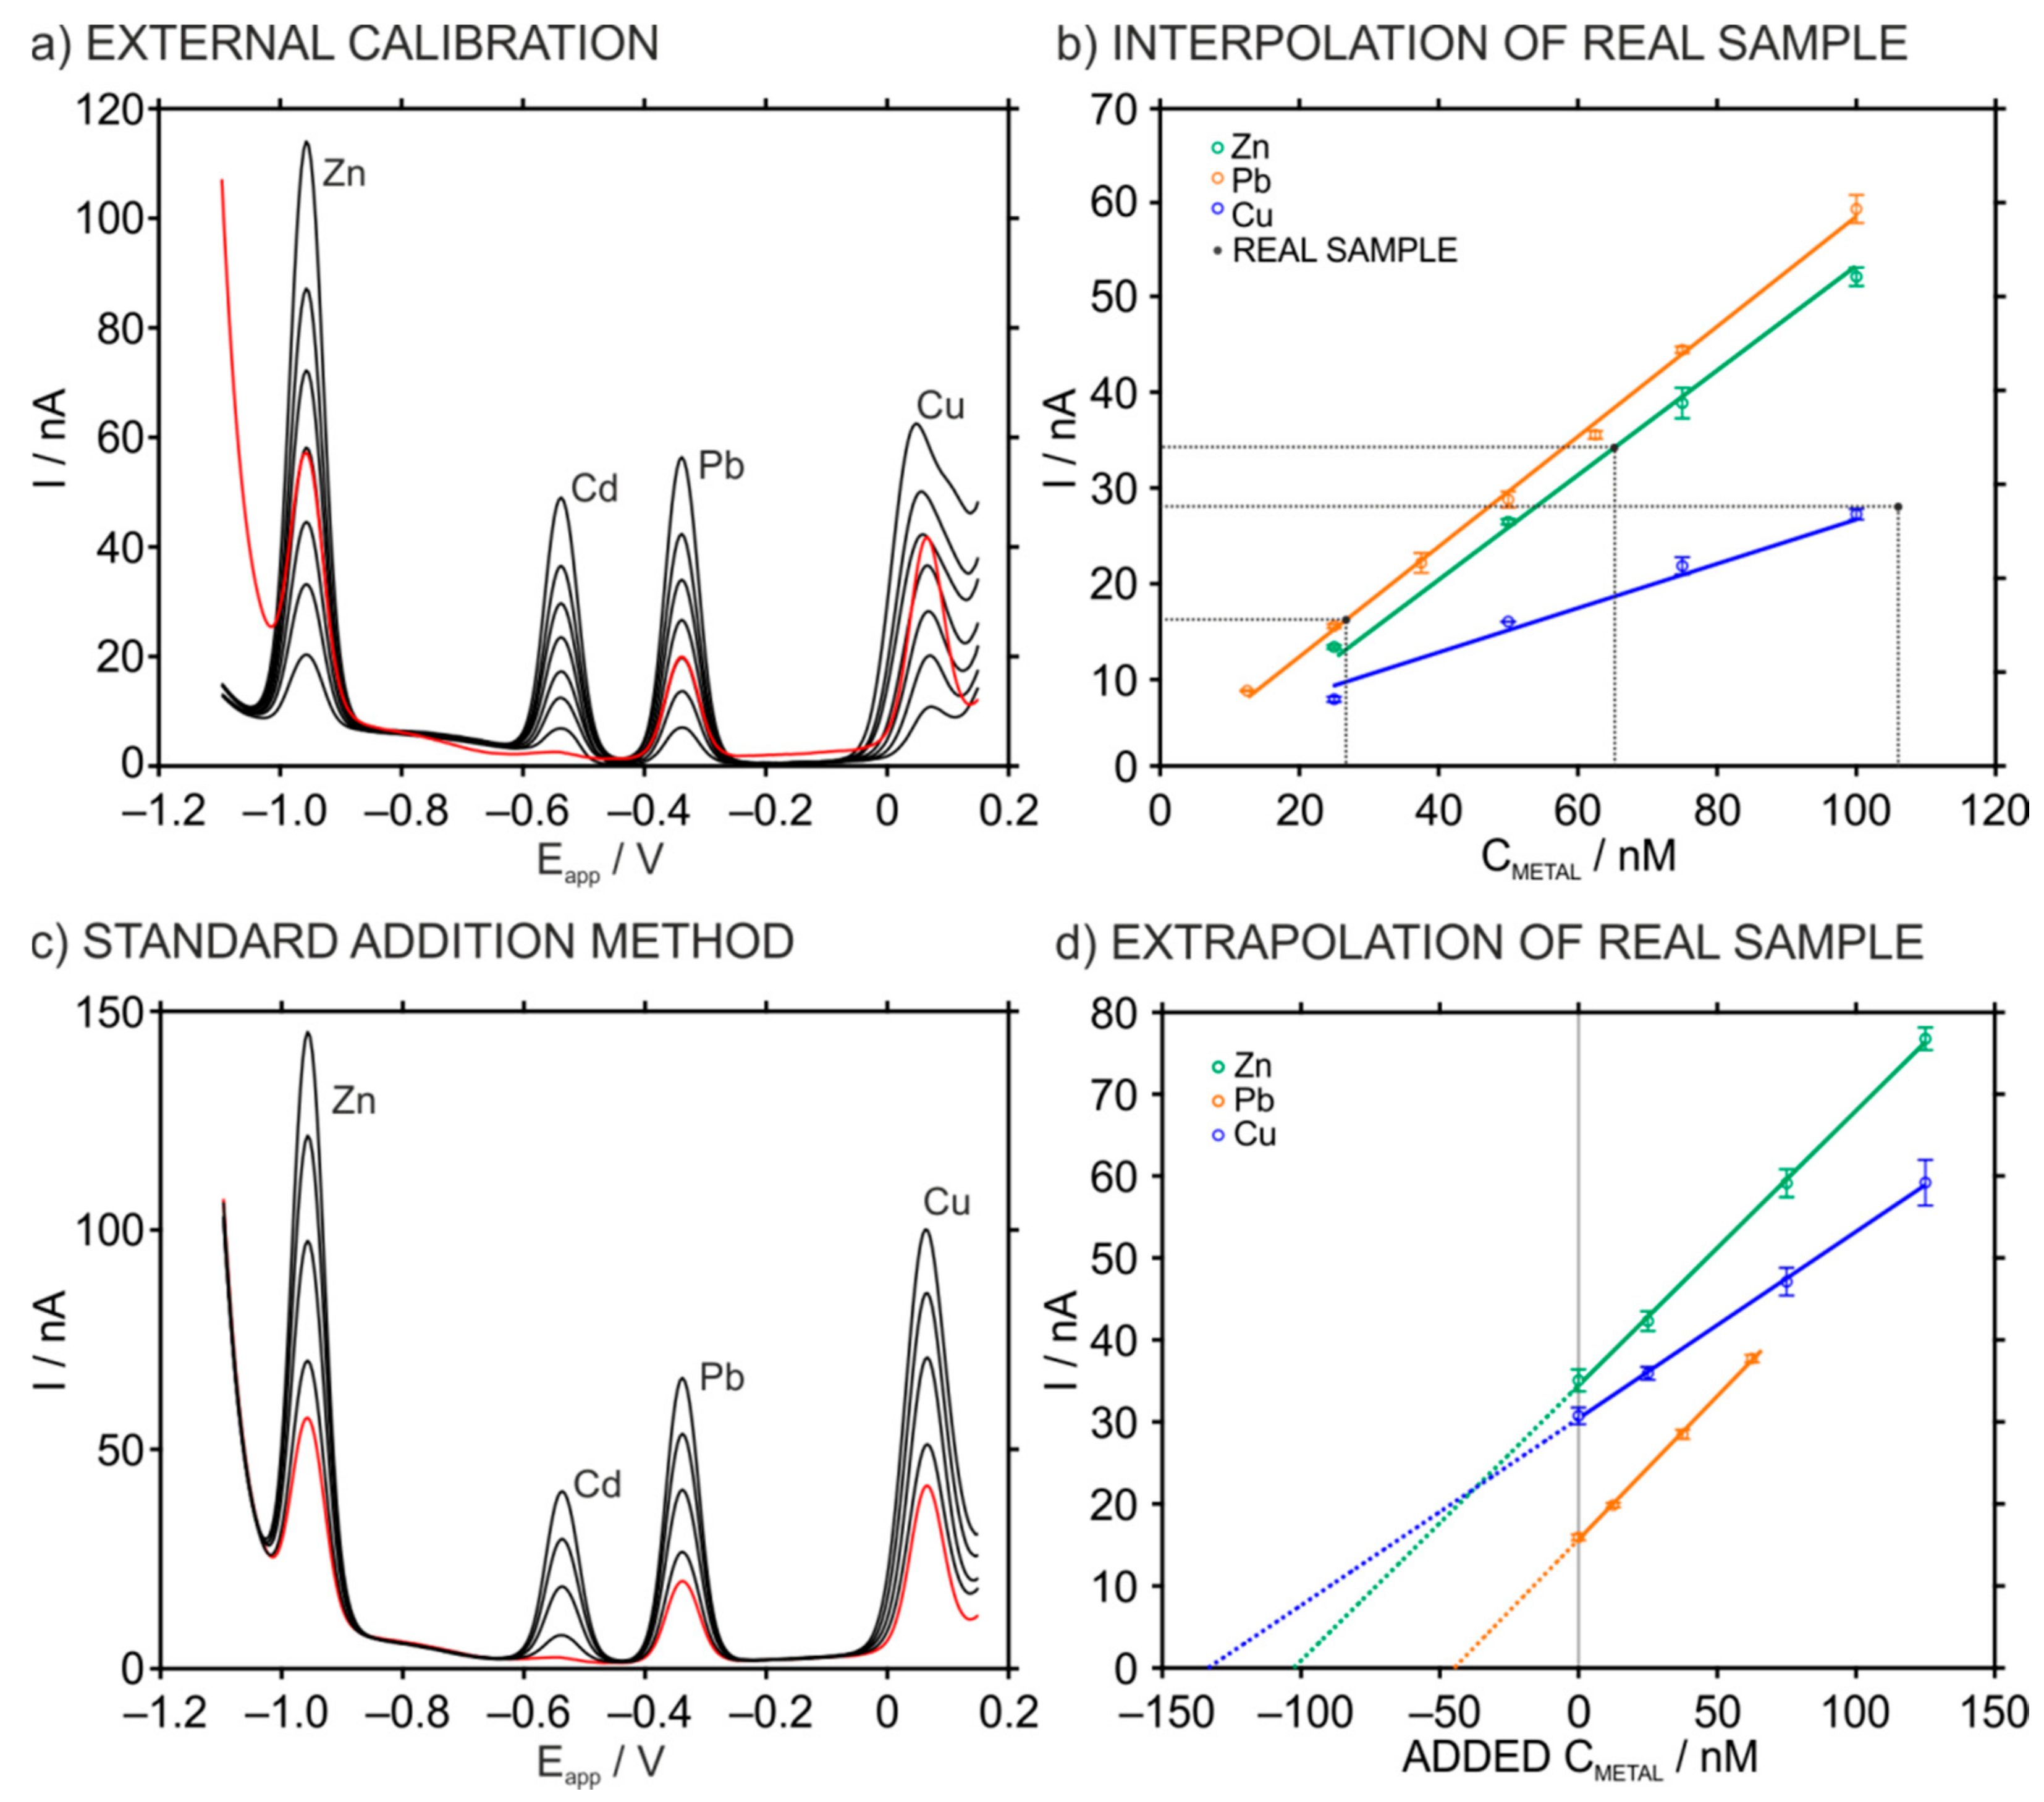
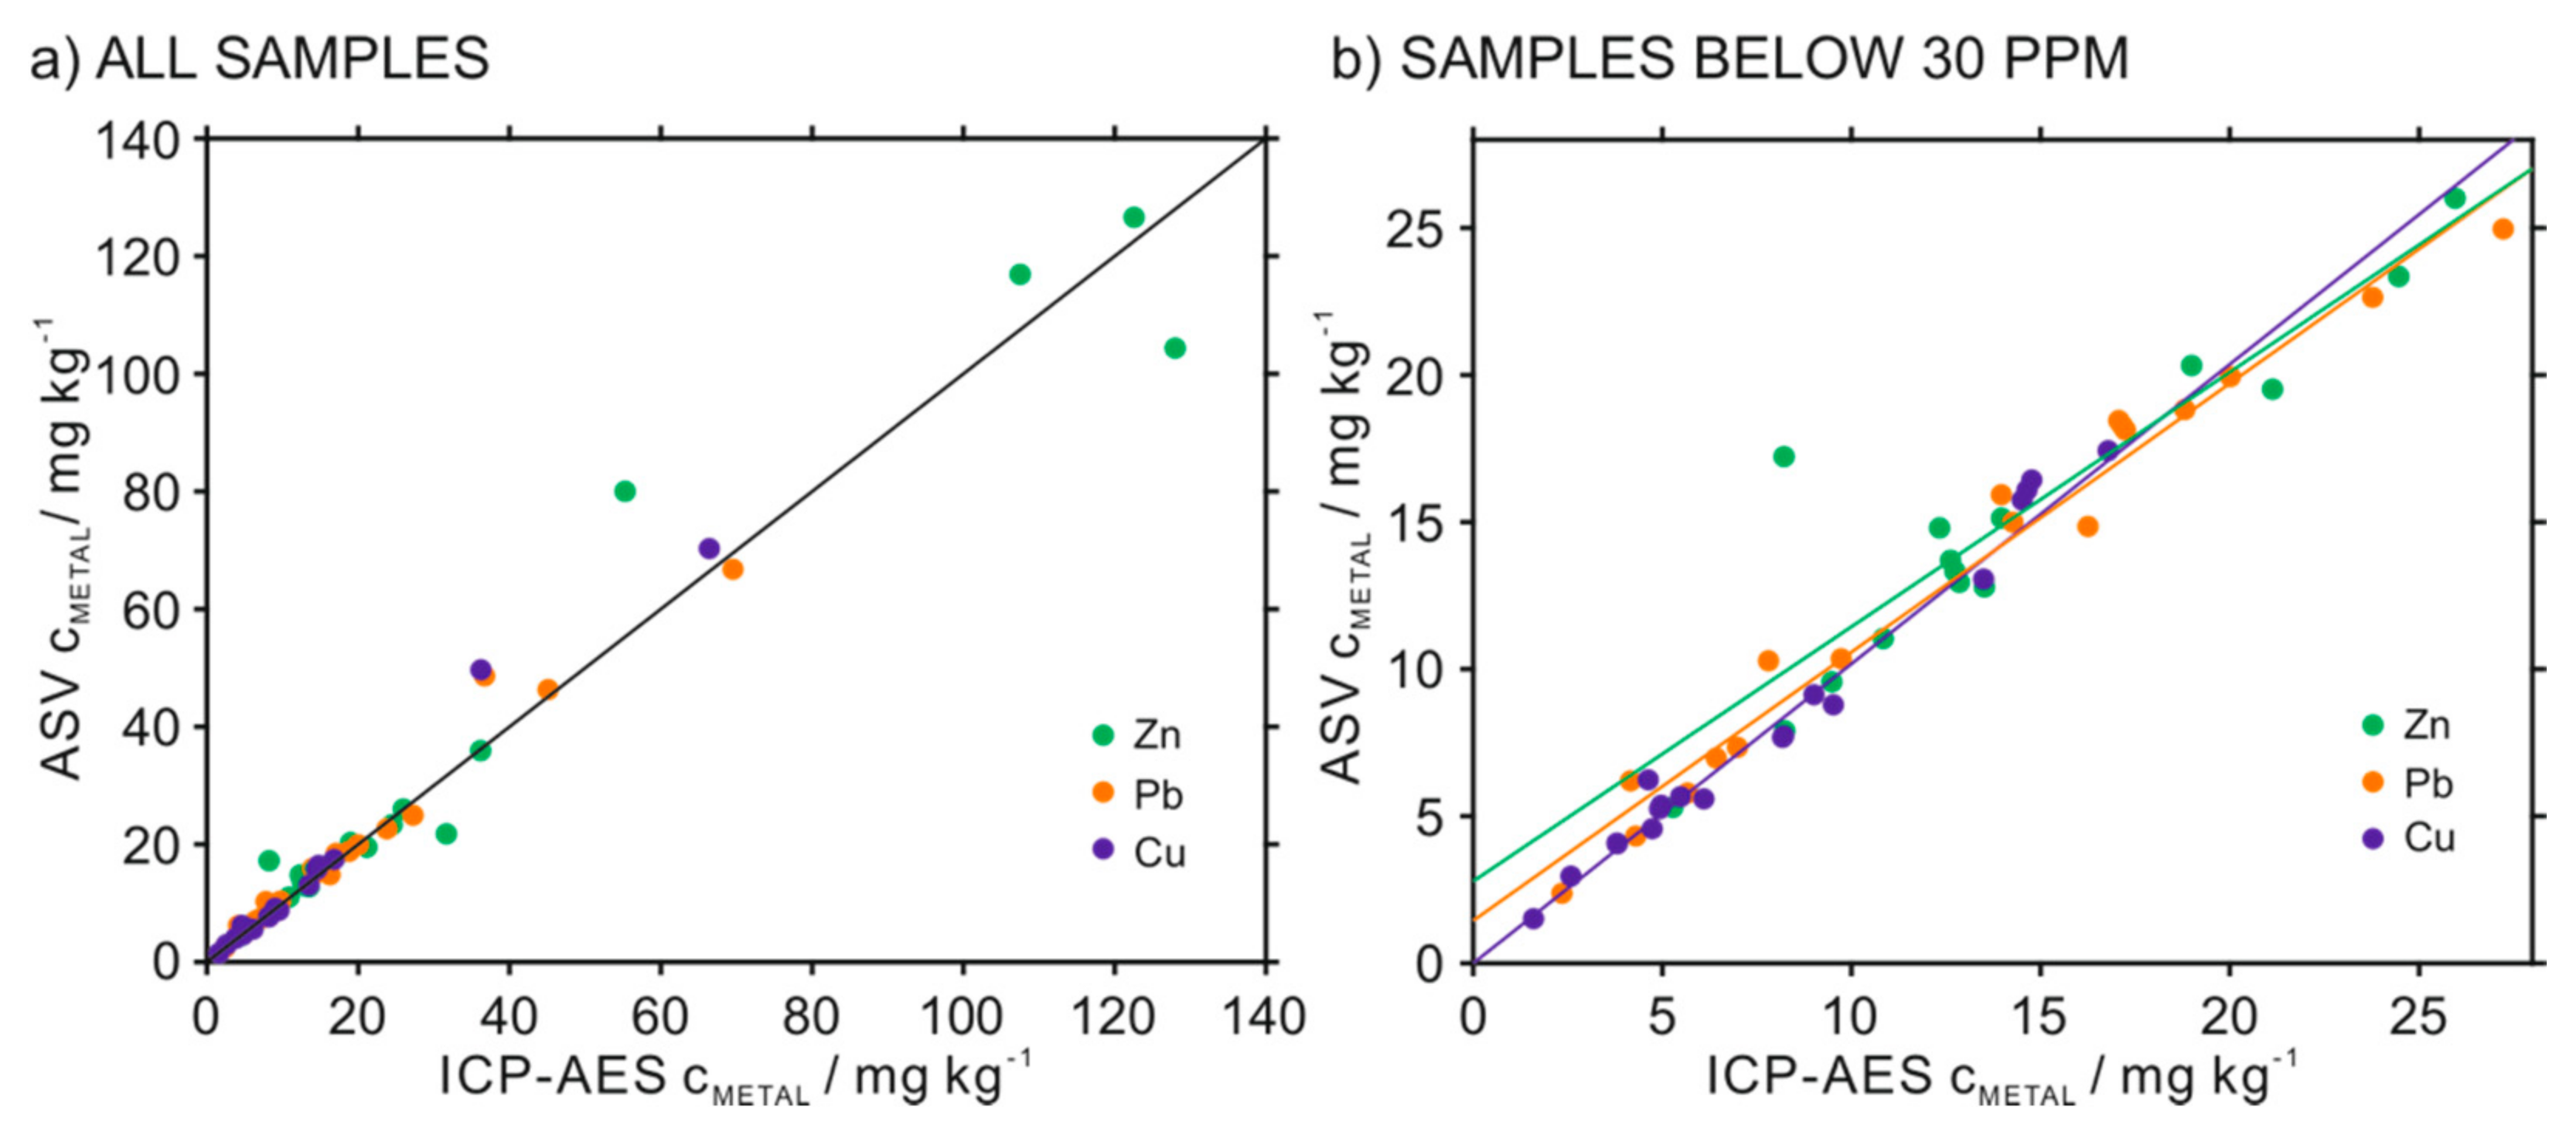
3.4. Simultaneous Determination of Zn2+, Cd2+, Pb2+ and Cu2+ in Soil Samples Using the HMDE

A total of 19 soil samples were analysed by the HMDE and the results were compared with ICP-AES as the reference analytical technique. Regarding the HMDE, one of the samples was analysed by using two different calibration methods: external calibration (Figure 7a,b) and the standard addition method (Figure 7c,d). In principle, and when possible, the external calibration is more convenient because it allows a higher sample throughput [23]. However, if there is any matrix effect when analysing the samples, the standard addition method is more convenient [23].
In both cases, well-defined voltammetric peaks that increase linearly with metal concentrations were obtained. Notably, the concentration of Cd2+ in the analysed samples was lower than the LOQ in the HMDE, even though a small peak was clearly visualized. Table 2 collects the results for the concentrations of Zn2+, Pb2+ and Cu2+ obtained with the two calibration methods and also those obtained in ICP-AES and expressed in ppm as mg of metal per kg of soil (mg·kg−1). As observed, an average difference of 26.1% was shown between the results calculated using the external calibration and those via the standard addition method.
Only in the case of Cu2+, the result provided by the external calibration is closer to the value observed in the ICP-AES compared to the standard addition method (3.4% versus 10.3% respectively). However, it should be noted that the result obtained using the external calibration method cannot be considered correct because the peak shape in the voltammogram differs significantly from that observed in the calibration samples and the calculated value is outside the calibration curve. This is likely attributed to a matrix effect in the sample. Larger differences were found for Zn2+ and Pb2+ (ca. 33.8% and 38.3%) for the external calibration than for the standard addition method (4.7% and 6.4%). With the standard addition method revealing more accurate results, the rest of the samples were analysed by this one rather than using the external calibration. Because of the complexity of the analysed samples, even being diluted, it is logical to employ the standard addition method to compensate any possible matrix effect.
Concerning the concentrations found in the samples, wide ranges for each metal ion were found, with the Zn2+ concentration ranging from 3.32 to 125.42 ppm, Pb2+ concentration from 4.00 to 54.39 ppm and Cu2+ concentration from 2.38 to 46.54 ppm. Then, the Cd2+ contain was found to be outside the quantifiable range with the HDME in all the samples.
Figure 8a displays the correlation found between ASV and ICP-AES measurements. 45 out of 57 measurements (i.e., 78.9% of the total data matrix) presented an adequate correlation between both analytical techniques (i.e., a difference lower than 10% between the values provided by the two analytical techniques, see Table S2 in the Supporting Information), the 7% of the measurements were between 10–20%, and only 14% of the measurements showed differences higher than 30%.
The Pearson coefficient was calculated to be 0.979, which indeed demonstrates excellent accuracy of the HMDE. As observed from Figure 8, most of the samples (46 out 57 samples) presented concentrations below 30 ppm and a closer inspection (Figure 8b) show that all metals provided a similar performance below this concentration, with Pearson coefficients of 0.974, 0.984, and 0.989 for Zn2+, Pb2+, and Cu2+. These results confirmed that the HMDE easily running on a commercially available instrument can be operated successfully for the simultaneous determination of metal ions, which is very useful for routine analysis of different kind of environmental samples [46,47], but also food [48] and pharmaceutical products [49].

4. Conclusions

The hanging mercury drop electrode (HMDE) has traditionally been the primary choice as the working electrode for multi-ion detection via anodic stripping voltammetry (ASV). Indeed, the HMDE is the one most widely employed in any reference analytical method for the analysis of metal ions. To date, many alternative working electrodes have been proposed in the literature to replace the HMDE, a goal motivated by the high toxicity of the mercury. Only a few of these electrodes have been successfully demonstrated for the simultaneous determination of some metal ions, mainly including Hg2+, Cd2+, Pb2+ and Cu2+. However, as a general trend, it is difficult to detect Zn2+ due to a narrow cathodic potential window and those electrodes achieving that purpose tend to provide voltammetric peaks with distorted shapes and potential that shifts with the concentration in the solution. Besides that, and to the best of our knowledge, the HMDE performance exceeds that presented for any of the reported electrodes in terms of linear range of response, reproducibility, limit of detection, proximity to ideal redox behaviour and analysis time regarding the detection of Zn2+, Cd2+, Pb2+ and Cu2+, by using only one stripping scan. Moreover, the HMDE displays excellent accuracy when analysing these metal ions in such a complex matrix as digested soils. More efforts are evidently needed towards the provision of the definitive replacement of the HMDE in the electroanalysis field, despite promising approaches being already reported in the literature.

Supplementary Materials

The following are available online at https://0-www-mdpi-com.brum.beds.ac.uk/article/10.3390/chemosensors9050107/s1 Table S1: Comparison of analytical parameters between different electrodes, Table S2: Metal concentration values determined by ASV and ICP-AES in soil samples.

Author Contributions

Conceptualization, M.C. and G.A.C.; methodology, K.X., A.M. and G.A.C.; software, C.P.-R. and G.A.C.; validation, K.X., C.P.-R. and A.M.; formal analysis, K.X. and C.P.-R.; investigation, K.X., C.P.-R., A.M., M.C., G.A.C.; resources, M.C. and G.A.C.; data curation, K.X. and A.M.; writing—original draft preparation, K.X., C.P.-R., M.C. and G.A.C.; writing—review & editing, K.X., C.P.-R., A.M., M.C., G.A.C.; visualization, K.X., C.P.-R. and M.C.; supervision, M.C. and G.A.C.; project administration, M.C. and G.A.C.; funding acquisition, M.C. and G.A.C. All authors have read and agreed to the published version of the manuscript.

Funding

The authors kindly acknowledge the support of the Swedish Research Council (Project Grant VR-2017-4887) and the ÅForsk foundation (Project Number 19-464). K.X. gratefully thanks the China Scholarship Council for supporting his Ph.D. studies.

Institutional Review Board Statement

Not applicable.

Informed Consent Statement

Not applicable.

Data Availability Statement

Not applicable.

Acknowledgments

Special thanks to Annika Carolin Maier for the support with the ICP measurements, Mats Jonsson for the access to the ICP instrument, Rakel Wreland Lindström and the KD1280 course (KTH) for the provision of the soil samples.

Conflicts of Interest

The authors declare no conflict of interest.

References

  1. Allen, J.B.; Larry, R.F. Electrochemical Methods Fundamentals and Applications; John Wiley & Sons: Hoboken, NJ, USA, 2001. [Google Scholar]
  2. Copeland, T.; Skogerboe, R. Anodic stripping voltammetry. Anal. Chem. 1974, 46, 1257A–1268A. [Google Scholar] [CrossRef]
  3. Rodrigues, J.A.; Rodrigues, C.M.; Almeida, P.J.; Valente, I.M.; Gonçalves, L.M.; Compton, R.G.; Barros, A.A. Increased sensitivity of anodic stripping voltammetry at the hanging mercury drop electrode by ultracathodic deposition. Anal. Chim. Acta 2011, 701, 152–156. [Google Scholar] [CrossRef] [PubMed]
  4. Wu, W.; Jia, M.; Wang, Z.; Zhang, W.; Zhang, Q.; Liu, G.; Zhang, Z.; Li, P. Simultaneous voltammetric determination of cadmium (II), lead (II), mercury (II), zinc (II), and copper (II) using a glassy carbon electrode modified with magnetite (Fe3O4) nanoparticles and fluorinated multiwalled carbon nanotubes. Microchim. Acta 2019, 186, 1–10. [Google Scholar] [CrossRef] [PubMed]
  5. Serrano, N.; González-Calabuig, A.; Del Valle, M. Crown ether-modified electrodes for the simultaneous stripping voltammetric determination of Cd(II), Pb(II) and Cu(II). Talanta 2015, 138, 130–137. [Google Scholar] [CrossRef] [PubMed] [Green Version]
  6. Pérez-Ràfols, C.; Rosal, M.; Serrano, N.; Ariño, C.; Esteban, M.; Díaz-Cruz, J.M. Expanding the possibilities of electrografting modification of voltammetric sensors through two complementary strategies. Electrochim. Acta 2019, 319, 878–884. [Google Scholar] [CrossRef]
  7. Saha, S.; Sarkar, P. Differential pulse anodic stripping voltammetry for detection of As (III) by Chitosan-Fe(OH)3 modified glassy carbon electrode: A new approach towards speciation of arsenic. Talanta 2016, 158, 235–245. [Google Scholar] [CrossRef]
  8. Torres-Rivero, K.; Pérez-Ràfols, C.; Bastos-Arrieta, J.; Florido, A.; Martí, V.; Serrano, N. Direct As(V) determination using screen-printed electrodes modified with silver nanoparticles. Nanomaterials 2020, 10, 1280. [Google Scholar] [CrossRef]
  9. Wang, R.; Chakrabarti, C.L. Copper speciation by competing ligand exchange method using differential pulse anodic stripping voltammetry with ethylenediaminetetraacetic acid (EDTA) as competing ligand. Anal. Chim. Acta 2008, 614, 153–160. [Google Scholar] [CrossRef]
  10. Landner, L.; Reuther, R. A critical review of current knowledge on fluxes, speciation, bioavailability and risk for adverse effects of copper, chromium, nickel and zinc. In Metals in Society and in the Environment; Kluwer Academic Publisher: Dordrecht, The Netherlands, 2004. [Google Scholar]
  11. Ariño, C.; Serrano, N.; Díaz-Cruz, J.M.; Esteban, M. Voltammetric determination of metal ions beyond mercury electrodes. A review. Anal. Chim. Acta 2017, 990, 11–53. [Google Scholar] [CrossRef] [Green Version]
  12. Barek, J.; Zima, J. Eighty years of polarography–history and future. Electroanalysis 2003, 15, 467–472. [Google Scholar] [CrossRef]
  13. Barek, J.; Fogg, A.G.; Muck, A.; Zima, J. Polarography and voltammetry at mercury electrodes. Crit. Rev. Anal. Chem. 2001, 31, 291–309. [Google Scholar] [CrossRef]
  14. Serrano, N.; Díaz-Cruz, J.M.; Ariño, C.; Esteban, M. Antimony-based electrodes for analytical determinations. TrAC Trends Anal. Chem. 2016, 77, 203–213. [Google Scholar] [CrossRef] [Green Version]
  15. Serrano, N.; Alberich, A.; Díaz-Cruz, J.M.; Ariño, C.; Esteban, M. Coating methods, modifiers and applications of bismuth screen-printed electrodes. TrAC Trends Anal. Chem. 2013, 46, 15–29. [Google Scholar] [CrossRef]
  16. Honeychurch, K.C.; Hart, J.P. Screen-printed electrochemical sensors for monitoring metal pollutants. TrAC Trends Anal. Chem. 2003, 22, 456–469. [Google Scholar] [CrossRef]
  17. Sawan, S.; Maalouf, R.; Errachid, A.; Jaffrezic-Renault, N. Metal and metal oxide nanoparticles in the voltammetric detection of heavy metals: A review. TrAC Trends Anal. Chem. 2020, 131, 116014. [Google Scholar] [CrossRef]
  18. Hub, E.S. European Union Reference Laboratories. Available online: https://ec.europa.eu/jrc/en/eurls (accessed on 29 March 2021).
  19. Metrohm 663 VA Stand. Available online: https://www.metrohm-autolab.com/Products/Echem/Accessories/663VAStand.html (accessed on 3 May 2021).
  20. Bard, A.J.; Faulkner, L.R. Fundamentals and applications. Electrochem. Methods 2001, 2, 580–632. [Google Scholar]
  21. Krulic, D.; Fatouros, N. Peak heights and peak widths at half-height in square wave voltammetry without and with ohmic potential drop for reversible and irreversible systems. J. Electroanal. Chem. 2011, 652, 26–31. [Google Scholar] [CrossRef]
  22. Galus, Z. Diffusion coefficients of metals in mercury. Pure Appl. Chem. 1984, 56, 635–644. [Google Scholar] [CrossRef]
  23. Wang, J. Analytical Electrochemistry; John Wiley & Sons: Hoboken, NJ, USA, 2006. [Google Scholar]
  24. Daneshgar, P.; Norouzi, P.; Ganjali, M.R. Application of a continuous square-wave potential program for sub nano molar determination of ketotifen. Chem. Pharm. Bull. 2009, 57, 117–121. [Google Scholar] [CrossRef] [Green Version]
  25. Mirceski, V.; Gulaboski, R.; Lovric, M.; Bogeski, I.; Kappl, R.; Hoth, M. Square-wave voltammetry: A review on the recent progress. Electroanalysis 2013, 25, 2411–2422. [Google Scholar] [CrossRef] [Green Version]
  26. Lide, D.R. CRC Handbook of Chemistry and Physics, 89th ed; Taylor & Francis: Abingdon, UK, 2008. [Google Scholar]
  27. Sosa, V.; Barceló, C.; Serrano, N.; Ariño, C.; Díaz-Cruz, J.M.; Esteban, M. Antimony film screen-printed carbon electrode for stripping analysis of Cd(II), Pb(II), and Cu(II) in natural samples. Anal. Chim. Acta 2015, 855, 34–40. [Google Scholar] [CrossRef]
  28. Sang, S.; Li, D.; Zhang, H.; Sun, Y.; Jian, A.; Zhang, Q.; Zhang, W. Facile synthesis of AgNPs on reduced graphene oxide for highly sensitive simultaneous detection of heavy metal ions. RSC Adv. 2017, 7, 21618–21624. [Google Scholar] [CrossRef] [Green Version]
  29. Wei, Y.; Gao, C.; Meng, F.-L.; Li, H.-H.; Wang, L.; Liu, J.-H.; Huang, X.-J. SnO2/reduced graphene oxide nanocomposite for the simultaneous electrochemical detection of cadmium (II), lead (II), copper (II), and mercury (II): An interesting favorable mutual interference. J. Phys. Chem. C 2012, 116, 1034–1041. [Google Scholar] [CrossRef]
  30. Veerakumar, P.; Veeramani, V.; Chen, S.-M.; Madhu, R.; Liu, S.-B. Palladium nanoparticle incorporated porous activated carbon: Electrochemical detection of toxic metal ions. ACS Appl. Mater. Interfaces 2016, 8, 1319–1326. [Google Scholar] [CrossRef]
  31. Alberich, A.; Díaz-Cruz, J.M.; Ariño, C.; Esteban, M. Potential shift correction in multivariate curve resolution of voltammetric data. General formulation and application to some experimental systems. Analyst 2008, 133, 112–125. [Google Scholar] [CrossRef]
  32. Xu, X.; Duan, G.; Li, Y.; Liu, G.; Wang, J.; Zhang, H.; Dai, Z.; Cai, W. Fabrication of gold nanoparticles by laser ablation in liquid and their application for simultaneous electrochemical detection of Cd2+, Pb2+, Cu2+, Hg2+. ACS Appl. Mater. Interfaces 2014, 6, 65–71. [Google Scholar] [CrossRef]
  33. Van Staden, J.; Matoetoe, M. Simultaneous determination of copper, lead, cadmium and zinc using differential pulse anodic stripping voltammetry in a flow system. Anal. Chim. Acta 2000, 411, 201–207. [Google Scholar] [CrossRef]
  34. Kokab, T.; Shah, A.; Iftikhar, F.J.; Nisar, J.; Akhter, M.S.; Khan, S.B. Amino acid-fabricated glassy carbon electrode for efficient simultaneous sensing of zinc (II), cadmium (II), copper (II), and mercury (II) ions. ACS Omega 2019, 4, 22057–22068. [Google Scholar] [CrossRef] [PubMed]
  35. Lu, M.; Deng, Y.; Luo, Y.; Lv, J.; Li, T.; Xu, J.; Chen, S.-W.; Wang, J. Graphene aerogel–metal–organic framework-based electrochemical method for simultaneous detection of multiple heavy-metal ions. Anal. Chem. 2018, 91, 888–895. [Google Scholar] [CrossRef] [PubMed]
  36. Zhou, J.; Sun, G.; Pan, J.; Pan, Y.; Wang, S.; Zhai, H. A nanocomposite consisting of ionic liquid-functionalized layered Mg(II)/Al(III) double hydroxides for simultaneous electrochemical determination of cadmium (II), copper (II), mercury (II) and lead (II). Microchim. Acta 2019, 186, 1–7. [Google Scholar] [CrossRef] [PubMed]
  37. Kitte, S.A.; Li, S.; Nsabimana, A.; Gao, W.; Lai, J.; Liu, Z.; Xu, G. Stainless steel electrode for simultaneous stripping analysis of Cd(II), Pb(II), Cu(II) and Hg(II). Talanta 2019, 191, 485–490. [Google Scholar] [CrossRef]
  38. Rehman, A.U.; Ikram, M.; Kan, K.; Zhao, Y.; Zhang, W.J.; Zhang, J.; Liu, Y.; Wang, Y.; Du, L.; Shi, K. 3D interlayer nanohybrids composed of reduced graphenescheme oxide/SnO2/PPy grown from expanded graphite for the detection of ultra-trace Cd2+, Cu2+, Hg2+ and Pb2+ ions. Sens. Actuators B Chem. 2018, 274, 285–295. [Google Scholar] [CrossRef]
  39. Hassan, K.M.; Gaber, S.E.; Altahan, M.F.; Azzem, M.A. Novel sensor based on poly (1, 2-diaminoanthraquinone) for individual and simultaneous anodic stripping voltammetry of Cd2+, Pb2+, Cu2+ and Hg2+. Electroanalysis 2018, 30, 1155–1162. [Google Scholar] [CrossRef]
  40. Fomo, G.; Nwaji, N.; Nyokong, T. Low symmetric metallophthalocyanine modified electrode via click chemistry for simultaneous detection of heavy metals. J. Electroanal. Chem. 2018, 813, 58–66. [Google Scholar] [CrossRef]
  41. Thiruppathi, A.R.; Sidhureddy, B.; Keeler, W.; Chen, A. Facile one-pot synthesis of fluorinated graphene oxide for electrochemical sensing of heavy metal ions. Electrochem. Commun. 2017, 76, 42–46. [Google Scholar] [CrossRef]
  42. Kumar, R.; Bhuvana, T.; Sharma, A. Nickel tungstate–graphene nanocomposite for simultaneous electrochemical detection of heavy metal ions with application to complex aqueous media. RSC Adv. 2017, 7, 42146–42158. [Google Scholar] [CrossRef] [Green Version]
  43. Gao, F.; Gao, N.; Nishitani, A.; Tanaka, H. Rod-like hydroxyapatite and Nafion nanocomposite as an electrochemical matrix for simultaneous and sensitive detection of Hg2+, Cu2+, Pb2+ and Cd2+. J. Electroanal. Chem. 2016, 775, 212–218. [Google Scholar] [CrossRef]
  44. Xie, Y.-L.; Zhao, S.-Q.; Ye, H.-L.; Yuan, J.; Song, P.; Hu, S.-Q. Graphene/CeO2 hybrid materials for the simultaneous electrochemical detection of cadmium (II), lead (II), copper (II), and mercury (II). J. Electroanal. Chem. 2015, 757, 235–242. [Google Scholar] [CrossRef]
  45. Muralikrishna, S.; Sureshkumar, K.; Varley, T.S.; Nagaraju, D.H.; Ramakrishnappa, T. In situ reduction and functionalization of graphene oxide with L-cysteine for simultaneous electrochemical determination of cadmium (II), lead (II), copper (II), and mercury (II) ions. Anal. Methods 2014, 6, 8698–8705. [Google Scholar] [CrossRef]
  46. Pesavento, M.; Alberti, G.; Biesuz, R. Analytical methods for determination of free metal ion concentration, labile species fraction and metal complexation capacity of environmental waters: A review. Anal. Chim. Acta 2009, 631, 129–141. [Google Scholar] [CrossRef]
  47. Lu, Y.; Liang, X.; Niyungeko, C.; Zhou, J.; Xu, J.; Tian, G. A review of the identification and detection of heavy metal ions in the environment by voltammetry. Talanta 2018, 178, 324–338. [Google Scholar] [CrossRef] [PubMed]
  48. Brainina, K.Z.; Malakhova, N.; Stojko, N.Y. Stripping voltammetry in environmental and food analysis. Fresenius’ J. Anal. Chem. 2000, 368, 307–325. [Google Scholar] [CrossRef] [PubMed]
  49. Uslu, B.; Ozkan, S.A. Electroanalytical methods for the determination of pharmaceuticals: A review of recent trends and developments. Anal. Lett. 2011, 44, 2644–2702. [Google Scholar] [CrossRef]
Figure 1. Illustration of the baseline correction for a real voltammogram showing multi-ion determination of Zn2+, Cd2+, Pb2+ and Cu2+.
Chemosensors 09 00107 g001
Figure 2. Schematic illustration of the ASV protocol performed with (a) the HMDE and (b) solid electrodes. (c) Expected stripping voltammogram at increasing concentration of one metal ion (C1 < C2 < C3 < C4). ECAT: Cathodic potential. EAN: Anodic potential. WE: Working electrode. Yellow particles: Target metal ions. Red particles: Other metal ions. Grey particles: Mercury drop.
Chemosensors 09 00107 g002
Figure 3. (a) Anodic stripping voltammograms for a solution containing 50 nM Zn2+, Cd2+, Pb2+, and Cu2+ in HNO3 at different deposition potentials. Ed = −1.1 V, td = 120 s, tr = 30 s, Ei = −1.1 V, and Ef = 0.15 V. (b) Comparison of experimental and theoretical peak current. Data was corrected by subtracting the baseline. Parameters employed in calculations: r 0 = 0.08 cm; w = 300 rpm; n = 2; t p = 0.025 s; Δ Ψ p = 0.9245; D M ,   Z n = 1.67 · 10−5 cm2 s−1; D M ,   C d = 1.53 · 10−5 cm2 s−1; D M ,   P b = 9.70 · 10−6 cm2 s−1; D M ,   C u = 1.19 · 10−5 cm2 s−1.
Chemosensors 09 00107 g003
Figure 4. Influence of (a) the equilibration time in the stripping voltammogram for 50 nM Zn2+, Cd2+, Pb2+, and Cu2+ in 0.01 M NaNO3/ HNO3 (pH 2.0) background solution. Influence of (b) frequency, (c) pulse step and (d) pulse amplitude used for the SWASV step in the stripping voltammogram for 50 nM Zn2+, Cd2+, Pb2+, and Cu2+ in 0.01 M NaNO3/ HNO3 (pH 2.0) background solution. Insets: peak current after data baseline correction while varying the parameter under study.
Chemosensors 09 00107 g004
Figure 5. Square-wave waveform showing the meaning of pulse amplitude (Eamp), pulse step (Estep), frequency (freq), and sampling period (SP) at Ifor (forward current) and Irev (reverse current).
Chemosensors 09 00107 g005
Figure 6. (a) Square-wave anodic stripping voltammograms for the simultaneous determination of increasing concentrations of Zn2+, Cd2+, Pb2+, and Cu2+. (b) Corresponding calibration graphs after background correction.
Chemosensors 09 00107 g006
Figure 7. (a) Stripping voltammograms obtained at increasing concentrations of Zn2+, Cd2+, Pb2+ and Cu2+ in 0.01 M NaNO3/ HNO3 (pH 2.0) background solution. The red line indicates the voltammogram of one soil sample. (b) Corresponding calibration graphs after background correction of the voltammograms. The dashed arrows indicate the interpolation of the concentration for each metal in the sample. (c) Stripping voltammograms for the same sample (red line) and applying the standard addition method for calibration. (d) Corresponding calibration graphs after background correction showing the intercepts with the concentration axis for the extrapolation of the metals’ concentrations.
Chemosensors 09 00107 g007
Figure 8. (a) Correlation plot of the concentration values in the soil samples detected by the HMDE and ICP-AES methods. Sample matrix size of 57. (b) Correlation plot of the concentrations values in the soil samples presented a metal content below 30 mg kg−1. Sample matrix size of 46.
Chemosensors 09 00107 g008
Table 1. Some parameters reported in the literature for the electrodes reported as an alternative for the HMDE. The results obtained herein with the HMDE are also collected for comparison purposes.
ElectrodePeak Potential (V)ObservationsLRR aRef
Zn2+Cd2+Pb2+Cu2+Hg2+
HMDE−0.96−0.54−0.350.06Well-resolved peaksZn2+: 14−150 nM
Cd2+: 21–150 nM
Pb2+: 7–150 nM
Cu2+: 40–150 nM
This work
PdNPs − PACs modified GCE−0.79−0.54−0.070.27Peak shoulders appear as concentration increasesCd2+: 0.5–5.5 µM
Pb2+: 0.5–8.9 µM
Cu2+: 0.5–5.0 µM
Hg2+: 0.24–7.5 µM
[30]
AuNPs modified GCE−0.78−0.560.000.25Double peaksCd2+: 0.3–1.4 µM
Pb2+: 0.3–1.4 µM
Cu2+: 0.3–1.4 µM
Hg2+: 0.3–1.4 µM
[32]
GCE−1.06−0.73−0.47−0.04Epeak is pH dependent and electrode can only be used for one scanZn2+: 1.530–6.12 µM
Cd2+: 0.445–4.45 µM
Pb2+: 0.242–2.42 µM
Cu2+: 0.787–7.87 µM
[33]
Amino Acid modified GCE−1.1−0.7−0.10.3Well-resolved peaksZn2+: 5–100 nM
Cd2+: 5–100 nM
Cu2+: 5–100 nM
Hg2+: 5–100 nM
[34]
GA-MOF modified GCE−0.82−0.61−0.250.10Epeak shifts with increasing concentrationCd2+: 0.01–1.5 µM
Pb2+: 0.001–2 µM
Cu2+: 0.01–1.6 µM
Hg2+: 0.001–2.2 µM
[35]
SnO2/rGO modified GCE−0.77−0.58−0.110.24Peak shoulder for Pb(II)Cd2+: 0.3–1.2 µM
Pb2+: 0.3–1.2 µM
Cu2+: 0.3–1.2 µM
Hg2+: 0.3–1.2 µM
[29]
IL dopped with Mg(II)/Al(III) LDHs modified GCE−0.77−0.54−0.040.30Epeak shifts with increasing concentration.
Peak shoulder for Pb(II)
Cd2+: 4.45–177.94 nM
Pb2+: 0.24–96.60 nM
Cu2+: 0.79–314.96 nM
Hg2+: 2.49–99.70 nM
[36]
Stainless steel−0.70−0.41−0.050.30Epeak shifts with increasing concentration.
Peak shoulder for Pb(II)
Cd2+: 0.5–5 µM
Pb2+: 0.075–5 µM
Cu2+: 0.075–5 µM
Hg2+: 0.1–5 µM
[37]
rGO/SnO2/PPy modified GCE−0.78−0.58−0.110.20Well-resolved peaksCd2+: 0.5–3 µM
Pb2+: 0.5–3 µM
Cu2+: 0.5–3 µM
Hg2+: 0.5–3 µM
[38]
P1,2-DAAQ modified GCE−0.81−0.59−0.230.07Epeak shifts with increasing concentration.
Peak shoulder for Pb(II)
Cd2+: 0–1.07 µM
Pb2+: 0–0.58 µM
Cu2+: 0–1.89 µM
Hg2+: 0–0.60 µM
[39]
Metallophthalocyanine modified GCE−0.75−0.47−0.160.06Epeak shifts with increasing concentrationCu2+: 0–0.1 mM
Cd2+: 0–0.1 mM
Pb2+: 0–0.1 mM
Hg2+: 0–0.1 mM
[40]
FGO modified GCE−0.7−0.50.00.3Peak shoulder for Pb(II).
Epeak shifts with increasing concentration
Cd2+: 1.0–6.0 µM
Pb2+: 1.0–6.0 µM
Cu2+: 1.0–6.0 µM
Hg2+: 1.0–6.0 µM
[41]
AgNps/rGO modified magnetic GCE−0.74−0.56−0.050.32Peak shoulder for Pb(II)Cd2+: 0.05–1.5 µM
Pb2+: 0.05–1.5 µM
Cu2+: 0.05–1.5 µM
Hg2+: 0.05–1.5 µM
[28]
rGO/NiWO4 modified CPE−0.77−0.58−0.110.24Epeak shifts with increasing concentrationCd2+: 0.2–1.0 µM
Pb2+: 0.2–1.0 µM
Cu2+: 0.2–1.0 µM
Hg2+: 0.2–1.0 µM
[42]
HAP-Nafion modified GCE−0.70−0.50−0.130.12Epeak shifts with increasing concentrationCd2+: 3.0–10 µM
Pb2+: 3.0–10 µM
Cu2+: 3.0–10 µM
Hg2+: 0.1–1.0 µM
[43]
GO/CeO2 modified GCE−0.76−0.54−0.060.31Double peaksCd2+: 0.2–2.5 µM
Pb2+: 0.2–2.5 µM
Cu2+: 0.2–2.5 µM
Hg2+: 0.2–2.5 µM
[44]
Cys/rGO modified GCE−0.77−0.52−0.050.29Epeak shifts with increasing concentration.
Peak shoulder for Pb(II)
Cu2+: 0.4–2.0 µM
Cd2+: 0.4–2.0 µM
Pb2+: 0.4–1.2 µM
Hg2+: 0.4–2.0 µM
[45]
a The lower limit of the LRR was established from the limit of quantification (LOQ). AuNPs: gold nanoparticles; CPE: carbon paste electrode; Cys: cysteine; FGO: fluorinated graphene oxide; GA: graphene aerogel; GCE: glassy carbon electrode; GO: graphene oxide; HAP: hydroxyapatite; IL: ionic liquid LDH: layered double hydroxide; MOF: metal–organic framework; P1,2-DAAQ: poly(1,2-diaminoan-thraquinone); PACs: porous activated carbon; PdNPs: palladium nanoparticles; PPy: polypyrrole; rGO: reduced graphene oxide.
Table 2. Metal concentration values (ppm) determined for one of the soil samples by ASV, considering both external calibration and standard addition methods, and ICP-AES. Average ± standard deviation (n = 3).
ASVICP-AES (ppm)Ext-Int (%)ICP-Ext (%)ICP-Add (%)
Ext. Calibration (ppm)Standard Addition (ppm)
Zn2+8.8 ± 0.313.3 ± 0.512.7 ± 0.233.830.74.7
Pb2+11.3 ± 0.318.3 ± 0.217.2 ± 0.138.334.36.4
Cu2+15.1 ± 0.116.1 ± 0.514.6 ± 0.26.23.410.3
Publisher’s Note: MDPI stays neutral with regard to jurisdictional claims in published maps and institutional affiliations.

