
CH3SH and H2S Sensing Properties of V2O5/WO3/TiO2 Gas Sensor


National Institute of Advanced Industrial Science and Technology (AIST), Innovative Functional Materials Research Institute, 2266-98, Anagahora, Shimo-Shidami, Nagoya-shi 463-8560, Japan
*
Author to whom correspondence should be addressed.
Chemosensors 2021, 9(5), 113; https://0-doi-org.brum.beds.ac.uk/10.3390/chemosensors9050113
Submission received: 8 April 2021
/
Revised: 13 May 2021
/
Accepted: 18 May 2021
/
Published: 19 May 2021
(This article belongs to the Special Issue Nanomaterials Synthesis for Both Sensors and Environmental Applications)
Abstract
:Resistive-type semiconductor-based gas sensors were fabricated for the detection of methyl mercaptan and hydrogen sulfide. To fabricate these sensors, V2O5/WO3/TiO2 (VWT) particles were deposited on interdigitated Pt electrodes. The vanadium oxide content of the utilized VWT was 1.5, 3, or 10 wt.%. The structural properties of the VWT particles were investigated by X-ray diffraction and scanning electron microscopy analyses. The resistance of the VWT gas sensor decreased with increasing methyl mercaptan and hydrogen sulfide gas concentrations in the range of 50 to 500 ppb. The VWT gas sensor with 3 wt.% vanadium oxide showed high methyl mercaptan and hydrogen sulfide responses and good gas selectivity against hydrogen at 300 °C.
1. Introduction
Human breath contains small amounts of biomarker gases, such as hydrogen (H2), nitric oxide (NO), carbon monoxide (CO), methane (CH4), and various volatile organic components, at low concentrations ranging from several parts per billion (ppb) to parts per million (ppm) [1,2,3,4]. The organoleptic intensity of oral malodor correlates with the levels of methyl mercaptan (CH3SH) and hydrogen sulfide (H2S), which are volatile sulfur compounds, in human breath [4]. Although monitoring CH3SH and H2S concentrations in human breath is one of the best noninvasive screening tests for early diagnosis, the screening process requires an analytical device with sufficient accuracy at the ppb level. The concentration level of H2 in human breath has been measured to be several tens of ppm, which is higher than those of the other gases [5].
Semiconductor-based gas sensors are effective for respiratory gas analysis from the standpoints of cost, compactness, and power consumption [6,7,8,9,10,11]. Su et al. reported that for NO2 sensing, a wearable, alveolus-inspired active membrane sensor based on the WO3 system showed excellent selectivity and thermal and humidity stability [6]. Jha et al. prepared chemiresistive sensors using MoSe2 nanoflakes for ppb-level H2S gas detection [7]. Li et al. synthesized CuO nanosheets by a hydrothermal method and used them to fabricate a sensor, which showed ppb-level H2S gas response [8].
Our group has reported a resistive-type SO2 gas sensor based on V2O5/WO3/TiO2 (VWT) [12,13]. Although this gas sensor has been confirmed to respond well to 20 to 5000 ppm SO2 gas, its responsiveness to methyl mercaptan and hydrogen sulfide has not been investigated. In this study, VWT-based gas sensors with V2O5 contents of 1.5, 3.0, and 10 wt.% were prepared. The responsiveness of the gas sensor to ppb-level methyl mercaptan and hydrogen sulfide was investigated. To discuss the gas selectivity of the gas sensor, the sensor response to H2 gas at the ppm level was investigated.
2. Materials and Methods
After stirring 10 g of TiO2 nanoparticles (Evonik Aeroxide P 25) in 115 mL of ion-exchanged water, 0.444 g of ammonium vanadate (FUJIFILM Wako Pure Chemical Corporation, Osaka, Japan), 1.27 g of ammonium paratungstate (Sigma-Aldrich, St. Louis, MO, USA), and 12 mL of 4% methylamine aqueous solution were added. After mixing for 24 h, the solution was dried at 85 °C to obtain a dry sample. The dry sample was ground and calcined at 450 °C for 5 h to obtain 3V2O5/10WO3/87TiO2 (wt.%) (3 VWT) particles. 1.5V2O5/10WO3/88.5TiO2 (1.5 VWT) and 10V2O5/10WO3/80TiO2 (10 VWT) particles were prepared in the same manner.
The sample powders were characterized by X-ray diffraction (XRD) and scanning electron microscopy (SEM) analyses. XRD analysis was carried out using a SmartLab X-ray diffractometer (Rigaku Corporation, Tokyo, Japan) equipped with a copper source (Cu Kα) and one-dimensional high-speed detector (D/teX Ultra 250). The X-ray generator was operated at 40 kV and 30 mA. SEM analysis was performed using a JSM-6335FM microscope (JEOL Ltd., Tokyo, Japan) equipped with a field-emission gun. To obtain the Brunauer–Emmett–Teller (BET) surface areas, the nitrogen adsorption isotherms of sample particles (degassed at 300 °C for 2 h) were measured at 77 K in liquid nitrogen using a NOVA 4200e surface area and pore size analyzer (Quantachrome Instruments, Boynton Beach, FL, USA).
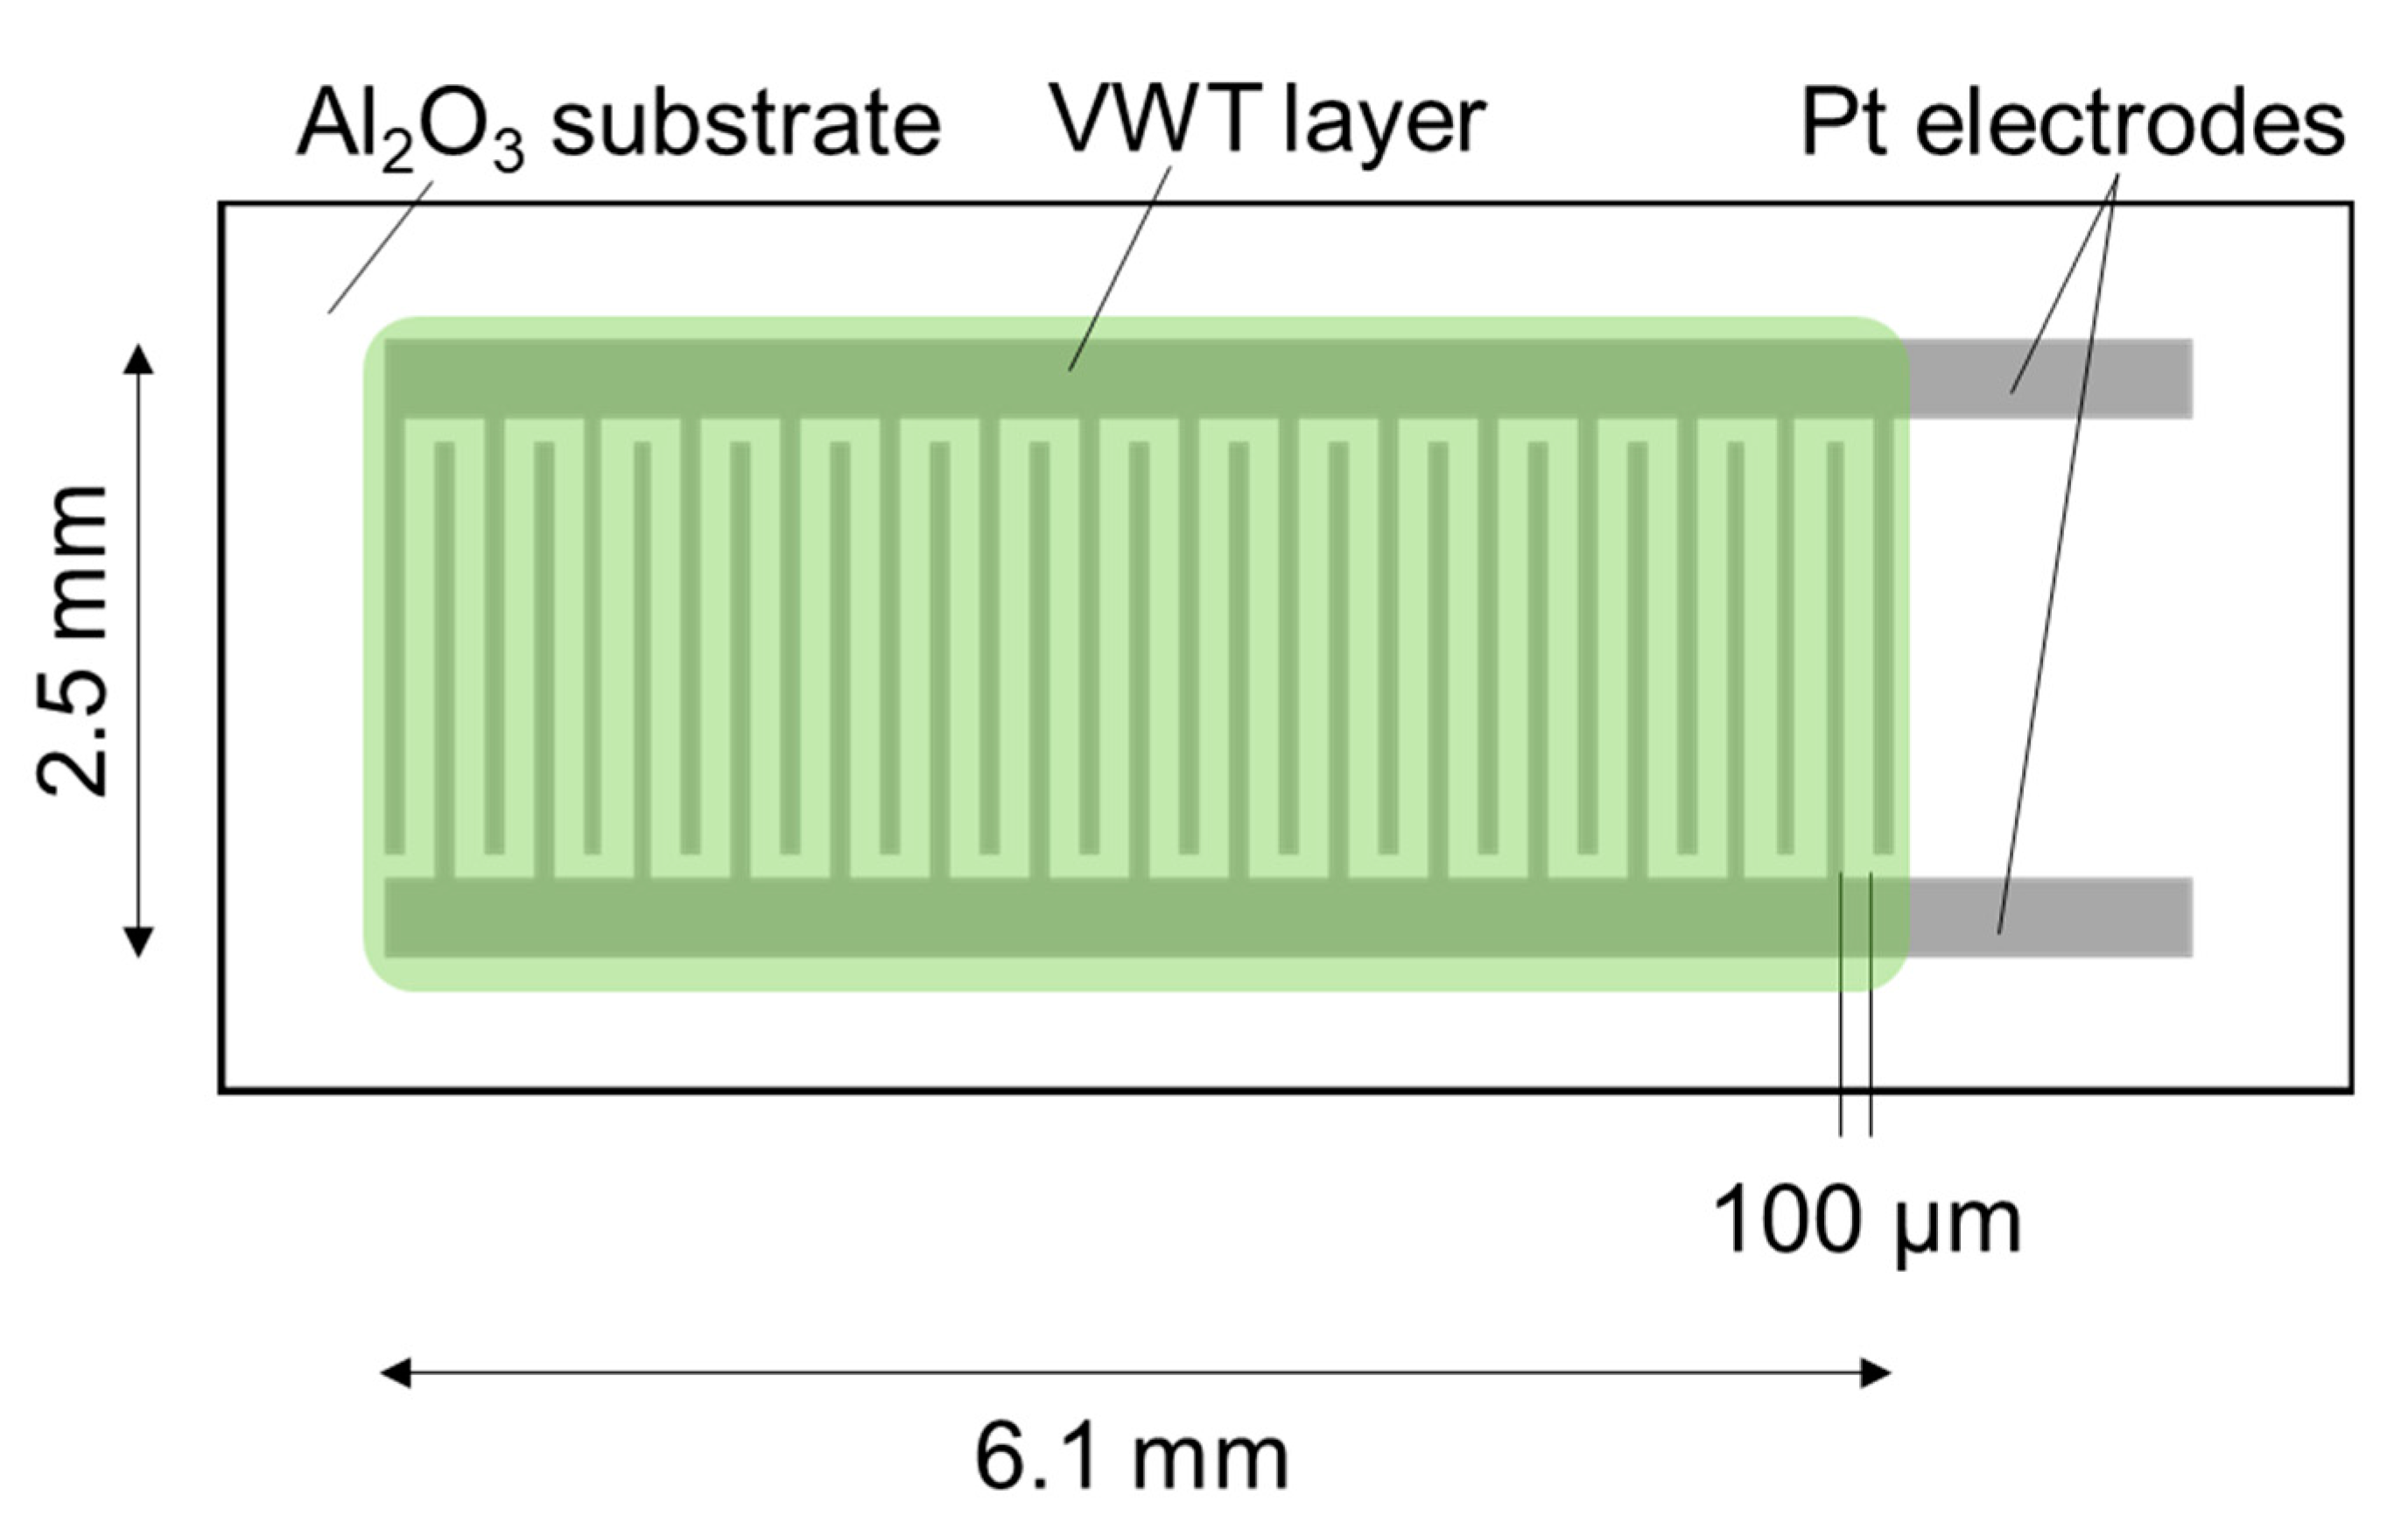
A ceramic paste of VWT particles was prepared by mixing an organic vehicle consisting of 10 wt.% ethyl cellulose and 90 wt.% terpineol. The mixing weight ratio of VWT and the organic vehicle was 2:1.33. The paste was screen-printed onto an alumina substrate with Pt interdigital electrodes with line and space definitions of 100 μm each. These sensor elements were baked at 750 °C for 20 min to prepare a gas sensor with a sensing film having a thickness of approximately 5 μm. Figure 1 shows a schematic illustration of the sensor.
The gas responsiveness of the sensor was examined using a test chamber in an electric furnace at 300–500 °C. After placing the sensor in the chamber, dry air was flowed into the chamber for 1 h, followed by the sample gas in dry air for 1 h, at a flow rate of 200 mL/min. The CH3SH and H2S gas concentrations were controlled to 0, 50, 250, and 500 ppb in dry air. Sensor resistances in various gas atmospheres were measured by the two-terminal method with a K2700 digital multimeter (Keithley) at 5 s intervals. The response value (S) was defined by the following equation: S = Ra/Rg, where Ra denotes the resistance in dry air before sample gas exposure and Rg is the resistance after 1 h of sample gas exposure.
The response of the sensors to H2 gas was investigated using the same apparatus as that used to measure the CH3SH and H2S gas responses. The H2 gas concentration was controlled to 0, 250, and 500 ppm in dry air.
3. Results and Discussion
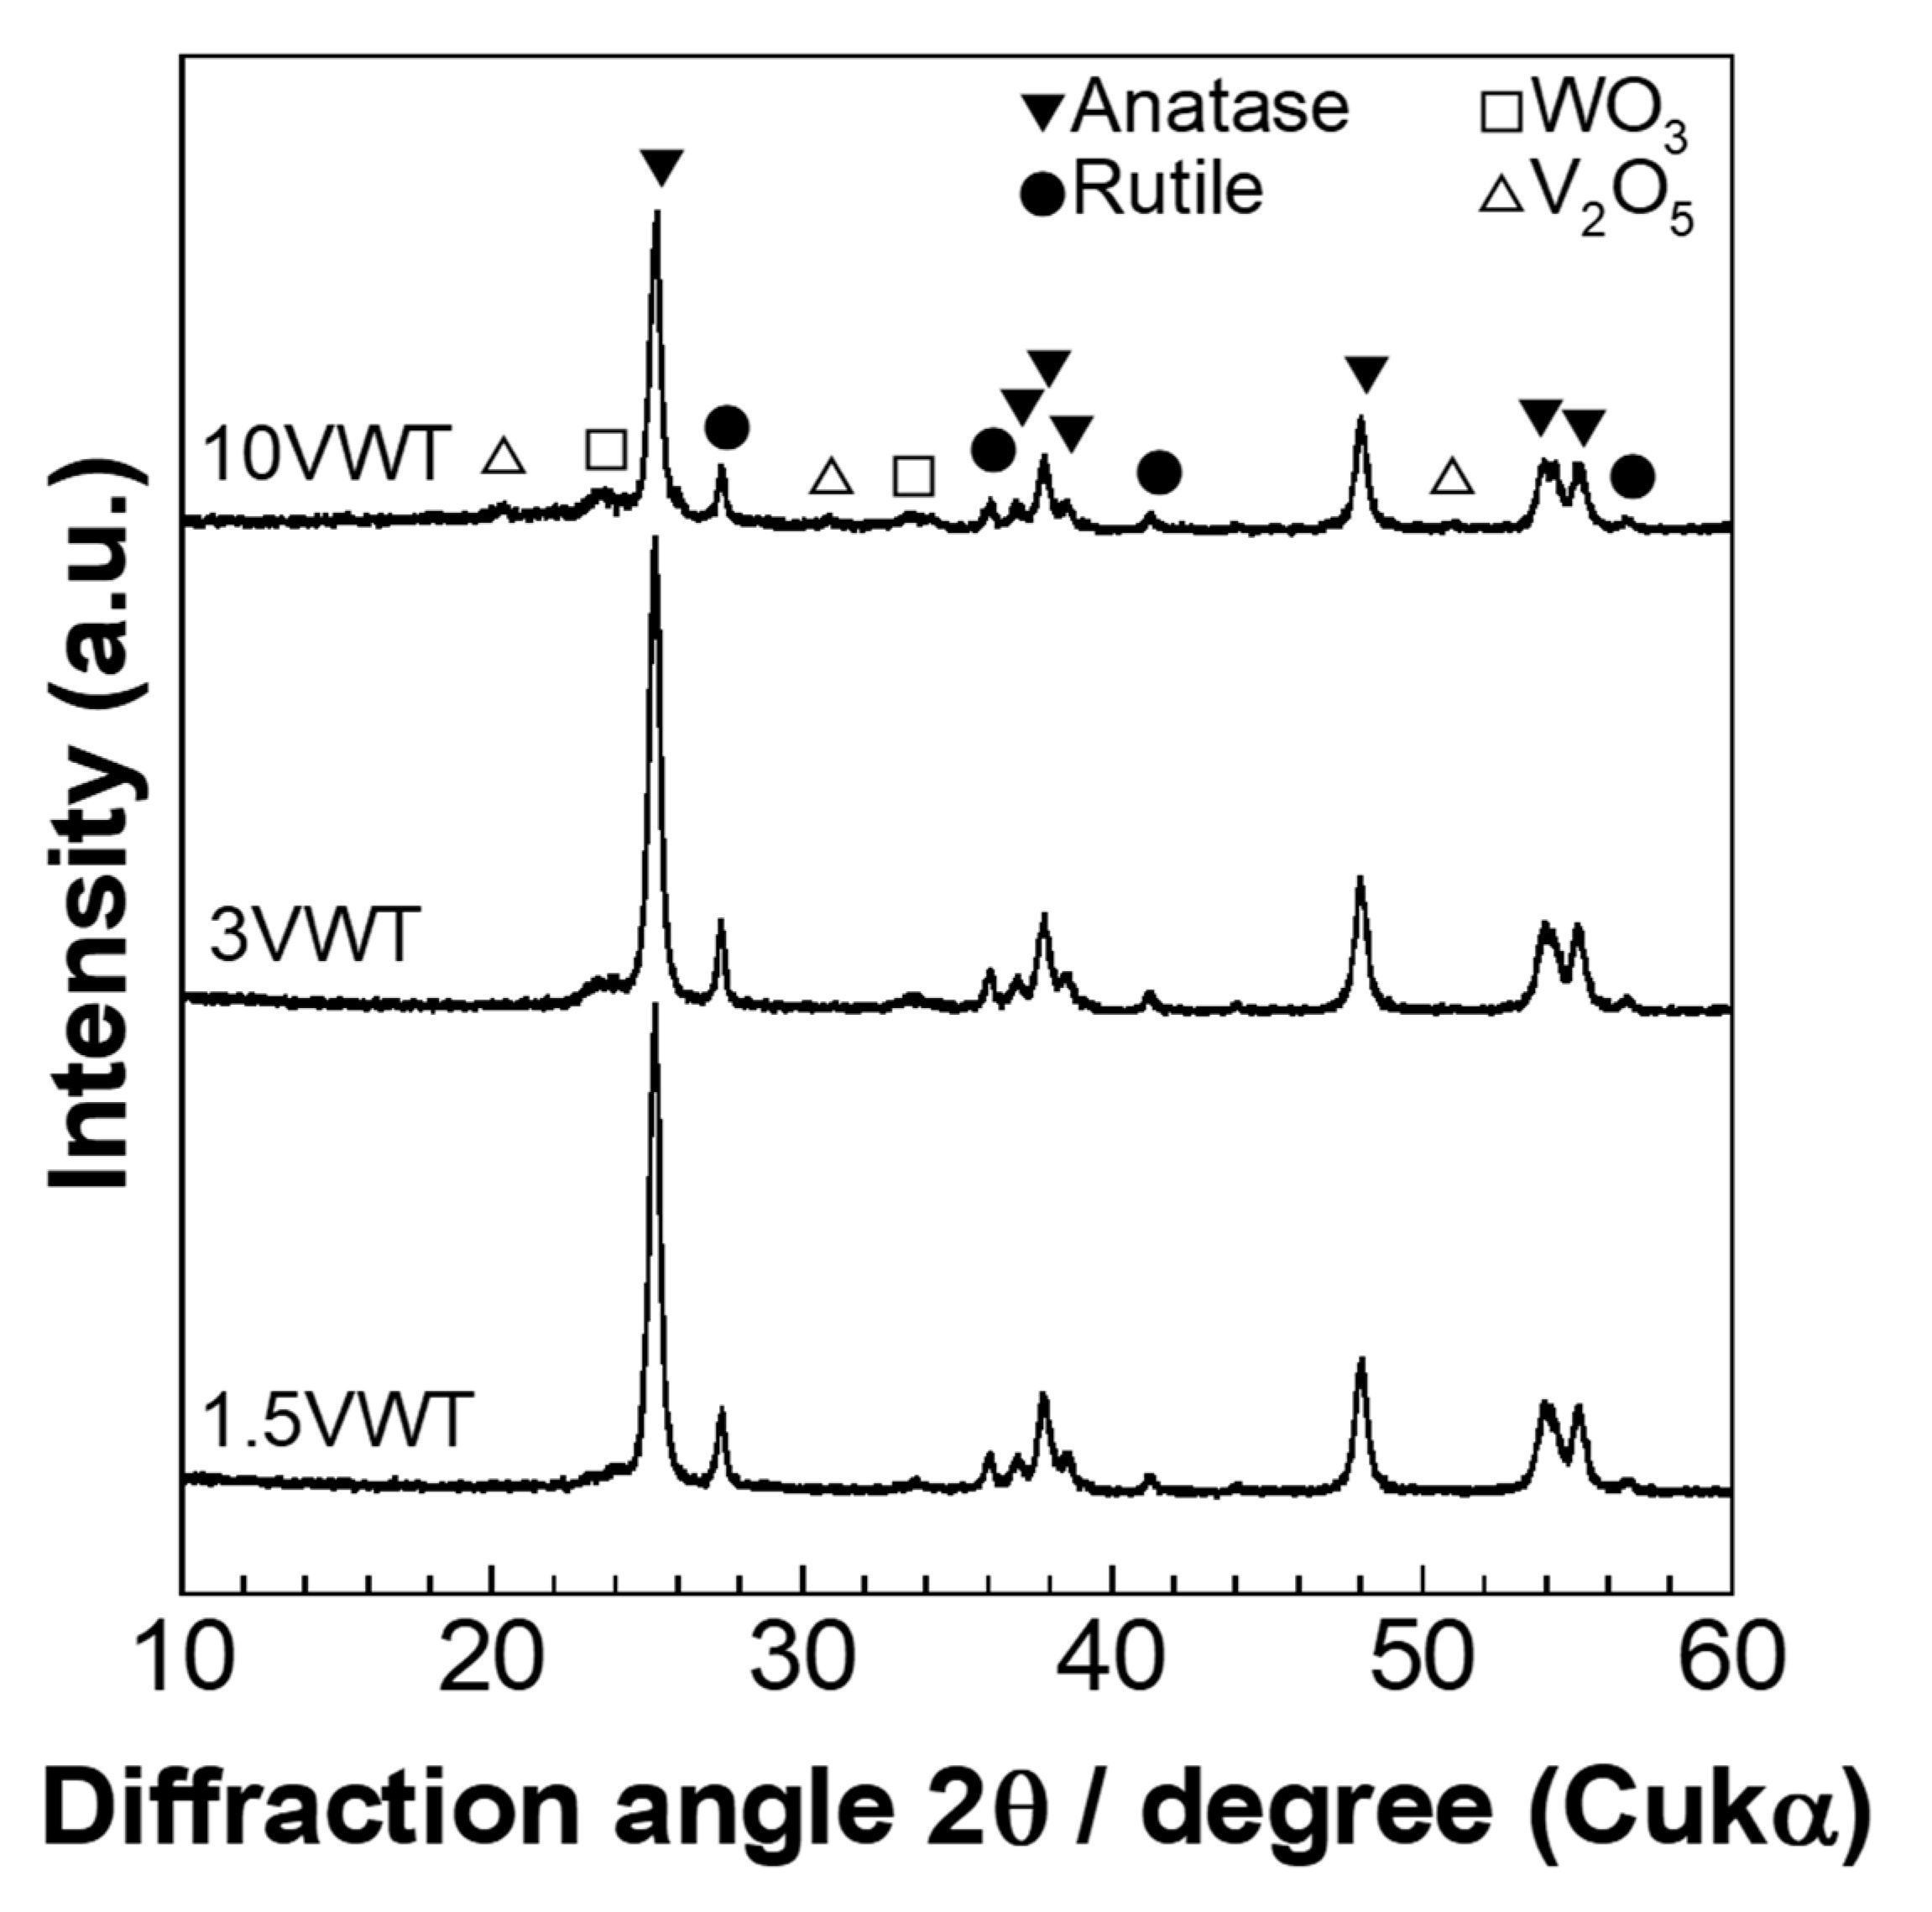
Figure 2 shows the XRD patterns of the 1.5 VWT, 3 VWT, and 10 VWT particles. Peaks of TiO2 (anatase and rutile) and WO3 were observed in all XRD patterns. In addition, peaks of V2O5 were confirmed in the 10 VWT XRD pattern. No V2O5 peaks were observed in the XRD patterns of 1.5 VWT and 3 VWT owing to the lower V2O5 content. Since the peaks assigned to TiO2, WO3, and V2O5 were observed, no structural changes due to the formation of the complex oxide of V-W-Ti-O were observed.
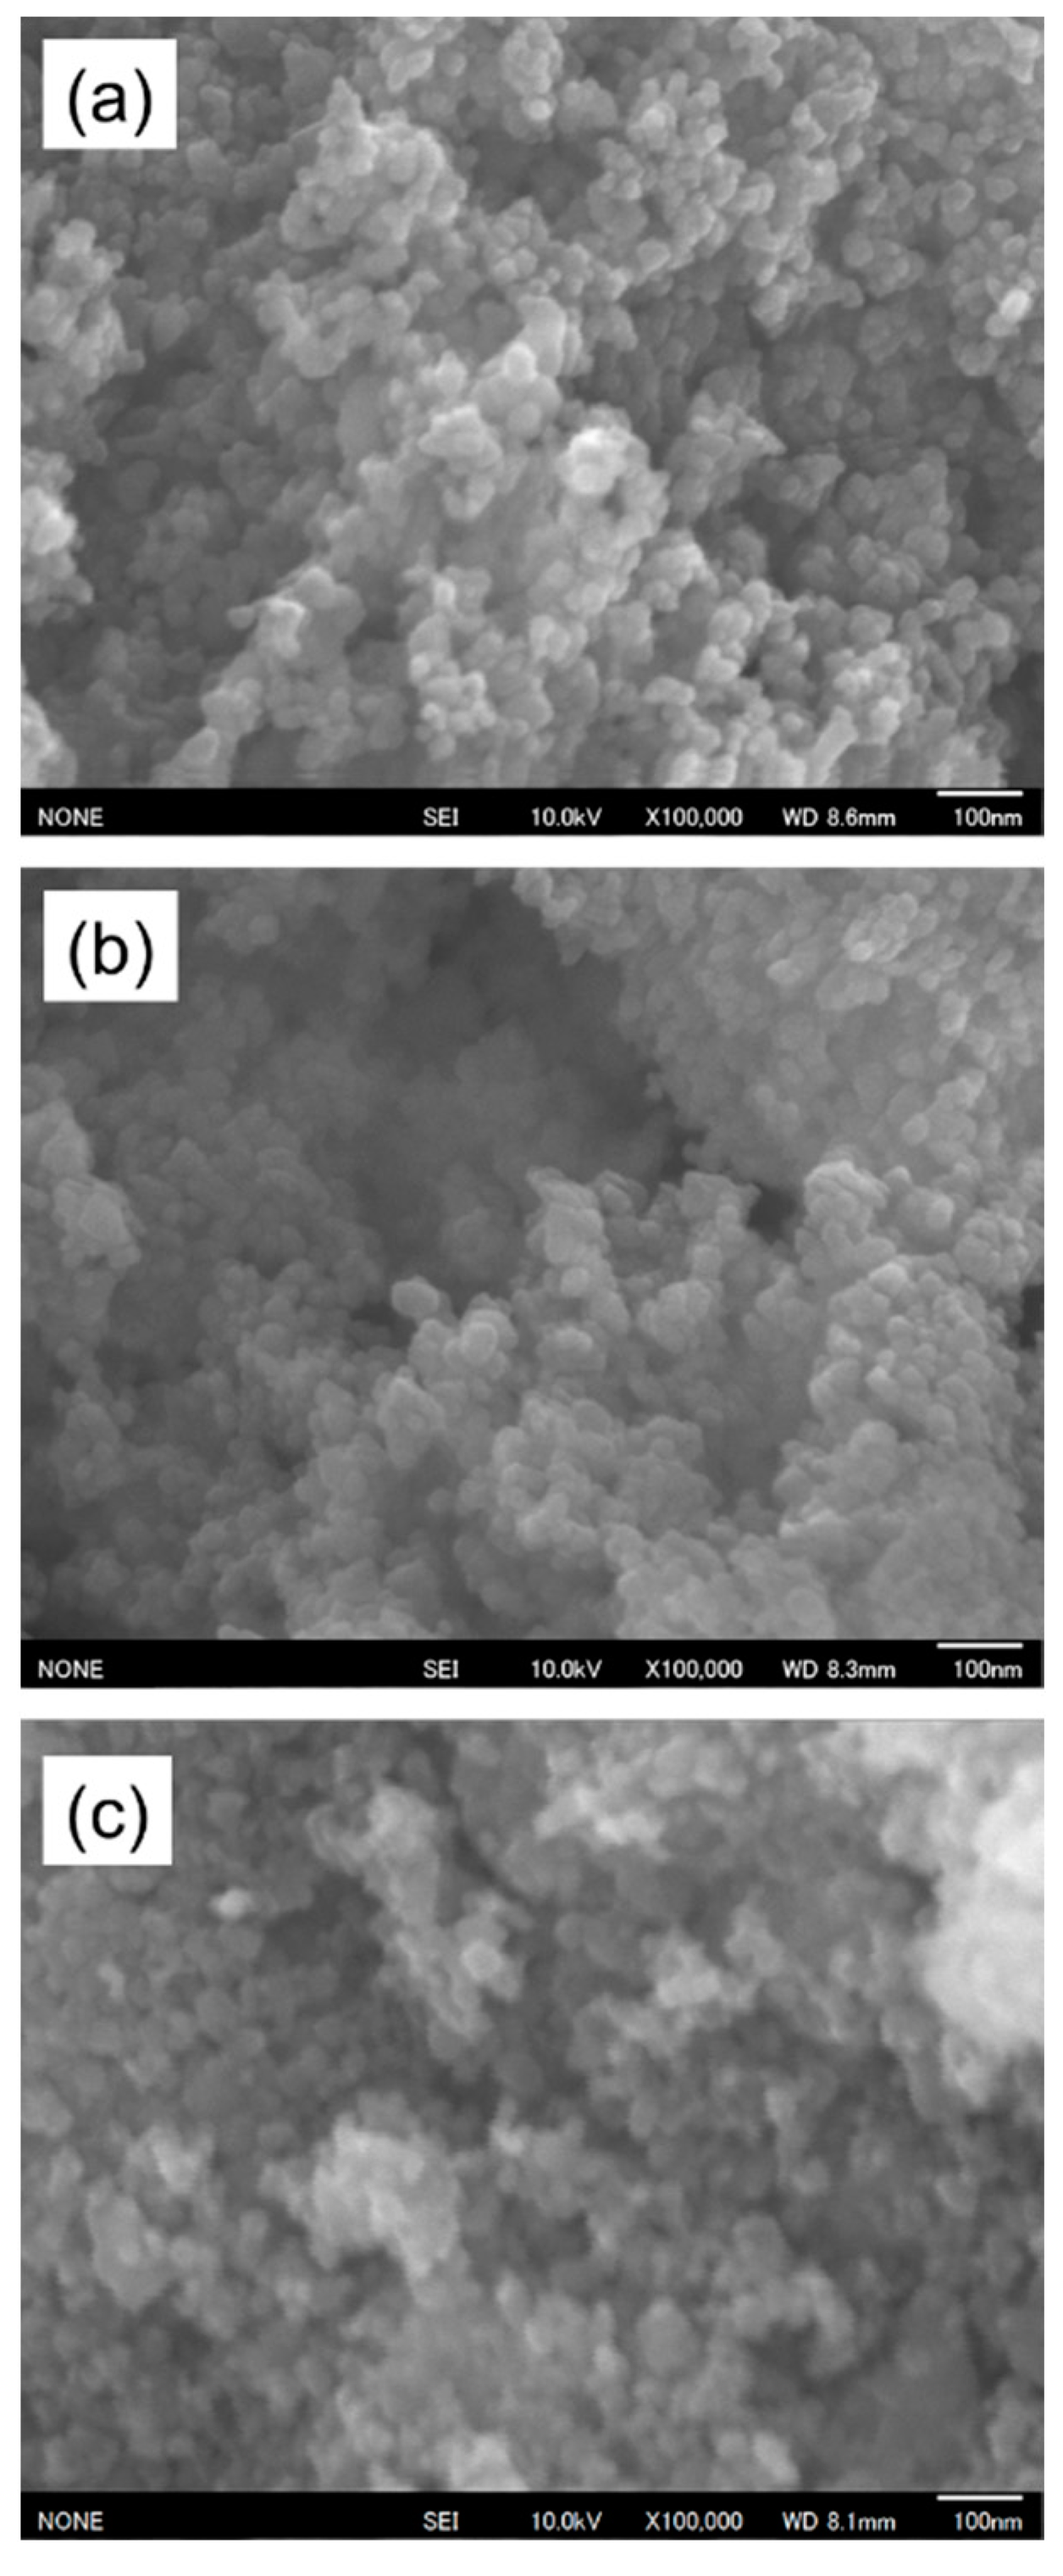
Figure 3 shows the SEM images of the 1.5 VWT, 3 VWT, and 10 VWT particles. For all samples, uniform particles with diameters of several tens of nanometers were confirmed. As these diameters are almost the same as those of TiO2 particles (P 25), it is assumed that V2O5 and WO3 are supported on the surface of the TiO2 particles in VWT. The BET surface areas of the 1.5 VWT, 3 VWT, and 10 VWT particles were 46, 47, and 34 m2/g, respectively. When compared, 10 VWT had a slightly lower BET surface area than 1.5 VWT and 3 VWT. Since the specific surface area of P 25 TiO2 is 57.4 m2/g [14], decreasing the amount of TiO2 decreased the BET surface area of VWT. Although the difference in particle morphology could not be confirmed in Figure 3, the difference in the specific surface area may be due to the difference in particle morphology.
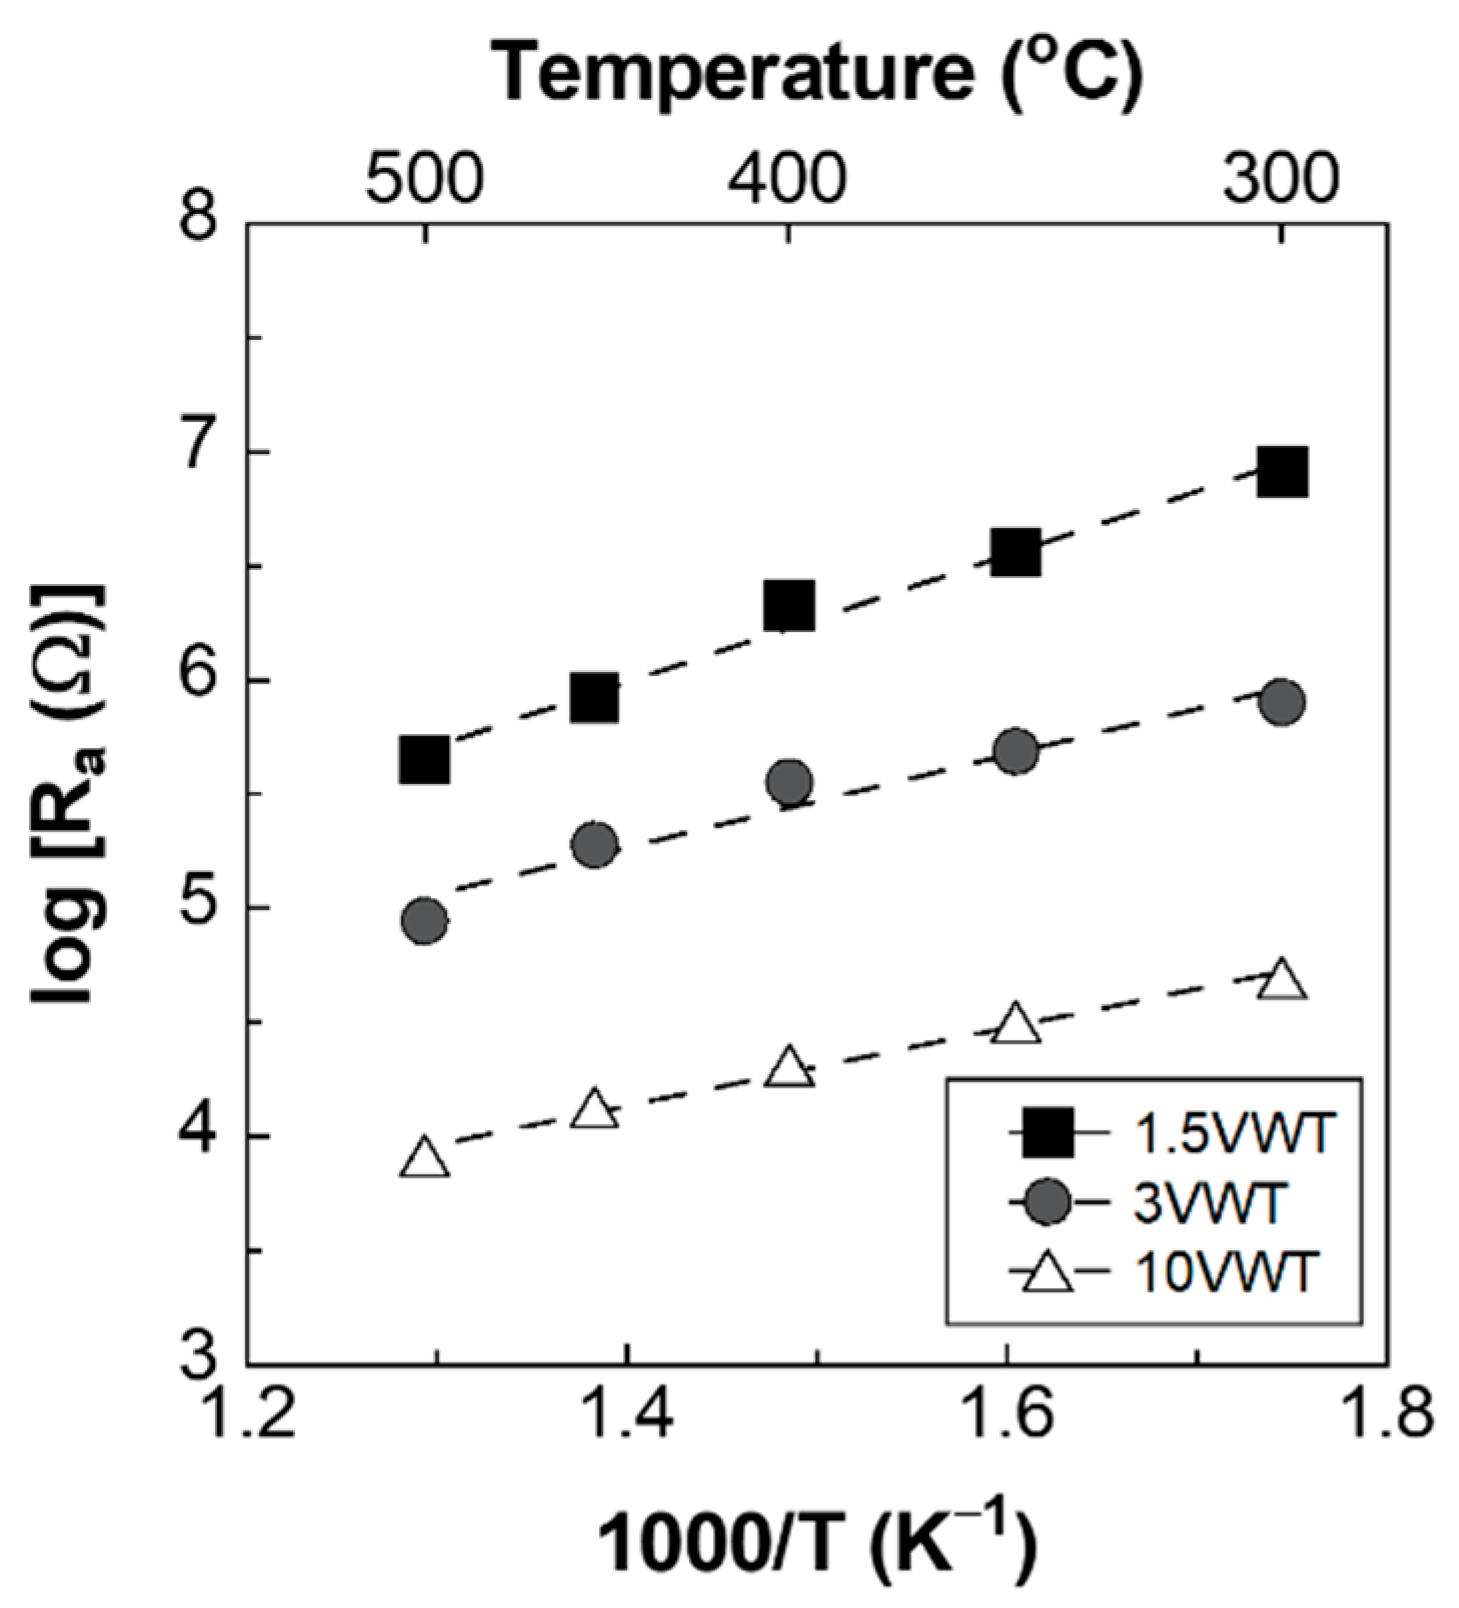
Figure 4 shows the Arrhenius plots of Ra for the 1.5 VWT, 3 VWT, and 10 VWT gas sensors. Ra decreased with decreasing TiO2 content in VWT. Ra changed exponentially with the reciprocal of temperature between 300 and 500 °C, as shown in the following equation: Ra = R0 exp(−E/RT), where E is the activation energy, T is the temperature in Kelvin, R is the gas constant, and R0 is the pre-exponential factor. This indicates that there is no change in the mechanism of electron conduction in VWT between 300 and 500 °C. The activation energies for electron conduction in the 1.5 VWT, 3 VWT, and 10 VWT gas sensors were 0.57, 0.40, and 0.34 eV, respectively. It is considered that the sensor resistance decreased owing to the decrease in the TiO2 content in VWT, resulting in a decrease in the activation energy.
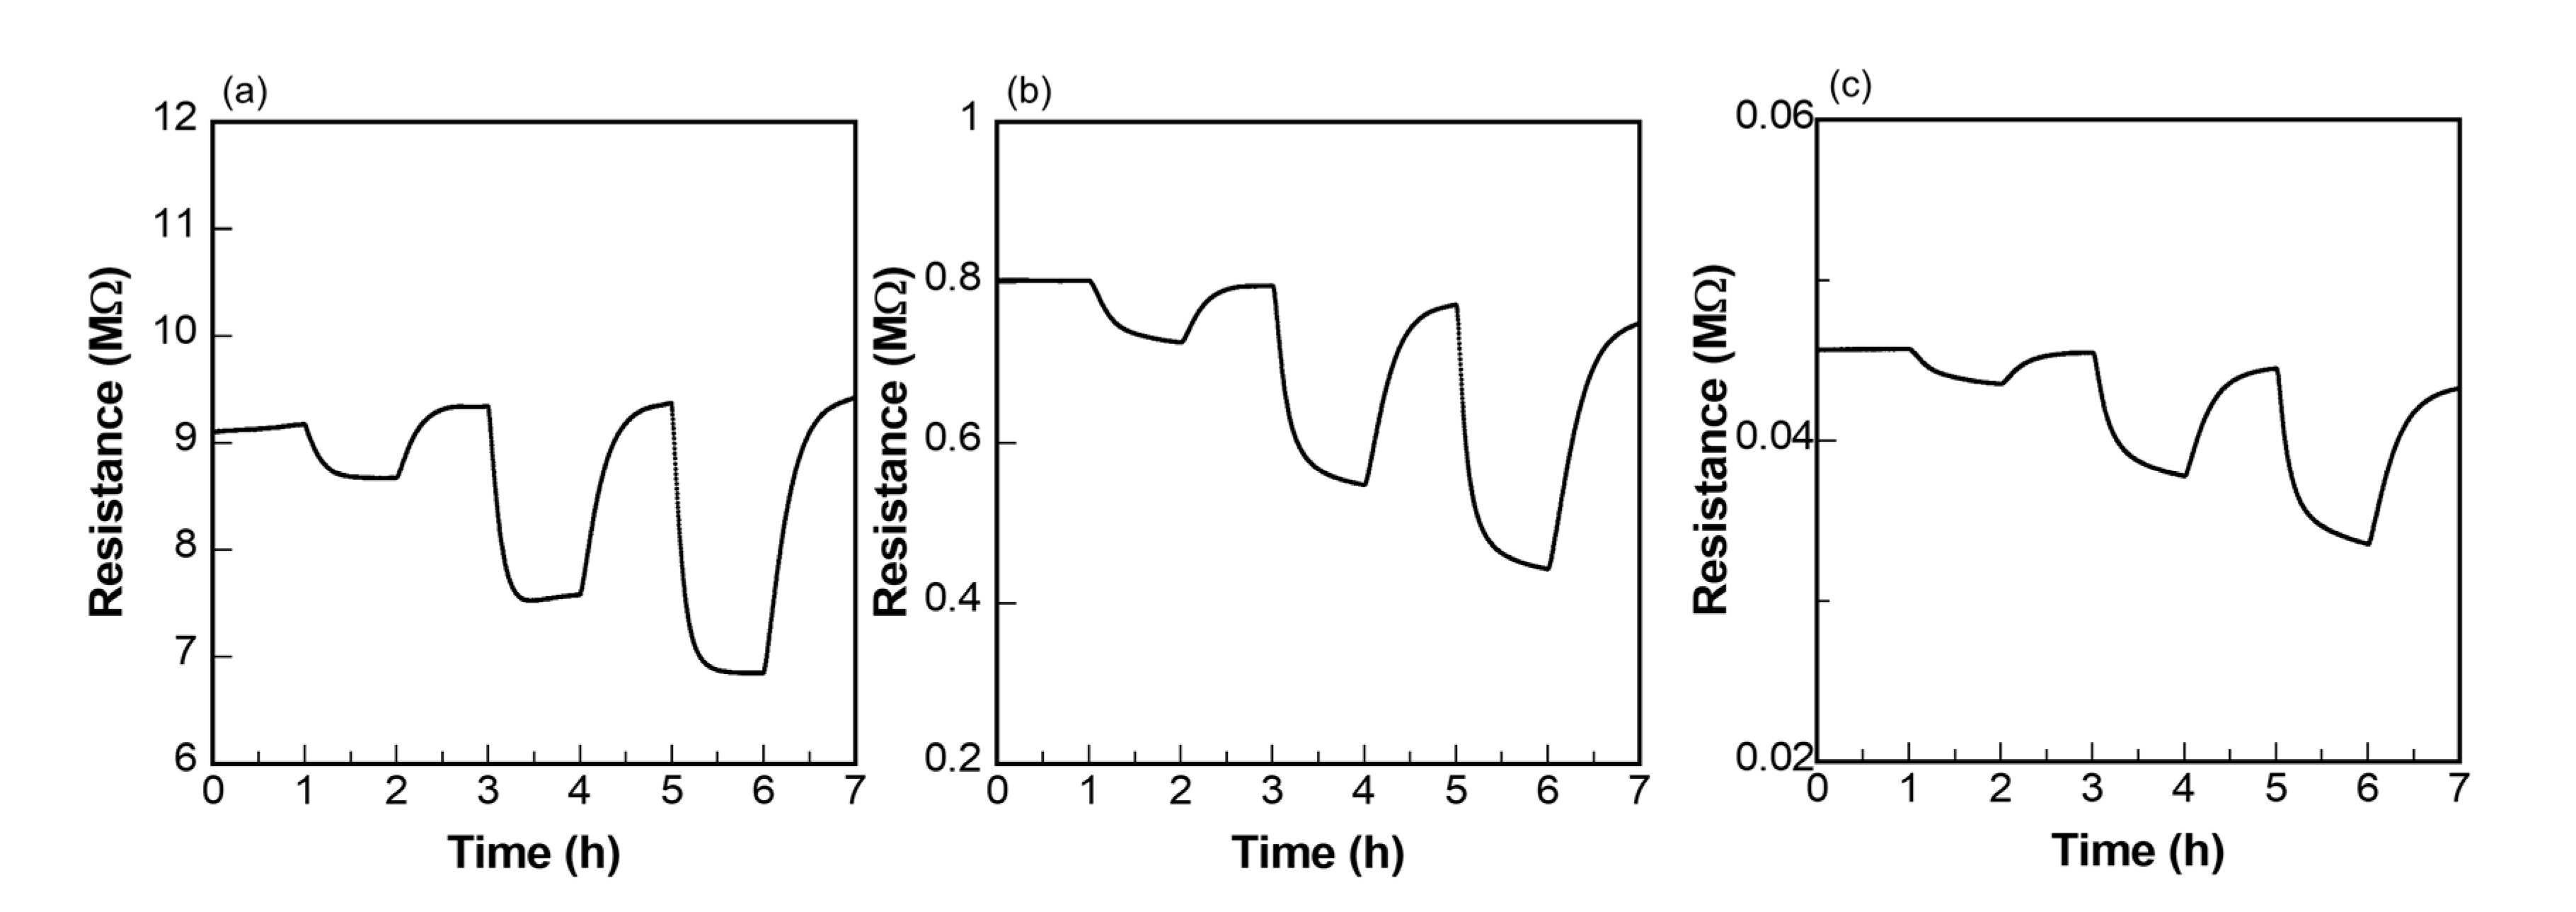
Figure 5 shows the CH3SH gas (50, 250, and 500 ppb) response characteristics of the 1.5 VWT, 3 VWT, and 10 VWT gas sensors at 300 °C. The resistance of all sensors began to decrease with CH3SH exposure. This is the response of a typical n-type semiconductor gas sensor. All gas sensors showed a clear response, even at 50 ppb CH3SH. The resistance of all sensors decreased with increasing CH3SH gas concentration. The response of the n-type semiconductor gas sensor to H2S gas was similar.
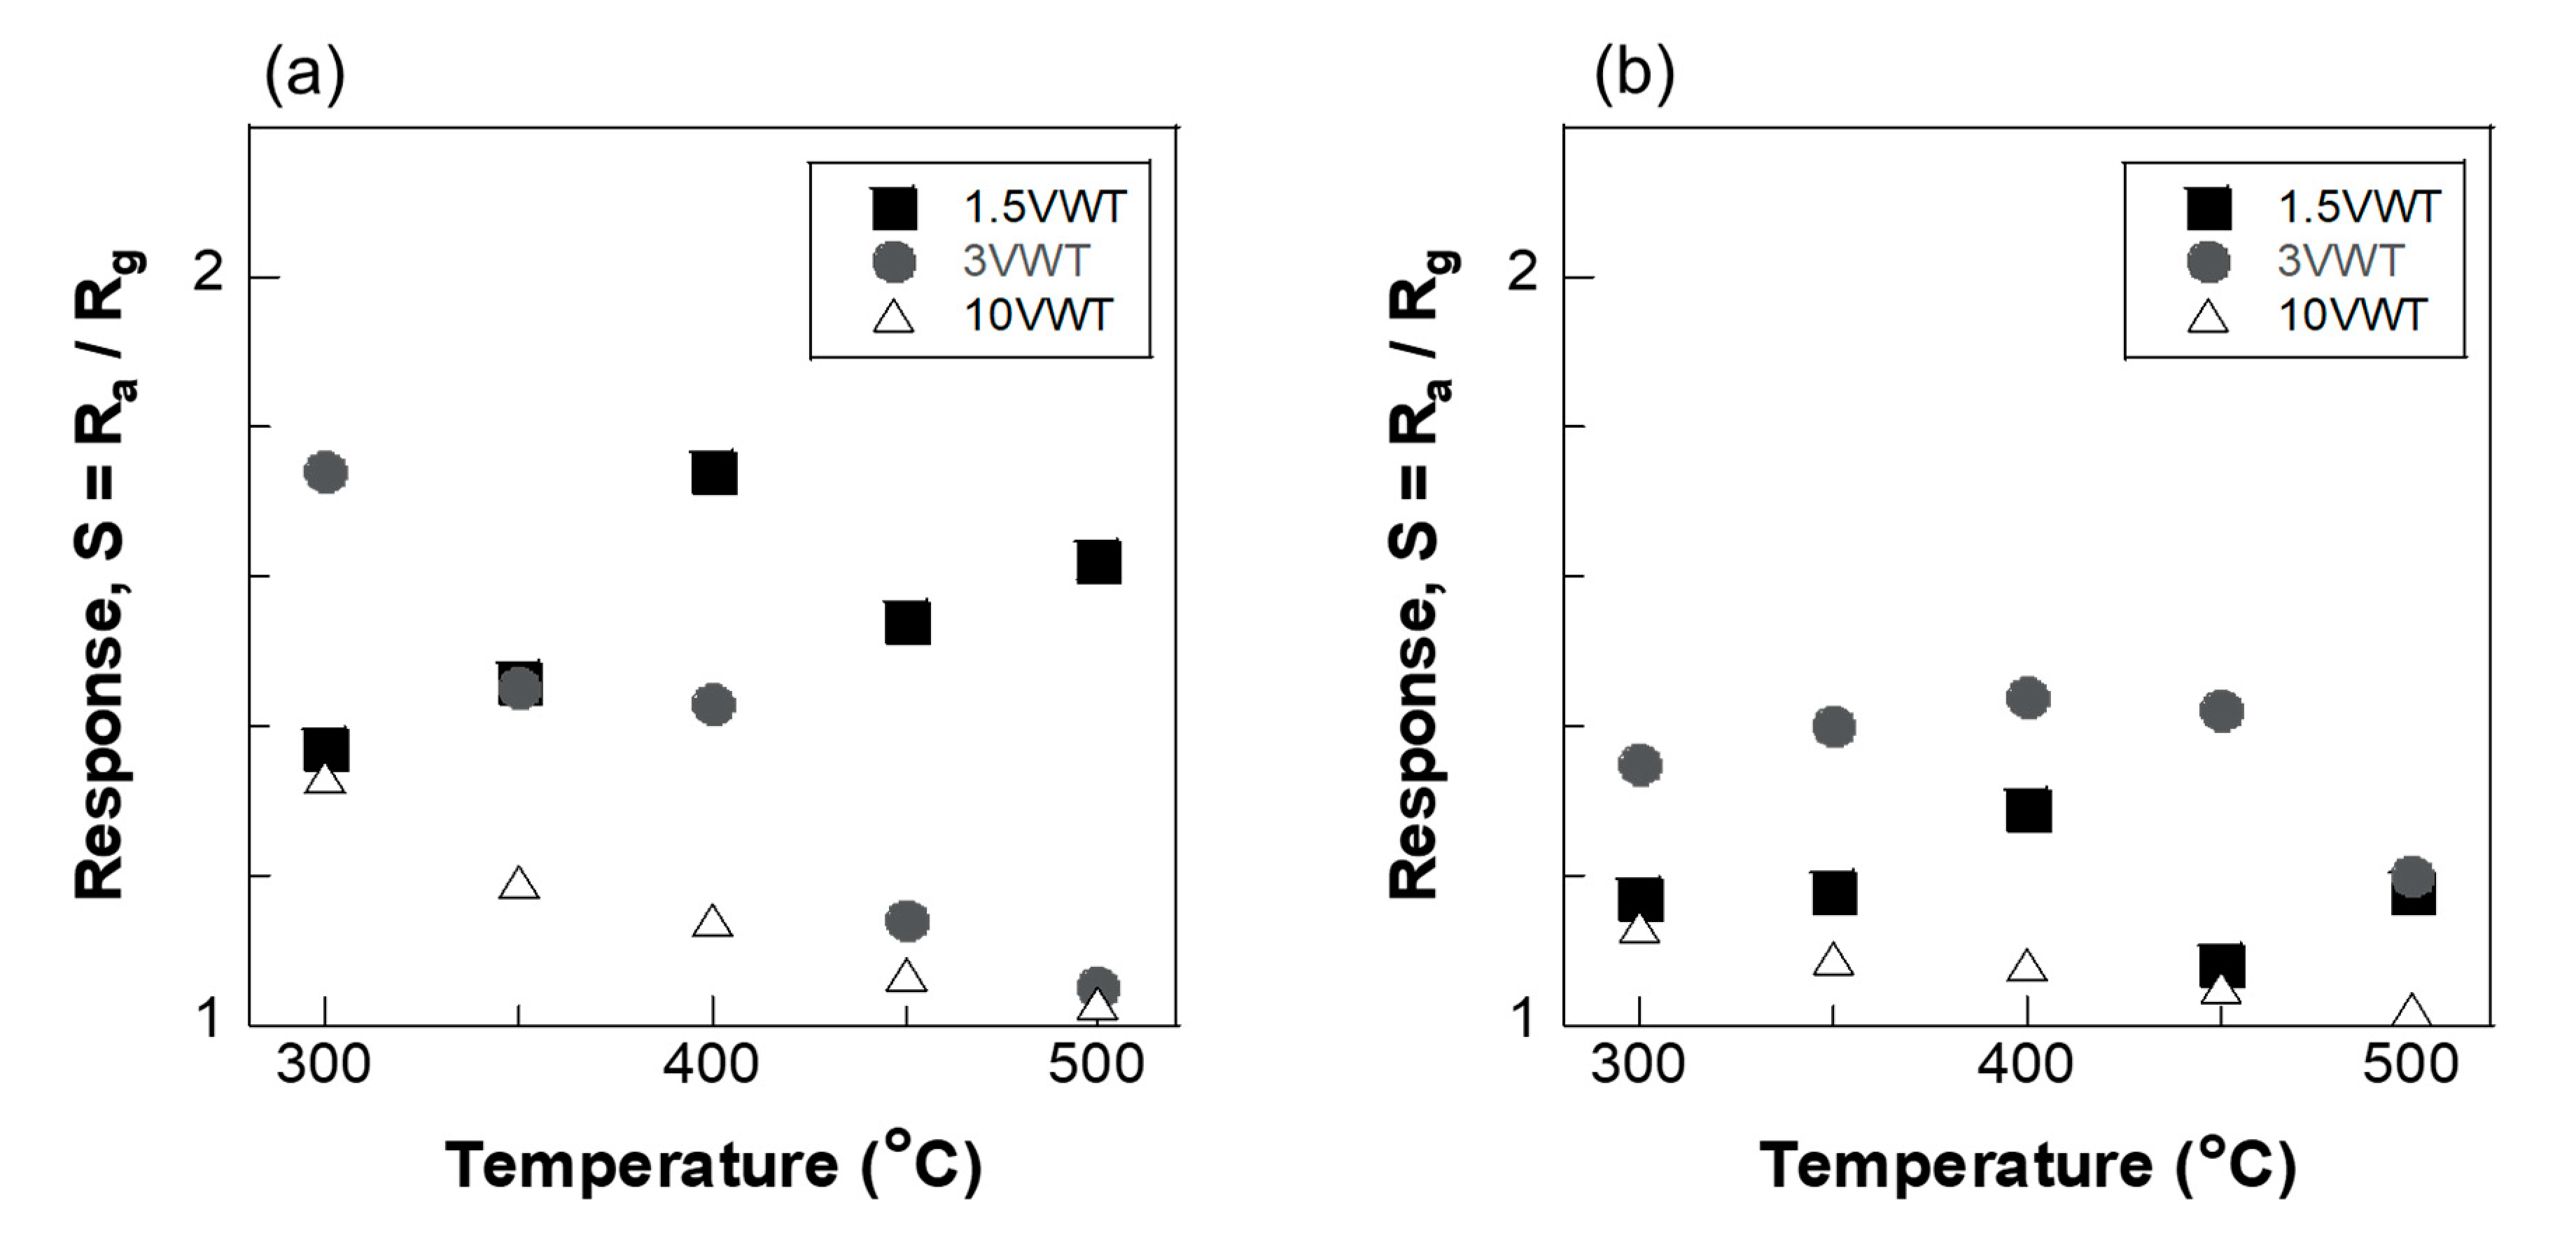
Figure 6 shows the relationship between the response value to 500 ppb CH3SH and 500 ppb H2S and operating temperature. High CH3SH response values (S = 1.74, 1.74, and 1.33) were obtained for the 1.5 VWT, 3 VWT, and 10 VWT gas sensors at 400, 300, and 300 °C, respectively. In addition, high H2S response values (S = 1.29, 1.44, and 1.13) were obtained for the 1.5 VWT, 3 VWT, and 10 VWT gas sensors at 400, 400, and 300 °C, respectively. The response to CH3SH was higher than that to H2S. The reaction mechanism between the CH3SH and H2S gases and the oxygen (O22−) adsorbed on the surface of VWT is expected to be as follows:
CH3SH + 3O22− → CO2 + 2H2O + SO2 + 6e−
H2S + 3/2O22− → H2O + SO2 + 3e−
Equation (1) shows that 1 mol of CH3SH reacts with the adsorbed oxygen to form 6 mol of conduction electrons (e−). Equation (2) shows that 1 mol of H2S reacts with the adsorbed oxygen to form 3 mol of e−. The generated e− moves to VWT and reduces the sensor resistance. Therefore, if the reaction rates of CH3SH and H2S with the adsorbed oxygen are almost the same, it is considered that the response to CH3SH is higher than that to H2S. The 10 VWT gas sensor showed smaller response values to the CH3SH and H2S gases. As V2O5 oxidizes SO2 to SO3, it is thought that the oxidation of the SO2 generated from CH3SH and H2S leads to a decreased sensor response [15].
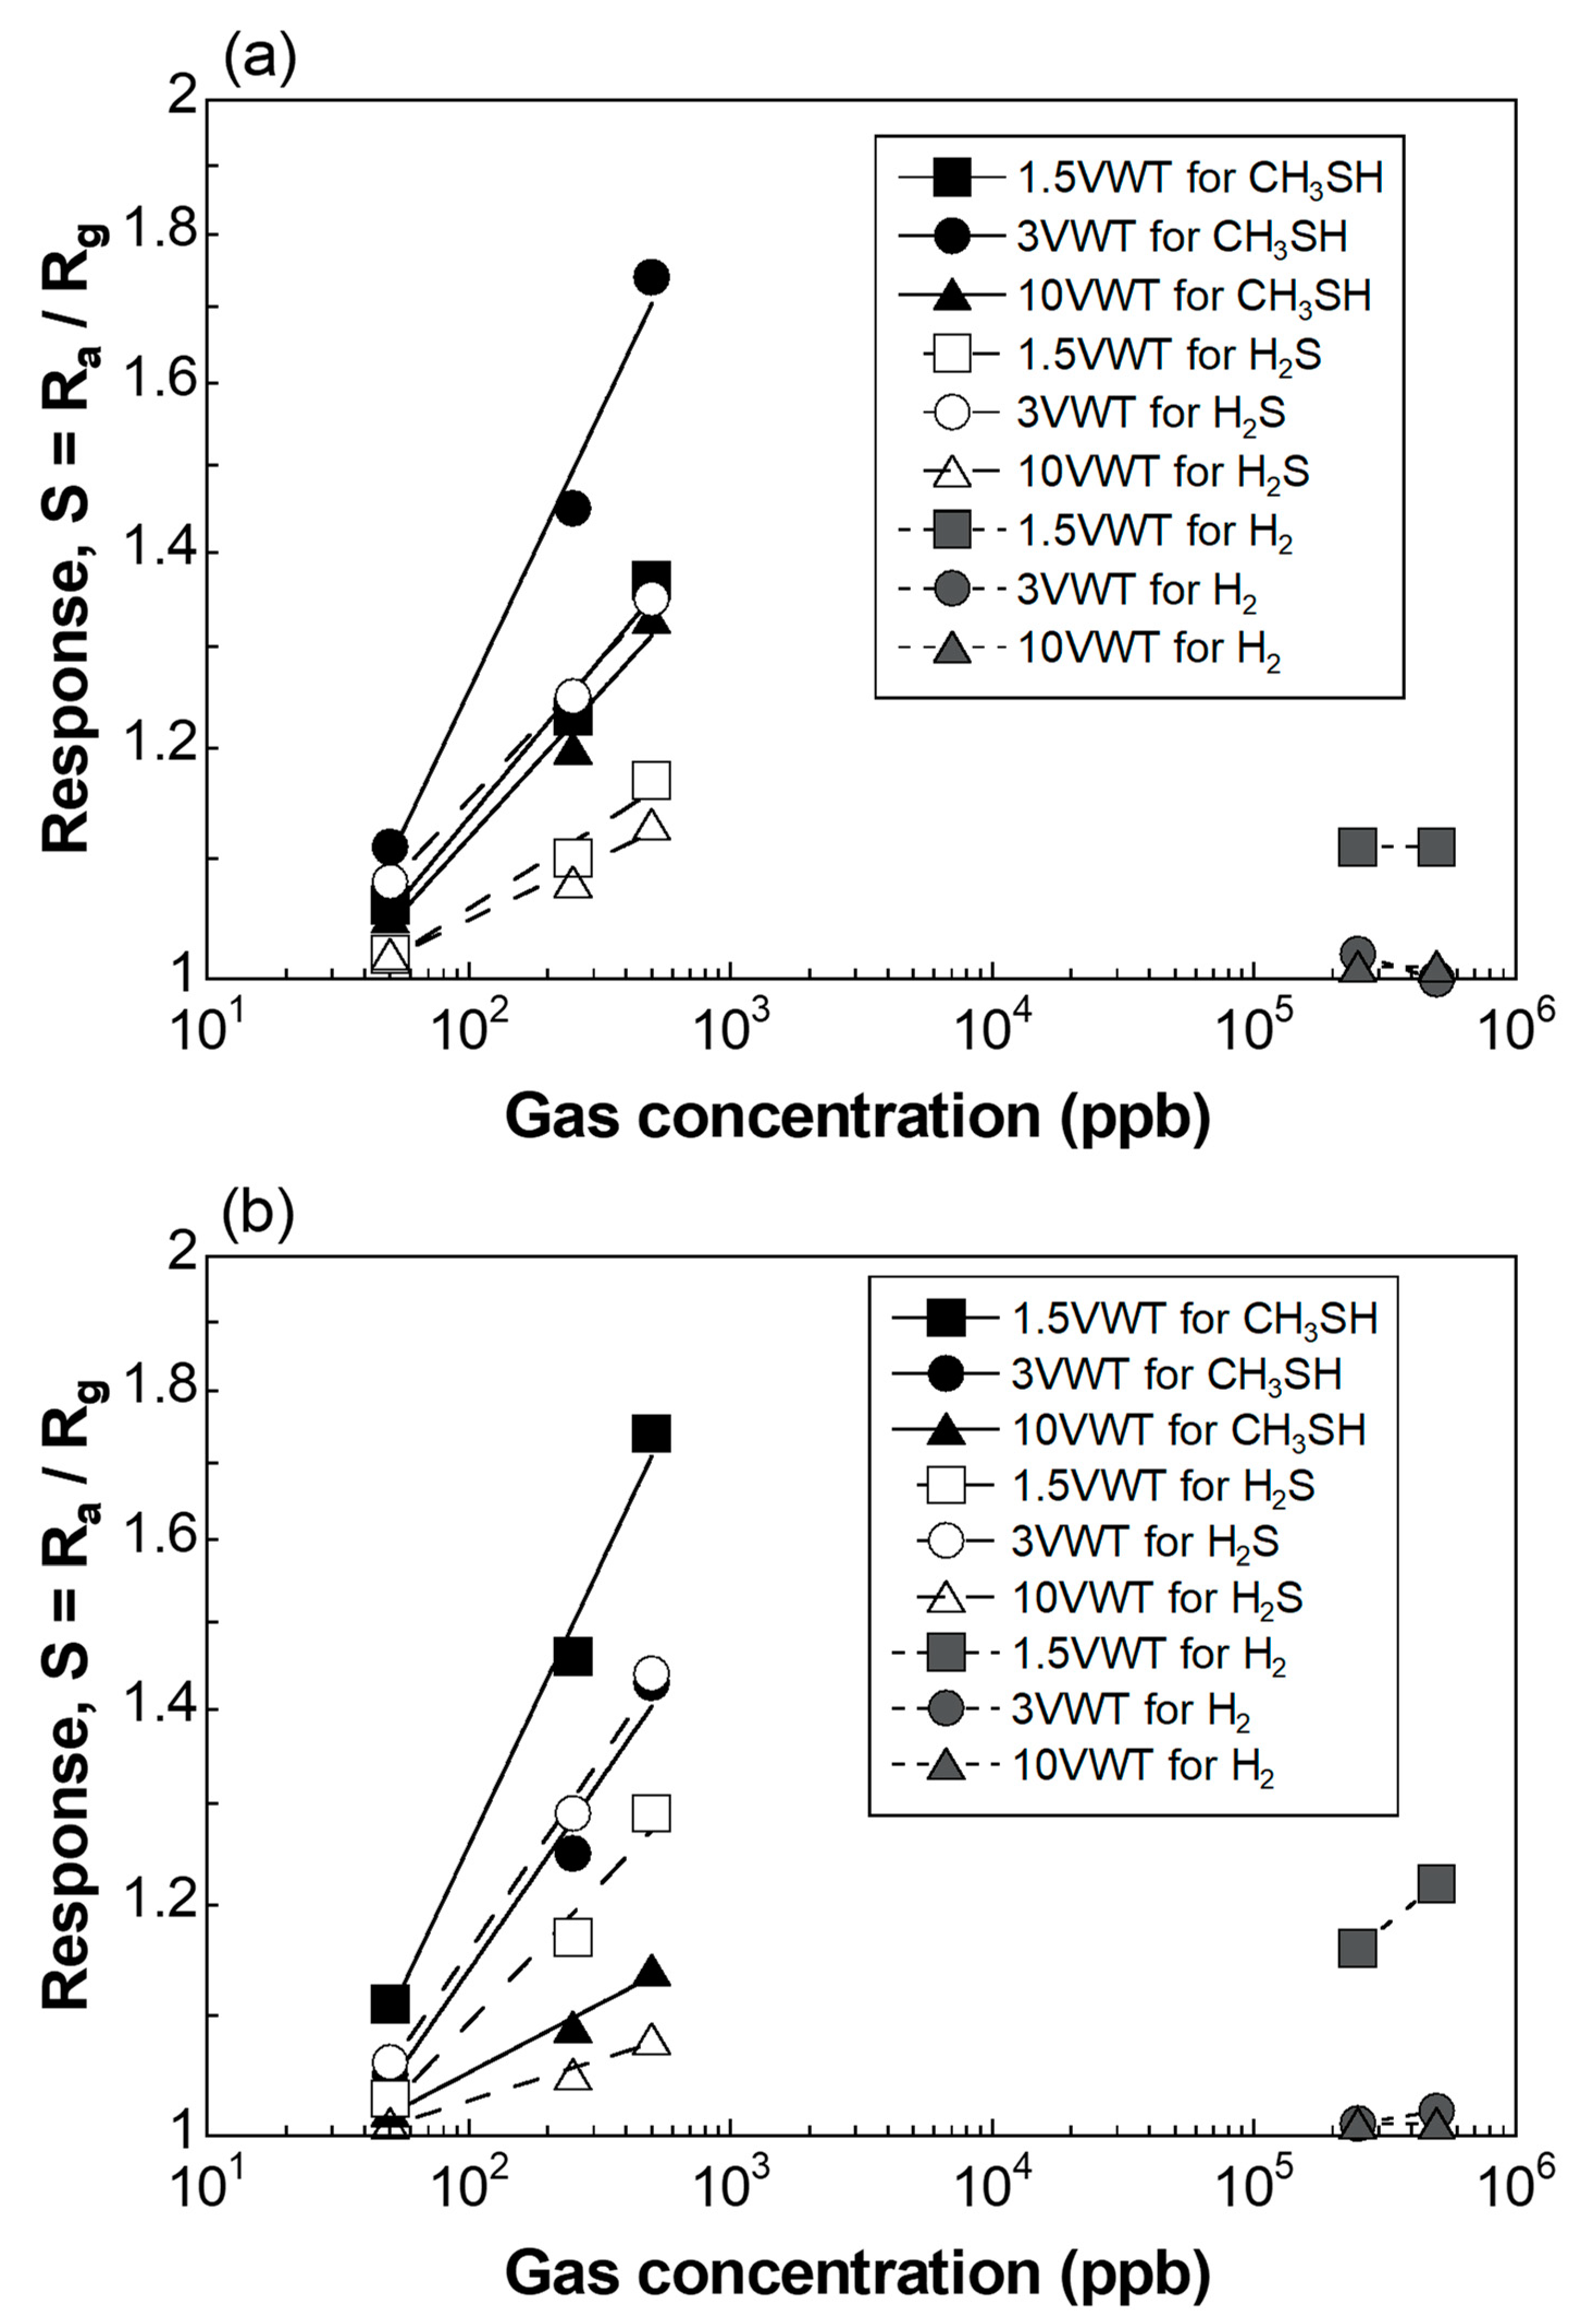
Figure 7 shows the relationship between the response value and CH3SH, H2S, and H2 gas concentrations at 300 and 400 °C. At 300 °C, the CH3SH response value of the 3 VWT gas sensor was large. At 400 °C, the CH3SH response value of the 1.5 VWT gas sensor was also large. The 1.5 VWT gas sensor showed a slight response to H2 gas with S = 1.1–1.22. On the other hand, the 3 VWT and 10 VWT gas sensors showed no response to H2 gas with S = 1.00 and S = 1.02, respectively. Since the H2 gas response decreased with increasing V2O5 content in VWT, V2O5 seems to suppress the response to H2 gas. We will investigate the mechanism of suppressing the H2 gas response by V2O5 in the future.
It was found that at 300 °C, the 3 VWT gas sensor had good gas selectivity against H2 gas and a high CH3SH response of 500 ppb (S = 1.74). This CH3SH response value is smaller than that of the WO3 gas sensor in earlier reports [10,11]. In this study, the H2S, CH3SH, and H2 gas response characteristics in dry atmosphere were measured only once. The long-term stability, reproducibility, and influence of humidity will be investigated in a future study. Although it is necessary to improve the CH3SH response value, it is considered that the 3 VWT gas sensor has a high potential as a gas sensor for the detection of halitosis because it has excellent gas selectivity against H2 gas.
4. Conclusions
In this study, CH3SH and H2S gas sensors using VWT as a sensitive film were prepared, and their sensing characteristics were investigated. The synthesized VWT particles had a diameter of several tens of nanometers, and no V-W-Ti-O composite oxide was formed. The CH3SH response value of the VWT gas sensor was higher than the H2S response value. The 3 VWT gas sensor showed high CH3SH and H2S gas responses and good gas selectivity against H2 gas.
Author Contributions
Conceptualization, T.A., T.I., A.T. and Y.M.; methodology, T.A.; validation, T.A.; formal analysis, T.A., T.I., A.T. and Y.M.; investigation, T.A.; resources, T.A., T.I., A.T. and Y.M.; data curation, T.A., T.I. and A.T.; writing—original draft preparation, T.A.; writing—review and editing, T.A.; visualization, T.A.; supervision, T.A. and Y.M.; project administration, T.A. and Y.M. All authors have read and agreed to the published version of the manuscript.
Funding
This research received no external funding.
Institutional Review Board Statement
Not applicable.
Informed Consent Statement
Not applicable.
Data Availability Statement
Not applicable.
Acknowledgments
We express our sincere thanks to Ayako Uozumi of AIST for her valuable support in the BET analysis.
Conflicts of Interest
The authors declare no conflict of interest.
References
- Behall, K.M.; Scholfield, D.J.; van der Sluijs, A.M.; Hallfrisch, J. Breath Hydrogen and Methane Expiration in Men and Women After Oat Extract Consumption. J. Nutr. 1998, 128, 79–84. [Google Scholar] [CrossRef] [PubMed] [Green Version]
- Roberge, M.T.; Finley, J.W.; Lukaski, H.C.; Borgerding, A.J. Evaluation of the Pulsed Discharge Helium Ionization Detector for the Analysis of Hydrogen and Methane in Breath. J. Chromatogr. A 2004, 1027, 19–23. [Google Scholar] [CrossRef] [PubMed]
- Fuchs, P.; Loeseken, C.; Schubert, J.K.; Miekisch, W. Breath Gas Aldehydes as Biomarkers of Lung Cancer. Int. J. Cancer 2010, 126, 2663–2670. [Google Scholar] [CrossRef] [PubMed]
- Shimura, M.; Watanabe, S.; Iwakura, M.; Oshikiri, Y.; Kusumoto, M.; Ikawa, K.; Sakamoto, S. Correlation Between Measurements Using a New Halitosis Monitor and Organoleptic Assessment. J. Periodontol. 1997, 68, 1182–1185. [Google Scholar] [CrossRef] [PubMed]
- Shin, W. Medical Applications of Breath Hydrogen Measurements. Anal. Bioanal. Chem. 2014, 406, 3931–3939. [Google Scholar] [CrossRef] [PubMed]
- Su, Y.; Wang, J.; Wang, B.; Yang, T.; Yang, B.; Xie, G.; Zhou, Y.; Zhang, S.; Tai, H.; Cai, Z.; et al. Alveolus-Inspired Active Membrane Sensors for Self-Powered Wearable Chemical Sensing and Breath Analysis. ACS Nano 2020, 14, 6067–6075. [Google Scholar] [CrossRef] [PubMed]
- Jha, R.K.; D’Costa, J.V.; Sakhuja, N.; Bhat, N. MoSe2 Nanoflakes Based Chemiresistive Sensors for ppb-Level Hydrogen Sulfide Gas Detection. Sens. Actuators B 2019, 297, 126687. [Google Scholar] [CrossRef] [Green Version]
- Li, Z.; Wang, N.; Lin, Z.; Wang, J.; Liu, W.; Sun, K.; Fu, Y.Q.; Wang, Z. Room-Temperature High-Performance H2S Sensor Based on Porous CuO Nanosheets Prepared by Hydrothermal Method. ACS Appl. Mater. Interfaces 2016, 8, 20962–20968. [Google Scholar] [CrossRef] [PubMed]
- Sarfraz, J.; Fogde, A.; Ihalainen, P.; Peltonen, J. The Performance of Inkjet-Printed Copper Acetate Based Hydrogen Sulfide Gas Sensor on a Flexible Plastic Substrate–Varying Ink Composition and Print Density. Appl. Surf. Sci. 2018, 445, 89–96. [Google Scholar] [CrossRef]
- Ando, M.; Suto, S.; Suzuki, T.; Tsuchida, T.; Nakayama, C.; Miura, N.; Yamazoe, N. H2S and CH3SH Sensor Using a Thick Film of Gold-Loaded Tungsten Oxide. Chem. Lett. 1994, 23, 335–338. [Google Scholar] [CrossRef]
- Ueda, T.; Maeda, T.; Huang, Z.; Higuchi, K.; Izawa, K.; Kamada, K.; Hyodo, T.; Shimizu, Y. Enhancement of Methylmercaptan Sensing Response of WO3 Semiconductor Gas Sensors by Gas Reactivity and Gas Diffusivity. Sens. Actuators B 2018, 273, 826–833. [Google Scholar] [CrossRef]
- Izu, N.; Hagen, G.; Schönauer, D.; Röder-Roith, U.; Moos, R. Application of V2O5/WO3/TiO2 for Resistive-Type SO2 Sensors. Sensors 2011, 11, 2982–2991. [Google Scholar] [CrossRef] [PubMed] [Green Version]
- Izu, N.; Hagen, G.; Schubert, F.; Schönauer, D.; Moos, R. Effect of a Porous Pt/Alumina Cover Layer for V2O5/WO3/TiO2 Resistive SO2 Sensing Materials. J. Ceram. Soc. Jpn. 2013, 121, 734–737. [Google Scholar] [CrossRef] [Green Version]
- Suttiponparnit, K.; Jiang, J.; Sahu, M.; Suvachittanont, S.; Charinpanitkul, T.; Biswas, P. Role of Surface Area, Primary Particle Size, and Crystal Phase on Titanium Dioxide Nanoparticle Dispersion Properties. Nanoscale Res. Lett. 2011, 6, 27. [Google Scholar] [CrossRef] [PubMed] [Green Version]
- Dunn, J.P.; Koppula, P.R.; Stenger, H.G.; Wachs, I.E. Oxidation of Sulfur Dioxide to Sulfur Trioxide Over Supported Vanadia Catalysts. Appl. Catal. B 1998, 19, 103–117. [Google Scholar] [CrossRef]
Figure 1.
Schematic illustration of the V2O5/WO3/TiO2 (VWT) sensor.

Figure 2.
XRD patterns of 1.5 VWT, 3 VWT, and 10 VWT particles.

Figure 3.
SEM photographs of (a) 1.5 VWT, (b) 3 VWT, and (c) 10 VWT particles.

Figure 4.
Arrhenius plots of the resistance in dry air (Ra) of the 1.5 VWT, 3 VWT, and 10 VWT gas sensors.
Figure 4.
Arrhenius plots of the resistance in dry air (Ra) of the 1.5 VWT, 3 VWT, and 10 VWT gas sensors.

Figure 5.
CH3SH gas (50, 250, and 500 ppb) response characteristics of the (a) 1.5 VWT, (b) 3 VWT, and (c) 10 VWT gas sensors at 300 °C.
Figure 5.
CH3SH gas (50, 250, and 500 ppb) response characteristics of the (a) 1.5 VWT, (b) 3 VWT, and (c) 10 VWT gas sensors at 300 °C.

Figure 6.
Relationship between the response values (S) to (a) 500 ppb CH3SH and (b) 500 ppb H2S and operating temperature. S was calculated as the ratio of the resistance in dry air before (Ra) and after (Rg) sample gas exposure.
Figure 6.
Relationship between the response values (S) to (a) 500 ppb CH3SH and (b) 500 ppb H2S and operating temperature. S was calculated as the ratio of the resistance in dry air before (Ra) and after (Rg) sample gas exposure.

Figure 7.
Relationship between the response value S and CH3SH, H2S, and H2 gas concentrations at (a) 300 and (b) 400 °C. S was calculated as the ratio of the resistance in dry air before (Ra) and after (Rg) sample gas exposure.
Figure 7.
Relationship between the response value S and CH3SH, H2S, and H2 gas concentrations at (a) 300 and (b) 400 °C. S was calculated as the ratio of the resistance in dry air before (Ra) and after (Rg) sample gas exposure.

Publisher’s Note: MDPI stays neutral with regard to jurisdictional claims in published maps and institutional affiliations. |
© 2021 by the authors. Licensee MDPI, Basel, Switzerland. This article is an open access article distributed under the terms and conditions of the Creative Commons Attribution (CC BY) license (https://creativecommons.org/licenses/by/4.0/).
Share and Cite
MDPI and ACS Style
Akamatsu, T.; Itoh, T.; Tsuruta, A.; Masuda, Y. CH3SH and H2S Sensing Properties of V2O5/WO3/TiO2 Gas Sensor. Chemosensors 2021, 9, 113. https://0-doi-org.brum.beds.ac.uk/10.3390/chemosensors9050113
AMA Style
Akamatsu T, Itoh T, Tsuruta A, Masuda Y. CH3SH and H2S Sensing Properties of V2O5/WO3/TiO2 Gas Sensor. Chemosensors. 2021; 9(5):113. https://0-doi-org.brum.beds.ac.uk/10.3390/chemosensors9050113
Chicago/Turabian StyleAkamatsu, Takafumi, Toshio Itoh, Akihiro Tsuruta, and Yoshitake Masuda. 2021. "CH3SH and H2S Sensing Properties of V2O5/WO3/TiO2 Gas Sensor" Chemosensors 9, no. 5: 113. https://0-doi-org.brum.beds.ac.uk/10.3390/chemosensors9050113
Note that from the first issue of 2016, this journal uses article numbers instead of page numbers. See further details here.