Article

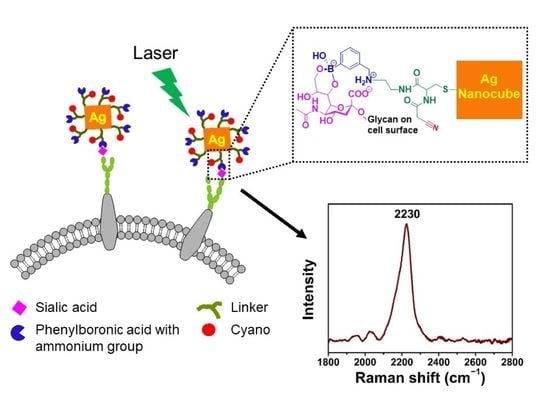
Development of a Tri-Functional Nanoprobe for Background-Free SERS Detection of Sialic Acid on the Cell Surface

1
Institute of Biological Chemistry, Academia Sinica, No. 128, Academia Road, Section 2, Nankang, Taipei 11529, Taiwan
2
Chemical Biology and Molecular Biophysics, Taiwan International Graduate Program, Institute of Biological Chemistry, Academia Sinica, No. 128, Academia Road, Section 2, Nankang, Taipei 11529, Taiwan
3
Institute of Bioinformatics and Structural Biology, College of Life Science, National Tsing Hua University, No. 101, Section 2, Kuang-Fu Road, Hsinchu 300044, Taiwan
4
Department of Chemistry, National Tsing Hua University, No. 101, Section 2, Kuang-Fu Road, Hsinchu 300044, Taiwan
5
Department of Physics, National Taiwan University, No. 1, Section 4, Roosevelt Road, Taipei 10617, Taiwan
6
Department of Chemistry and Institute of Biochemical Sciences, National Taiwan University, No. 1, Section 4, Roosevelt Road, Taipei 10617, Taiwan
*
Author to whom correspondence should be addressed.
Submission received: 25 March 2021 / Revised: 18 April 2021 / Accepted: 21 April 2021 / Published: 26 April 2021
(This article belongs to the Special Issue Latest Advances in Nanobiosensors: Novel Materials and Applications)

Abstract

:
Sialic acid (SA) on the surface of cells is indispensable in numerous physiological and pathological processes, and sensitive and reproducible detection of SA is crucial for diagnosis and therapy in many diseases. Here, we developed a tri-functional nanoprobe as a sensitive and straightforward surface-enhanced Raman spectroscopy (SERS) nanoprobe for sialoglycan detection on cell surfaces. The reporter was designed to provide three key functionalities that make it ideal for SA detection. First, we employed two recognition groups, phenylboronic acid and an ammonium group, that enhance SA recognition and capture efficiency. Second, we used cyano as the Raman reporter because it emits in the cellular Raman silent region. Finally, thiol acted as an anchoring agent to conjugate the reporter to silver nanocubes to provide SERS enhancement. Our molecular nanoprobe design demonstrated the ability to detect SA on the cell surface with high sensitivity and spatial resolution, opening up new routes to cellular diagnostics.

Graphical Abstract

1. Introduction

Sialic acid (SA), also known as N-acetylneuraminic acid, is an acidic monosaccharide with a nine-carbon backbone and is typically located at the outermost end of cell surface glycoproteins. Because of its location and ubiquitous distribution, SA is pivotal in mediating and modulating numerous physiological and pathological activities, such as cell–cell communication, intercellular adhesion, immunological responses, cancer metastasis, and bacterial and viral infections [1]. Furthermore, SA serves as a binding site for various pathogens and toxins [2,3], and changes in SA level and expression usually signal pathological conditions. For example, overexpression of SA on the cell surface is linked to malignancy and cancer metastasis [4]. Several SA-containing carbohydrate antigens have been identified as cancer biomarkers that are useful for early stage diagnosis and effective prognosis during treatment [5,6,7].
Surface-enhanced Raman spectroscopy (SERS) is a powerful detection tool with great potential for diagnostics because of advantages that include simple sample preparation, high selectivity and sensitivity, and fingerprinting capability on chemical structures [8,9]. The SERS mechanism, relying on electromagnetic and chemical enhancement, can amplify the signals of Raman spectra by several orders of magnitude (107–1010) [10].
Significant effort has targeted detection of SA on cell surfaces using SERS nanoprobes [11,12,13,14,15,16]. A typical SERS nanoprobe requires the following components: (i) A metallic nanoparticle to enhance the Raman signal, thus increasing the sensitivity; (ii) a Raman reporter with few and easily recognizable characteristic Raman bands [17]; (iii) a functional group to anchor onto the metallic nanoparticle surface through chemisorption; and (iv) a recognition molecule for specific binding to the target molecule [18].
Recently, mercaptophenylboronic acid (MPBA) was used as an effective recognition molecule to capture the cell surface SA, which was labeled by bioorthogonal Raman reporters, chosen because of their advantage of having Raman signal in Raman silent regions of cells (1800–2800 cm−1). However, this method was limited to examining and visualizing the artificial SA on the cell surface and could not be applied to native conditions [11]. Furthermore, 3-D Raman mapping was successfully applied to visualize the probe distribution and SA expression at the single-cell level [12]. The authors engaged alkyne-bridged gold nanoparticle (AuNP) dimers to yield a background-free Raman reporter at hot spots of the gapped AuNP dimer, with PEG-modified phenylboronic acid as the capturing agent [12]. However, in addition to the multiple steps needed to prepare the alkyne linker, this method involves the sophisticated assembly of AuNP dimers. Very recently, quantitative detection of SA on the surface of a single HeLa cell was done by modifying the silver nanoparticle surface with 4-mercaptobenzenitrile and 4-MPBA in an equimolar ratio [13]. The cyano moiety of 4-mercaptobenzenitrile was used as a Raman reporter that exhibited signals in the cellular Raman silent region, and the 4-MPBA was employed to capture the SA on the cell surface. However, it is not trivial to control the conjugation of the Raman reporter and recognition agent to the surface of nanoparticles to obtain a reproducible Raman signal. Thus, it is necessary to develop a simple, reliable, and free-background nanoprobe for probing natural SA-containing carbohydrates on the cell surface.
In this work, we employed a tri-functional nanoprobe that contained silver nanocubes (AgNCs) for Raman signal enhancement and introduced a carefully designed and synthesized reporter that combined a Raman reporter, recognition moiety, and anchor in one small molecule, for simple, reliable, and noise-free SERS detection of SA on the cell surface. The reporter consists of a boronic acid with an additional positive charge for enhanced SA binding, a cyano group with a vibrational signature in the Raman silent region, and a thiol as an anchor that binds to the surface of AgNCs. The resulting nanoprobes permit visualization of the spatial distribution of SA on HeLa cell surfaces with high resolution.

2. Materials and Methods

2.1. Chemicals and Reagents

Silver trifluoroacetate (CF3COOAg, 99.9%), sodium hydrosulfide (NaHS.xH2O, ≥60% NaHS), poly(vinyl pyrrolidone) (PVP, Mw~55,000), hydrochloric acid (HCl, 32%), 3-formylphenylboronic acid, and 4 M HCl in 1,4-dioxane were obtained from Sigma-Aldrich (MilliporeSigma, MA, USA). Ethylene glycol (EG, ≥99%) was purchased from J. T. Baker (Phillipsburg, NJ, USA). Cyanoacetic acid and phenylboronic acid (PBA) were purchased from Tokyo Chemical Industry (TCI, in Tokyo, Japan). Sodium borohydride (NaBH4) and N,N’-diisopropyl carbodiimide (N,N’-DIC) were obtained from Acros Organics (Morris Plains, NJ, USA). N-Boc-ethylenediamine was bought from Alfa-Aesar (Powai, Mumbai, India), piperidine from Merck, Oxyma from Fluorochem (Hadfield, UK), and Fmoc-S-trityl-L-cysteine from Combi-Blocks (San Diego, CA, USA). All reagents were used without further purification. Deionized distilled (dd) water from a Millipore system was used for all experiments. Sialidase (neuraminidase) from Arthrobacter ureafaciens was purchased from Merck (Mannheim, Germany).

2.2. Instruments and Characterization

The size and morphology of AgNCs were characterized by employing scanning electron microscopy (SEM) (FEI NOVA-600), operated at an accelerating voltage of 15 kV. The X-ray diffraction (XRD) pattern was recorded using a Bruker D8 advance X-ray diffractometer, 2θ from 35° to 90° with a scan rate of 0.05 degrees per step. UV-Vis absorption spectra were acquired using Perkin Elmer Enspire Multimode Plate Reader. The spectra were recorded from 300 nm to 900 nm in steps of 1 nm. Dynamic light scattering (DLS) and zeta potential were determined using a Zeta sizer Nano ZS (Malvern Instruments, Malvern, UK) equipped with a 633-nm laser. Disposable folded capillary cells (Malvern DT1070) were used to perform the measurements, and the data analysis was done using Zetasizer software. For particle size, we report the z-average diameter (the mean hydrodynamic diameter), and zeta-potential values were estimated from the measured electrophoretic mobility data using the Smoluchowski equation (Malvern Instruments Ltd., Malvern, UK). 1H NMR (nuclear magnetic resonance) spectra were recorded on a Bruker AVII-500 (500 MHz) spectrometer with the H2O peak in CD3OD (δH = 4.87 ppm) as an internal standard. 13C NMR spectra were recorded on an AVII-500 (125 MHz) spectrometer using CD3OD (δC = 49.15 ppm, central line of a septet) as the internal standard. Structural assignments were made with additional information from 2-D homonuclear correlation spectroscopy, 2-D heteronuclear multiple-quantum correlation spectroscopy, and 2-D heteronuclear multiple-bond correlation spectroscopy experiments using gradient pulses for coherence pathway selection, which were acquired on a Bruker AVII-500 spectrometer. High-resolution mass spectroscopy (HRMS) data were generated using a Bruker Bio-TOF III (ESI-TOF) or Bruker Ultraflex (i.e., MALDI-TOF/TOF) spectrometer and are reported as mass/charge (m/z) ratios with percentage relative abundance. Analytical thin-layer chromatography was performed on pre-coated glass plates of thin layer chromatography Silica gel 60 F254 from Merck. For detection, we used UV-Vis (254 nm) and/or staining with reagents containing ceric molybdate (for general use) or ninhydrin (for samples containing amino groups). Raman and SERS spectra were obtained from a home-built micro Raman system with 532-nm laser excitation at room temperature (RT).

2.3. Synthesis of AgNCs

AgNCs were synthesized via the polyol method using CF3COOAg as the silver precursor and EG as the solvent and reducing agent. A total of 5 mL of EG was heated at 150 °C without reflux for 40 min under mild stirring. NaHS (3 mM in EG, 60 µL) was added into the heated EG. After 2 min, HCl (3 mM in EG, 450 µL) was then rapidly injected into the heated solution, followed by the addition of PVP (20 mg/mL in EG, 1250 µL). After another 2 min, CF3COOAg (282 mM in EG, 400 µL) was injected into the mixture. The mixture was kept at 150 °C for 1 h and then quenched by placement in an ice-water bath. The product was centrifuged at 12,000 rpm for 20 min at 20 °C and washed with acetone (1×) and ethanol (2×) to remove the excess EG and PVP, respectively. The product AgNCs with an edge length of ~48 nm were re-dispersed in 3 mL isopropanol and stored at 4 °C for further use. The characterization of synthesized AgNCs was done by UV-Vis spectroscopy, XRD, and SEM.

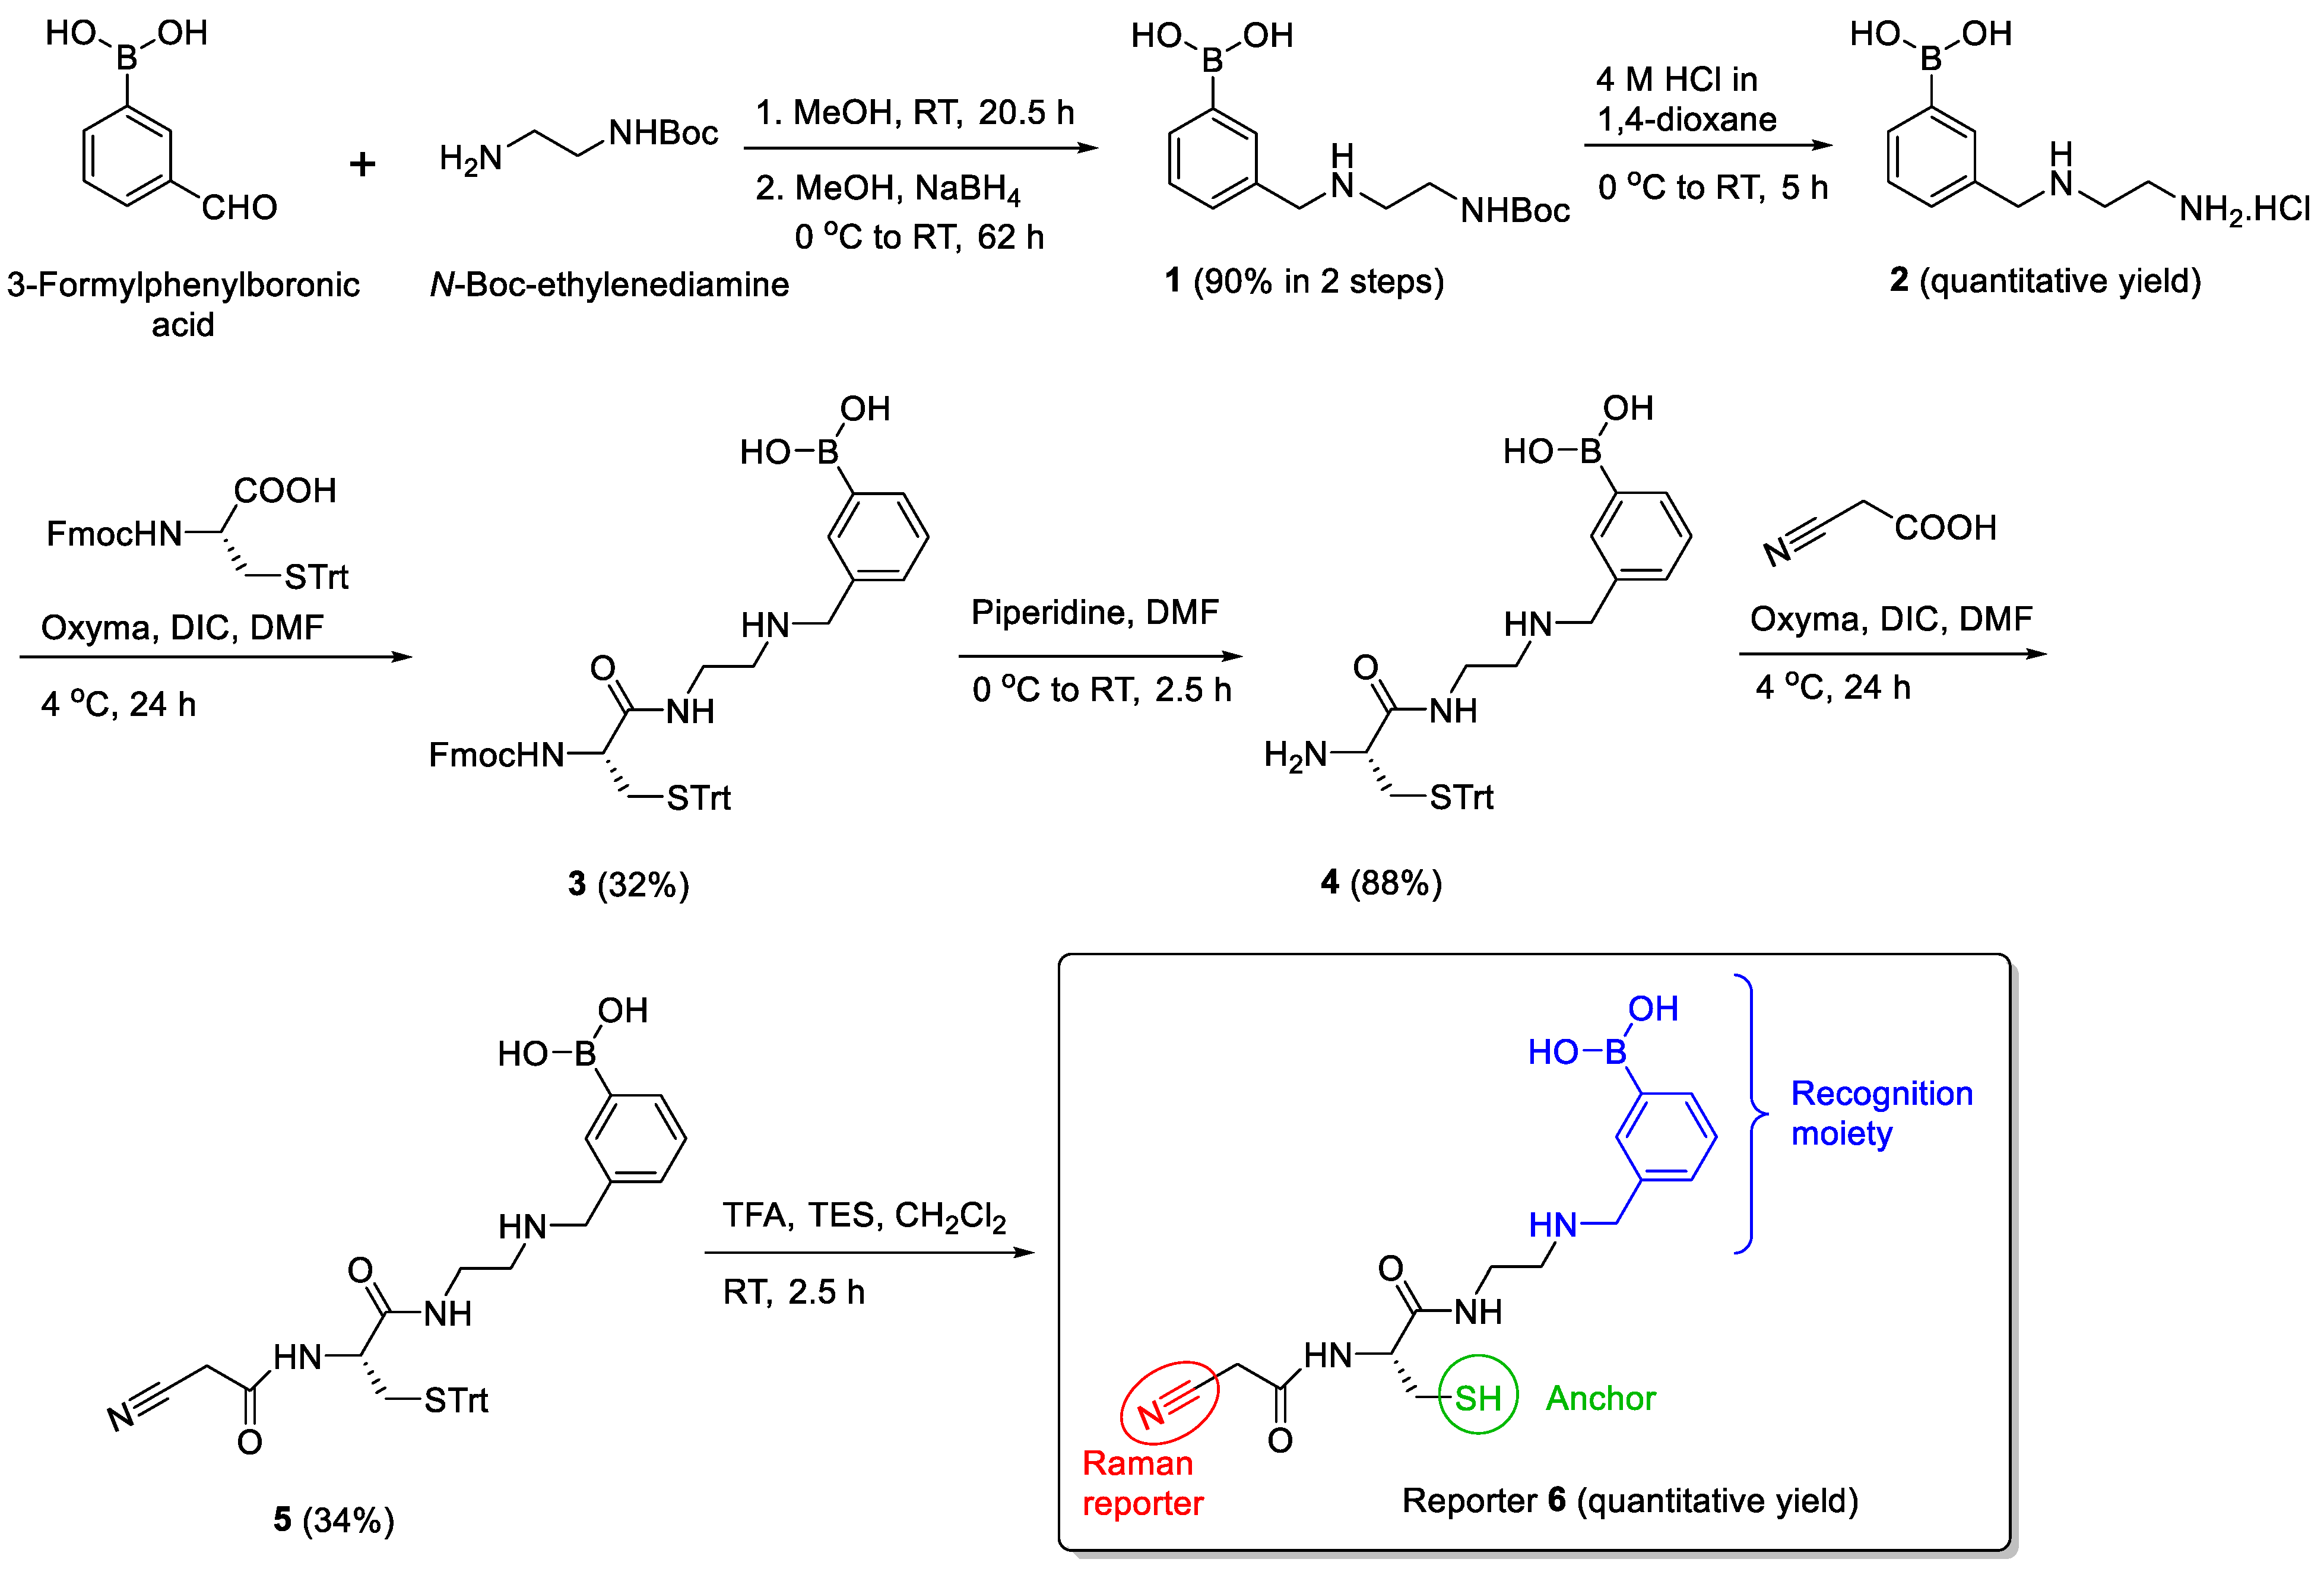
2.4. Synthetic Procedures

Compound 1
Chemosensors 09 00092 i001
N-Boc-ethylenediamine (578.5 µL, 3.67 mmol) was added to a solution of 3-formylphenylboronic acid (500 mg, 3.33 mmol) in 16.67 mL methanol (MeOH), and the reaction was left under stirring at RT under N2. After 20.5 h, the reaction mixture was concentrated by evaporation to yield the white crude imine intermediate, which was further dried under high vacuum. Dried crude imine was then re-dissolved in MeOH (16.67 mL) and cooled to 0 °C in an ice bath before the addition of sodium borohydride (NaBH4) (1.26 g, 33.35 mmol) in a portion-wise manner. The reaction mixture was allowed to slowly warm to RT with continuous stirring under N2. After 62 h, the reaction mixture was concentrated by evaporation to yield a viscous white crude. The crude was subjected to column chromatography on silica gel with ethyl acetate (EtOAc)/MeOH/H2O (10/2/1 to 9/2/1, v/v) to obtain the desired product 1 (879.4 mg, 90%) as a white amorphous foam. Retention factor (Rf) 0.26 (EtOAc/MeOH/H2O = 10/2/1, v/v); 1H NMR (500 MHz, MeOD): δ 7.62–7.51 (m, 2H, Ar-H), 7.31–7.21 (m, 2H, Ar-H), 4.00 (s, 2H, H-a), 3.33–3.29 (m, 2H, H-c, merge with MeOD), 3.02–2.90 (m, 2H, H-b), 1.44 (s, 9H, Boc-CH3); 13C NMR (125 MHz, MeOD): δ 158.87 (C), 135.37 (CH), 134.99 (CH), 128.61 (CH), 80.73 (C), 53.74 (CH2), 50.00 (CH), 48.80 (CH2), 39.05 (CH2), 28.84 (CH3); HRMS (ESI-TOF): m/z as calculated for C14H23BN2O4Na [M + Na]+ was 317.1646 and as found was 137.1645.
Compound 2
Chemosensors 09 00092 i002
A solution of 4 M HCl in 1,4-dioxane (59.79 mL) was added to the round bottom flask containing compound 1 (879.4 mg, 2.99 mmol) at 0 °C. The mixture was allowed to warm to RT with continuous stirring for 5 h under N2. The reaction mixture was then concentrated by evaporation to yield a white solid crude. The crude was subsequently washed overnight by stirring in diethyl ether. The white solid precipitates were collected and dried under high vacuum to obtain the desired compound 2 (689.2 mg, quantitative yield) as a white amorphous solid. Rf 0.12 (EtOAc/MeOH/H2O = 7/2/1, v/v); 1H NMR (500 MHz, MeOD): δ 7.99–7.71 (m, 2H, Ar-H), 7.67 (d, J = 7.7 Hz, 1H, Ar-H), 7.47 (t, J = 7.4 Hz, 1H, Ar-H), 4.34 (s, 2H, H-a), 3.50–3.44 (m, 2H, H-c), 3.44–3.38 (m, 2H, H-b); 13C NMR (125 MHz, MeOD): δ 136.69 (CH), 136.36 (CH), 132.96 (CH), 131.32 (C), 129.64 (CH), 53.04 (CH2), 45.42 (CH2), 36.97 (CH2); HRMS (ESI-TOF): m/z as calculated for C9H16BN2O2 [M + H]+ was 195.1299 and as found was 195.1303.
Compound 3
Chemosensors 09 00092 i003
Oxyma (282 mg, 1.98 mmol) and N,N’-DIC (282.4 µL, 1.80 mmol) were sequentially added to a solution of compound 2 (350 mg, 1.80 mmol) and Fmoc-S-trityl-L-cysteine (1.05 g, 1.80 mmol) in dimethylformamide (DMF) (18.04 mL) at 0 °C under N2, and the reaction was allowed to stir at 4 °C for 24 h. Then, the reaction mixture was diluted with EtOAc (30 mL), followed by a wash with ddH2O (50 mL, 2×) and saturated NaHCO3 solution (50 mL, 2×). The EtOAc layer was collected, dried over MgSO4, filtered, and concentrated by evaporation to afford a viscous yellow crude. The crude was purified by column chromatography on silica gel with EtOAc/MeOH/H2O (14/2/1, v/v) to yield the desired pure product 3 (440.4 mg, 32%) as a yellow oil. Rf 0.57 (EtOAc/MeOH/H2O = 10/2/1 + 1 drop AcOH); 1H NMR (500 MHz, MeOD): δ 7.67 (dd, J = 7.4, 3.9 Hz, 2H, Ar-H), 7.64–7.59 (m, 1H, Ar-H), 7.57 (d, J = 6.8 Hz, 1H, Ar-H), 7.52 (d, J = 7.3 Hz, 2H, Ar-H), 7.32–7.23 (m, 9H, Ar-H), 7.19–7.07 (m, 12H, Ar-H), 4.31–4.22 (m, 1H, H-f), 4.15–4.01 (m, 2H, H-f, H-g), 3.89 (s, 2H, H-e), 3.85 (t, J = 6.9 Hz, 1H, H-b), 3.46–3.36 (m, 1H, H-c1), 3.32–3.27 (m, 2H, H-c2 merge with MeOD), 2.95–2.77 (m, 2H, H-d), 2.61–2.46 (m, 2H, H-a); 13C NMR (125 MHz, MeOD): δ 179.50 (C), 173.69 (C), 158.23 (C), 145.94 (C), 145.22 (C), 145.13 (C), 142.63 (C), 135.81 (CH), 135.24 (CH), 133.76 (C), 131.22 (CH), 131.03 (CH), 130.80 (CH), 129.15 (CH), 129.10 (CH), 128.93 (CH), 128.30 (CH), 128.06 (CH), 126.37 (CH), 126.29 (CH), 121.07 (CH), 68.23 (CH2), 55.94 (CH), 53.14 (CH2), 50.00 (CH), 48.32 (CH), 48.30 (CH2), 37.91 (CH2), 34.87 (CH2); HRMS (ESI-TOF): m/z as calculated for C46H45BN3O5S [M + H]+ was 762.3175 and as found was 762.3178.
Compound 4
Chemosensors 09 00092 i004
Piperidine (291.78 µL, 2.95 mmol) was added to a solution of compound 3 (500 mg, 0.66 mmol) in DMF (4.38 mL) at 0 °C under N2. The reaction solution was then allowed to slowly warm to RT. After 2.5 h, the reaction mixture was diluted with EtOAc (20 mL) and washed with ddH2O (20 mL, 3×). Combined organic layers were dried over MgSO4, filtered, and concentrated by evaporation to obtain a viscous pale yellow crude. The crude was purified by column chromatography on silica gel with EtOAc/MeOH/H2O (12/2/1, v/v) to yield the pure compound 4 (312.6 mg, 88%) as a white amorphous foam. Rf 0.2 (EtOAc/MeOH/H2O = 10/2/1 + 1 drop AcOH); 1H NMR (500 MHz, MeOD): δ 7.80–7.70 (m, 2H, Ar-H), 7.43–7.40 (m, 1H, Ar-H), 7.39–7.32 (m, 7H, Ar-H), 7.30–7.26 (m, 6H, Ar-H), 7.24–7.20 (m, 3H, Ar-H), 4.04 (s, 2H, H-e), 3.54–3.40 (m, 2H, H-c), 3.18 (t, J = 6.4 Hz, 1H, H-b), 3.06–2.96 (m, 2H, H-d), 2.57 (dd, J = 12.0, 6.5 Hz, 1H, H-a1), 2.43 (dd, J = 12.0, 6.5 Hz, 1H, Ha2); 13C NMR (125 MHz, MeOD): δ 179.18 (C), 176.00 (C), 146.04 (C), 136.07 (CH), 135.43 (CH), 133.99 (C), 132.01 (CH), 130.83 (CH), 129.29 (CH), 129.17 (CH), 128.11 (CH), 68.09 (C), 55.29 (CH), 53.06 (CH2), 50.00 (CH), 48.37 (CH2), 37.89 (CH2), 37.72 (CH2); HRMS (ESI-TOF): m/z as calculated for C31H34BN3O3SNa [M + Na]+ was 562.2312 and as found was 562.2328.
Compound 5
Chemosensors 09 00092 i005
Oxyma (90.58 mg, 0.64 mmol) and N,N’-DIC (90.7 µL, 0.58 mmol) were sequentially added to a solution of compound 4 (312.6 mg, 0.58 mmol) and cyanoacetic acid (49.29 mg, 0.58 mmol) in DMF (5.79 mL) at 0 °C under N2, and the reaction was allowed to stir at 4 °C for 24 h. Then, the reaction mixture was diluted with EtOAc (20 mL), followed by a wash with ddH2O (25 mL, 2×) and saturated NaHCO3 solution (25 mL, 2×). The EtOAc layer was collected, dried over MgSO4, filtered, and concentrated by evaporation to afford a viscous yellow crude. The crude was purified by column chromatography on silica gel with EtOAc/MeOH/H2O (14/2/1, v/v) to yield the desired pure product 5 (120.8 mg, 34%) as a yellow oil. Rf 0.43 (EtOAc/MeOH/H2O = 10/2/1 + 1 drop AcOH); 1H NMR (500 MHz, MeOD): δ 7.76–7.66 (m, 2H, Ar-H), 7.44–7.40 (m, 1H, Ar-H), 7.39–7.36 (m, 6H, Ar-H), 7.35–7.32 (m, 1H, Ar-H), 7.31–7.26 (m, 6H, Ar-H), 7.25–7.20 (m, 3H, Ar-H), 4.14–4.09 (m, 1H, H-b), 4.05 (s, 2H, H-e), 3.53–3.46 (m, 1H, H-c1), 3.44–3.37 (m, 1H, H-c2), 3.33–3.30 (m, 2H, H-f, merge with MeOD), 3.04–2.97 (m, 2H, H-d), 2.59 (dd, J = 12.4, 6.4 Hz, 1H, H-a1), 2.53 (dd, J = 12.4, 7.4 Hz, 1H, H-a2); 13C NMR (125 MHz, MeOD): δ 178.61 (C), 172.89 (C), 164.97 (C), 145.89 (C), 135.96 (CH), 135.39 (CH), 130.82 (CH), 129.21 (CH), 128.17 (CH), 68.29 (C), 54.88 (CH), 53.22 (CH2), 49.49 (CH2), 48.38 (CH2), 37.99 (CH2), 34.53 (CH2); HRMS (ESI-TOF): m/z as calculated for C34H35BN4O4SNa [M + Na]+ was 629.2370 and as found was 629.2388.
Compound 6
Chemosensors 09 00092 i006
Triethylsilane (TES) (44.5 µL, 0.28 mmol) and trifluoroacetic acid (20 µL, 0.26 mmol) were sequentially added to a solution of compound 5 (30 mg, 0.05 mmol) in CH2Cl2 (275 µL) at RT under N2. After 2.5 h, the reaction mixture was concentrated by evaporation to yield a pale yellow oil crude. The crude was washed overnight by stirring with diethyl ether. The resulting white precipitates were collected and dried under high vacuum to yield the desired product 6 (18 mg, quantitative yield) as a white amorphous solid. Rf 0.1 (EtOAc/MeOH/H2O = 10/2/1); 1H NMR (500 MHz, MeOD): δ 7.86 (d, J = 18.2 Hz, 2H, Ar-H), 7.57 (d, J = 7.4 Hz, 1H, Ar-H), 7.45 (t, J = 7.2 Hz, 1H, Ar-H), 4.45 (t, J = 6.0 Hz, 1H, H-b), 4.28 (s, 2H, H-e), 3.68–3.52 (m, 2H, H-c), 3.39–3.36 (m, 2H, H-f, merge with MeOD), 3.28–3.19 (m, 2H, H-d), 2.94 (dd, J = 13.9, 5.3 Hz, 1H, H-a1), 2.87 (dd, J = 13.9, 7.1 Hz, 1H, Ha2); 13C NMR (125 MHz, MeOD): δ 173.27 (C), 165.54 (C), 136.58 (CH), 136.17 (CH), 132.79 (CH), 131.54 (C), 129.60 (CH), 129.37 (CH), 116.02 (C), 57.99 (CH), 52.63 (CH2), 50.00 (CH2), 48.29 (CH2), 37.18 (CH2), 26.55 (CH2); HRMS (ESI-TOF): m/z as calculated for C15H22BN4O4S [M + H]+ was 365.1452 and as found was 365.1453.

2.5. Synthesis of Tri-Functional Nanoprobe (Reporter 6 Conjugated AgNCs)

The nanoprobe was obtained by conjugation of reporter 6 onto the AgNC surface through an Ag-S bond. Briefly, 100 µL AgNC colloid solution was added to 1 mL of 4 mM reporter 6 and vigorously stirred for 1.5 h. The unbound reporter 6 was removed by centrifugation at 9000 rpm for 10 min. The conjugate of AgNC-reporter 6 was then dispersed in 50 µL sterile water for further experiments. The nanoprobe was freshly prepared before its addition into fixed cells for Raman measurements. The DLS and zeta potential were used to certify the nanoprobe.

2.6. Cell Culture and Treatment with Nanoprobe

HeLa cells and Hs68 cells (1 × 10⁵) were cultured on silicon wafers placed inside a 24-well plate, respectively, in Dulbecco’s modified Eagle medium, supplemented with 10% (v/v) fetal bovine serum and 1% (v/v) penicillin-streptomycin, at 37 °C in an incubator containing 5% CO2. After 3 days, the cells were washed 3 times with Dulbecco’s phosphate-buffered saline (DPBS), fixed with 4% (w/v) formaldehyde at RT for 20 min, then rinsed with DPBS (3×). Next, the fixed HeLa cells and Hs68 cells, respectively, incubated in 250 µL DPBS per well, were treated with 10 µL nanoprobe for 2 h. Subsequently, the fixed HeLa cells and Hs68 cells on silicon wafers were washed with DPBS 3 times to remove unbound nanoprobe before Raman measurements.

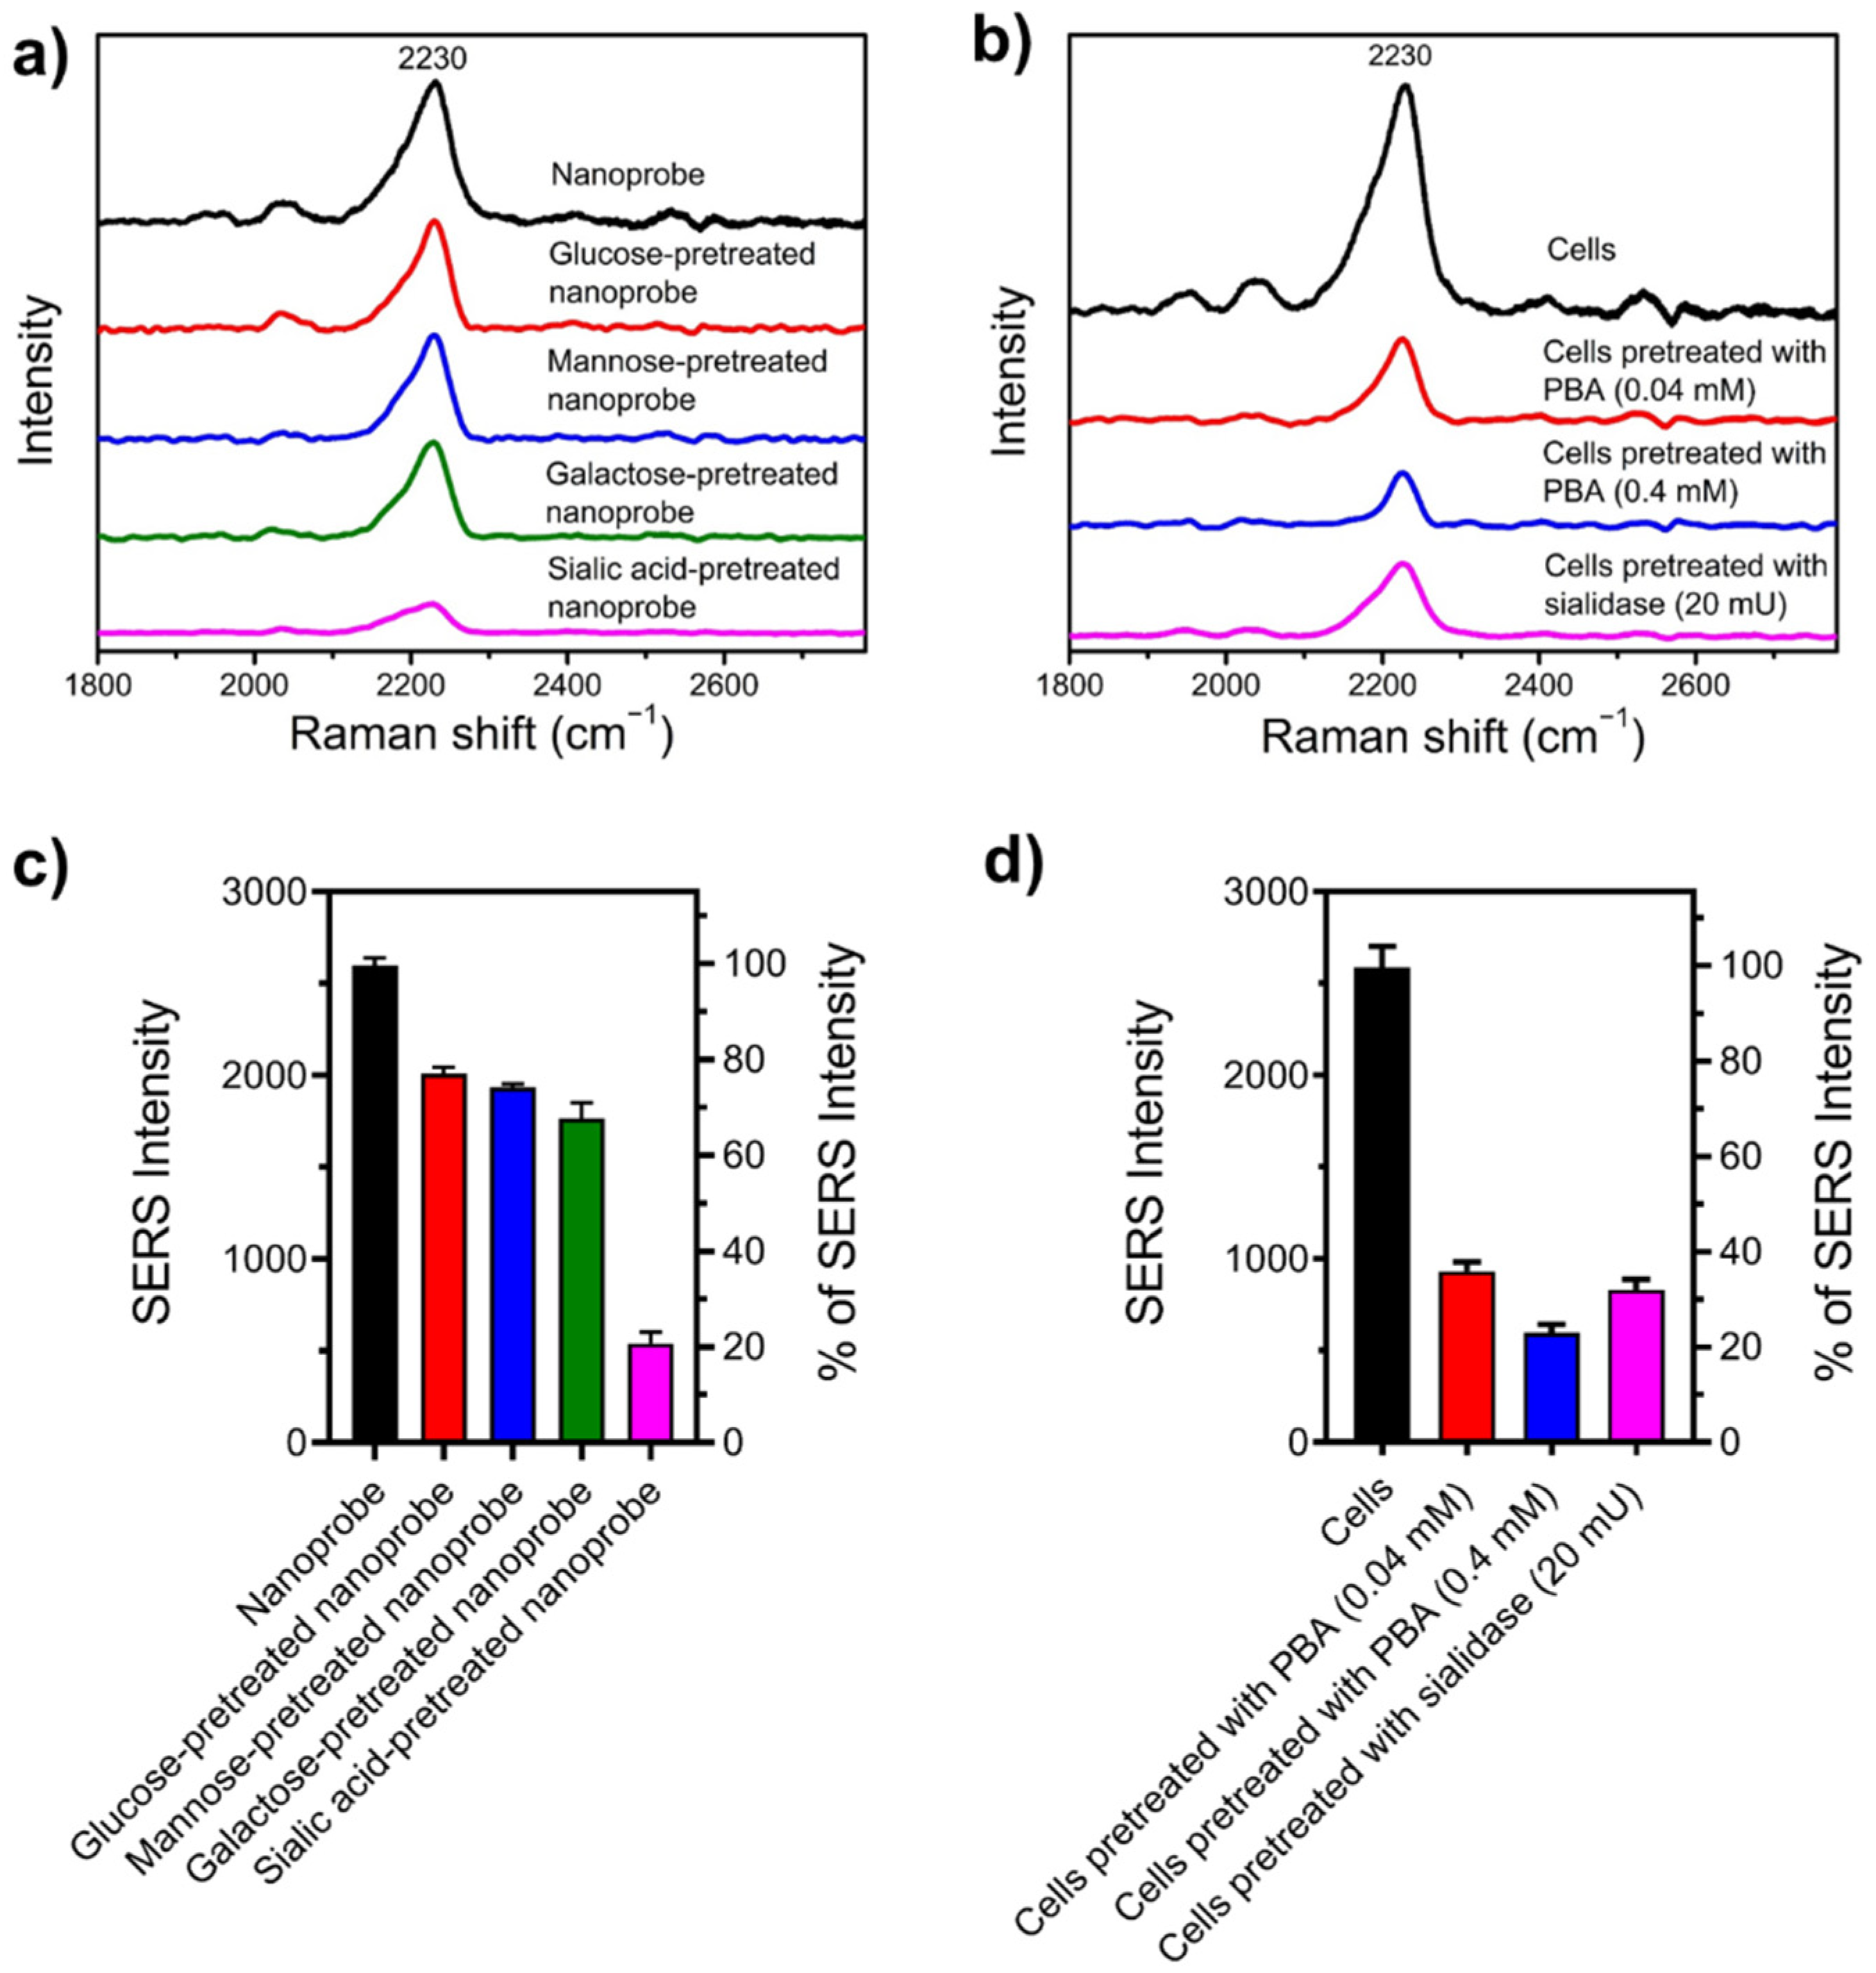
2.7. Specificity of Nanoprobe towards SA

Nanoprobe (10 µL) was mixed with 1 mL (0.5 µM) aqueous solution of each free monosaccharide (glucose, mannose, galactose, and sialic acid) and stirred for 1 h. Then, the solution was centrifuged at 9000 rpm for 10 min to remove the unbound monosaccharides, resulting in glucose-pretreated nanoprobe, mannose-pretreated nanoprobe, galactose-pretreated nanoprobe, and sialic acid-pretreated nanoprobe, respectively. The monosaccharide-pretreated nanoprobes were added onto fixed HeLa cells on silicon wafers and incubated for 2 h at RT. The HeLa cells on the silicon wafer then were rinsed with DPBS (3×) to wash out the unbound nanoprobe, followed by Raman measurement.
For experiments with PBA, fixed HeLa cells were pretreated with 0.04 mM and 0.4 mM of PBA for 1.5 h at RT, followed by rinsing with DPBS (3×) to eliminate unbound PBA. After that, the fixed HeLa cells, incubated in 250 µL DPBS per well, were treated with 10 µL nanoprobe for 2 h at RT. The cells were then washed 3 times with DPBS to wash away the unbound nanoprobe prior to Raman measurements.
The experiment using sialidase to cleave the sialic acid on the cell surface was done by pretreating fixed HeLa cells with 20 mU sialidase (from Arthrobacter ureafaciens) in sialidase buffer (20 mM HEPES-NaOH, pH 7.0, 140 mM NaCl) for 2 h at RT. After that, the cells were washed with DPBS (3×) to remove the free sialic acid, followed by treatment of the cells with 10 µL nanoprobe in 250 µL DPBS per well at RT. After 2 h, the cells were washed with DPBS (3×) to wash out the unbound nanoprobe prior to SERS measurements.

2.8. SERS Measurement

SERS spectra were acquired using a home-built confocal micro Raman system with 532-nm laser excitation at RT. A laser power of 0.7 mW and acquisition time of 5 s were used. Silicon wafers, which were used in cell culture, were sterilized under UV light for 1 h before cell experiments. ORIGINLAB software (Northampton, MA, USA) was used for SERS spectra baseline correction. SERS imaging of a single HeLa cell was acquired by a point-mapping method with 1.0-µm steps using a 532-nm laser, 0.7-mW power laser, 100× objective lens (numerical aperture 0.85), and 1-s exposure time. The SERS signal of cyano at 2230 cm−1 was chosen for generating the SERS mapping image using MATLAB (MathWorks) program.

3. Results and Discussion

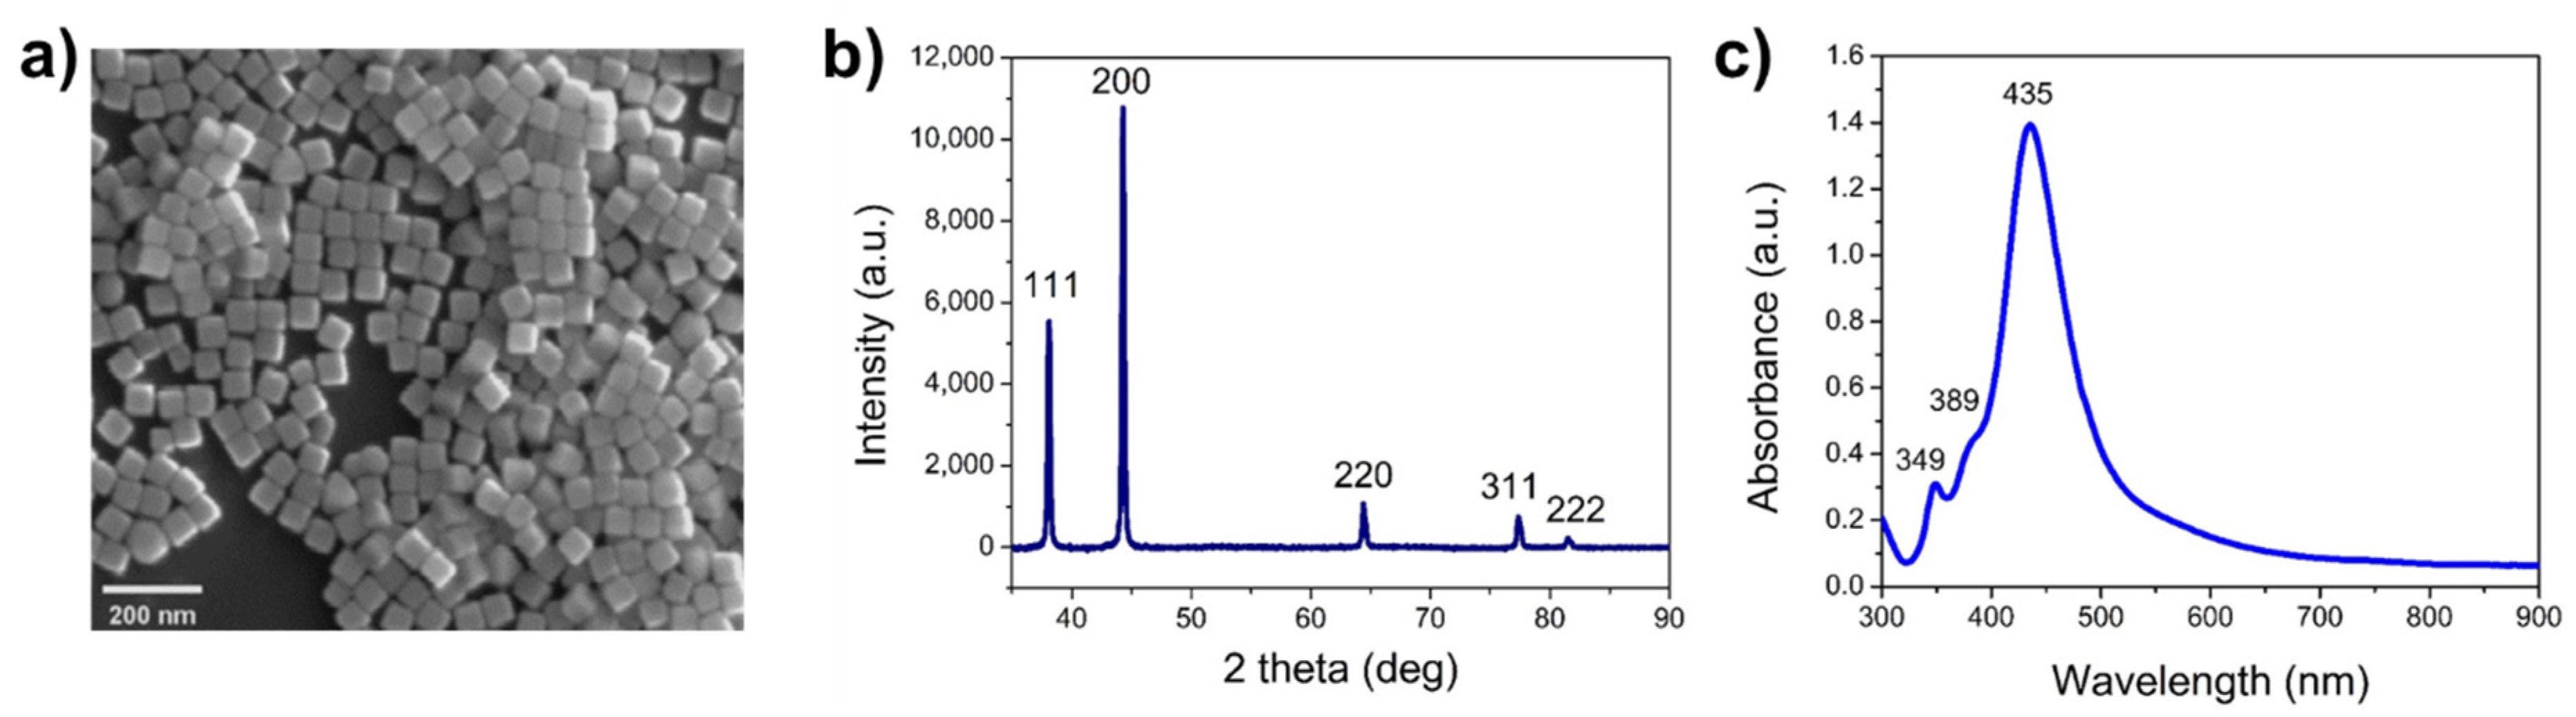
3.1. Synthesis and Characterization of AgNCs

We prepared AgNCs as SERS substrate to amplify the Raman signal, due to their advantages over other nanoparticles. First, noble metal nanostructures such as silver (Ag), gold (Au), and Au-Ag bimetallic nano alloys [19] have been widely used as SERS substrates. However, Ag nanostructures exhibit stronger Raman enhancement rather than Au nanostructure in visible spectrum, because Ag provides higher efficiency of plasmon excitation, and interacts more efficiently with visible light. The light-interaction cross-section for Ag can be about ten times higher than that of the geometric cross-section, indicating that the Ag captures more light than is physically irradiated on them [20,21]. Moreover, the cost of Ag is lower than that of Au. Second, nanoparticles generate greater SERS enhancement if they contain sharp features on their surface (like nanocubes). The calculated electromagnetic enhancement from nanocube is about 100 times higher than nanosphere due to the oscillation of surface electrons, which are confined to the corners of nanocubes [22]. Finally, AgNCs can be prepared in a large scale with high monodispersity and reproducibility.
AgNCs were synthesized by the polyol method and characterized by SEM, UV-Vis, XRD, DLS, and zeta potential measurements (Figure 1 and Figure 2). Upon optimization, the morphology of the silver nanoparticles was shown to be cubic, with an edge length of ~48 nm (Figure 1a). The XRD pattern of AgNCs confirmed the presence of highly crystalline silver nanoparticles. Five main characteristic diffraction peaks at 38.10°, 44.28°, 64.40°, 77.39°, and 81.56° were assigned as (111), (200), (220), (311), and (222) lattice planes, and accordingly indexed as face-centered cubic structures based on JCPDS file No. 04-0783 (Figure 1b). Additionally, the UV-Vis spectra of AgNCs indicated the typical surface plasmon resonance feature of a cubic silver nanostructure with a major band at 435 nm and two shoulders at 349 and 389 nm, corresponding to a dipolar, octupolar, and quadrupolar peak, respectively, in agreement with the existing studies (Figure 1c) [23,24].

3.2. Design and Synthesis of Reporter

To provide a reliable and straightforward nanoprobe for detection of SA-containing glycans on the cell surface, we designed a reporter (6 in Scheme 1). Cyano was chosen for a characteristic Raman signal because its vibrational Raman spectrum falls in a cellular Raman silent region (1800–2800 cm−1), allowing for background-free SERS detection without interference from naturally existing biomolecules in cells [11,13].
PBA has been known to selectively bind to SA over other sugars at physiological pH or under weakly acidic pH conditions [25]. The binding between PBA and various sugars at physiological pH was reported with the association constant in decreasing order of PBA to SA >> galactose > mannose > glucose [26]. Furthermore, a positively charged ammonium group increased the binding of the phenylboronate/160Tb with SA at physiological pH because of the electrostatic interaction with the SA carboxyl group [27]. Therefore, to enhance selective binding towards SA, we incorporated an ammonium group to bind with the negative charge of the SA carboxylate group, in addition to the covalent binding of boronic acid to SA (i.e., formation of boronate ester with the two hydroxyl groups on C7-C9 or C8-C9 of SA) [28].
Because it is crucial to have strong reporter binding on the surface of nanoparticles to achieve extensive SERS enhancement, thiol was employed to attach the reporter to the nanoparticle surface by chemisorption. Of note, thiol has a stronger binding to Ag nanoparticles in comparison with other functional groups (e.g., amines, alcohols, and carboxylic acids) [29]. Additionally, thiol has been used to prevent oxidation of Ag nanoparticles, maintain their usability on SERS sensing, and lower its toxicity. It was found that molecules containing a thiol moiety could block the Ag nanostructures surface, quantitatively inhibit any oxidation through strong binding of thiol group to the Ag nanostructures surface [30,31], and thus usefully maintain its high enhancement factor.
The synthesis of reporter 6 is shown in Scheme 1. The synthesis started with a reductive amination between commercially available 3-formylphenylboronic acid and N-Boc-ethylenediamine. First, the solution of 3-formylphenylboronic acid in MeOH was reacted with N-Boc-ethylenediamine at RT to form the imine intermediate, followed by reduction with NaBH4, leading to formation of compound 1 at 90% yield in two steps. Next, Boc deprotection was conducted under an acid condition, 4 M HCl in 1,4-dioxane, to give the amine product (2) in quantitative yield. An amide-forming reaction was performed to conjugate 2 with the acid (Fmoc-S-trityl-L-cysteine), in which oxyma was used in the presence of N,N’-DIC. The desired cysteine-conjugated boronic acid derivative (3) was obtained in 32% yield. Further removal of the Fmoc group by stirring 3 in a solution of piperidine in DMF generated compound 4 in 88% yield. Another amide-bonding reaction was conducted by coupling 4 with cyanoacetic acid, resulting in formation of the desirable product (5) in 34% yield after silica gel column chromatography. Final deprotection of S-trityl ether was performed by using trifluoroacetic acid in the presence of TES as a cation scavenger [32,33], leading to the target reporter (6) in quantitative yield. The product was recrystallized in diethyl ether for further studies.

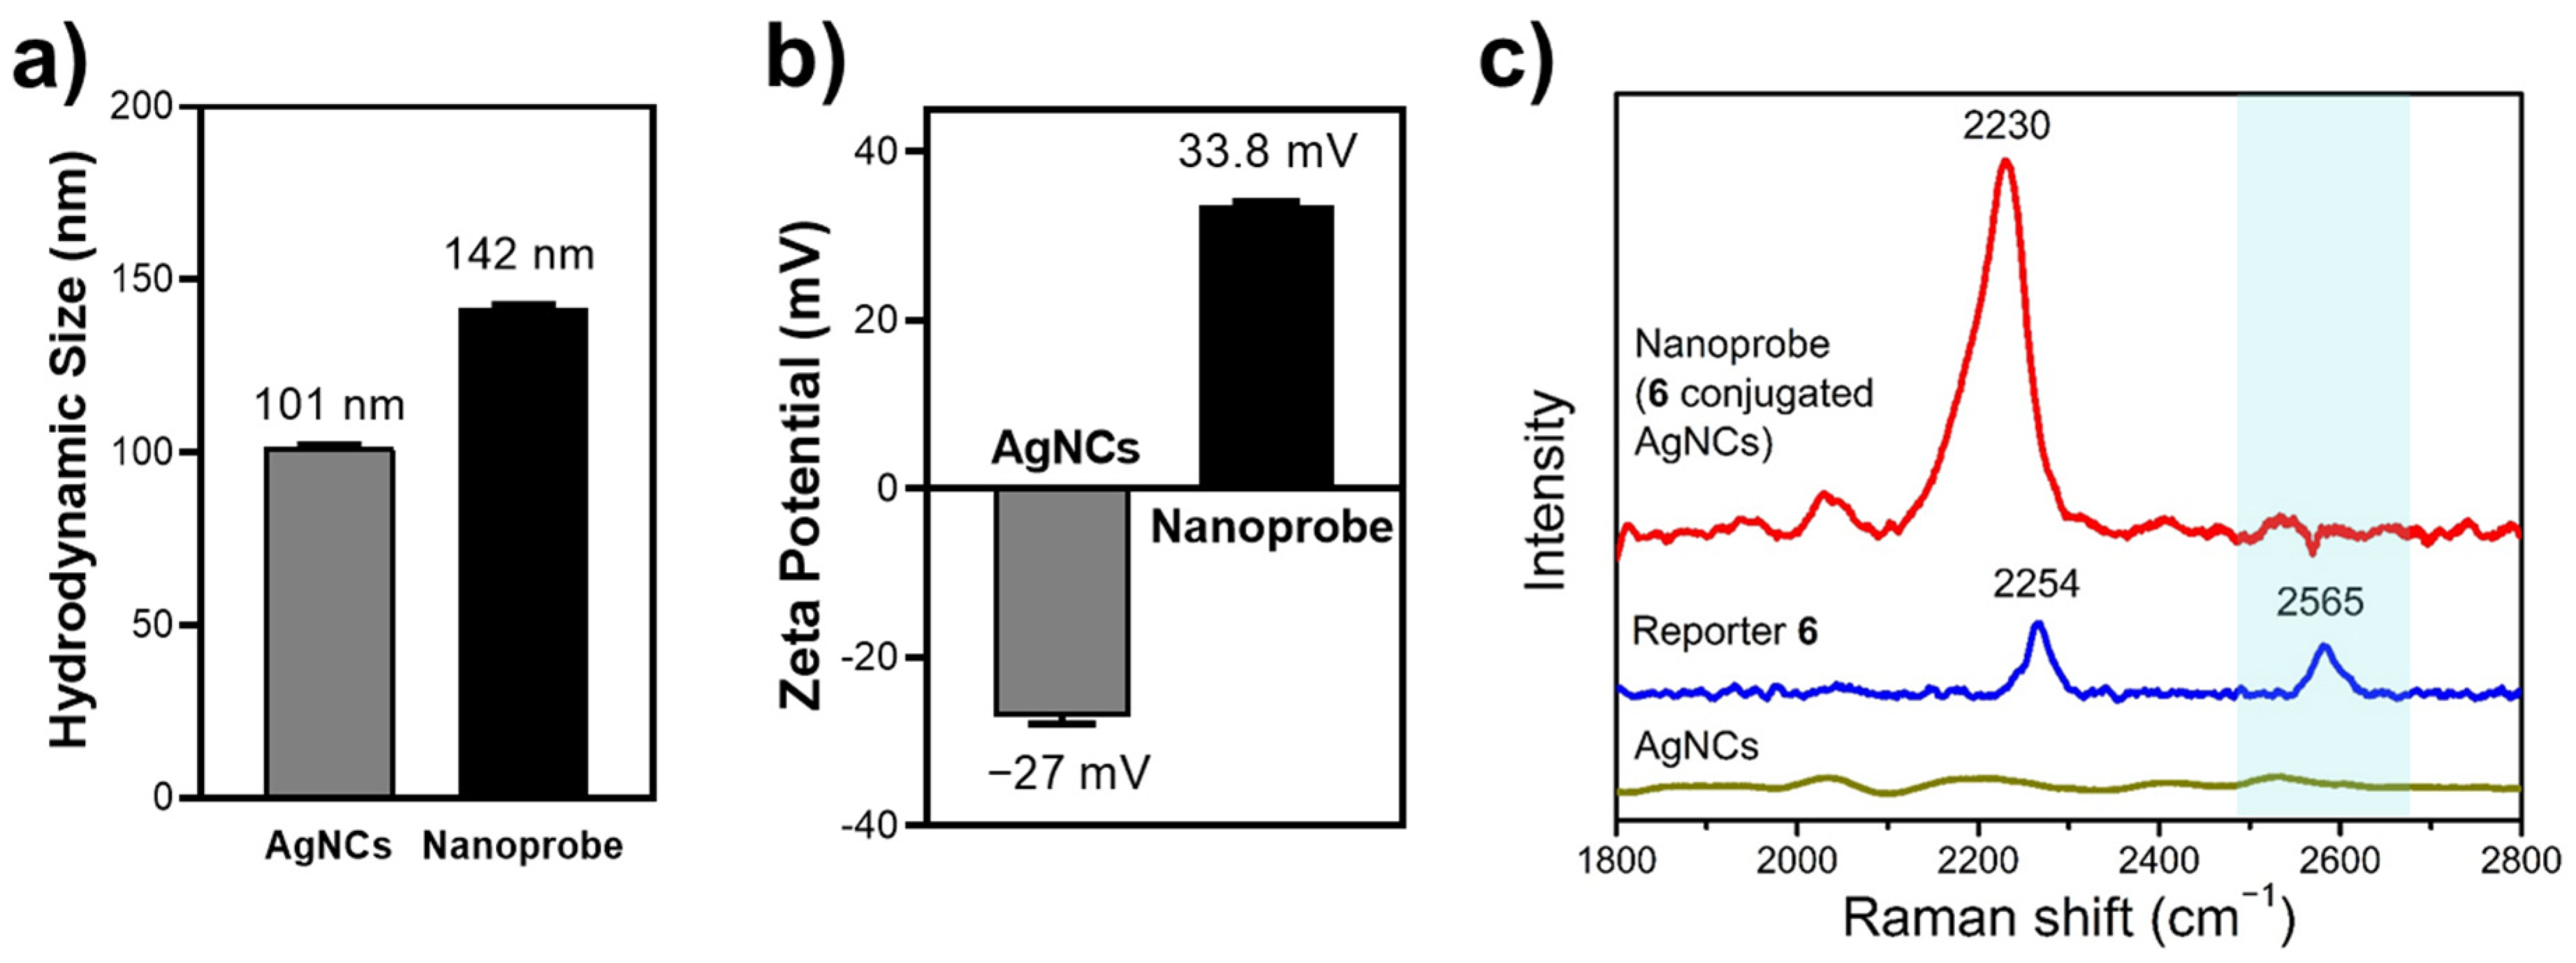
3.3. Characterization of Tri-Functional Nanoprobe

The nanoprobe was successfully fabricated by binding 6 to the surface of AgNCs and confirmed by DLS and zeta potential. The DLS data showed that the hydrodynamic size of AgNCs increased from 101.3 nm to 142.0 nm after coating with 6 (Figure 2a). The zeta potential exhibited a change in surface charge of AgNCs from −27.0 mV (the original AgNCs) to +33.8 mV (the modified AgNCs), as shown in Figure 2b. In addition, Raman measurements confirmed the conjugation of 6 onto the AgNC surface (Figure 2c). In the silent region, a single and strong SERS peak at 2230 cm−1, corresponding to the cyano moiety, was observed after conjugation of 6 onto the AgNC surface.
Furthermore, the SERS spectrum of the nanoprobe was compared to the Raman spectrum of 6 to verify the conjugation of 6 onto the AgNC surface. It can be seen that the Raman peak at 2565 cm−1 (highlighted in light blue in Figure 2c) in 6, which resulted from the stretching mode of the thiol group, disappeared in the nanoprobe. This result indicated that reporter 6 was successfully chemisorbed onto the AgNC surface as thiolate. To characterize the sensitivity of AgNCs, solutions of different concentrations of 6 were mixed with a fixed amount of AgNCs, and Raman signal intensity was quantitatively calibrated (Supporting Information Figure S1). We were gratified to see that Raman signal was detectable even at the level of zepto-moles (10−21 mole) of 6, thus proving the high sensitivity of AgNCs in enhancing the Raman signal of 6.

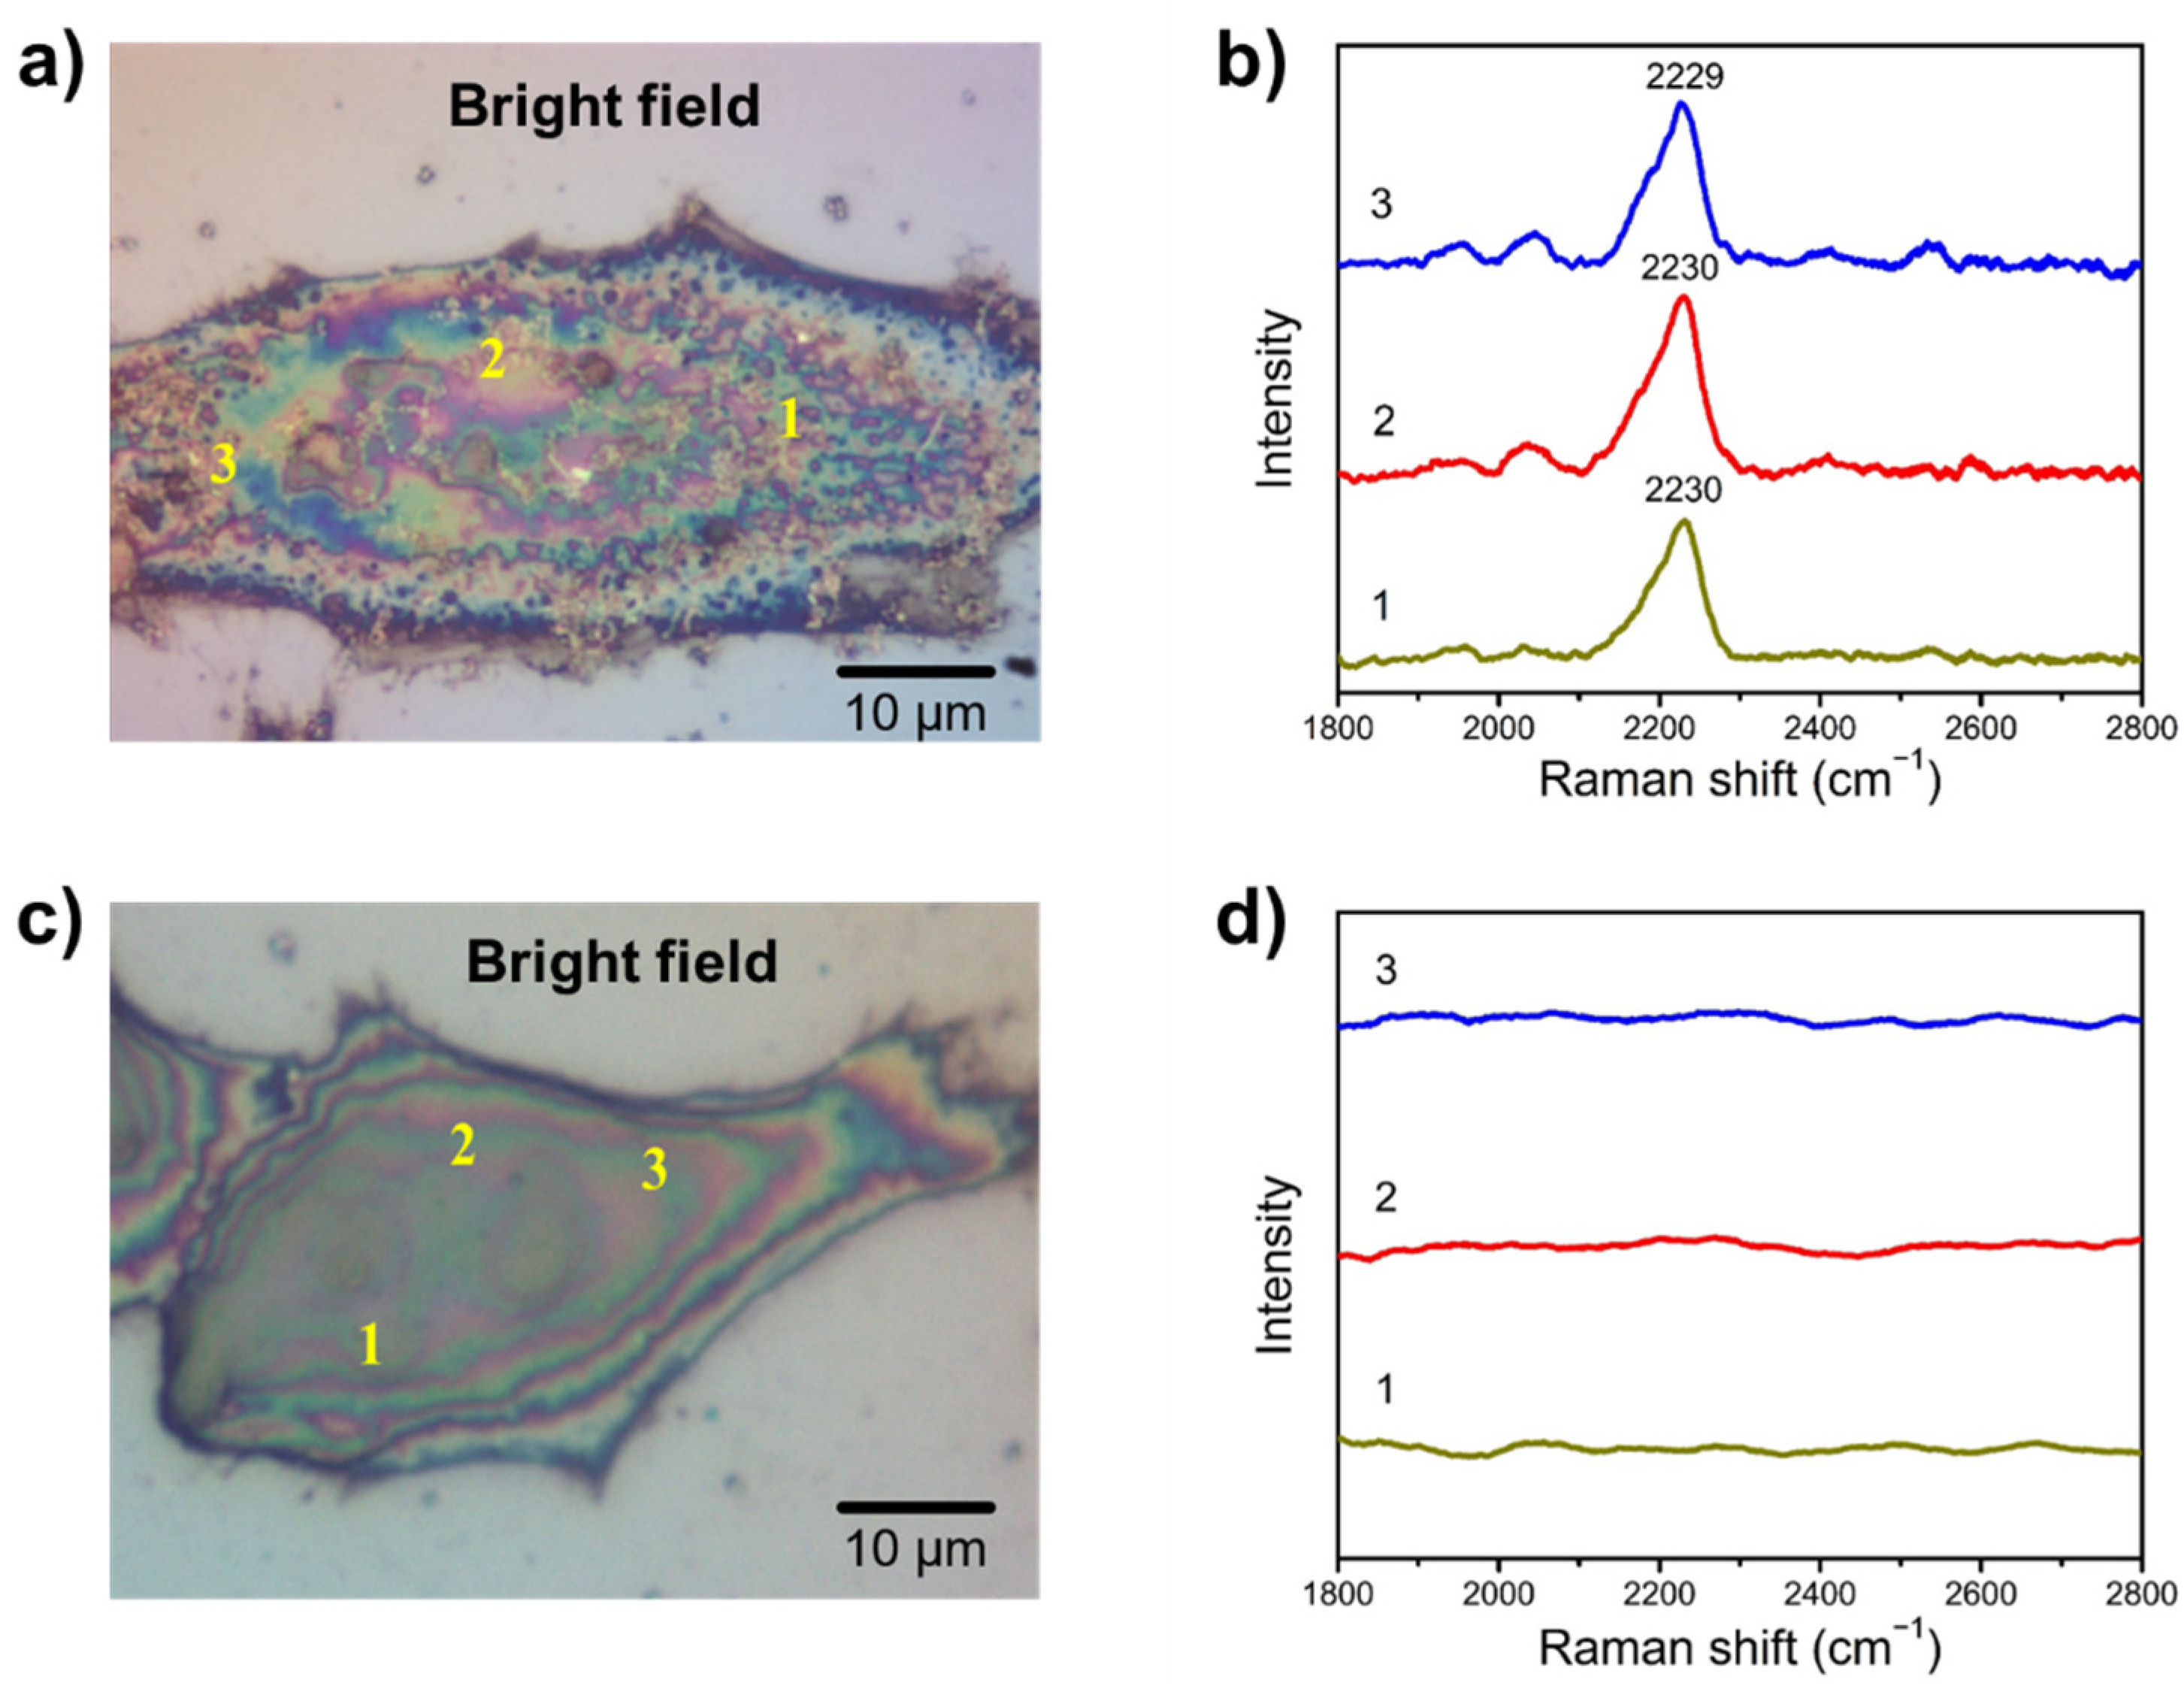
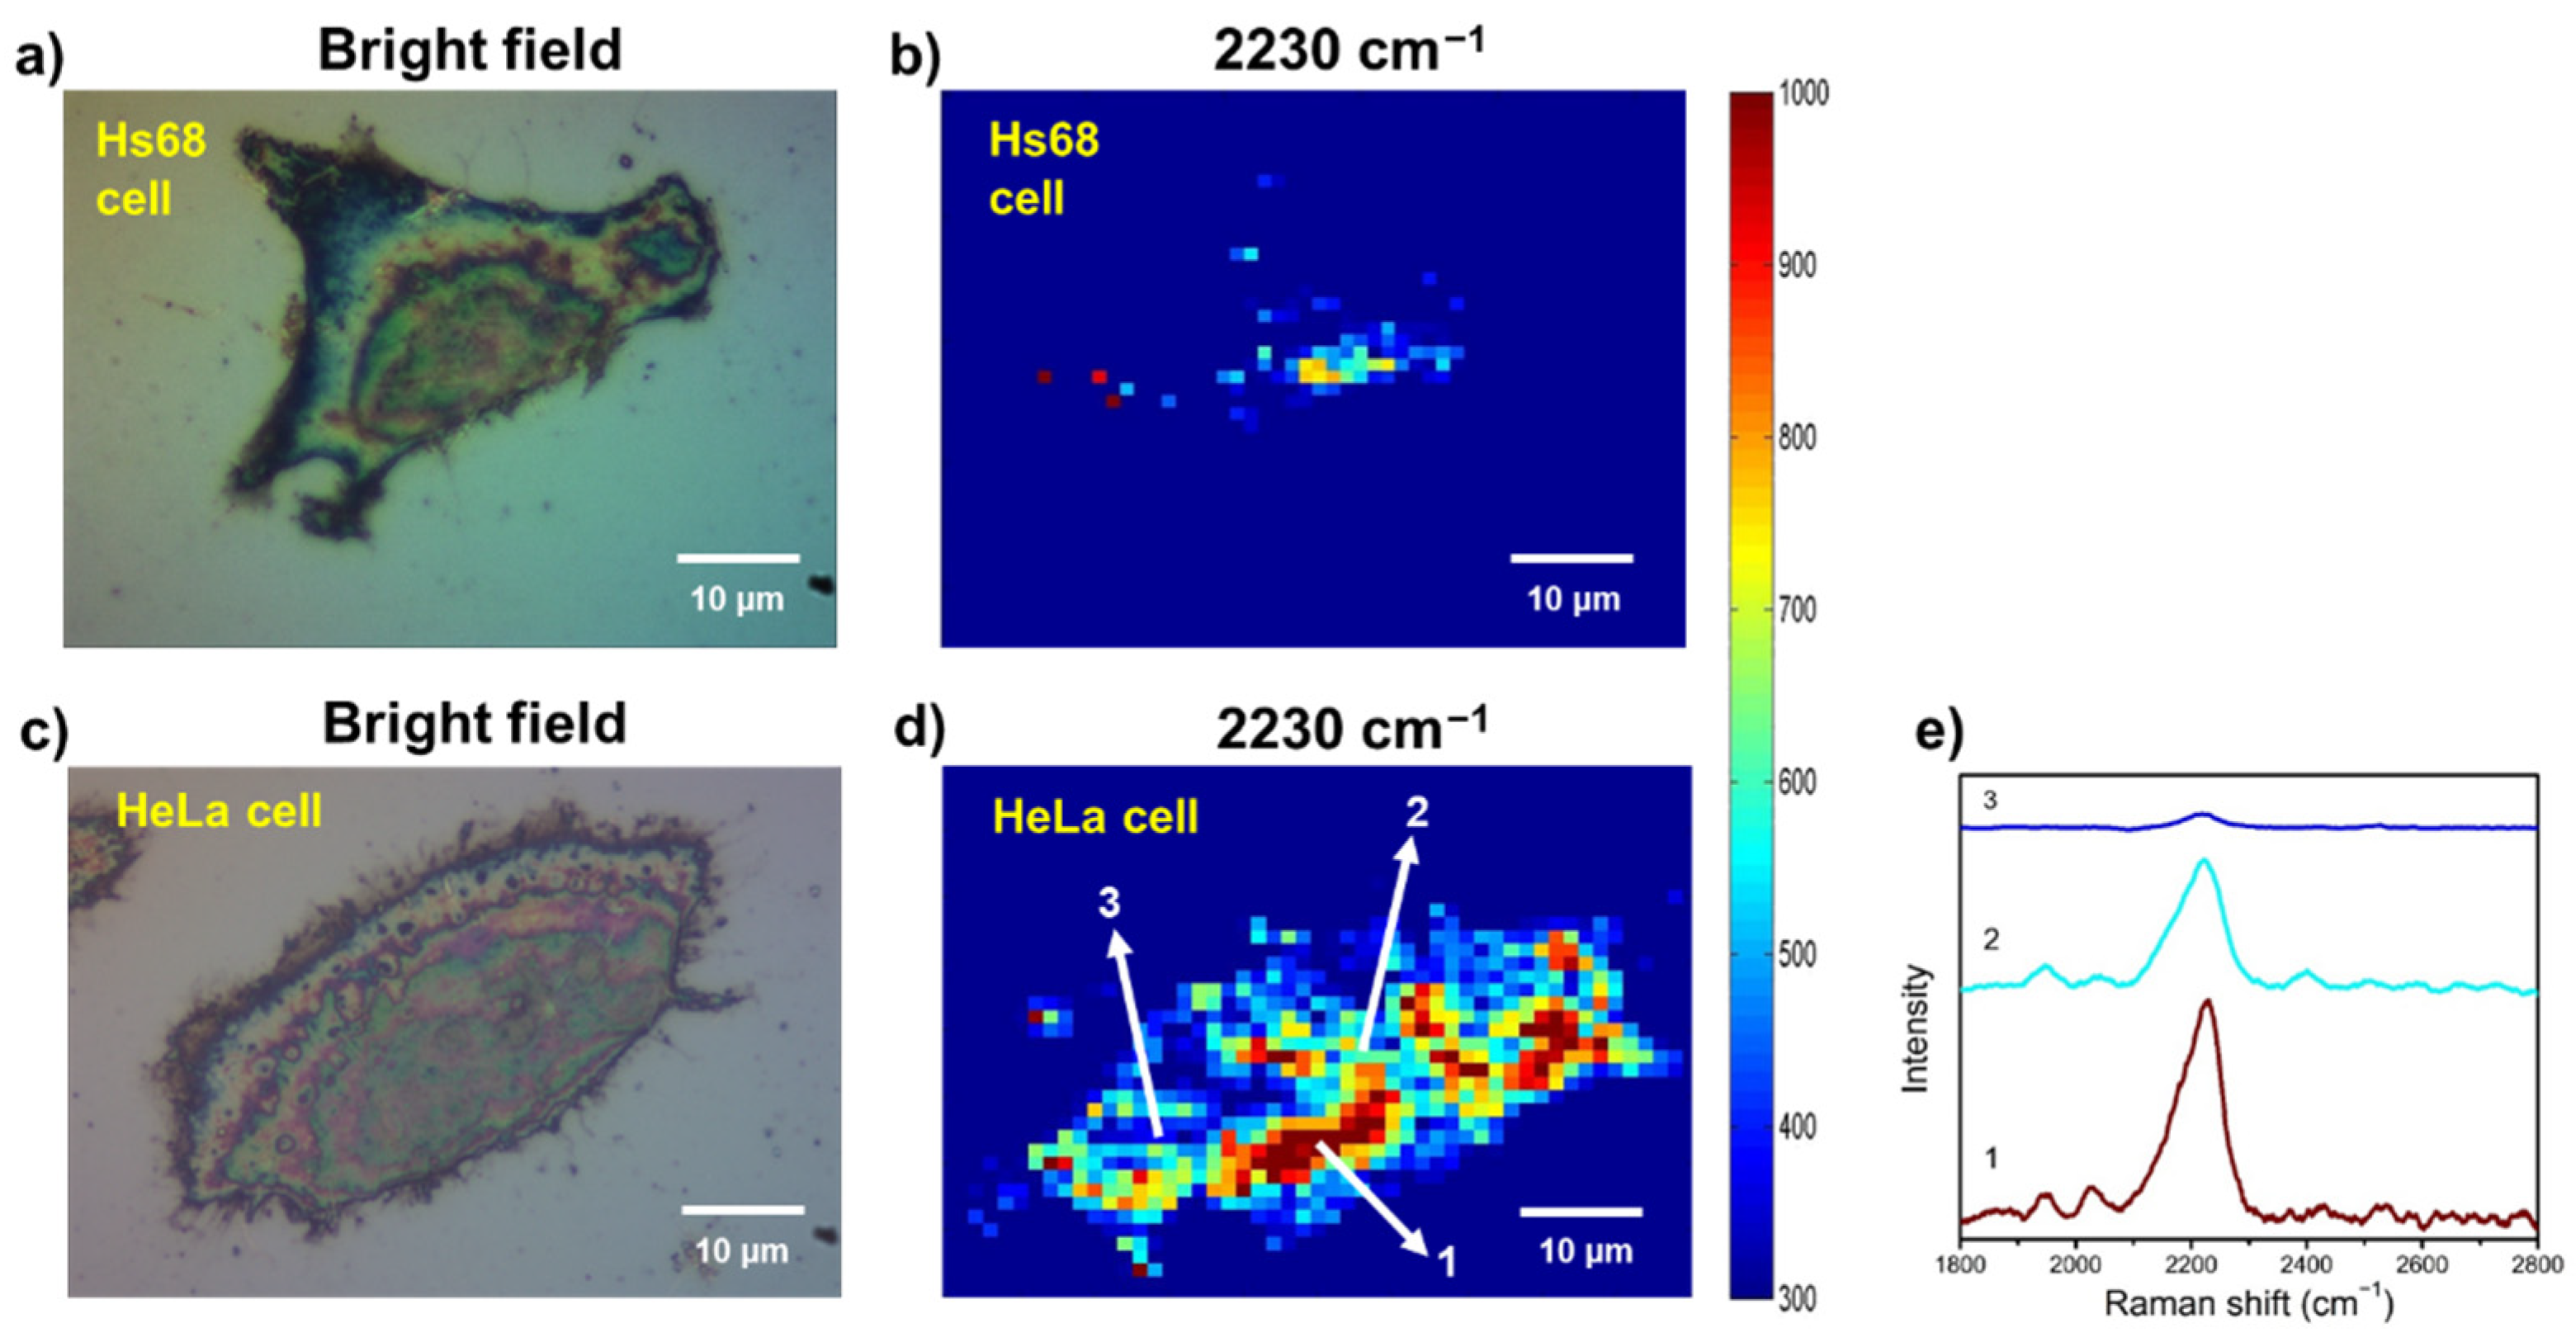
3.4. SA Expression on HeLa Cells

HeLa cells were chosen as a cancer cell model to demonstrate how our nanoprobe can be applied for detecting sialoglycan expression on the cell surface. SA-containing carbohydrates are overexpressed on the surface of HeLa cells. After incubation of the SERS nanoprobe with the fixed HeLa cells for 1 h at RT, the unbound nanoprobe was removed by a rinse with DPBS (3×) to eliminate the nonspecific binding and false-positive signals. The SERS spectra were recorded in the Raman silent region (1800–2800 cm−1), based on the finding that the cyano group exhibited a typical SERS peak at 2230 cm−1. The single and sharp SERS signal at 2230 cm−1, corresponding to the stretching vibration of cyano, was clearly detected on the surface of HeLa cells (Figure 3a,b). The signal was easy to distinguish and free of background noise. This result confirms the binding of our nanoprobe to HeLa cells.
Meanwhile, we also treated the cells with the bare AgNCs (that did not contain 6) to clarify the binding of nanoprobe and cell. Because there was no reporter attached to the surface of AgNCs, no SERS signal was observed, indicating no binding between the bare AgNCs and HeLa cells (Figure 3c,d).
To evaluate the specificity of the developed nanoprobe, we pretreated the nanoprobe with a monosaccharide, such as glucose, mannose, galactose, or SA, before applying the nanoprobe to HeLa cells. If any of the monosaccharides were to bind strongly to the nanoprobe, the binding to the SA-containing HeLa cells would be compromised [12]. As shown in Figure 4a,c, the intensity of SERS signals remained mostly high from the HeLa cells that had been incubated with the monosaccharide-pretreated nanoprobe. For example, we observed 77% signal intensity with respect to the control (cells treated with the nanoprobe) from the cells incubated with the glucose-pretreated nanoprobe. Likewise, 74% and 68% intensities were found from the cells incubated with the mannose- and galactose-pretreated nanoprobe, respectively. The results indicated a weak binding of the nanoprobe with glucose, mannose, or galactose, and this low affinity was inferred to leave susceptibility to competitive replacement with the high-affinity nanoprobe with the cell-surface sialoglycans. In contrast, there was a dramatic decrease in SERS intensity (only 21% intensity remained) from HeLa cells incubated with the SA-pretreated nanoprobe. Because SA shows strong binding to the SERS nanoprobe, the recognition moiety of the nanoprobe was already saturated with free SA. Therefore, the resulting nanoprobe could not bind to the cellular SA, leading to the observed low SERS signal. Our observed binding trend was also consistent with the above-mentioned binding order of PBA with monosaccharides.
To further examine the specificity of our prepared nanoprobe, we changed the level of available SA on the cell surface in one of two ways: Using PBA to abolish the binding with the cell surface SA, or sialidase (also called neuraminidase, the enzyme that catalyzes the hydrolytic cleavage of SA) to remove SA residues on the cell surface. The expectation was that PBA would strongly bind to SA at physiological pH, allowing for masking of the SA on the cell surface [26]. Consequently, a smaller amount of nanoprobe would attach to the cell surface, and the nanoprobe signal would decrease. As shown in Figure 4b,d, the decreased intensity of the SERS signal was found to be proportional to the increasing concentration of PBA employed to treat HeLa cells. Of note, the intensity of SERS signal was reduced by 77% when there was a prior incubation of HeLa cells with 0.4 mM PBA. Likewise, a reduced intensity of SERS signal was found when HeLa cells were treated with sialidase (Figure 4b,d), indicating that the reduced signal was the result of the decreased amount of SA on the cell surface.

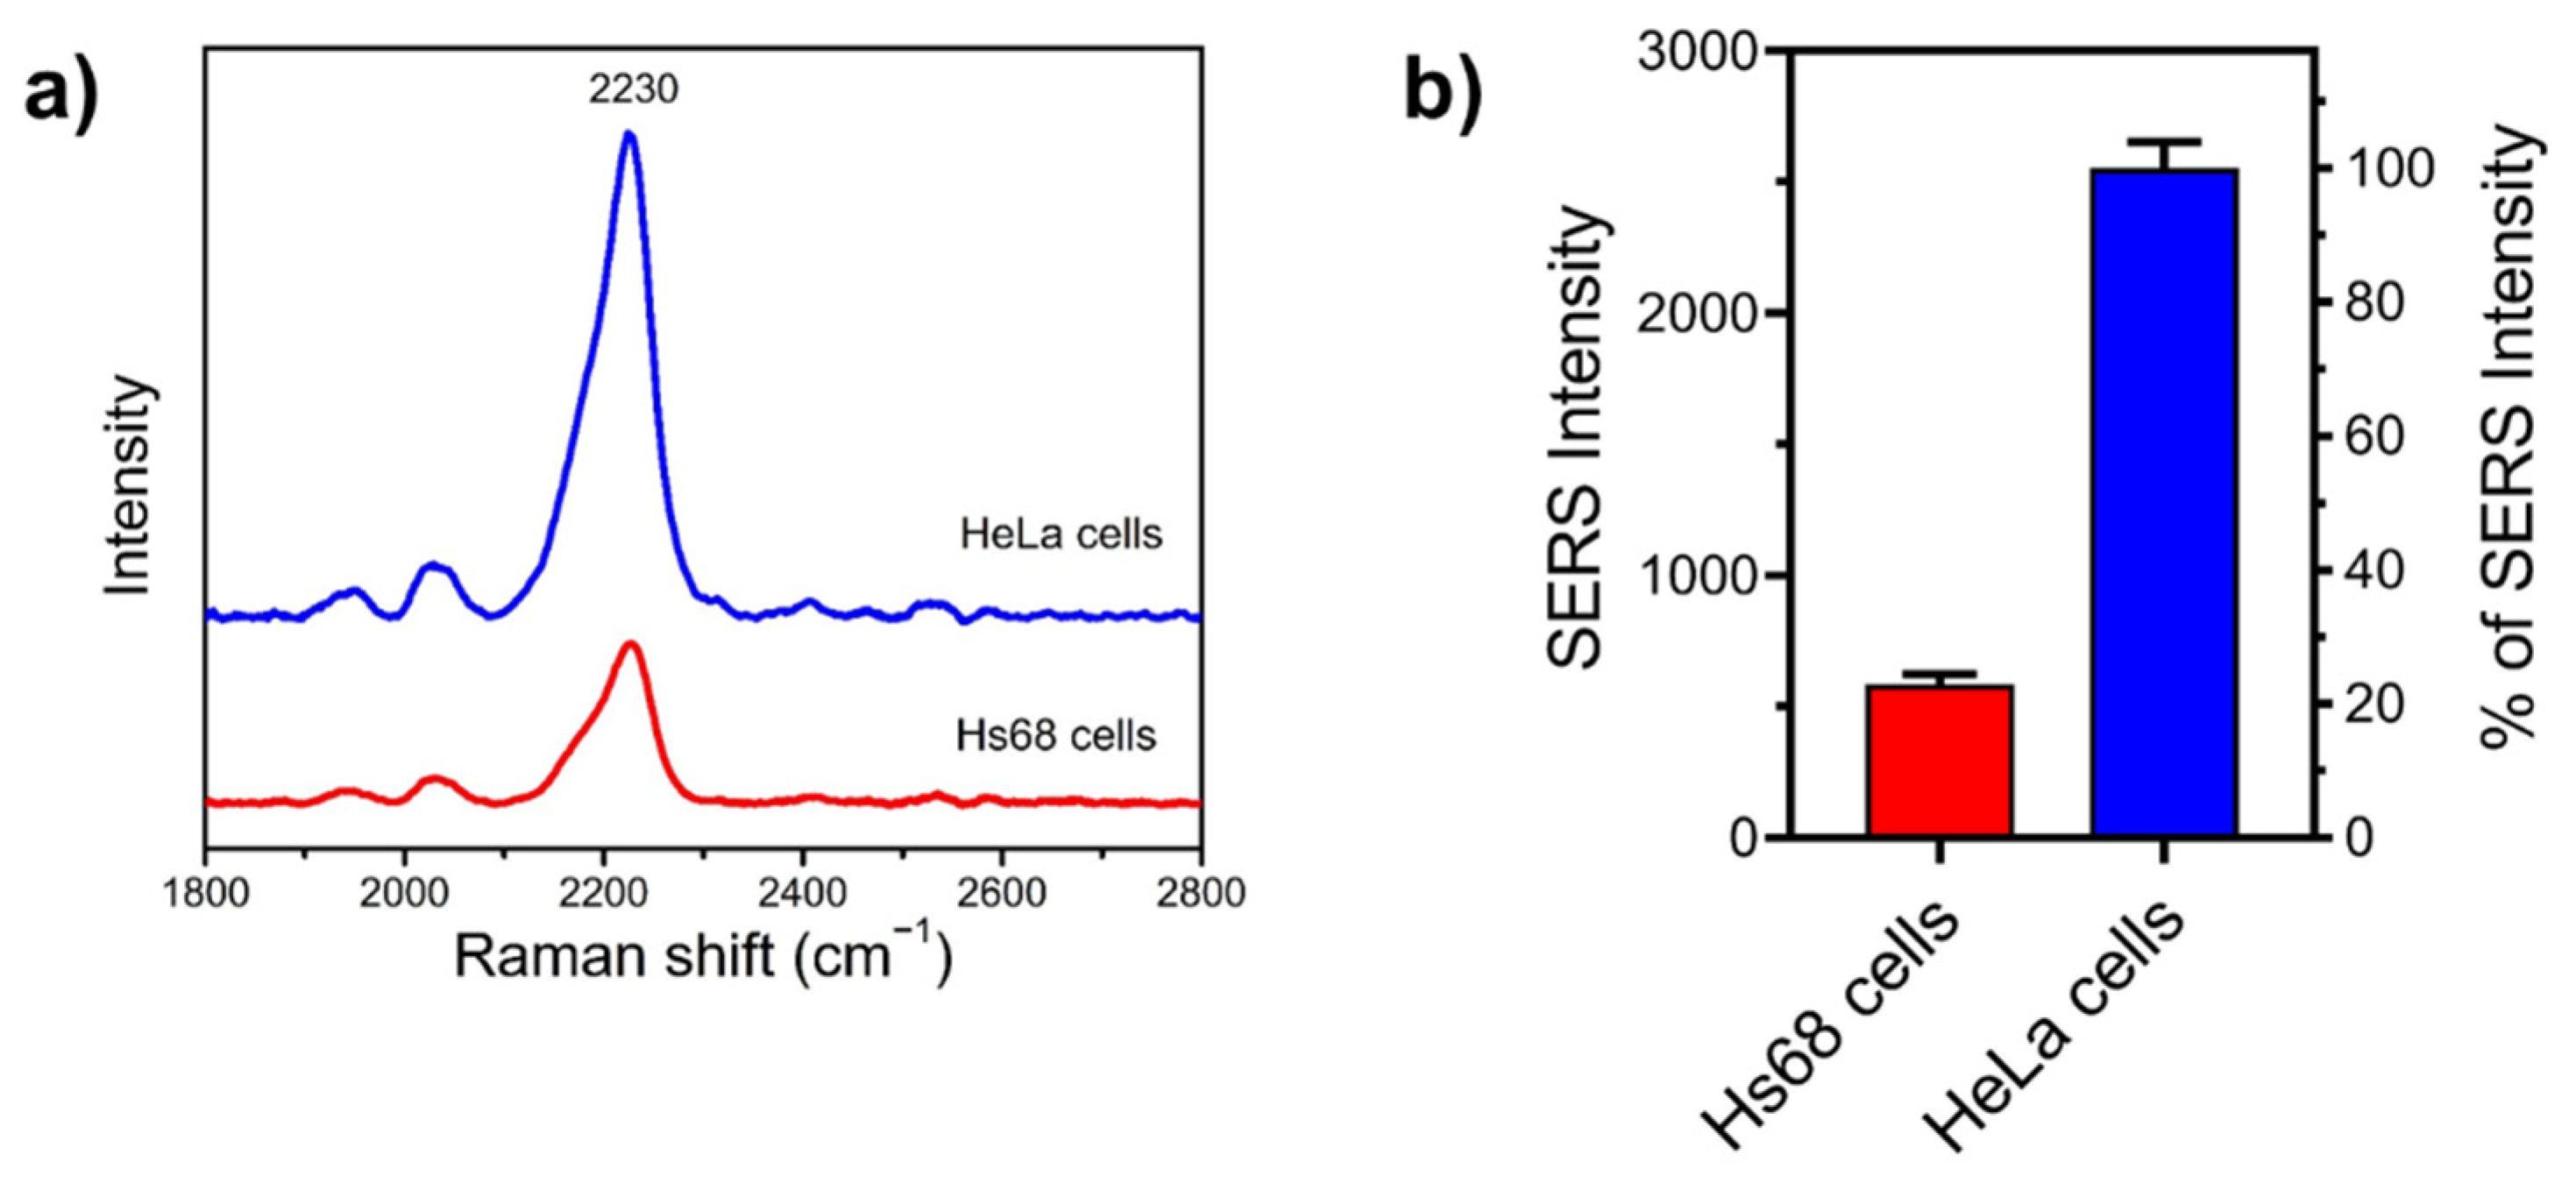
3.5. Examining SA Expression on Normal (Non-Cancerous) and Cancer Cells

To examine the applicability of our SERS nanoprobe, we compared the level of SA expression on normal cell (non-cancerous cell) and cancer cell. HeLa cells were selected as representative cancer cells where the SA expression is high, whereas Hs68 cells were chosen as normal cells containing a basic level of SA expression. As shown in Figure 5, the nanoprobe-treated HeLa cells exhibited a high SERS signal at 2230 cm−1, in comparison with the signal produced by the nanoprobe-treated Hs68 cells. Furthermore, the SERS-signal intensity from HeLa cells is 4.4 times higher than that from Hs68 cells, confirming the high SA expression on cancer cells. The result is consistent with previous study [13]. Our nanoprobe thus shows a great potential to measure the level of SA expression on cell surface.
To directly visualize the location of SA on the surface of Hs68 cell and HeLa cell, we performed Raman mapping experiments. As shown in Figure 6, the Raman signal at 2230 cm−1, assigned to the cyano moiety of reporter 6, was selected to provide background-free mapping image. The high-resolution mapping images (Figure 6b,d) showed the uneven distribution of SA on the Hs68 and HeLa cell membrane, respectively, which could correlate with the localization and distribution of glycoproteins on the cell membrane. The result is consistent with previous studies [34,35]. Notably, our nanoprobe clearly distinguished the SA expression between non-cancerous (Figure 6b) and cancer (Figure 6d) cells. The SERS spectra (in Figure 6e), obtained from points 1–3 in the mapping image of HeLa cell (Figure 6d), were free of background interference of cellular Raman signals, leading to a more precise mapping image.

4. Conclusions

SERS offers the potential to detect target molecules in a sensitive and selective manner. This study introduced a simple and reliable tri-functional nanoprobe that combines a Raman reporter, a recognition unit, and a thiol for chemisorption. The tri-functional nanoprobe, 6-conjugated AgNC, allowed for visualization of SA on the HeLa cell surface. This reporter has two beneficial features. The cyano moiety exhibits a single and sharp SERS peak in the cellular Raman silent region, leading to background-free detection. Additionally, boronic acid with the addition of an ammonium group gives enhanced binding toward SA, owing to the combined covalent bond and electrostatic interactions. Because of the reporter, the resulting tri-functional nanoprobe clearly offered the advantages of high sensitivity and background-free detection, paving the way for probing natural sialoglycans on the surface of a single HeLa cell. This nanoprobe thus holds great promise for cancer diagnosis and prognosis.

Supplementary Materials

The following are available online at https://0-www-mdpi-com.brum.beds.ac.uk/article/10.3390/chemosensors9050092/s1, Figure S1: Sensitivity of AgNCs towards reporter 6, and copies of NMR spectra (1H and 13C) of new compounds.

Author Contributions

Conceptualization, S.R. and C.-H.L.; methodology, S.R., N.V., and Z.T.; formal analysis, S.R., M.H., and C.-H.L.; resources, M.H. and C.-H.L.; writing—original draft preparation, S.R., R.-L.P., and C.-H.L.; writing—review and editing, all authors; supervision, R.-L.P., M.H., and C.-H.L.; and funding acquisition, C.-H.L. All authors have read and agreed to the published version of the manuscript.

Funding

This research was funded by Academia Sinica ([AS-SUMMIT-109], [MOST-108-3114-Y-001-002], and [AS-KPQ-109-BioMed]).

Institutional Review Board Statement

Not applicable.

Informed Consent Statement

Not applicable.

Data Availability Statement

Not applicable.

Acknowledgments

NMR spectra were acquired at the NMR facility of the Institute of Biological Chemistry at Academia Sinica.

Conflicts of Interest

The authors declare no conflict of interest.

References

  1. Varki, A. Sialic acids in human health and disease. Trends Mol. Med. 2008, 14, 351–360. [Google Scholar] [CrossRef] [Green Version]
  2. Lehmann, F.; Tiralongo, E.; Tiralongo, J. Sialic acid-specific lectins: Occurrence, specificity and function. Cell. Mol. Life Sci. 2006, 63, 1331–1354. [Google Scholar] [CrossRef] [PubMed]
  3. Angata, T.; Varki, A. Chemical diversity in the sialic acids and related α-keto acids:  an evolutionary perspective. Chem. Rev. 2002, 102, 439–470. [Google Scholar] [PubMed]
  4. Zhou, X.; Yang, G.; Guan, F. Biological functions and analytical strategies of sialic acids in tumor. Cells 2020, 9, 273. [Google Scholar] [CrossRef] [PubMed] [Green Version]
  5. Pearce, O.M.T.; Läubli, H. Sialic acids in cancer biology and immunity. Glycobiology 2015, 26, 111–128. [Google Scholar] [CrossRef] [PubMed] [Green Version]
  6. Ghosh, S. Sialic acids: Biomarkers in endocrinal cancers. Glycoconj. J. 2015, 32, 79–85. [Google Scholar] [CrossRef]
  7. Dědová, T.; Braicu, E.I.; Sehouli, J.; Blanchard, V. Sialic acid linkage analysis refines the diagnosis of ovarian cancer. Front. Oncol. 2019, 9, 261. [Google Scholar] [CrossRef] [PubMed]
  8. Lane, L.A.; Qian, X.; Nie, S. SERS nanoparticles in medicine: From label-free detection to spectroscopic tagging. Chem. Rev. 2015, 115, 10489–10529. [Google Scholar] [CrossRef]
  9. Stiles, P.L.; Dieringer, J.A.; Shah, N.C.; Duyne, R.P.V. Surface-enhanced Raman spectroscopy. Annu. Rev. Anal. Chem. 2008, 1, 601–626. [Google Scholar] [CrossRef] [Green Version]
  10. Le Ru, E.C.; Blackie, E.; Meyer, M.; Etchegoin, P.G. Surface enhanced Raman scattering enhancement factors:  a comprehensive study. J. Phys. Chem. C 2007, 111, 13794–13803. [Google Scholar] [CrossRef]
  11. Lin, L.; Tian, X.; Hong, S.; Dai, P.; You, Q.; Wang, R.; Feng, L.; Xie, C.; Tian, Z.-Q.; Chen, X. A bioorthogonal Raman reporter strategy for SERS detection of glycans on live cells. Angew. Chem. Int. Ed. 2013, 52, 7266–7271. [Google Scholar] [CrossRef] [PubMed]
  12. Di, H.; Liu, H.; Li, M.; Li, J.; Liu, D. High-precision profiling of sialic acid expression in cancer cells and tissues using background-free surface-enhanced Raman scattering tags. Anal. Chem. 2017, 89, 5874–5881. [Google Scholar] [CrossRef] [PubMed]
  13. He, X.-N.; Wang, Y.-N.; Wang, Y.; Xu, Z.-R. Accurate quantitative detection of cell surface sialic acids with a background-free SERS probe. Talanta 2020, 209, 120579. [Google Scholar] [CrossRef] [PubMed]
  14. Liang, L.; Qu, H.; Zhang, B.; Zhang, J.; Deng, R.; Shen, Y.; Xu, S.; Liang, C.; Xu, W. Tracing sialoglycans on cell membrane via surface-enhanced Raman scattering spectroscopy with a phenylboronic acid-based nanosensor in molecular recognition. Biosens. Bioelectron. 2017, 94, 148–154. [Google Scholar] [CrossRef]
  15. Deng, R.; Yue, J.; Qu, H.; Liang, L.; Sun, D.; Zhang, J.; Liang, C.; Xu, W.; Xu, S. Glucose-bridged silver nanoparticle assemblies for highly sensitive molecular recognition of sialic acid on cancer cells via surface-enhanced Raman scattering spectroscopy. Talanta 2018, 179, 200–206. [Google Scholar] [CrossRef] [PubMed]
  16. Gong, T.; Cui, Y.; Goh, D.; Voon, K.K.; Shum, P.P.; Humbert, G.; Auguste, J.-L.; Dinh, X.-Q.; Yong, K.-T.; Olivo, M. Highly sensitive SERS detection and quantification of sialic acid on single cell using photonic-crystal fiber with gold nanoparticles. Biosens. Bioelectron. 2015, 64, 227–233. [Google Scholar] [CrossRef] [PubMed]
  17. Schütz, M.; Müller, C.I.; Salehi, M.; Lambert, C.; Schlücker, S. Design and synthesis of Raman reporter molecules for tissue imaging by immuno-SERS microscopy. J. Biophotonics 2011, 4, 453–463. [Google Scholar] [CrossRef]
  18. Schlücker, S. SERS microscopy: Nanoparticle probes and biomedical applications. Chem. Phys. Chem. 2009, 10, 1344–1354. [Google Scholar] [CrossRef]
  19. Qiu, G.; Ng, S.P.; Wu, C.-M.L. Bimetallic Au-Ag alloy nanoislands for highly sensitive localized surface plasmon resonance biosensing. Sens. Actuators B Chem. 2018, 265, 459–467. [Google Scholar] [CrossRef]
  20. Evanoff, D.D., Jr.; Chumanov, G. Synthesis and optical properties of silver nanoparticles and arrays. Chem. Phys. Chem. 2005, 6, 1221–1231. [Google Scholar] [CrossRef]
  21. Evanoff, D.D.; Chumanov, G. Size-controlled synthesis of nanoparticles. 2. Measurement of extinction, scattering, and absorption cross sections. J. Phys. Chem. B 2004, 108, 13957–13962. [Google Scholar] [CrossRef]
  22. Rycenga, M.; Kim, M.H.; Camargo, P.H.C.; Cobley, C.; Li, Z.-Y.; Xia, Y. Surface-enhanced Raman scattering: Comparison of three different molecules on single-crystal nanocubes and nanospheres of silver. J. Phys. Chem. A 2009, 113, 3932–3939. [Google Scholar] [CrossRef] [Green Version]
  23. Kha, N.M.; Chen, C.-H.; Su, W.-N.; Rick, J.; Hwang, B.-J. Improved Raman and photoluminescence sensitivity achieved using bifunctional Ag@SiO2 nanocubes. Phys. Chem. Chem. Phys. 2015, 17, 21226–21235. [Google Scholar] [CrossRef]
  24. Zhang, Q.; Li, W.; Wen, L.-P.; Chen, J.; Xia, Y. Facile synthesis of Ag nanocubes of 30 to 70 nm in edge length with CF3COOAg as a precursor. Chem. Eur. J. 2010, 16, 10234–10239. [Google Scholar] [CrossRef] [Green Version]
  25. Matsumoto, A.; Stephenson-Brown, A.J.; Khan, T.; Miyazawa, T.; Cabral, H.; Kataoka, K.; Miyahara, Y. Heterocyclic boronic acids display sialic acid selective binding in a hypoxic tumor relevant acidic environment. Chem. Sci. 2017, 8, 6165–6170. [Google Scholar] [CrossRef] [Green Version]
  26. Springsteen, G.; Wang, B. A detailed examination of boronic acid–diol complexation. Tetrahedron 2002, 58, 5291–5300. [Google Scholar] [CrossRef]
  27. Djanashvili, K.; Koning, G.A.; van der Meer, A.J.G.M.; Wolterbeek, H.T.; Peters, J.A. Phenylboronate 160Tb complexes for molecular recognition of glycoproteins expressed on tumor cells. Contrast Media Mol. Imaging 2007, 2, 35–41. [Google Scholar] [CrossRef] [PubMed]
  28. Peters, J.A. Interactions between boric acid derivatives and saccharides in aqueous media: Structures and stabilities of resulting esters. Coord. Chem. Rev. 2014, 268, 1–22. [Google Scholar] [CrossRef]
  29. Goldys, E.M.; Drozdowicz-Tomsia, K. Gold and silver nanowires for fluorescence enhancement. In Nanowires—Fundamental Research; Hashim, A.A., Ed.; IntechOpen Limited: London, UK, 2011. [Google Scholar]
  30. Madeira, A.; Plissonneau, M.; Servant, L.; Goldthorpe, I.A.; Tréguer-Delapierre, M. Increasing silver nanowire network stability through small molecule passivation. Nanomaterials 2019, 9, 899. [Google Scholar] [CrossRef] [Green Version]
  31. Loza, K.; Diendorf, J.; Sengstock, C.; Ruiz-Gonzalez, L.; Gonzalez-Calbet, J.M.; Vallet-Regi, M.; Köller, M.; Epple, M. The dissolution and biological effects of silver nanoparticles in biological media. J. Mater. Chem. B 2014, 2, 1634–1643. [Google Scholar] [CrossRef] [PubMed] [Green Version]
  32. Pearson, D.A.; Blanchette, M.; Baker, M.L.; Guindon, C.A. Trialkylsilanes as scavengers for the trifluoroacetic acid deblocking of protecting groups in peptide synthesis. Tetrahedron Lett. 1989, 30, 2739–2742. [Google Scholar] [CrossRef]
  33. Wehner, J.W.; Lindhorst, T.K. Glycocluster synthesis by native chemical ligation. Synthesis 2010, 2010, 3070–3082. [Google Scholar]
  34. Song, W.; Ding, L.; Chen, Y.; Ju, H. Plasmonic coupling of dual gold nanoprobes for SERS imaging of sialic acids on living cells. Chem. Comm. 2016, 52, 10640–10643. [Google Scholar] [CrossRef] [PubMed]
  35. Wang, D.-E.; Yan, J.; Jiang, J.; Liu, X.; Tian, C.; Xu, J.; Yuan, M.-S.; Han, X.; Wang, J. Polydiacetylene liposomes with phenylboronic acid tags: A fluorescence turn-on sensor for sialic acid detection and cell-surface glycan imaging. Nanoscale 2018, 10, 4570–4578. [Google Scholar] [CrossRef] [PubMed]
Figure 1. Characterization of synthesized AgNCs using (a) SEM, (b) XRD, and (c) UV-Vis spectrum.
Chemosensors 09 00092 g001
Figure 2. Characterizations of the synthesized tri-functional nanoprobe (reporter 6-conjugated AgNCs) by (a) hydrodynamic size, (b) zeta potential, and (c) SERS measurement (at λ = 532 nm, 0.78 mW, 100× objective lens, exposure time of 5 s).
Chemosensors 09 00092 g002
Scheme 1. Synthesis of reporter 6.
Chemosensors 09 00092 sch001
Figure 3. Bright-field image with a location marker for corresponding SERS spectra of SA on the HeLa cell surface using the 6-conjugated (a,b) and the bare AgNCs (c,d). λ = 532 nm, 0.78 mW, 100× objective lens, exposure time of 5 s.
Chemosensors 09 00092 g003
Figure 4. (a) SERS spectra resulting from the HeLa cells that were incubated with monosaccharide-pretreated nanoprobe. (b) SERS spectra of nanoprobe incubated with HeLa cells, HeLa cells pretreated with 0.04 mM PBA, HeLa cells pretreated with 0.4 mM PBA, and HeLa cells pretreated with 20 mU of sialidase. (c,d) Bar graphs displaying corresponding intensities of SERS spectra from (a,b), respectively. λ = 532 nm, 0.78 mW, 100× objective lens, exposure time of 5 s.
Chemosensors 09 00092 g004
Figure 5. (a) SERS spectra were obtained from Hs68 cells and HeLa cells that were pretreated with the tri-functional nanoprobe. (b) Bar graph corresponding the intensities of SERS signals of Figure 5a (λ = 532 nm, 0.78 mW, 100× objective lens, exposure time of 5 s).
Chemosensors 09 00092 g005
Figure 6. SA expression on the surface of single Hs68 cell and HeLa cell that were pretreated with nanoprobe. Bright-field (a,c) and SERS mapping (b,d) images of Hs68 cell and HeLa cell, respectively, were generated by the excitation with 532 nm laser (0.78 mW, 100× objective lens, exposure time of 1 s, and step size 1 µm). (e) SERS spectra corresponding to points 1–3 were produced by the SERS mapping image of HeLa cell (d).
Chemosensors 09 00092 g006
Publisher’s Note: MDPI stays neutral with regard to jurisdictional claims in published maps and institutional affiliations.

