Article

Classification and Identification of Essential Oils from Herbs and Fruits Based on a MOS Electronic-Nose Technology

1
Department of Biosystems Engineering, University of Mohaghegh Ardabili, Ardabil 56199, Iran
2
Pathology Department, Southern Hardwoods Laboratory, Center for Forest Genetics & Ecosystems Biology, Southern Research Station, USDA Forest Service, 432 Stoneville Road, Stoneville, MS 38776, USA
3
Institute of Agrophysics, Polish Academy of Sciences, Doświadczalna 4, 20-290 Lublin, Poland
4
Faculty of Production and Power Engineering, University of Agriculture in Kraków, Balicka 116B, 30-149 Kraków, Poland
*
Authors to whom correspondence should be addressed.
Submission received: 19 May 2021 / Revised: 10 June 2021 / Accepted: 13 June 2021 / Published: 16 June 2021

Abstract

:
The frequent occurrence of adulterated or counterfeit plant products sold in worldwide commercial markets has created the necessity to validate the authenticity of natural plant-derived palatable products, based on product-label composition, to certify pricing values and for regulatory quality control (QC). The necessity to confirm product authenticity before marketing has required the need for rapid-sensing, electronic devices capable of quickly evaluating plant product quality by easily measurable volatile (aroma) emissions. An experimental MAU-9 electronic nose (e-nose) system, containing a sensor array with 9 metal oxide semiconductor (MOS) gas sensors, was developed with capabilities to quickly identify and classify volatile essential oils derived from fruit and herbal edible-plant sources. The e-nose instrument was tested for efficacy to discriminate between different volatile essential oils present in gaseous emissions from purified sources of these natural food products. Several chemometric data-analysis methods, including pattern recognition algorithms, principal component analysis (PCA), and support vector machine (SVM) were utilized and compared. The classification accuracy of essential oils using PCA, LDA and QDA, and SVM methods was at or near 100%. The MAU-9 e-nose effectively distinguished between different purified essential oil aromas from herbal and fruit plant sources, based on unique e-nose sensor array responses to distinct, essential-oil specific mixtures of volatile organic compounds (VOCs).

1. Introduction

Uses of purified essential oils as additives in foods, cosmetics and fragrance industries have increased significantly in recent decades [1,2]. Essential oils are normally sold as highly concentrated, pure hydrophobic mixtures of natural chemicals extracted from medicinal herbal plants and fruits. Approximately 90% of the total worldwide production of essential oils is consumed by the food flavoring and perfume industries [3]. Recognizing and classifying essential oils according to their quality and purity can be of great importance for processing and producing high quality products [2]. Natural sources of essential oils from plants consist of complex mixtures of volatiles that typically exist in low concentrations. Different methods such as hydro-distillation and centrifugation, steam distillation and cold press processes may be used to extract them [4]. By contrast, fragrance oils are manufactured (synthetic), petroleum-based products sold to mimic the aroma (scent) of real fruits such as banana, blueberry, cantaloupe, cranberry, kiwi, pineapple, pomegranate, raspberry, strawberry, and watermelon which do not contain extractable essential oils [5].
The commercial value and importance of essential oils makes products manufactured using these oils subject to regulatory standards that require detection of counterfeit or adulterated products in commercial markets in order to prevent the illegal sale of plant products at prices greater than their commercial value. Rapid detection of counterfeit raw materials is very important for quality assurance and quality control (QA/QC) procedures, as well as for health concerns (avoiding consumption of artificial or unknown harmful products) in industrial production processes, but existing analytical methods used for QA/QC often are expensive and time consuming. Currently, conventional methods for classifying aromatic substances involve sensory analysis performed by human experimental panels consisting of several experts provided with a list of key features and samples for scoring. This method may appear to be a quick task (at first glance), but plant-product sampling is usually limited or compromised due to high expense, lack of precision or measurement standardization, score variability between human testers, and low reproducibility [6,7]. An alternative QA procedure is to utilize instrumental methods such as gas chromatography (GC), which is objective and accurate, but also expensive, time consuming, involves destructive sampling, and must be performed by trained professionals [8,9]. Therefore, the development of inexpensive, accurate and rapid methods for quickly evaluating and classifying essential oils is key to effective commercial QA/QC testing. The availability of electronic aroma detection (EAD) technologies, instruments and associated methods provide a good alternative testing method due to low costs, precision (repeatability), and avoidance of operator fatigue by human testers [2]. Advances in electronic olfactory technologies have led to the rapid proliferation and use of artificial-intelligence (AI) devices, such as electronic-nose (e-nose) devices, as rapid and non-invasive detection tools [10]. E-nose devices are particularly well suited for detection and analysis of volatile organic compounds (VOCs) [11], and these instruments have a long history of effective use in numerous industrial applications, including food quality and food safety [12], medicine [13] and agriculture [14,15,16,17,18].
The capabilities of analytical methods and technologies to provide fast, reliable, sensitive and straightforward detection characteristics are increasingly important for the rapid detection of counterfeit and adulterated foods. The main purpose of these techniques is to quickly detect counterfeit food products early before economic losses or harm to consumers becomes uncontrollable [19]. Development of gas-sensor array technologies, such as e-nose devices, are promising analytical tools with capabilities of rapidly detecting distinct mixtures of volatiles emanating from food products. E-nose devices contain an array of non-specific, cross-reactive chemical sensors that detect food volatiles, consisting of unique combinations of VOCs, and provide specific chemical fingerprints (smellprint signatures) of the VOCs being analyzed [15,20,21].
Previous studies have reported on applications of electronic-nose devices to classify and discriminate between isolated or purified essential oils concentrated from natural plant food sources. Russo et al. [22] tested the effectiveness of a model ISE Nose 2000 electronic-nose system with a 12 MOS sensor array for detecting the genuineness and quality of bergamot (Citrus bergamia) essential oil. Recently, Graboski et al. [23] utilized an e-nose with a carbon nanocomposite e-nose sensor array to investigate the purity of clove (Syzygium aromaticum) essential oil. An e-nose system coupled with DFA statistical analysis was developed by Lias et al. [24] to evaluate the relationship between sample volumes and sensor intensity of agarwood or lign-aloes (Aquilaria species) essential oil blending ratios. Wu et al. [25] recently evaluated antioxidant ingredients of spikenard (Nardostachys jatamansi) essential oil by dual-technology ultra-fast gas chromatography/e-nose analysis. Most other previous e-nose studies have focused primarily on discrimination of plant aroma VOC emissions from raw natural, unpurified and unconcentrated volatiles derived from leaves, fruits, and woody stems of herbaceous and woody plants, rather than analysis of purified, concentrated essential oils [26,27,28].
The purposes of this study were to: 1) evaluate an experimental MOS e-nose system (the MAU-9) for capabilities of identifying and classifying VOC emissions derived from the purified essential oils from six edible plant species, including those from three fruits (EOF) and three herbs (EOH), and 2) test four chemometric statistical data-analysis methods for discriminating between essential oils based on MAU-9 e-nose data.

2. Materials and Methods

2.1. Essential Oil Samples

Six essential oils (EOs) derived from individual species of edible plants, prepared by steam extraction, including three from the leaves of medicinal herb plants (thyme, tarragon and mint) and three from skin peels of common palatable fruits (oranges, lemons and mangos), were selected and purchased for this study from a commercial source (Barij Essence Pharmaceutical Company, Tehran, Iran) with an essential-oil production plant. All samples consisted of purified and concentrated oils in liquid form that did not contain any organic solvents within the sample. The specific names of essential oils derived from each commercial plant product source are as follows: thyme oil from thyme (Thymus vulgaris) leaves, tarragon oil from tarragon (Artemisia dracunculus) leaves, mint oil from mint (Mentha arvensis) leaves, orange oil from orange (Citrus sinensis) fruit, lemon oil from lemon (Citrus limon) fruit, and mango oil from mango (Mangifera indica) fruit.

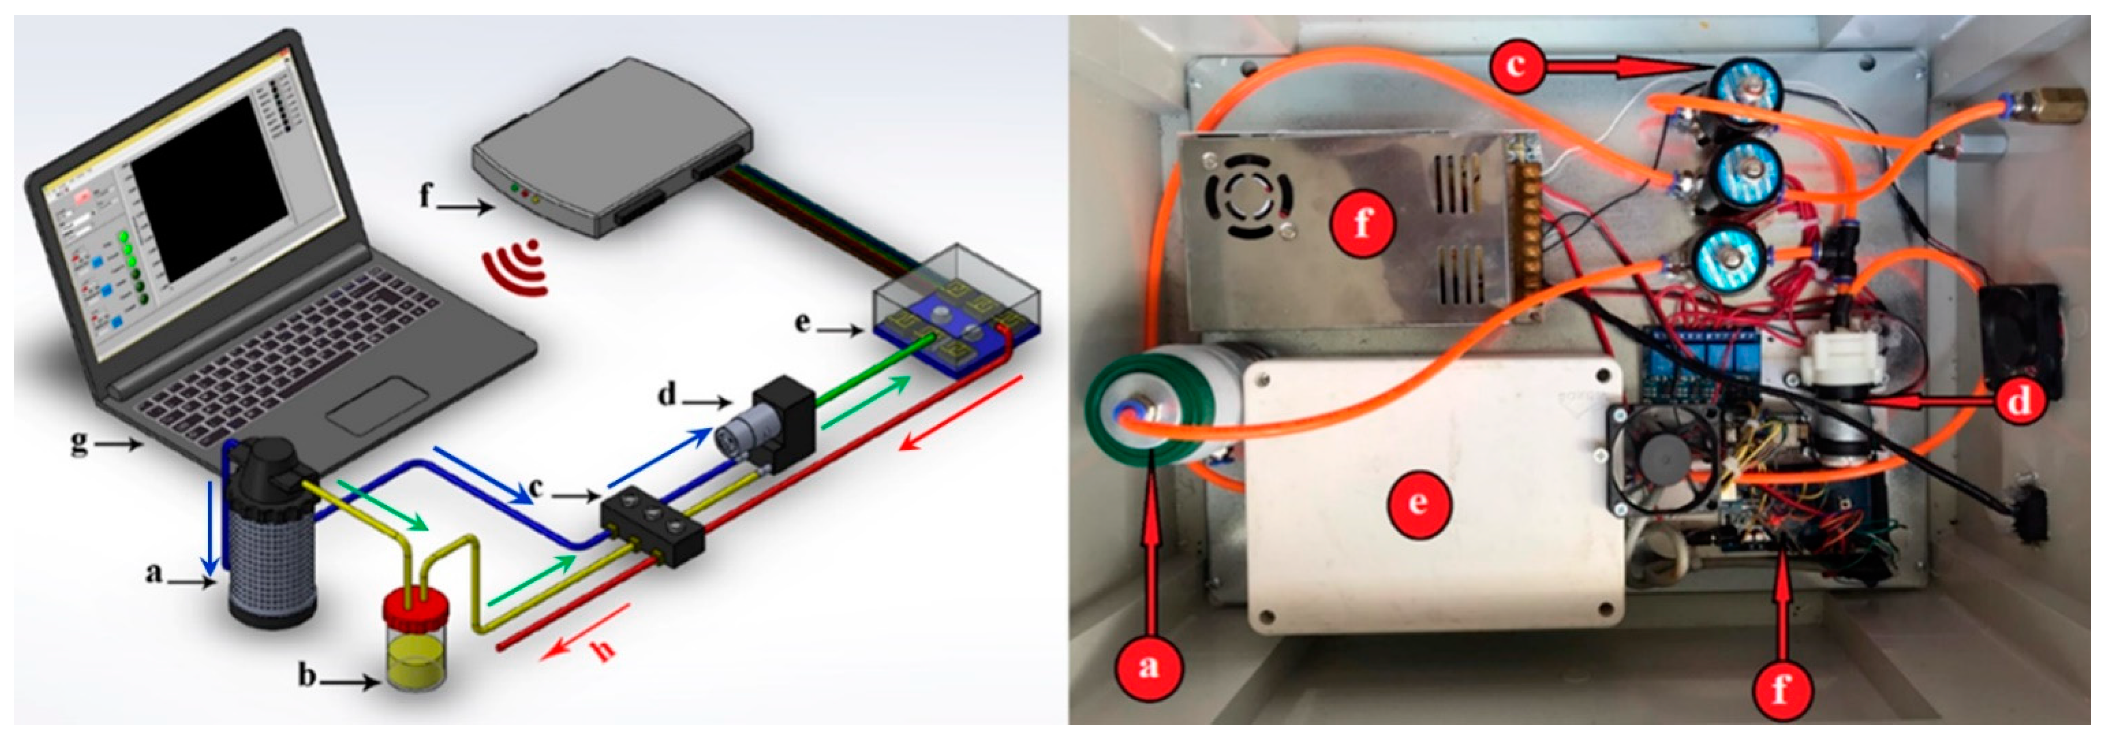
2.2. Electronic Nose Instrument

An experimental MAU-9 electronic-nose system, designed based on a 9-sensor tin metal oxide semiconductor (MOS) sensor array, was developed by the Biosystems Engineering Department of Mohaghegh Ardabili University, Ardabil, Iran, and utilized to analyze aroma signature patterns derived from sensor output responses to VOCs from purified essential oils analyzed in this study [8]. The components of this system consisted of five integrated components (a–e), connected in series by 4.0-mm PTFE (Teflon) tubing as illustrated in Figure 1. Data from the sensor array were recorded by a wireless data recorder that transmitted the data to a personal computer (PC) for collation and statistical analysis.
The MAU-9 e-nose device has a sensor array composed of 9 tin oxide gas sensors. The names and specifications of the MOS sensors within the sensor array, including detection ranges and sensitivities to a limited number of known VOCs, are presented in Table 1.
Most sensors in the array have cross-reactivity and respond to a wide range of VOCs from different chemical classes. Thus, the list of known sensitivities (presented here) is only a partial list, limited to those specifically determined from empirical studies which have tested sensor responses to individual compounds. The actual range of sensitivities of individual sensors in the array is considerably wider that indicated from this limited test list.

2.3. Instrument Settings and Run Parameters

The process of data acquisition, derived from the MAU-9 e-nose system, was divided into three phases including baseline establishment, sample air aroma injection and purification with a total run time of 350 s. The responses of the nine MOS sensors were recorded and graphed based on voltage variation (∆V) vs. time. The details of run parameters and procedures for the data-acquisition phases of this e-nose system are given in the following subsections.

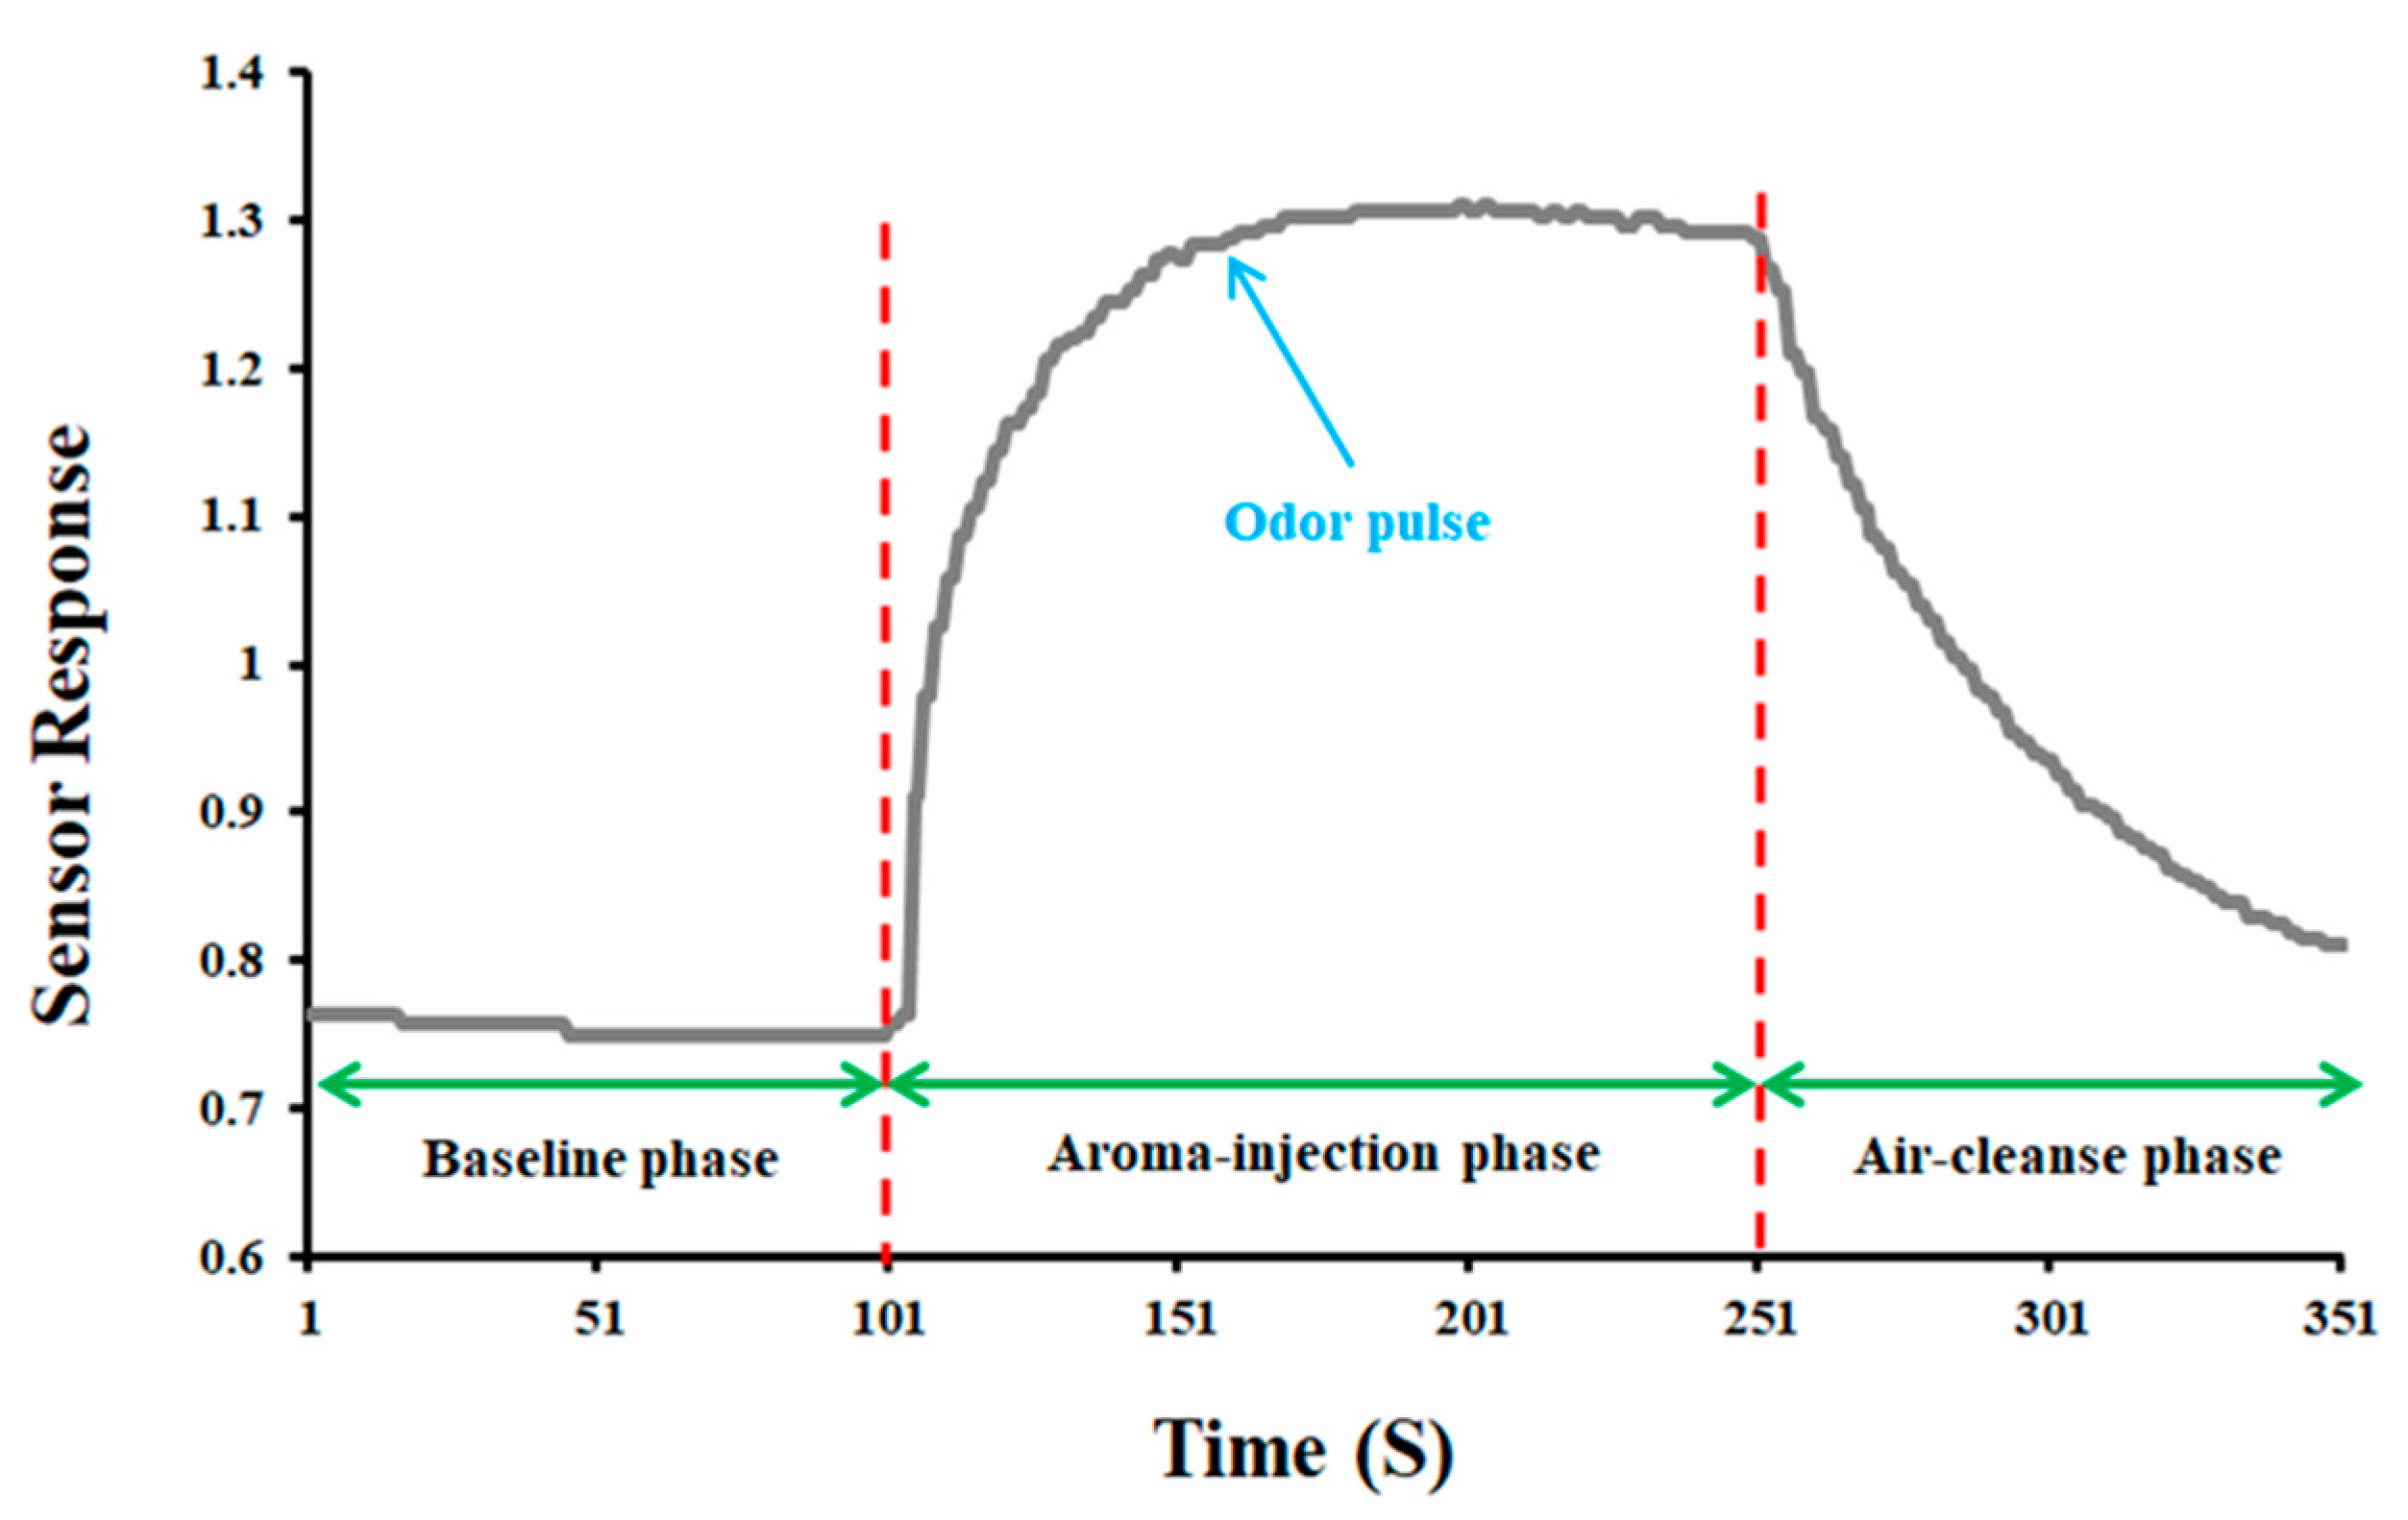
2.3.1. Baseline Phase

To obtain a stable sensor response, clean air generated by the filter (a) enters the sensor chamber (e) with the help of a diaphragm pump (d) by passing thorough one-way valves (c) at a flow rate of 0.8 L per minute for 100 s.

2.3.2. Sample Aroma-Injection Phase

The main part of the sample headspace (b) is injected into the sensor chamber (e) within 150 s by passing through the solenoid valve and pump at a flow rate of 0.8 L per minute. This step continues until stable sensor-array voltage responses are reached.

2.3.3. Purge and Air-Cleanse Phase

Clean air is reinjected into the sensor chamber by opening the solenoid valve through the filter for 100 s, allowing the sensors to return and stabilize to their low original baseline values (prior to run initiation) with <1% fluctuation in sensor-output responses for 40 s, defined as a stable or steady state between sample runs.

2.3.4. Data Collection Cycle

All data was recorded at 1-s intervals by the data card (f) and transmitted to the computer (g) via a wireless network, displayed in real-time on a computer screen, and saved as text files on a disk for further data processing. During a full e-nose run cycle, each sensor recorded 380 data points per sample analysis. An example of the sensor output response for sensor TGS-813, showing all stages of the e-nose run cycle, are illustrated in Figure 2.

2.4. Sample E-Nose Analyses

The analysis of sample headspace volatiles (VOCs) from purified essential oils was performed daily during data acquisition to minimize instrument baseline drift. A minimum of 15 replicates per sample were measured for each sample type (essential oil) and all data recorded during measurements by a data card were transmitted to the computer via a wireless network.

2.5. Post-Analysis Data Processing and Statistical Comparisons

All data recorded from separate sensors of the MAU-9 e-nose sensor array were extracted for data preprocessing and analysis. The goal of signal preprocessing was to extract relevant information from the sensor output responses and to prepare the data for multivariate pattern analysis. Sensor responses were normalized relative to their baseline for purposes of thrust compensation, contrast enhancement, and scaling using the fraction method, as described previously by Karami et al. [7], and expressed by Equation (1):
Y s ( t ) = X s ( t ) X s ( 0 ) X s ( 0 )
in which Ys (t), Xs (0), and Xs (t) indicate the normalized sensor response, the baseline, and the raw unprocessed sensor response, respectively.
Several chemometric-analysis procedures were utilized as multivariate statistical methods for analyzing e-nose data. For example, principal component analysis (PCA) was used to reduce the size of the data while retaining most information. PCA converted a set of correlated variables into a set of non-correlated linear variables called principal components (PCs). The first principal component (PC1) accounts for the largest portion (highest percentage) of total sample variance. The second principal component (PC2) accounts for the next largest percentage of sample variance. Samples were plotted and classified using multiple principal components (PC1 and PC2) etc., to visually assess the similarities and differences between them [21].
Linear discriminant analysis (LDA) and Quadratic discriminant analysis (QDA), boundary-detection statistical methods, were utilized to help find boundaries that separate e-nose sample aroma classes or groups. LDA was utilized to find linear boundaries, using a straight line or hyperplane to divide the variable space into regions. QDA was used to find quadratic boundaries where a quadratic curve divides the variable space into regions. Both statistical models are based on Mahalanobis distance (MD), but LDA considers a single variance-covariance matrix for all classes, whereas QDA considers a different variance-covariance matrix for each class [29].
Support vector machine (SVM) was used as a supervised machine learning method to classify and analyze data regressions. Kernel functions included linear, polynomial, sigmoid, or radial-basis functions [21].
Two statistical parameters, including the coefficient of determination (R2) and the Root Mean Square Error (RMSE) were used to evaluate the performance of regression models relative to how well they fit the data. The confusion (perturbation) matrix was used to select the best regression model. Sensitivity, specificity, accuracy, and precision parameters were used to analyze overall e-nose system performance, based on Equations (2)–(6) defined previously [10,30]:
Sensitivity = TP TP + FN
Specificity = TN TN + FP
Precision = TP TP + FP
Accuracy = TP + TN TP + TN + FN + FP
AUC = Sensitivity + Precision 2
in which TP (True Positive), TN (True Negative), FP (False Positive), and FN (False Negative) values (all dimensionless) are indicated.
The importance and weight of each performance criterion was considered (assumed to be) equal to one. In addition, Matlab (vers. 2014a) [Mohaghegh Ardabili University, Ardabil, Iran] and Unscrambler X (vers. 10.4) [Mohaghegh Ardabili University, Ardabil, Iran] utility softwares were used in data analyses.

3. Results

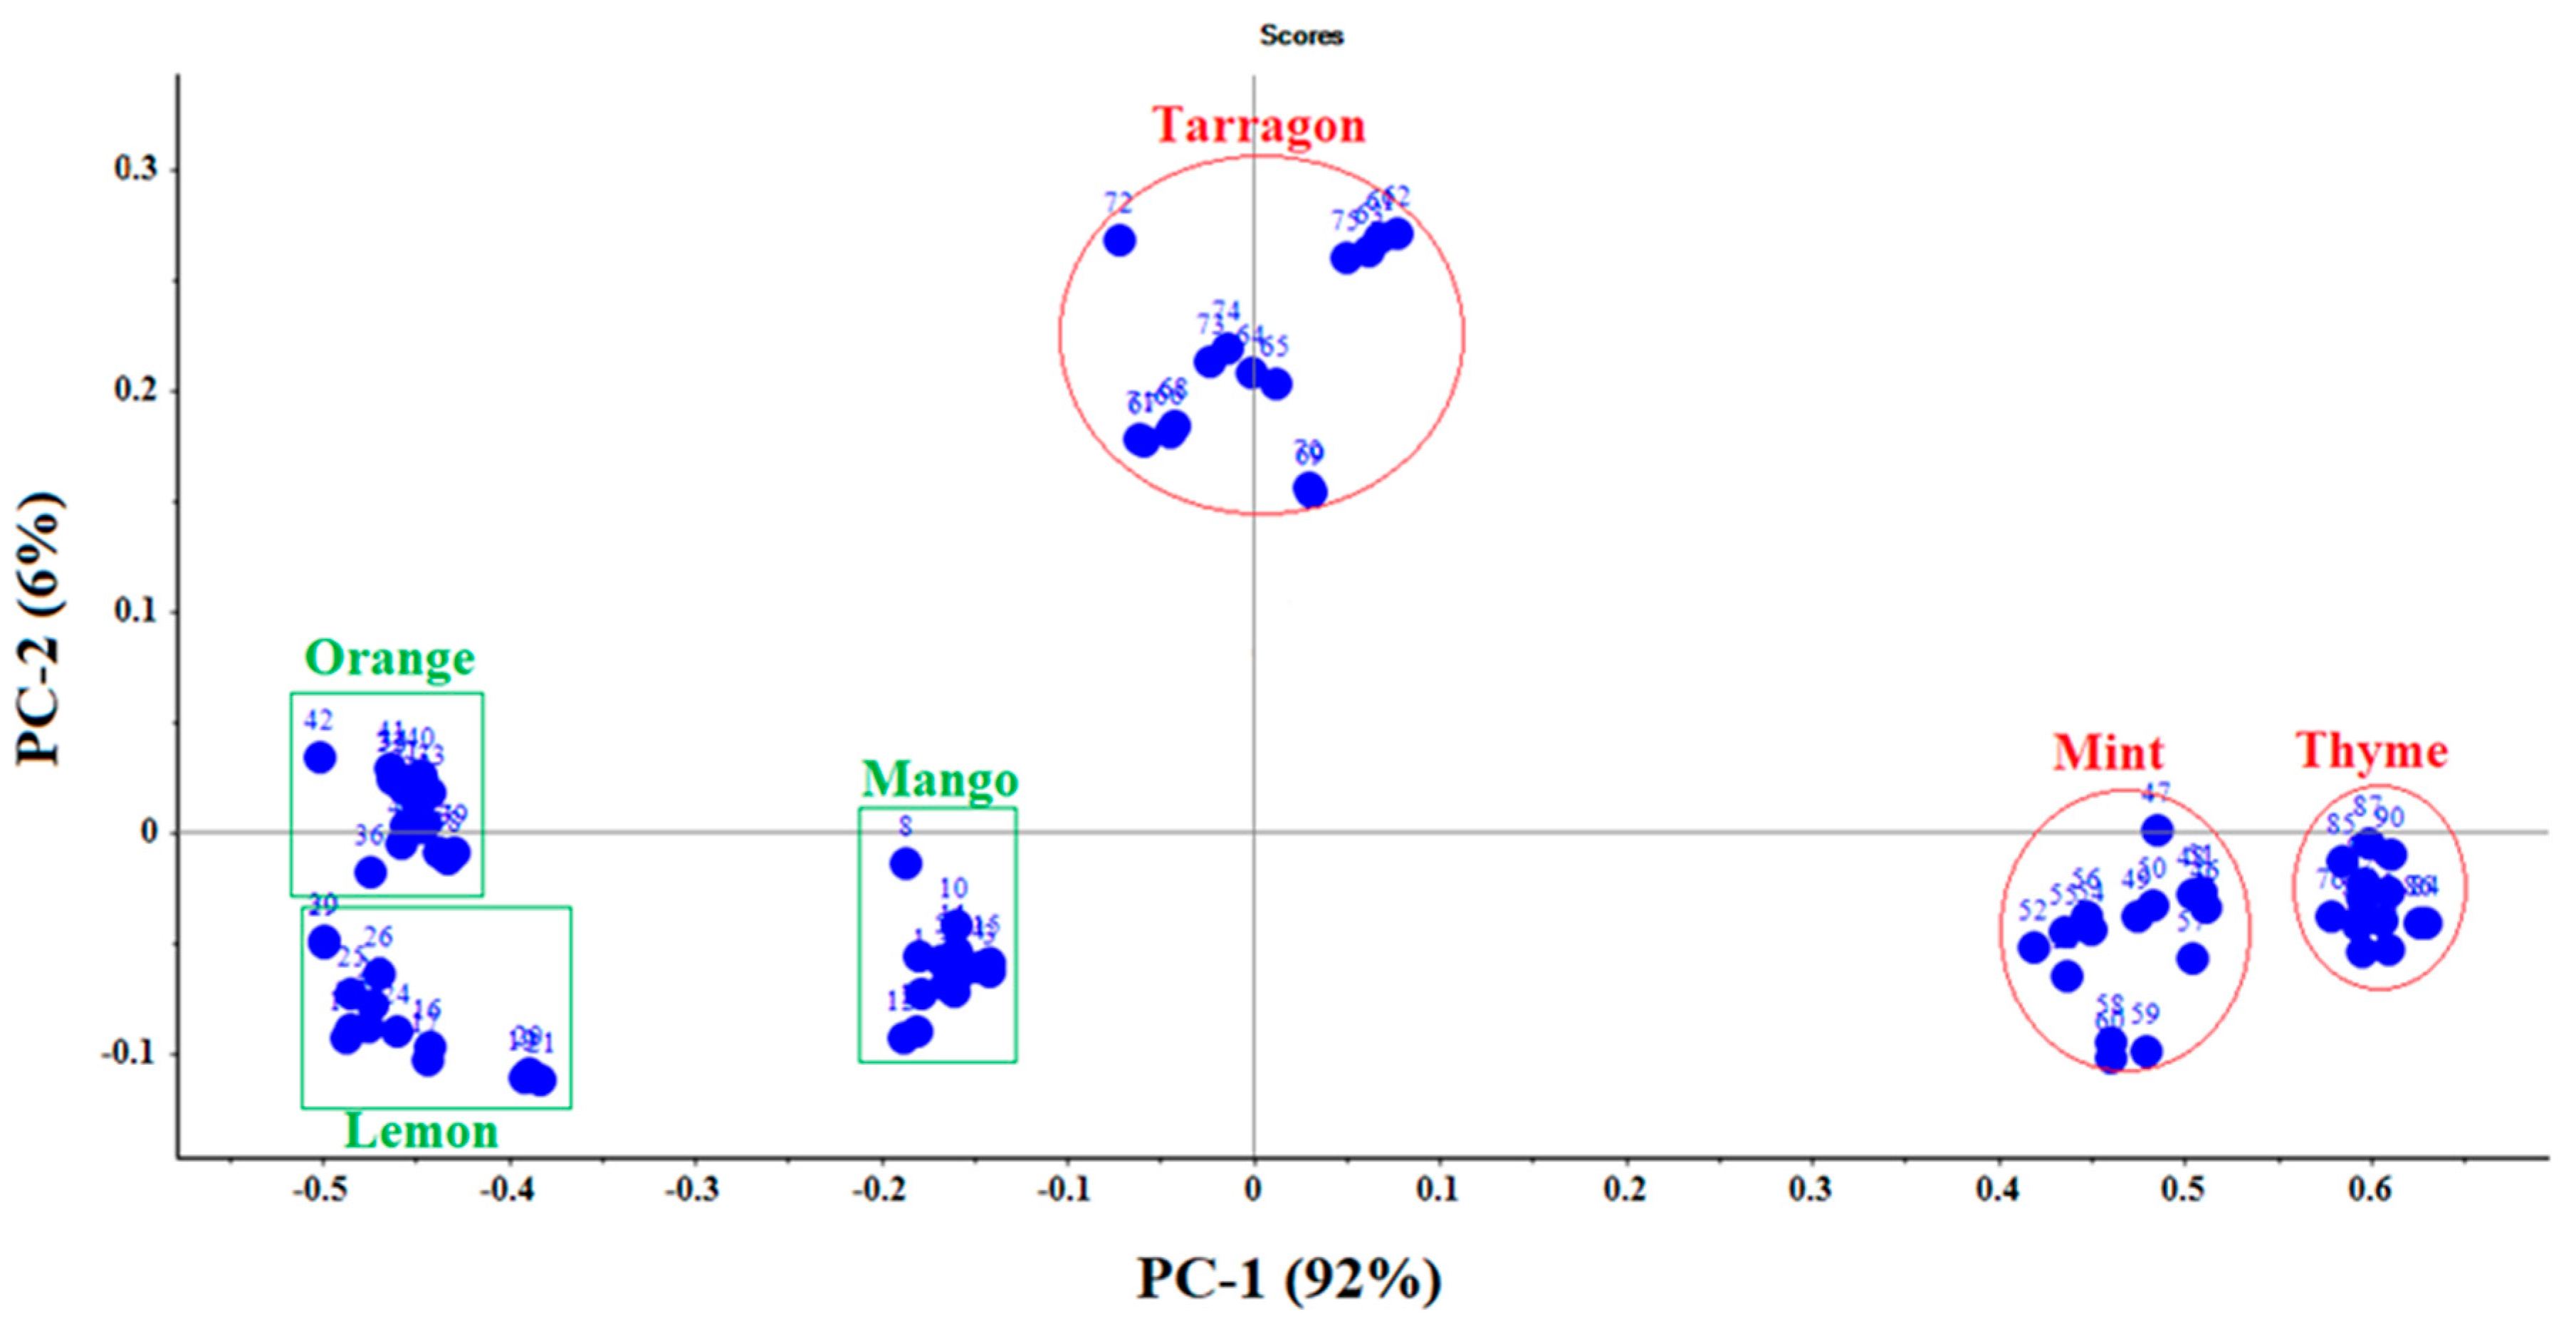
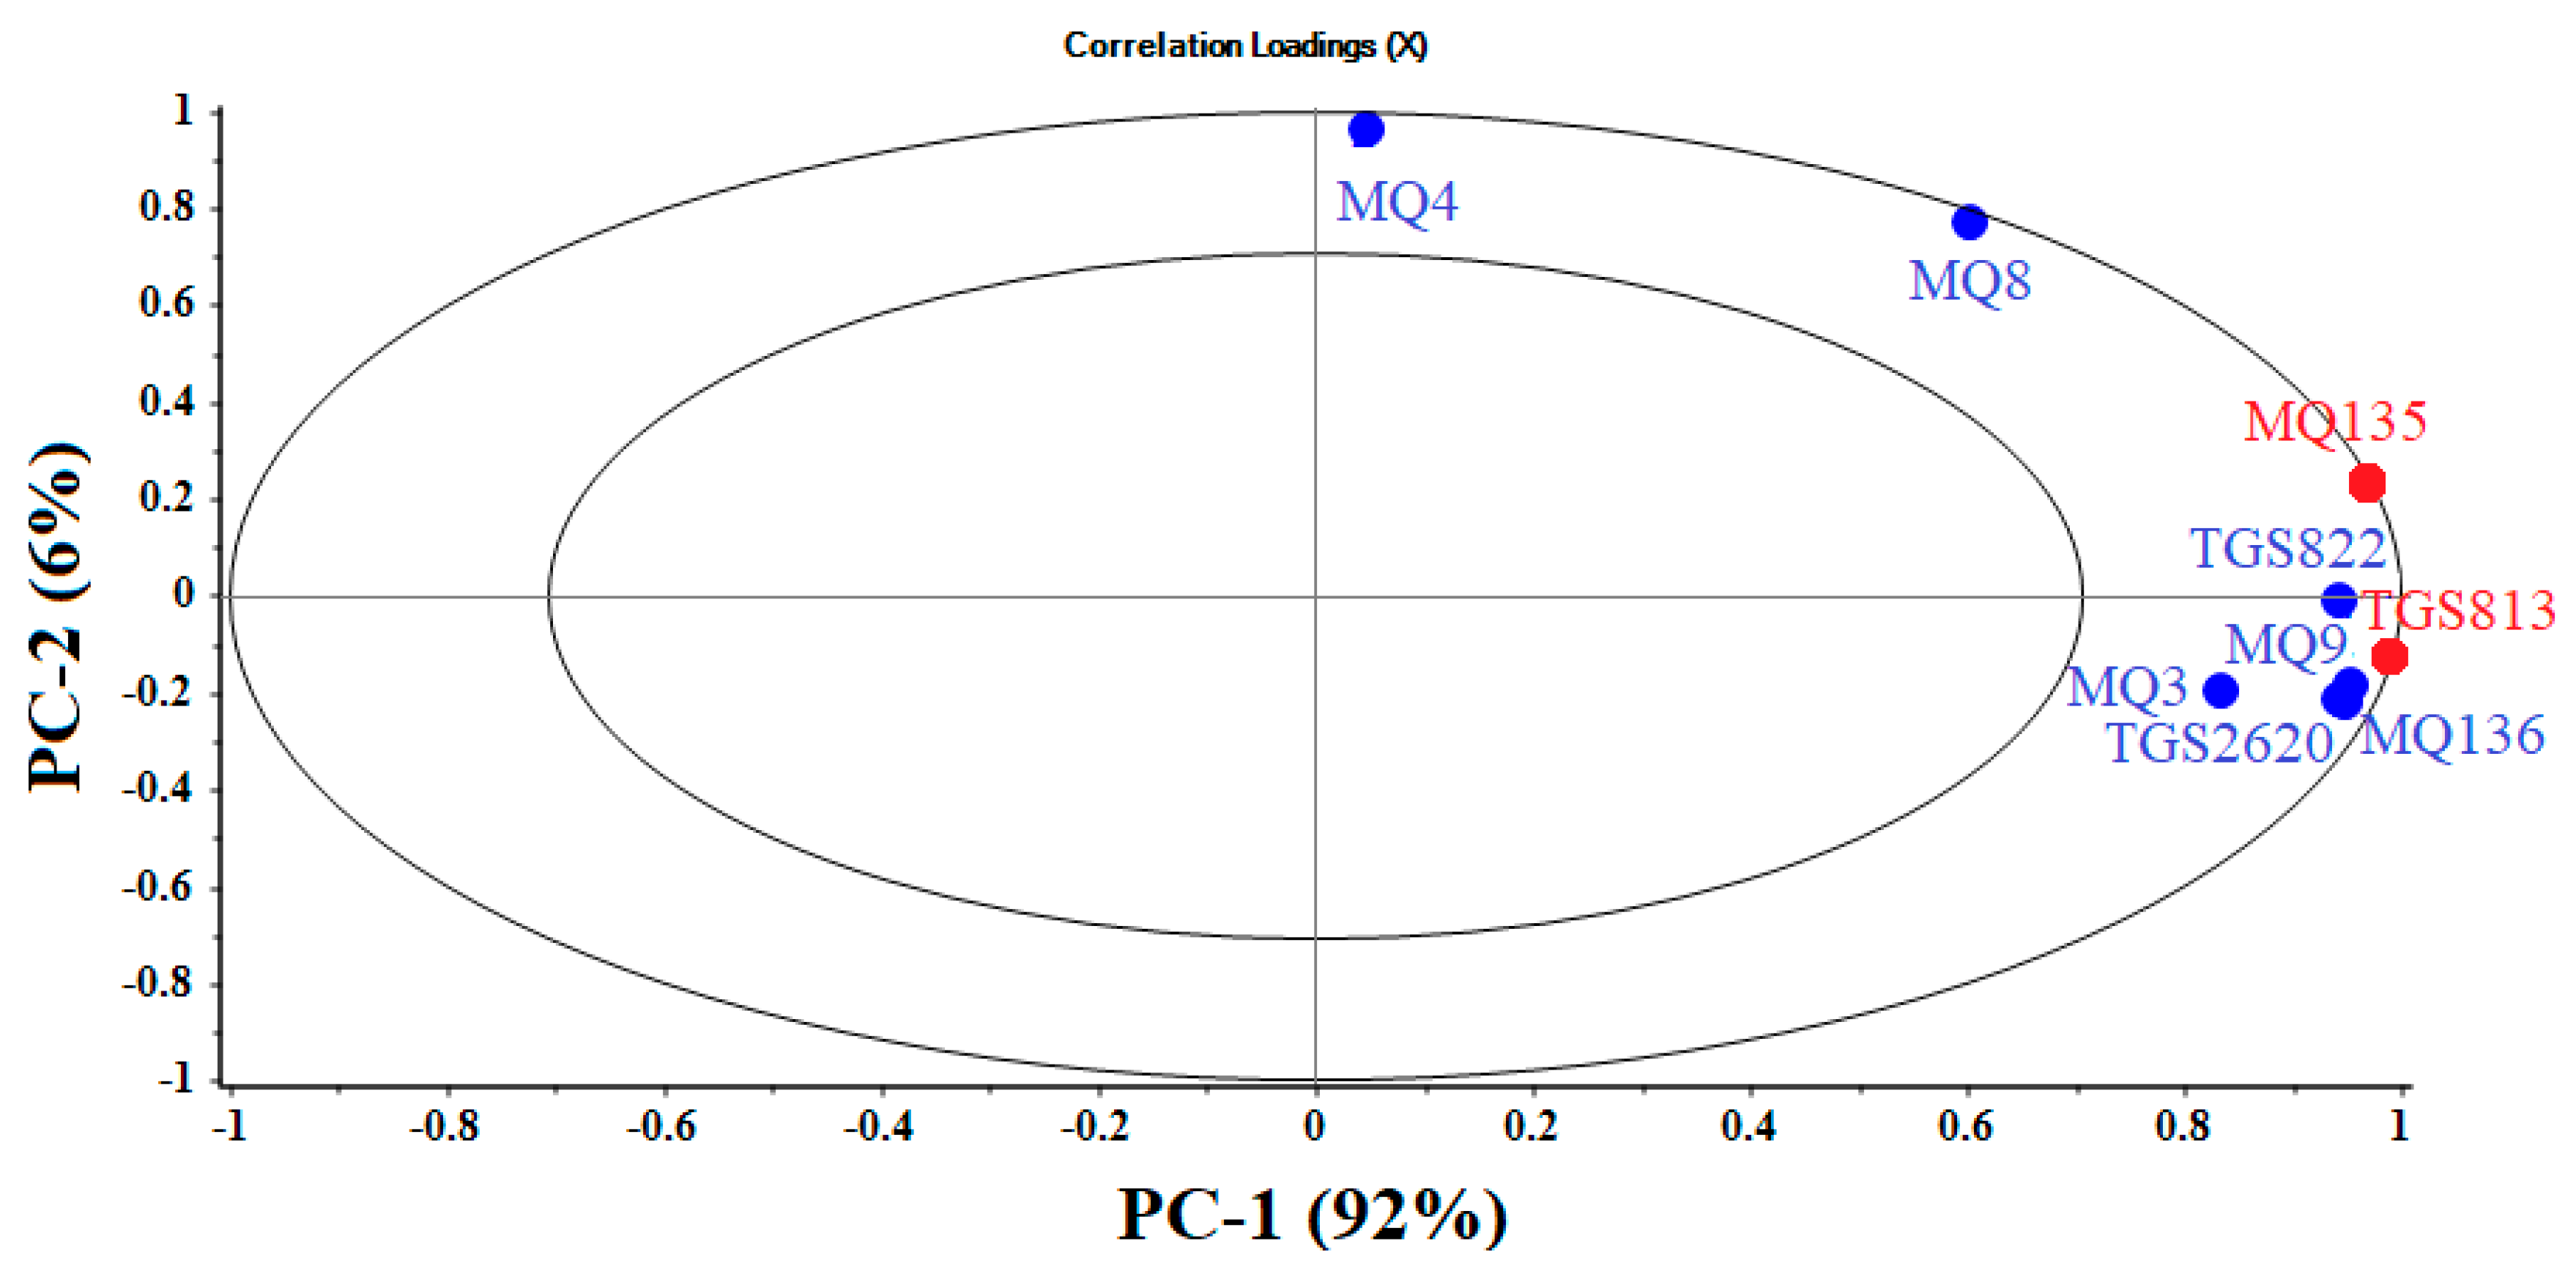
3.1. Principal Component Analyses

The score diagram demonstrates the predicted positions of principal components (PCs), found among VOC emissions of each sample type and statistically determined via PCA from e-nose output values from analysis of essential oil volatiles. Depending on the position of each group in the score diagram (position with positive or negative values on the 4-quadrat chart), it is possible to assign specific PC values for all sample types. The PCA results of six essential oil sample types are presented in Figure 3, based on sensor responses. The first and second PCs accounted for 92% and 6% of the total sample variance, respectively. The sum of the first two PCs represents 98% of the total sample variance, presenting sufficient information for explaining differences in the aromas of essential oils. There is a clear difference between samples of essential oils of medicinal plants and essential oils of fruits. Based on the location and spatial distribution of data clusters (represented by each sample type), samples of fruit essential oils (left) were well differentiated (spatially separated) from samples of medicinal plants (right), indicating significant differences in chemical composition of VOCs from these two groups based on their corresponding volatile EO analytes. The relatively tight data clusters, derived from multiple sample replications of each sample type, indicate that instrument precision was good for all six types of EO sample analytes. The effective repeatability of sensor-array output values for each sample type provided an indication that the MAU-9 sensor array was consistently responsive to headspace VOC emissions from both herbal and fruit essential oils.
Loading diagrams also demonstrated the relationship between the independent variables (e.g., sensors) and the fundamental components. These diagrams are produced by sensor coefficients using special vector equations. For each sensor, a calculated high-loading value (for PCs) indicated that a larger share of the total sensor array output is derived (accounted for) from that sensor. Figure 4 shows the loading values of these sensors in PCs. Therefore, MQ3, MQ4, MQ9 sensors have the lowest loading coefficients and TGS813 and MQ135 sensors have the highest loading coefficients, so they play a more important role in the classification of edible essential oils.

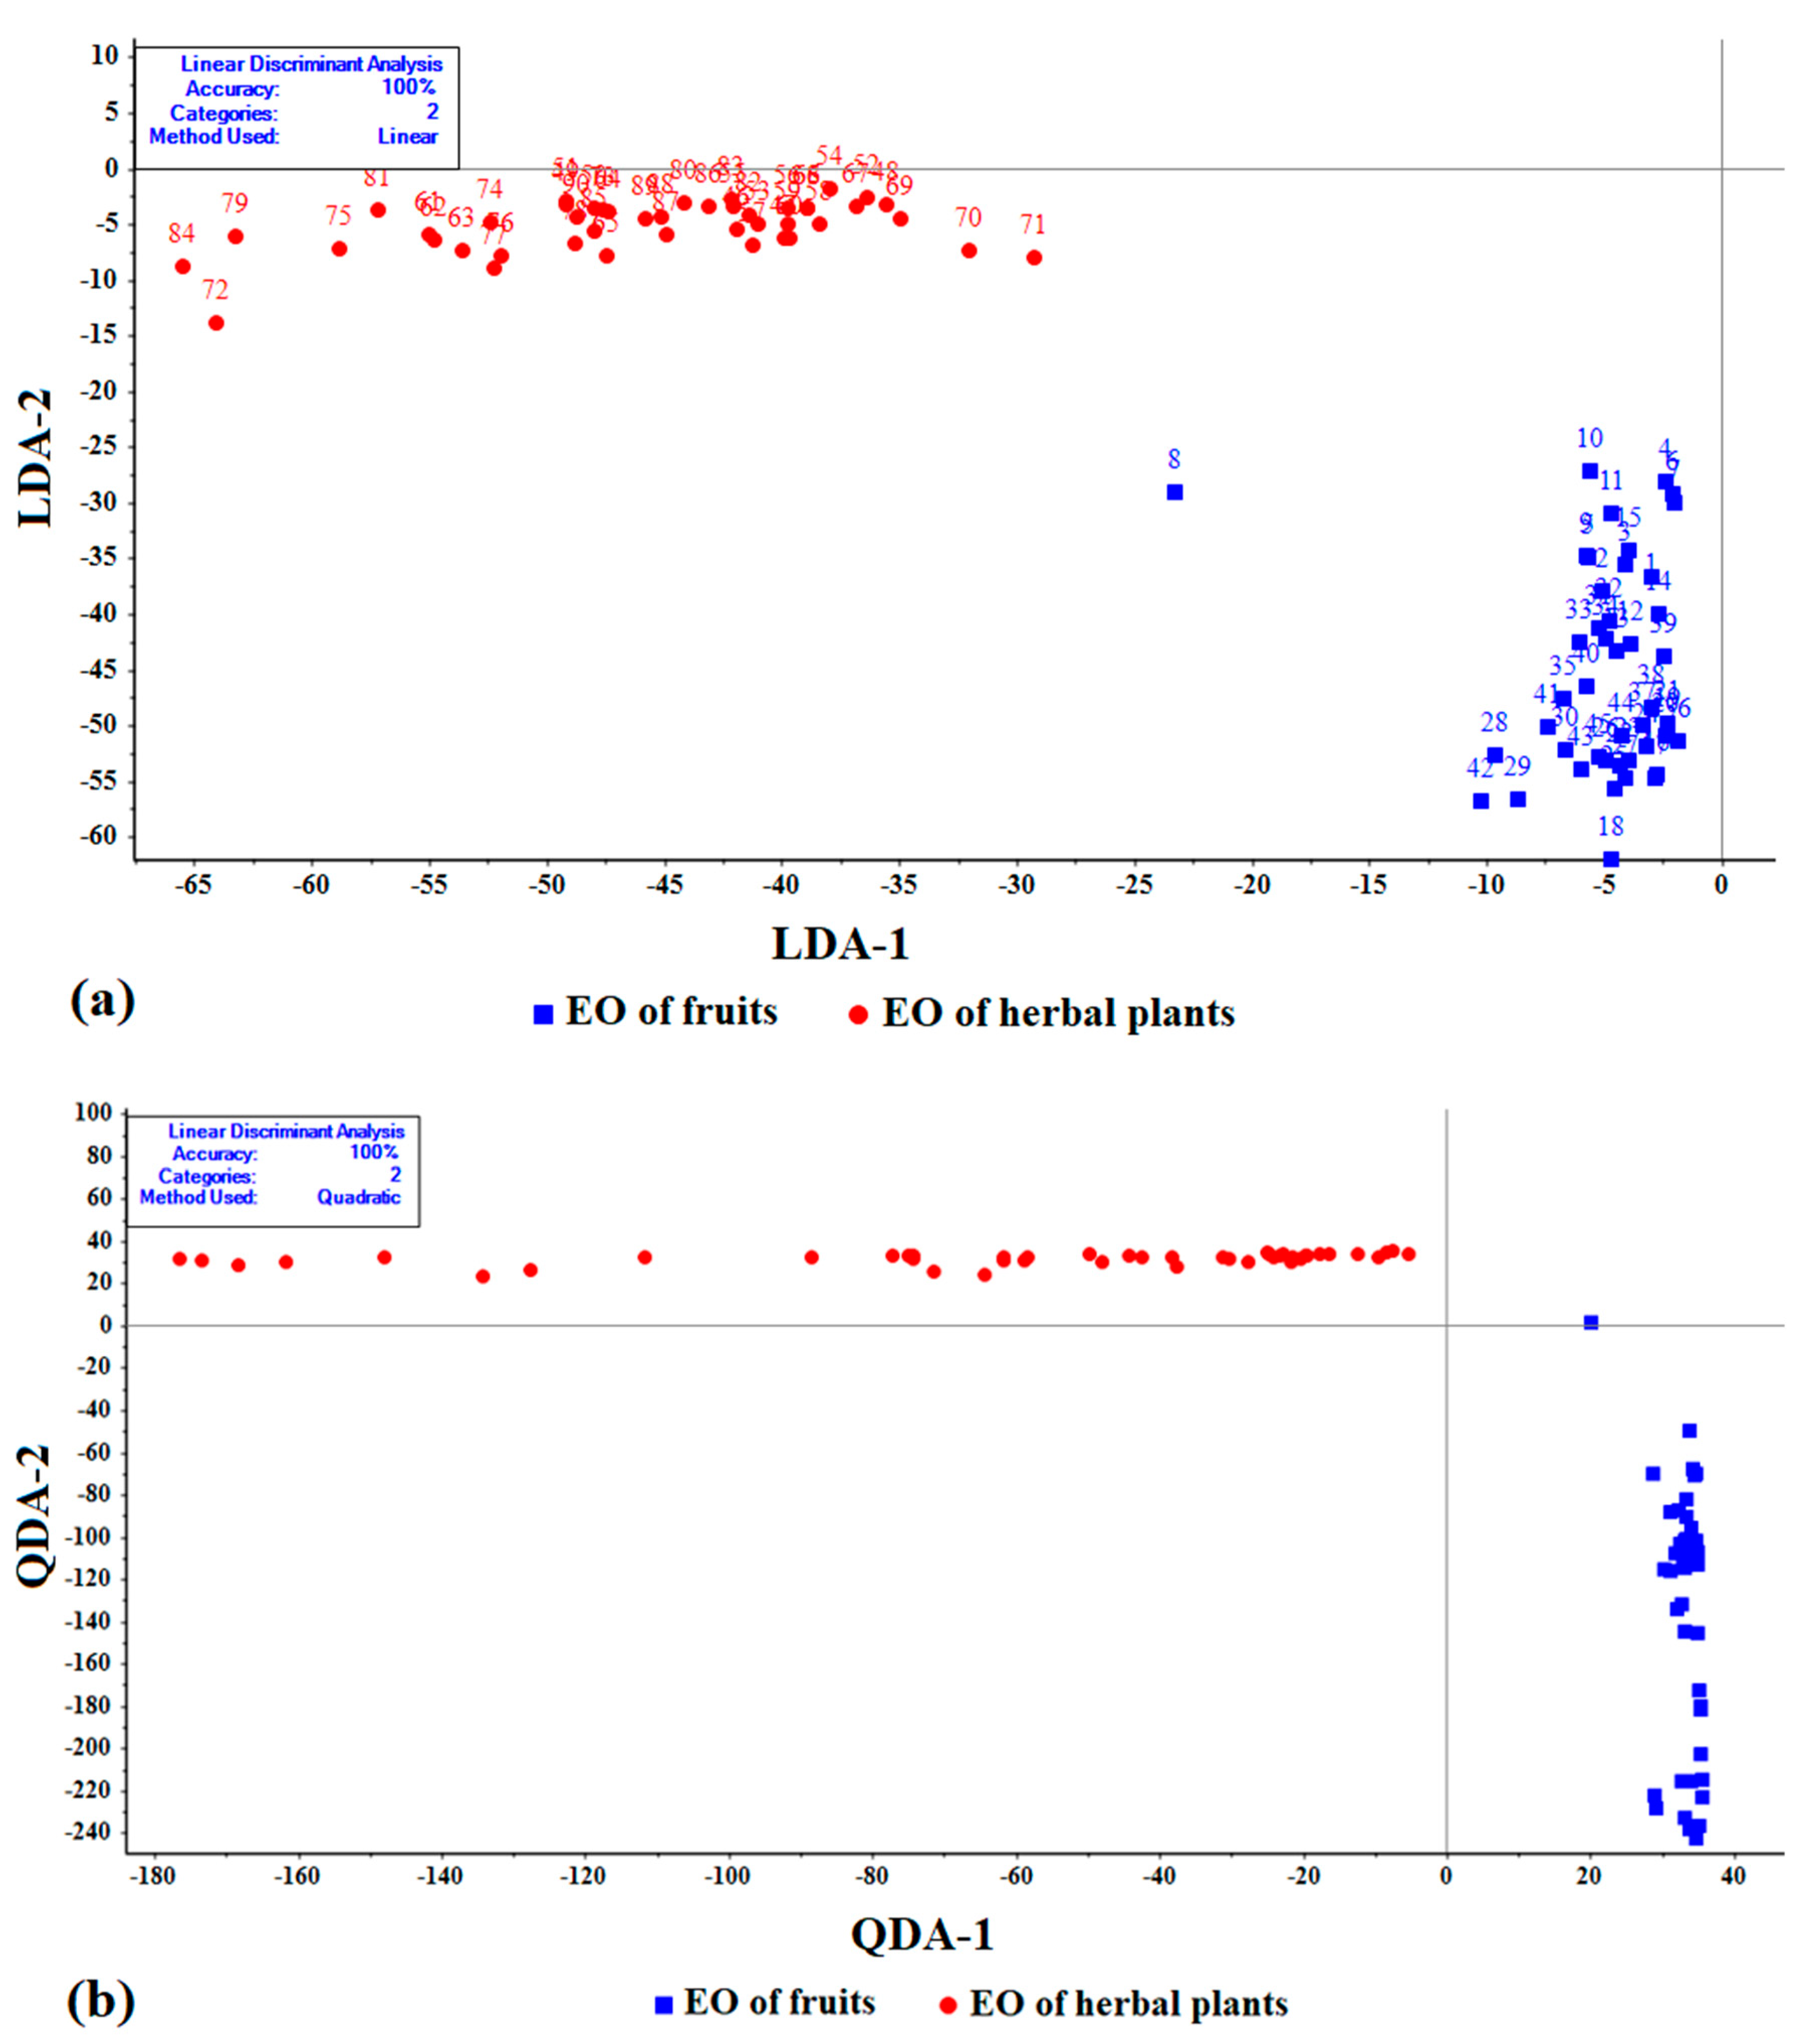
3.2. Linear Discriminate Analyses

The response of the sensors also was considered as the input of the LDA method. This method is one of the most widely used methods in aroma classifications and a probabilistic parametric classification method that maximizes inter-class variance and minimizes intra-class variance by transferring data from a space with higher dimension to that with lower dimension. The number of input features of the LDA and QDA models has a significant effect on its performance. Consequently, two different analyses had to be performed. The first analysis was as classification into 2 groups, meaning that the fruit EOs were distinguished from EOs of medicinal plants, and the second analysis was classification into 6 groups, i.e., all essential oils were classified separately. The detection power of LDA and QDA models for classification in two groups was 100% (Figure 5). The essential oil (EO) of fruits, located near the vertical axis and the EO of herbal plants, clustered near horizontal axis, are completely separated from each other. The apparent large separation between the two types of essential oils, indicated by wide spatial separation between data clusters, provides evidence of significant differences in both VOC emissions and types of VOCs, with MAU-9 electronic nose output data correctly revealing these differences when analyzed by 2-dimensional LDA analyses.
The confusion (perturbation) matrix was used to obtain statistical-model prediction accuracy. The perturbation matrix is a diagram for comparing predicted labels with identified labels. The rows of the perturbation matrix correspond to the real class and the columns correspond to the predicted class. Diagonal and non-diagonal cells correspond to correctly and incorrectly classified observations, respectively. The resulting confusion matrix also confirms the discrimination accuracy without any erroneous classification between the learning data sets and the randomly selected experimental data sets. Table 2 presents the confusion matrix obtained from the two groups of edible essential oils. In this table, the number and percentage of correct classification, indicated inside the diagonal cells, is represented by the observed data set. For example, in the first cell corresponding to the fruit essential oil, in accordance with 50% of all 90 observed datasets, the classification was performed correctly. Since there were no cases of incorrect classification, the correct classification accuracy using both LDA and QDA methods was 100%.
According to Equations (2)–(6), the performance parameters of LDA and QDA methods for classifying essential oil of herbs and fruits are summarized in Table A1, Appendix A. The perturbation matrix is used to calculate the performance parameters of the detection models. According to the results of Table A1, the accuracy of data classification using LDA and QDA methods was 100%.
It is important that in addition to classification, based on the type of essential oil (2 groups), each individual essential oil is identified and classified. Similarly, for classification in the six essential-oil groups, all statistically evaluated essential oils were classified separately, and in this method, the detection power of LDA and QDA models was 98.89 and 100%, respectively (Figure 6). According to Figure 5, all essential oils were correctly identified using the QDA method.
The confusion matrix and performance parameters of LDA and QDA methods for classifying all essential oils are presented in Table 3 and Table 4. According to the results of Table 4, the accuracy of data classification using LDA methods was 98% and the accuracy of QDA method was 100%.

3.3. Kernal Analysis of Model Performance

The appropriate selection and kernel analysis of SVM is crucial to increase the efficiency of SVM in classifying edible essential oils. In this study, four common types of kernel including sigmoid, linear, radial basis function (RBF) and polynomial were used. The response of all sensors to the smell of essential oils was obtained by SVM analysis. The data intended for test learning were considered 70% and 30%, respectively. To analyze the data set, each learning set was repeated ten times and the average value was calculated. SVM results with a different kernel, using C-SVM and Nu-SVM features as input data for the classification of essential oils, are presented in Table 5. The results of SVM classification, based on all samples (3 essential oils of medicinal plants and 3 essential oils of fruits) for 6-group classification, are shown along with 2-group classification for comparisons. SVM model based on two-group classification, i.e. separation of essential oils of medicinal plants from essential oils of fruits, showed 100% classification accuracy in all models. Also, according to the 6-group classification based only on the type of essential oil in the C-SVM method, the Polynomial and RBF functions exhibited a high classification accuracy for learning and validation data, both at 98.9%. In the Nu-SVM method, Linear and RBF functions, the classification accuracy was 100% for learning data and 98.9% for validation data.

4. Discussion

Principal component analysis of MAU-9 e-nose results showed that the variance for all data had an accuracy of 98% which provided enough information to explain significant differences in e-nose aroma signatures of different essential oils. The accuracy of 2-group classification in both LDA and QDA methods was equal to 100% and in 6-group classification the accuracy of LDA and QDA was 98.9 and 100%, respectively. In the SVM model, based on two-group classification, the classification accuracy was 100% for all models. Also, based on 6-group classification in C-SVM method with polynomial and RBF functions, the highest classification accuracy for learning and validation data was 99.0% and in Nu-SVM method, Linear and RBF functions had the highest accuracy with 100% accuracy for learning data and 98.9% accuracy for validation data. Okur et al. [31] also reported 100% accuracy in identifying mint scents using the LDA method. Similar results have been reported by other researchers for edible oils [32], juices [33], apples [34], and tomato juice [35].
Baietto and Wilson [27] provided a thorough review of VOC emissions and e-nose evaluations of numerous fruit volatiles (including some components from essential oils), and these have been used as a basis for evaluating fruit quality characteristics and grading, such as during the time when fruits are placed in storage prior to sale in commercial markets. Many fruits in storage are susceptible to rot or decay due to various microbes that can degrade fruit quality while in storage. Purified and concentrated essential oils, derived from fruits and herbs, (like honey) are not subject to significant degradation by microorganisms due to high osmolarity, very low water content, and low susceptibility to microbial enzymatic digestion, particularly in the absence of other required nutrients and growth factors. Thus, concentrated essential oils rarely have problems associated with reduction of quality while in storage prior to commercial sale.
Electronic-nose devices have been used to determine the purity and quality characteristics of other natural products besides essential oils, such as honey indirectly derived from plants, and dairy products. Tohidi et al. [36] reported detection of raw milk, contaminated with detergent powder, using a low-cost e-nose system. They detected detergent-tainted milk with 92.4% and 90.9% accuracy using RBF kernel function for two methods of C-SVM and Nu-SVM. Huang et al. [37] assessed the application of an electronic nose using multivariate analysis to identify plant origin and determine the quality of honey. They concluded that the quality of honey can be predicted with high accuracy using the SVM method. In another study, Faal et al. [38] classified the physicochemical properties of honey with high accuracy. Comparable results have been reported in other studies [21,36,37,39].
Essential oils have been analyzed by various e-nose systems, containing different types of sensor arrays (sensor types), based on a diverse range of e-nose technologies and VOC-detection principles. Russo et al. [22] used an electronic nose, based on MOS sensors, to determine the quality and genuineness of bergamot essential oils (BEOs). They evaluated several BEOs extracted using different methods and from different plant cultivars. Their results showed that the electronic nose was effective in differentiation between different essential oils of bergamot. Graboski et al. [23] developed and evaluated the capabilities of a carbon nanocomposites (CNC) electronic nose to detect VOCs in clove essential oil (CEO), eugenol (EUG), and eugenyl acetate (EA). They showed this e-nose was efficient in the determination of CEO, EUG, and EA VOC levels, showing a distinction between the concentrations of each VOC evaluated and doing so at reduced costs and analysis time compared to GC-MS. In another study, electronic noses were used in combination with DFA statistical analysis to evaluate the relationship between sample volume and sensor intensity relative to pine essential oil composition [24]. These researchers reported that combining 11 specific e-nose sensors increased the correlation of determination (R2) from 0.674 to 0.915 and RMSE value from 14.65 to 6.80%, compared to single-regression prediction models. Wu et al. [25] studied the antioxidant active ingredients of spikenard essential oil by using an ultra-fast gas chromatography (UFGC)-type electronic nose and a radical-scavenging mechanism. They identified VOC chemical components in spikenard (Nardostachys chinensis) essential oil, detected by e-nose and verified by GC–MS with 94% accuracy. These examples provide strong evidence that a diversity of e-nose sensor arrays (using different VOC-detection principles) are capable of distinguishing between essential oils from different plant origins as well as providing qualitative data on essential oil purity and authenticity.
Rasekh and Karami [40] were able to detect fraud in pure and industrial fruit juices using an electronic nose. They showed that a MOS-based electronic nose with ANN could be an effective and highly efficient tool in the rapid and non-destructive classification of pure and industrial juices. Based on results obtained in this and previous studies, there is sufficient evidence to confirm that electronic-nose technologies are effective tools for the rapid detection, identification, and verification (authentication) of pure essential oils in commercial plant products.
Previous studies have demonstrated that e-nose sensor data are subjected to considerable influence from environmental factors such as humidity, temperature, and even interference of air pollutants [41]. All experiments in this study were performed under constant temperature and humidity conditions. Consequently, the effects of these ambient parameters on sensor array responses of the MAU-9 e-nose were negligible.

5. Conclusions

The spatial separation of data clusters, derived from herbal and fruit e-nose PCA plots of e-nose sensor-array outputs, provided good evidence to indicate that the MAU-9 e-nose was capable of differentiating (discriminating) between sample types among the two groups of essential oil VOC emissions analyzed, those extracted from herbal leaves and fruits, due to significant differences in their volatile (VOC) content and chemical composition. Furthermore, the high precision of instrument performance, indicated by tight data clusters in PCA plots, suggested that the selected sensors in the sensor array were effective in detecting differences in VOC emissions from essential oils. Two MOS sensors, TGS813 and MQ135, had the highest loading coefficients, and accordingly contributed most to sample discriminations, providing the most important role in the classification of essential oils from the six plants species studied. Understanding the importance of each sensor in the classification of essential oils can help determine which sensors may be removed from the sensor array due to low contribution in sample discriminations. Consequently, e-nose instrument performance can be improved by replacing sensors having the lowest loading coefficients with sensors having higher loading coefficients.
The results from this study indicate that the MAU-9 electronic nose is a relatively simple, user-friendly tool and a reliable alternative to GC-MS for detecting and identifying aroma scent VOC emissions released from different types of essential oils derived from edible plants. The identification of specific sensors in the sensor array that yields the largest capabilities for discriminating specific types of essential oil volatiles, provides a means for designing a more efficient e-nose system with fewer select sensors that are VOC target-specific and thus most sensitive to specific categories of plant-derived essential oil volatiles in order to achieve more accurate and effective e-nose discriminations.

Author Contributions

The contributions of individual authors to this study and manuscript are as follows. The individual contributions include conceptualization methodology (H.K.; M.R.), software, statistical analysis and data validation (H.K.); formal analysis, (H.K.); investigation, (H.K.); resources, (H.K.; M.R.); data curation (M.R.); writing—original draft preparation, (H.K.); writing—review and editing, (A.D.W.; M.G.), funding acquisition, (M.R.). All authors have read and agreed to the published version of the manuscript.

Funding

This research received no external funding. All research funding was provided by the University of Mohaghegh Ardabili, Department of Biosystems Engineering.

Acknowledgments

The authors wish to thank Guest Editor, Simonetta Capone, Institute for Microelectronics and Microsystems, National Research Council (CNR-IMM), Lecce, Italy, for the invitation to submit this article to the Chemosensors journal Special Issue, entitled “Recent Advances in Multifunctional Sensing Technology for Gas Analysis”. This has provided an opportunity to report on the capabilities of the MAU-9 experimental electronic-nose system to detect differences in e-nose smell-print signatures of pure essential oils (derived from herbs and fruits) with potential applications for detecting counterfeit and adulterated products in commercial markets to prevent the illegal sale of these products at prices greater than their commercial value.

Conflicts of Interest

The authors declare no conflict of interest.

Appendix A

The performance parameters obtained from LDA and QDA statistical models used for two-group classifications of VOCs emissions, derived from herbal and fruit essential oils (EO) based on MAU-9 e-nose analyses, are provided in Table A1. All of the statistical values obtained from determinations of accuracy, precision, sensitivity, specificity, and the area under a curve (AUC), i.e., ROC curve, for both LDA and QDA statistical analyses provided identical results in all cases, confirming model effectiveness in each case. Receiver operating characteristic (ROC) curves are effective ways to visualize the tradeoffs between sensitivity and specificity in a binary classifier.
Table A1. Performance parameters of LDA and QDA statistical models for two-group classification of herbal and fruit essential oils.
ModelType of Fruit JuiceAccuracyPrecisionSensitivitySpecificityAUC
LDAEO of fruits1.0001.0001.0001.0001.000
EO of herbal plants1.0001.0001.0001.0001.000
Average per class1.0001.0001.0001.0001.000
QDAEO of fruits1.0001.0001.0001.0001.000
EO of herbal plants1.0001.0001.0001.0001.000
Average per class1.0001.0001.0001.0001.000

References

  1. Baby, R.; Cabezas, M.; Castro, E.; Filip, R.; Walsöe de Reca, N.E. Quality control of medicinal plants with an electronic nose. Sens. Actuators B Chem. 2005, 106, 24–28. [Google Scholar] [CrossRef]
  2. Gorji-Chakespari, A.; Nikbakht, A.M.; Sefidkon, F.; Ghasemi-Varnamkhasti, M.; Valero, E.L. Classification of essential oil composition in Rosa damascena Mill. genotypes using an electronic nose. JARMAP 2017, 4, 27–34. [Google Scholar] [CrossRef]
  3. Sharmeen, J.B.; Mahomoodally, F.M.; Zengin, G.; Maggi, F. Essential oils as natural sources of fragrance compounds for cosmetics and cosmeceuticals. Molecules 2021, 26, 666. [Google Scholar] [CrossRef] [PubMed]
  4. Tigrine-Kordjani, N.; Meklati, B.Y.; Chemat, F. Microwave ‘dry’ distillation as a useful tool for extraction of edible essential oils. Int. J. Aromath. 2006, 16, 141–147. [Google Scholar] [CrossRef]
  5. Valenti, M. Strawberry Essential Oil, and Its Shocking Greenwashing Truth. Valenti Organics. Available online: https://www.byvalenti.com/blog/journal/beauty/strawberry-essential-oil-and-its-shocking-greenwashing-truth/ (accessed on 29 April 2021).
  6. Karami, H.; Rasekh, M.; Mirzaee-Ghaleh, E. Qualitative analysis of edible oil oxidation using an olfactory machine. J. Food Meas. Charact. 2020, 14, 2600–2610. [Google Scholar] [CrossRef]
  7. Karami, H.; Rasekh, M.; Mirzaee-Ghaleh, E. Application of the E-nose machine system to detect adulterations in mixed edible oils using chemometrics methods. J. Food Process. Preserv. 2020, 44, e14696. [Google Scholar] [CrossRef]
  8. Gancarz, M.; Malaga-Toboła, U.; Oniszczuk, A.; Tabor, S.; Oniszczuk, T.; Gawrysiak-Witulska, M.; Rusinek, R. Detection and measurement of aroma compounds with the electronic nose and a novel method for MOS sensor signal analysis during the wheat bread making process. Food Bioprod. Process. 2021. [Google Scholar] [CrossRef]
  9. Rusinek, R.; Gawrysiak-Witulska, M.; Siger, A.; Oniszczuk, A.; Ptaszyńska, A.A.; Knaga, J.; Malaga-Toboła, U.; Gancarz, M. Effect of supplementation of flour with fruit fiber on the volatile compound profile in bread. Sensors 2021, 21, 2812. [Google Scholar] [CrossRef]
  10. Karami, H.; Rasekh, M.; Mirzaee-Ghaleh, E. Comparison of chemometrics and AOCS official methods for predicting the shelf life of edible oil. Chemometr. Intell. Lab. Syst. 2020, 206, 104165. [Google Scholar] [CrossRef]
  11. Wilson, A.D.; Baietto, M. Applications and advances in electronic nose technologies. Sensors 2009, 9, 5099–5148. [Google Scholar] [CrossRef]
  12. Hernández-Mesa, M.; Escourrou, A.; Monteau, F.; Le Bizec, B.; Dervilly-Pinel, G. Current applications and perspectives of ion mobility spectrometry to answer chemical food safety issues. TrAC 2017, 94, 39–53. [Google Scholar] [CrossRef]
  13. Müller, P.; Salminen, K.; Nieminen, V.; Kontunen, A.; Karjalainen, M.; Isokoski, P.; Rantala, J.; Savia, M.; Väliaho, J.; Kallio, P.; et al. Scent classification by K nearest neighbors using ion-mobility spectrometry measurements. Expert Syst. Appl. 2019, 115, 593–606. [Google Scholar] [CrossRef]
  14. Kafle, G.K.; Khot, L.R.; Sankaran, S.; Bahlol, H.Y.; Tufariello, J.A.; Hill, H.H. State of ion mobility spectrometry and applications in agriculture: A review. Eng. Agric. Environ. Food 2016, 9, 346–357. [Google Scholar] [CrossRef]
  15. Wilson, A.D. Diverse applications of electronic nose technologies in agriculture and forestry. Sensors 2013, 13, 2295–2348. [Google Scholar] [CrossRef] [Green Version]
  16. Dai, C.; Huang, X.; Lv, R.; Zhang, Z.; Sun, J.; Aheto, J.H. Analysis of volatile compounds of Tremella aurantialba fermentation via electronic nose and HS-SPME-GC-MS. J. Food Saf. 2018, 38, 1–8. [Google Scholar] [CrossRef]
  17. Delgado-Rodríguez, M.; Ruiz-Montoya, M.; Giraldez, I.; López, R.; Madejón, E.; Díaz, M.J. Use of electronic nose and GC-MS in detection and monitoring some VOC. Atmos. Environ. 2012, 51, 278–285. [Google Scholar] [CrossRef]
  18. Marek, G.; Dobrzański, B.; Oniszczuk, T.; Combrzyński, M.; Ćwikła, D.; Rusinek, R. Detection and differentiation of volatile compound profiles in roasted coffee arabica beans from different countries using an electronic nose and GC-MS. Sensors 2020, 20, 2124. [Google Scholar] [CrossRef]
  19. Camardo Leggieri, M.; Mazzoni, M.; Fodil, S.; Moschini, M.; Bertuzzi, T.; Prandini, A.; Battilani, P. An electronic nose supported by an artificial neural network for the rapid detection of aflatoxin B1 and fumonisins in maize. Food Control 2021, 123, 107722. [Google Scholar] [CrossRef]
  20. Ottoboni, M.; Pinotti, L.; Tretola, M.; Giromini, C.; Fusi, E.; Rebucci, R.; Grillo, M.; Tassoni, L.; Foresta, S.; Gastaldello, S.; et al. Combining e-nose and lateral flow immunoassays (LFIAs) for rapid occurrence/co-occurrence aflatoxin and fumonisin detection in maize. Toxins 2018, 10, 416. [Google Scholar] [CrossRef] [PubMed] [Green Version]
  21. Timsorn, K.; Lorjaroenphon, Y.; Wongchoosuk, C. Identification of adulteration in uncooked jasmine rice by a portable low-cost artificial olfactory system. Measurement 2017, 108, 67–76. [Google Scholar] [CrossRef]
  22. Russo, M.; Serra, D.; Suraci, F.; Postorino, S. Effectiveness of electronic nose systems to detect bergamot (Citrus bergamia Risso et Poiteau) essential oil quality and genuineness. J. Essent. Oil Res. 2012, 24, 137–151. [Google Scholar] [CrossRef]
  23. Graboski, A.M.; Zakrzevski, C.A.; Shimizu, F.M.; Paschoalin, R.T.; Soares, A.C.; Steffens, J.; Paroul, N.; Steffens, C. Electronic nose based on carbon nanocomposite sensors for clove essential oil detection. ACS Sens. 2020, 5, 1814–1821. [Google Scholar] [CrossRef]
  24. Lias, S.; Mohamad Ali, N.A.; Jamil, M.; Tolmanan, M.S.Y.; Misman, M.A. A study on the application of electronic nose coupled with DFA and statistical analysis for evaluating the relationship between sample volumes versus sensor intensity of agarwood essential oils blending ratio. MATEC Web Conf. 2018, 201, 02008. [Google Scholar] [CrossRef]
  25. Wu, S.-Q.; Li, R.; Jiang, Z.-T.; Wang, Y.; Tan, J.; Tang, S.-H. Evaluation of antioxidant active ingredients of spikenard essential oil by ultra-fast gas chromatography electronic nose and radical scavenging mechanism. Ind. Crops Prod. 2020, 151, 112489. [Google Scholar] [CrossRef]
  26. Wilson, A.D.; Lester, D.G.; Oberle, C.S. Application of conductive polymer analysis for wood and woody plant identifications. For. Ecol. Managem. 2005, 209, 207–224. [Google Scholar] [CrossRef]
  27. Baietto, M.; Wilson, A.D. Electronic-nose applications for fruit identification, ripeness, and quality grading. Sensors 2015, 15, 899–931. [Google Scholar] [CrossRef]
  28. Wilson, A.D. Application of a conductive polymer electronic-nose device to identify aged woody samples. In Proceedings of the Third International IARIA Conference on Sensor Device Technologies and Applications, Rome, Italy, 19–24 August 2012; Yurish, S., Chilibon, I., Carvalho, V., Gervais-Ducouret, S., Eds.; Xpert Publishing Services: Wilmington, DE, USA, 2012; pp. 77–82. [Google Scholar]
  29. Siqueira, L.F.S.; Araújo Júnior, R.F.; de Araújo, A.A.; Morais, C.L.M.; Lima, K.M.G. LDA vs. QDA for FT-MIR prostate cancer tissue classification. Chemom. Intell. Lab. Syst. 2017, 162, 123–129. [Google Scholar] [CrossRef]
  30. Basri, K.N.; Hussain, M.N.; Bakar, J.; Sharif, Z.; Khir, M.F.A.; Zoolfakar, A.S. Classification and quantification of palm oil adulteration via portable NIR spectroscopy. Spectrochim. Acta A 2017, 173, 335–342. [Google Scholar] [CrossRef] [PubMed]
  31. Okur, S.; Sarheed, M.; Huber, R.; Zhang, Z.; Heinke, L.; Kanbar, A.; Wöll, C.; Nick, P.; Lemmer, U. Identification of mint scents using a QCM based e-nose. Chemosensors 2021, 9, 31. [Google Scholar] [CrossRef]
  32. Gómez, A.H.; Wang, J.; Hu, G.; Pereira, A.G. Electronic nose technique potential monitoring mandarin maturity. Sens. Actuators B Chem. 2006, 113, 347–353. [Google Scholar] [CrossRef]
  33. Rasekh, M.; Karami, H. Application of electronic nose with chemometrics methods to the detection of juices fraud. J. Food Process. Preserv. 2021, 45, e15432. [Google Scholar] [CrossRef]
  34. Lashgari, M.; MohammadiGol, R. Discrimination of Golab apple storage time using acoustic impulse response and LDA and QDA discriminant analysis techniques. Iran Agr. Res. 2016, 35, 65–70. [Google Scholar]
  35. Hong, X.; Wang, J.; Qi, G. E-nose combined with chemometrics to trace tomato-juice quality. J. Food Eng. 2015, 149, 38–43. [Google Scholar] [CrossRef]
  36. Tohidi, M.; Ghasemi-Varnamkhasti, M.; Ghafarinia, V.; Saeid Mohtasebi, S.; Bonyadian, M. Identification of trace amounts of detergent powder in raw milk using a customized low-cost artificial olfactory system: A novel method. Measurement 2018, 124, 120–129. [Google Scholar] [CrossRef]
  37. Huang, L.; Liu, H.; Zhang, B.; Wu, D. Application of electronic nose with multivariate analysis and sensor selection for botanical origin identification and quality determination of honey. Food Bioproc. Tech. 2015, 8, 359–370. [Google Scholar] [CrossRef]
  38. Faal, S.; Loghavi, M.; Kamgar, S. Physicochemical properties of Iranian ziziphus honey and emerging approach for predicting them using electronic nose. Measurement 2019, 148, 106936. [Google Scholar] [CrossRef]
  39. Ghasemi-Varnamkhasti, M.; Mohammad-Razdari, A.; Yoosefian, S.H.; Izadi, Z.; Rabiei, G. Selection of an optimized metal oxide semiconductor sensor (MOS) array for freshness characterization of strawberry in polymer packages using response surface method (RSM). Postharvest Biol. Technol. 2019, 151, 53–60. [Google Scholar] [CrossRef]
  40. Rasekh, M.; Karami, H. E-nose coupled with an artificial neural network to detection of fraud in pure and industrial fruit juices. Int. J. Food Prop. 2021, 24, 592–602. [Google Scholar] [CrossRef]
  41. Wei, P.; Ning, Z.; Ye, S.; Sun, L.; Yang, F.; Wong, K.C.; Westerdahl, D.; Louie, P.K.K. Impact analysis of temperature and humidity conditions on electrochemical sensor response in ambient air quality monitoring. Sensors 2018, 18, 59. [Google Scholar] [CrossRef] [Green Version]
Figure 1. Schematic of an artificial olfactory (e-nose) system, arranged in tandem, for introduction of essential oil VOCs, used for gas-sample analysis. The components of this system consist of the following parts (listed in order and direction of air flow as follows). Ambient air first enters (a) Air filter (activated charcoal to remove ambient-air VOC hydrocarbons), then yellow line to (b) Sample headspace chamber, and (c) Solenoid air valves, then (d) Diaphragm pump, (green line) to (e) E-nose sensor array chamber, (f) Data acquisition recorder and wireless transmission card, (g) Personal computer (PC) and (h), Air outlet (red line) from sensor array chamber (for exhaust gases). Filtered air from Air filter (blue line) alternatively passes to the E-nose sensor array chamber (via Solenoid air valve) during air-cleanse purges between samples.
Chemosensors 09 00142 g001
Figure 2. Sensor TGS-813 response to sample VOCs during the e-nose run cycle.
Chemosensors 09 00142 g002
Figure 3. Two-dimensional PCA plot performed on six purified essential oils based on data collected using the MAU-9 electronic nose.
Chemosensors 09 00142 g003
Figure 4. Loading plot for 2-dimensional PCA analysis showing essential oils e-nose data-clustering distribution with associated principal components.
Chemosensors 09 00142 g004
Figure 5. Classification of essential oils from edible plants. Comparison of methods: (a) LDA and (b) QDA methods.
Chemosensors 09 00142 g005
Figure 6. Classification of edible essential oils using two statistical methods: (a) LDA and (b) QDA methods.
Chemosensors 09 00142 g006
Table 1. The sensor types, gas detection ranges, and known chemical sensitivity of tin oxide MOS sensors within the MAU-9 electronic nose sensor array.
SensorSensor NameDetection Ranges (ppm)Main Applications (Gases Detected)
1MQ910–10,000CO, combustible gases
2MQ4300–100Urban gases, methane (CH4)
3MQ13510–10,000Ammonia, benzene, sulfides
4MQ8100–1000Hydrogen (H2)
5TGS262050–5000Alcohols, organic solvents
6MQ1361–200Sulfur dioxide (SO2)
7TGS813500–10,000CH4, C3H8, C4H10 (hydrocarbons)
8TGS82250–5000Organic solvents
9MQ310–300Alcohols
Table 2. Confusion matrix for two-group classification of herbal plant and fruit essential oil (EO) using LDA and QDA statistical methods.
Model 1Type of Fruit Juice 2EO of Herbal PlantsEO of FruitsAccuracy
LDAEO of fruits45
50.0%
0
0.0%
100%
0.0%
EO of herbal plants0
0.0%
45
50.0%
100%
0.0%
100%
0.0%
100%
0.0%
100%
0.0%
QDAEO of fruits45
50.0%
0
0.0%
100%
0.0%
EO of herbal plants0
0.0%
45
50.0%
100%
0.0%
100%
0.0%
100%
0.0%
100%
0.0%
1 Statistical model abbreviations: LDA = linear discriminate analysis; QDA = quadratic discriminate analysis. 2 EO = essential oils (VOCs derived from herbal plants and fruits).
Table 3. Confusion matrix for six group classification using LDA and QDA methods.
ModelType of EO.MangoLemonOrangeMintTarragonThymeAccuracy
LDAMango15
16.7%
0
0.0%
0
0.0%
0
0.0%
0
0.0%
0
0.0%
100%
0.0%
Lemon0
0.0%
15
16.7%
0
0.0%
0
0.0%
0
0.0%
0
0.0%
100%
0.0%
Orange0
0.0%
0
0.0%
15
16.7%
0
0.0%
0
0.0%
0
0.0%
100%
0.0%
Mint0
0.0%
0
0.0%
0
0.0%
13
14.4%
0
0.0%
0
0.0%
100%
0.0%
Tarragon0
0.0%
0
0.0%
0
0.0%
0
0.0%
15
16.7%
0
0.0%
100%
0.0%
Thyme0
0.0%
0
0.0%
0
0.0%
2
2.2%
0
0.0%
15
16.7%
86.7%
13.3%
100%
0.0%
100%
0.0%
100%
0.0%
86.7%
13.3%
100%
0.0%
100%
0.0%
97.8%
2.2%
QDAMango15
16.66%
0
0.0%
0
0.0%
0
0.0%
0
0.0%
0
0.0%
100%
0.0%
Lemon0
0.0%
15
16.66%
0
0.0%
0
0.0%
0
0.0%
0
0.0%
100%
0.0%
Orange0
0.0%
0
0.0%
15
16.66%
0
0.0%
0
0.0%
0
0.0%
100%
0.0%
Mint0
0.0%
0
0.0%
0
0.0%
15
16.66%
0
0.0%
0
0.0%
100%
0.0%
Tarragon0
0.0%
0
0.0%
0
0.0%
0
0.0%
15
16.66%
0
0.0%
100%
0.0%
Thyme0
0.0%
0
0.0%
0
0.0%
0
0.0%
0
0.0%
15
16.66%
100%
0.0%
100%
0.0%
100%
0.0%
100%
0.0%
100%
0.0%
100%
0.0%
100%
0.0%
100%
0.0%
Table 4. Performance parameters of LDA and QDA models for six-group classification.
ModelType of EO.AccuracyPrecisionSensitivitySpecificityAUC
LDAMango1.0001.0001.0001.0001.000
Lemon1.0001.0001.0001.0001.000
Orange1.0001.0001.0001.0001.000
Mint1.0001.0001.0001.0001.000
Tarragon1.0001.0001.0001.0001.000
Thyme0.9900.8821.0000.9900.995
Average per class0.9980.9801.0000.9980.999
QDAMango1.0001.0001.0001.0001.000
Lemon1.0001.0001.0001.0001.000
Orange1.0001.0001.0000.9950.997
Mint1.0001.0001.0001.0001.000
Tarragon1.0001.0001.0001.0001.000
Thyme1.0001.0001.0001.0001.000
Average per class1.0001.0001.0001.0001.000
Table 5. Results and comparison of Nu-SVM and C-SVM models subjected to the kernel functions.
Kernel FunctionC-SVM *Nu-SVM *
cγTrainValidationNuγTrainValidation
Categories 6
linear0.01196.796.70.01110098.9
Polynomial10198.998.90.50196.798.9
Radial basis function100198.998.90.260.110098.9
sigmoid0.010.0196.796.70.260.198.998.9
Categories 2
linear111001000.011100100
Polynomial111001000.010.01100100
Radial basis function111001000.010.01100100
sigmoid100.11001000.010.26100100
* The selection of these Nu, C and γ parameter values were used to minimize the error function.
Publisher’s Note: MDPI stays neutral with regard to jurisdictional claims in published maps and institutional affiliations.

