Article

Leftover Kiwi Fruit Peel-Derived Carbon Dots as a Highly Selective Fluorescent Sensor for Detection of Ferric Ion †

by
Raji Atchudan
1,*,
Thomas Nesakumar Jebakumar Immanuel Edison
1,
Suguna Perumal
1,
Rajangam Vinodh
2,
Ashok K. Sundramoorthy
3,
Rajendran Suresh Babu
4 and
Yong Rok Lee
1,*
1
School of Chemical Engineering, Yeungnam University, Gyeongsan 38541, Korea
2
School of Electrical and Computer Engineering, Pusan National University, Busan 46241, Korea
3
Department of Chemistry, SRM Institute of Science and Technology, Kattankulathur 603203, Tamil Nadu, India
4
Laboratory of Experimental and Applied Physics, Centro Federal de Educação Tecnológica, Celso Suckow da Fonseca (CEFET/RJ), Av. Maracanã 229, Rio de Janeiro 20271-110, Brazil
*
Authors to whom correspondence should be addressed.
Electronic Supplementary Information (ESI): Materials, Instrumentation methods, quantum yield measurement, FTIR spectroscopy study, FESEM images with EDX spectra, metal ions sensing, photostability, and prolonging stability measurements of the synthesized KN-CDs.
Submission received: 8 June 2021 / Revised: 28 June 2021 / Accepted: 1 July 2021 / Published: 2 July 2021

Abstract

:
Recently, the use of natural products for the synthesis of carbon dots (CDs) has received much attention. Herein, leftover kiwi (Actinidia Deliciosa) fruit peels were successfully turned into beneficial fluorescent carbon dots (KN-CDs) via the hydrothermal-carbonization route. KN-CDs 1 and KN-CDs 2 were prepared without and with ammonium hydroxide, respectively. KN-CDs 1 and KN-CDs 2 were systematically characterized by various analytical techniques. Synthesized KN-CDs showed spherical-shaped morphology with narrow size distribution and excellent optical properties with excitation-independent behaviors. The quantum yields of KN-CDs 1 and KN-CDs 2 were calculated as 14 and 19%, respectively. Additionally, the KN-CDs possess excellent prolonging and photostability. Because of the excellent optical properties of KN-CDs, they were utilized as fluorescent sensors. The strong fluorescence of the KN-CDs was selectively quenched by Fe3+ ion, and quenching behavior showed a linear correlation with the concentrations of Fe3+ ion. KN-CDs 1 and KN-CDs 2 showed the detection of Fe3+ ions within the concentration range of 5–25 µM with the detection limit of 0.95 and 0.85 µM, respectively. Based on the turn-off sensing by the detection of Fe3+ ions, KN-CDs would be a promising candidate as a selective and sensitive fluorescent sensor.

1. Introduction

Carbon dots (CDs), defined as carbon-based nanomaterials with a size of <10 nm, have attracted great attention since their first discovery in 2004. CDs are reported as a potential candidate in sensors [1], fluorescent inks [2], catalysts [3], drug carriers [4], and light-emitting diodes [5]. CDs are widely used because of their astonishing structural and optical properties. Compared to conventional semiconductor quantum dots [6], CD properties have advantages such as a tunable wavelength [7], small size, eco-friendly applications, high biocompatibility [8], high solubility [9], photostability [10], and good selectivity and sensitivity [11,12]. Many methods exist to prepare CDs such as the bottom-up method, which includes microwave [13], thermal decomposition [14], hydrothermal treatment [12,15], template route [16], and plasma treatment [17]. The top-down method includes arc-discharge [18,19], laser ablation [20], electrochemical oxidation [21], chemical oxidation [22], and ultrasonic treatment [23]. Among these methods, hydrothermal treatment has been widely used to prepare CDs because of their simplicity of reaction, low consumption of energy, and eco-friendly applications [24,25].
The heteroatoms in CDs improve the optical properties; thus, the use of natural products is attractive in the synthesis of CDs by the hydrothermal method [26,27,28]. The properties of CDs mainly depend on their precursors. Naturally, plant sources are composed of many functional groups; thus, by the use of plant parts as a carbon source, it is expected that the prepared CDs will be enriched with heteroatoms. This is believed due to the excellent properties, and further surface passivation is not required [11,29,30]. In addition, by the use of plant parts, the usage of toxic or harsh chemicals can be eliminated. Many reports are available regarding the synthesis of CDs by hydrothermal treatment using plant parts such as flowers, leaves, roots, stems, and seeds [27,31,32]. Therefore, the natural carbon source is still explored for the synthesis of CDs, and CDs with appreciable properties are highly desirable.
Detection of ferric (Fe3+) ions is among the important issues because Fe3+ ions are essential for human health and the environment; however, excess or dearth of Fe3+ ions will create serious health and environmental problems [29,31]. Currently, there are various detection methods available for the detection of Fe3+ ions, such as electrochemistry protocols, as well as various spectrophotometric assays, including inductively coupled plasma atomic emission spectrometry and atomic absorption spectrophotometry. However, these detection methods require sophisticated instrumentation, complicated sample preparation, expensive reagents, and are time consuming. Hence, fluorescence-based sensing methods are preferable because they possess several advantages such as high signal output, easy monitoring, simplicity, rapid response, and cost-effectiveness [29,31]. Thus, developing a simple, reliable fluorescence sensor for the detection of Fe3+ ions is highly essential.
Here, leftover kiwi fruit peel was used to prepare KN-CDs by the hydrothermal-assisted carbonization route. To increase the nitrogen content in KN-CDs, ammonium hydroxide (NH4OH) was used. KN-CDs 1 and KN-CDs 2 were synthesized without and with NH4OH, respectively. The obtained KN-CDs were thoroughly characterized through various analytical techniques to know their surface morphologies, size, and optical properties. Further, KN-CDs were utilized as metal sensors. To sense the excess metal ions in the human body or to detect the heavy metal ions in the environment, CDs are used [33,34,35]. In general, excess or deficiency of metal ions in an aqueous medium has a potential impact on the environment and human health. Hence, a sensing metal ion in aqueous media is crucial and necessary. In this regard, the prepared KN-CDs were used as potential fluorescent probes for the detection of Fe3+ ions.

2. Experimental Section
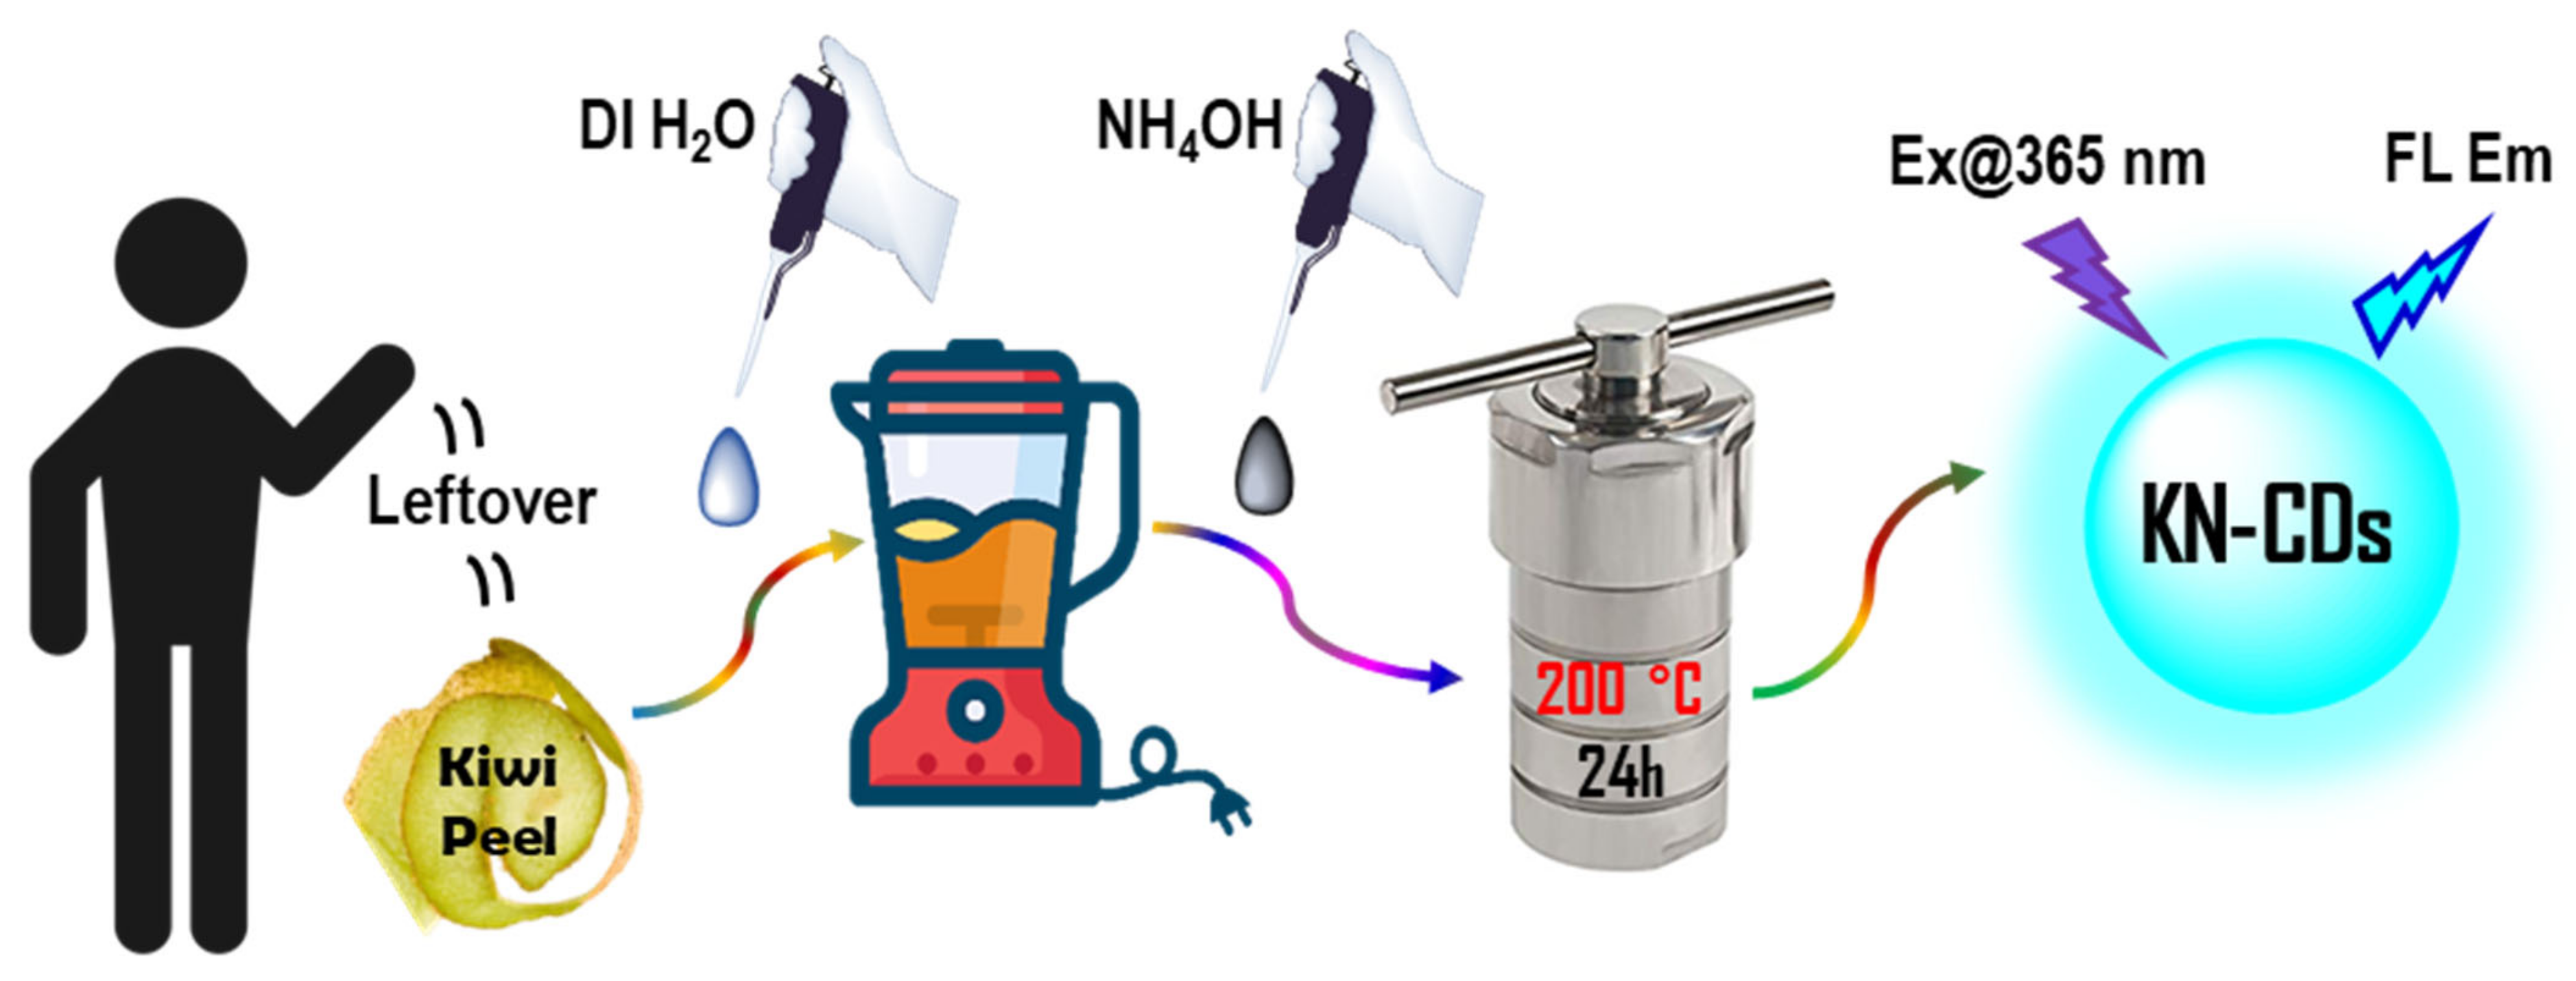
Synthesis of KN-CDs

The KN-CDs were synthesized using the hydrothermal-assisted carbonization route. In detail, leftover kiwi fruit peel was crushed well with deionized water using a commercial mixer grinder. The obtained mucilage (approximately 70 mL) was collected in a 100 mL capacity Teflon-lined stainless-steel autoclave and then heated for 24 h at 200 °C. Successively, the autoclave was cooled to room temperature. The hydrothermally carbonized suspension of kiwi fruit peel was filtered using a cellulose membrane with a pore size of 0.22 μm to remove the larger-sized carbon particles. The resultant brownish-yellow supernatant (KN-CDs 1) was transferred to a glass vial and stored in a refrigerator at 5 °C for further characterization. On the other hand, KN-CDs 2 was prepared by adopting the same procedure as that of KN-CDs 1 with the inclusion of NH4OH. Approximately 1.0 mL of NH4OH was added to the suspension, and the pH was adjusted to around 8. Scheme 1 shows an illustration of the procedure of KN-CDs synthesis from the leftover kiwi fruit peel.

3. Results and Discussion

The KN-CDs were prepared using kiwi peel by hydrothermal treatment at 200 °C for a period of 24 h. KN-CDs 1 and KN-CDs 2 were prepared by the absence and presence of NH4OH, respectively. The prepared KN-CDs 1 and KN-CDs 2 were characterized by various techniques, such as X-ray diffraction (XRD), Raman, X-ray photoelectron spectroscopy (XPS), field-emission scanning electron microscopy (FESEM), and high-resolution transmission electron microscopy (HRTEM). Figure 1a shows the XRD patterns of the KN-CDs (KN-CDs 1 and KN-CDs 2). The presence of amorphous carbon reflects from the broad peaks centered at ~2θ around 22.5 and 42.5°, which corresponds to (002) and (100) planes, respectively [36,37]. The interlayer spacing of the KN-CDs was calculated as 0.39 nm using the (002) plane. Additionally, the higher interlayer spacing of the KN-CDs (0.39) compared to that of bulk graphite (0.34 nm) is accredited to the presence of abundant functional groups at the edges of the KN-CDs [38]. Figure 1b depicts the Raman spectra of the KN-CDs with two distinct peaks at ~1375 and 1580 cm–1 as the D- and G-bands, respectively [39,40,41]. The G-band (sp2-carbon) concerns the graphitization of the KN-CDs and the D-band (sp3-carbon) the defects of the KN-CDs [42]. The intensity ratio of the D- and B-bands (ID/IG) was calculated as 0.62 and 0.67 for KN-CDs 1 and KN-CDs 2, respectively. These results of Raman studies suggest the moderate graphitization of the KN-CDs.
The functional groups of the KN-CDs were characterized by FTIR spectroscopy (Figure S1). The absorption bands around 3450–3200, 2930, and 2865 cm–1 correspond to the stretching frequency of O–H/N–H and asymmetric and symmetric C–H functional groups in the KN-CDs, respectively [43,44]. The absorption bands at 1770–1700, 1580, and 1400 cm–1 could be assigned to the stretching of C=O/N–H, C=C–C, and C–N/O–H(bending), respectively [45,46]. The absorption bands around 1275 and 1050 cm–1 suggest the presence of C–OH and C–O–C groups in the KN-CDs, respectively [46,47,48]. These FTIR results confirmed the presence of acid, hydroxyl, amino, and carbonyl moieties in the KN-CDs. Further, the functional groups and elemental compositions of the KN-CDs were examined by XPS techniques. Figure 2 displays the survey spectrum of the synthesized KN-CDs and its deconvoluted XPS spectra of C 1s, N 1s, and O 1s. Figure 2a reveals the presence of elements such as carbon, nitrogen, and oxygen with atomic percentages of 78/78, 2/4, and 20/18% in the KN-CDs 1/KN-CDs 2 at 284, 400, and 532 eV, respectively. Figure 2b,c displays the deconvolution spectrum of KN-CDs 1 and KN-CDs 2, respectively, at the C 1s level, which shows five peaks at 284.7, 285.5, 286.5, 287.6, and 289.0 eV ascribed to C–C/C=C, C–OH, C–N–C/C–O–C, C=O, and O=C–OH, respectively [49,50,51,52]. Figure 2d shows the high-resolution deconvolution spectrum of KN-CDs 1 at N 1s, revealing three peaks at 398.9, 400, and 401.9 eV, which correspond to the functional groups C–N–C, C–N–H, and (C)3–N, respectively. Figure 2e shows the deconvolution spectrum of KN-CDs 2 at the N 1s level, revealing three peaks at 398.8, 400, and 401.3 eV, which are attributed to the functional groups C–N–C, C–N–H, and (C)3–N, respectively [29,52,53]. In Figure 2f, the high-resolution spectrum at the O 1s level reveals four peaks ascribed to functional groups C=O, C–OH, C–O–C, and O=C–OH at 531.5, 532.7, 533.5, and 535.0 eV, respectively, for KN-CDs 1 and at 531.2, 532.4, 533.3, and 534.4 eV, respectively, for KN-CDs 2 (Figure 2g) [54,55,56]. A slight shift in peaks of KN-CDs 2 at the N 1s and O 1s levels (Figure 2e,g) might be due to the increase in nitrogen content. From the XPS studies, the presence of hydroxyl, amine, and carboxyl functional groups in the KN-CDs can be concluded, which supports the results of the FTIR analysis.
FESEM images (Figure S2a,b) of the KN-CDs 1 reveal a smooth surface, which might be due to the aggregation of the smallest particle with monodispersity. The chemical compositions present in the KN-CDs 1 of C, N, and O were revealed from the EDX spectrum (Figure S2c). The elemental mapping of KN-CDs 1 shown in Figure 3 reveals the even distribution of C, N, and O. Similar to KN-CDs 1, KN-CDs 2 (Figure 4) also reveals the smooth surface and even distribution of C, N, and O (Figure S3 and Figure 4). However, the N content in KN-CDs 2 is higher than in KN-CDs 1. This is because of the use of NH4OH during the synthesis of KN-CDs 2. Figure 5 shows the TEM images of the KN-CDs. The particles are in the range of 3.0–9.0 nm. The average diameters of KN-CDs 1 and KN-CDs 2 were calculated as 5.6 and 5.1 nm based on statistical analyses of 50 carbon dots using Gaussian fitting (Figure 5a,d), respectively. The images reveal the near-spherical shape and monodispersed particles of the KN-CDs. The HRTEM images visibly display the lattice fringes, which confirms the fair graphitic nature of the KN-CDs. The d-spacing values were calculated as 0.21 nm attributed to the C(100) plane of graphitic carbon [31,57]. This acceptable graphitic nature of CDs shows consistent results with HRTEM, XRD, and Raman studies.
Figure 6a and Figure 7a show the UV–vis spectra of KN-CDs 1 and KN-CDs 2, respectively. The KN-CDs exhibit two peaks at 275 and 327 nm indicating the π–π* transition of C=C and the n–π* transition of the C=O/C–N groups, respectively [58,59]. KN-CDs 2 shows a sharp peak of π–π* transition compared to KN-CDs 1. This sharp peak might be of higher nitrogen content in KN-CDs 2. The synthesized aqueous KN-CDs 1 and KN-CDs 2 solutions showed a transparent pale-yellow dispersion under daylight and emitted a cyan-blue fluorescence under 365 nm UV light, which is revealed from the photographic images in Figure 6a and Figure 7a. The fluorescence spectra of KN-CDs 1 and KN-CDs 2 are depicted in Figure 6b and Figure 7b, respectively. Both KN-CDs 1 and KN-CDs 2 display excitation and emission spectra with an optimum excitation wavelength around 360 nm and an emission wavelength around 432 nm with good quantum yields of 14 and 19%, respectively (calculated using Equation (S1)). The fluorescence spectra of KN-CDs 1 and KN-CDs 2 at various excitation wavelengths are depicted in Figure 6c and Figure 7c, respectively. As a result, the spectra clearly show the unique excitation-dependent emission spectra. The intensity of the emission spectra increased with the excitation wavelength from 300 nm to 360 nm. Then, the emission intensity decreased gradually with excitation wavelengths of 370 nm until 450 nm. The normalized excitation-dependent emission spectra of KN-CDs 1 and KN-CDs 2 are displayed in Figure 6d and Figure 7d, respectively. Figure 6c,d, and Figure 7c,d suggest the red shift of the emission spectra with the increment of excitation wavelength. These results suggest the excitation-dependent emission spectra of the KN-CDs. This might be due to the surface state such as functional groups in KN-CDs, the quantum confinement effect, and the molecular fluorescence of the KN-CDs [58,60,61]. The above measurement result suggests the presence of high nitrogen content in KN-CDs 2, and thus, it is believed that because of high functionalities in KN-CDs 2 (Figure 7), the intensity of the emission spectra of KN-CDs 2 is higher than that of KN-CDs 1 (Figure 6) and hence showed higher quantum yield.
Further, the stability of the KN-CDs solution was studied with storage time and irradiation time (Figure 8). Figure 8a,c shows the emission spectra of the KN-CDs (KN-CDs 1 and KN-CDs 2) at different storage times. Intensities are almost the same and display insignificant changes even after 90 days. In addition, the intensities did not change even after continuous UV light irradiation for 60 min. Photobleaching nor coagulation was not observed for longer storage time and under continuous irradiation of UV light. The photobleaching stability might be due to the electrostatic repulsions between the KN-CDs in solution [29,31]. Moreover, this reveals the photostability of the KN-CDs and thus suggests the utilization of the KN-CDs as metal ion-selective probes. Due to the difference in nitrogen content in KN-CDs 2 compared to KN-CDs 1, it was expected that there would be a difference in selection towards metal ions.
The prepared KN-CDs were used as metal ion sensors, which is usually detected by the interactions between metal ions and functional groups in the KN-CDs that form the complex. The change in emission spectra of the KN-CDs 1 and KN-CDs 2 solutions with various metal ions Al3+, Ca2+, Cd2+, Co3+, Cr3+, Cu2+, Fe3+, Hg2+, Mn2+, Ni2+, Pb2+, and Zn2+ are depicted in Figure 9a and Figure 10a, respectively. The intensities of emission spectra of the KN-CDs with and without metal ions show insignificant changes, except for Fe3+ ions. The fluorescence intensities of the KN-CDs solution with Fe3+ ions are nearly zero, suggesting that the quenching could be assigned for the possible complex formation. This result indicates that the prepared KN-CDs can be employed as specific, efficient, and selective sensors towards Fe3+ ions due to the stronger affinity. Figure 9b and Figure 10b show the histogram of the changes in the fluorescence intensities (F-F0/F0) × 100 at 432 nm that occurred with various metal ions at the same concentrations (1000 μM). Aqueous KN-CDs 1/KN-CDs 2 and KN-CDs 1+Fe3+/KN-CDs 2+Fe3+ solutions are pale-yellow and yellowish-orange, respectively, under daylight. Further, they emitted cyan-blue fluorescence and turn-off fluorescence, respectively, under 365 nm UV light, as shown in the photographic images ofFigure 9b and Figure 10b. This supports the fluorescence quenching of aqueous KN-CDs 1/KN-CDs 2 solutions in the presence of Fe3+ ions. As shown in Figure 9c and Figure 10c, the emission intensities decreased with the concentration (5–25 μM) of the Fe3+ ions. Further, Figure 9d and Figure 10d reveal a good linear relationship between (F-F0)/F0 and the concentrations in the range of 5–25 μM of the Fe3+ ions with R2 of 0.998 and 0.999 using KN-CDs 1 and KN-CDs 2, respectively. The values of the limit of detection (LOD) for KN-CDs 1 and KN-CDs 2 were calculated as 0.95 and 0.85 μM, respectively, using Equation (1) [36].
L O D = 3 σ S
where σ is the standard deviation (n = 5), and S is the slope of the linear calibration plot.
KN-CDs 1 and KN-CDs 2 show similar results towards the detection of metal ions. The introduction of NH4OH resulted in a trivial increment in the fluorescence intensity of KN-CDs 2 compared to KN-CDs 1. This can be explained by considering the presence of nitrogen constituents in the carbon source itself, and thus, the addition of NH4OH does not show remarkable variation in the detection limit values. These higher intensities of KN-CDs 2 might help in bioimaging applications. A comparison table of the LOD values in the present work with previous studies is listed in Table 1 [1,21,61,62,63,64,65,66,67]. This suggests the prepared KN-CDs can be efficient candidates for the detection of Fe3+ ions than the reported ones.

4. Conclusions

In this work, a cheap, simple, and green method for the synthesis of KN-CDs (KN-CDs 1 and KN-CDs 2) using leftover kiwi fruit peel by the hydrothermal-carbonization method is reported. The existence of heteroatoms as chemical compositions in the KN-CDs was confirmed from FTIR, XPS, and EDX mapping studies. KN-CDs 1 and KN-CDs 2 exhibit a moderate degree of graphitization and narrow size distribution with average grain sizes of ca. 5.1 and 5.6 nm, respectively. Further, as-synthesized KN-CDs 1 and KN-CDs 2 emitted strong blue fluorescence under a UV light with quantum yields of 14 and 19%, respectively. Additionally, a redshift in emission with the excitation wavelength was observed. The fluorescence of the KN-CDs was prominently quenched with Fe3+ ions and showed good linearity between concentrations of Fe3+ in the range of 5–25 μM and (F0/F)/F0. The detection limits of Fe3+ ions by KN-CDs 1 and KN-CDs 2 were obtained as 0.95 and 0.85 μM, respectively. Therefore, as-synthesized KN-CDs can be used as effective fluorescence probes for the detection of Fe3+ ions with high sensitivity and selectivity in an aqueous medium without any further surface passivation. Thus, the unique KN-CDs from the natural waste material will motivate researchers towards the use of the KN-CDs for human safety and environmental pollution.

Supplementary Materials

The following are available online at https://0-www-mdpi-com.brum.beds.ac.uk/article/10.3390/chemosensors9070166/s1, Figure S1: ATR-FTIR spectra of KN-CDs 1 and KN-CDs 2, Figure S2: (a,b) FESEM images with different magnifications and (c) EDX spectrum of KN-CDs 1, Figure S3: (a-d) FESEM images of KN-CDs 2 with different magnifications and (e) the corresponding EDX spectrum.

Author Contributions

Conceptualization, data curation, investigation and writing-original draft, R.A.; Methodology and Resources, T.N.J.I.E.; Visualization and writing-review & editing, S.P.; Formal analysis, R.V.; Investigation and visualization, A.K.S.; Validation and visualization, R.S.B.; Project administration and supervision, Y.R.L. All authors equally contributed to this work. All authors have read and agreed to the published version of the manuscript.

Funding

This work was supported by the National Research Foundation of Korea (NRF) grant funded by the Korean government MSIT (2021R1A2B5B02002436).

Institutional Review Board Statement

Not applicable.

Informed Consent Statement

Not applicable.

Data Availability Statement

No data availability.

Acknowledgments

Authors thanks the National Research Foundation of Korea (NRF) for providing the financial support.

Conflicts of Interest

The authors declare no conflict of interest.

References

  1. Chen, Y.; Sun, X.; Pan, W.; Yu, G.; Wang, J. Fe3+-Sensitive Carbon Dots for Detection of Fe3+ in Aqueous Solution and Intracellular Imaging of Fe3+ Inside Fungal Cells. Front. Chem. 2020, 7. [Google Scholar] [CrossRef]
  2. Bu, L.; Luo, T.; Peng, H.; Li, L.; Long, D.; Peng, J.; Huang, J. One-step synthesis of N-doped carbon dots, and their applications in curcumin sensing, fluorescent inks, and super-resolution nanoscopy. Microchim. Acta 2019, 186, 675. [Google Scholar] [CrossRef]
  3. Chen, B.B.; Liu, M.L.; Huang, C.Z. Carbon dot-based composites for catalytic applications. Green Chem. 2020, 22, 4034–4054. [Google Scholar] [CrossRef]
  4. Zeng, Q.; Shao, D.; He, X.; Ren, Z.; Ji, W.; Shan, C.; Qu, S.; Li, J.; Chen, L.; Li, Q. Carbon dots as a trackable drug delivery carrier for localized cancer therapy in vivo. J. Mater. Chem. B 2016, 4, 5119–5126. [Google Scholar] [CrossRef] [PubMed]
  5. He, P.; Shi, Y.; Meng, T.; Yuan, T.; Li, Y.; Li, X.; Zhang, Y.; Fan, L.; Yang, S. Recent advances in white light-emitting diodes of carbon quantum dots. Nanoscale 2020, 12, 4826–4832. [Google Scholar] [CrossRef] [PubMed]
  6. Valizadeh, A.; Mikaeili, H.; Samiei, M.; Farkhani, S.M.; Zarghami, N.; Kouhi, M.; Akbarzadeh, A.; Davaran, S. Quantum dots: Synthesis, bioapplications, and toxicity. Nanoscale Res. Lett. 2012, 7, 480. [Google Scholar] [CrossRef] [PubMed] [Green Version]
  7. Liu, W.; Liang, R.; Lin, Y. Confined synthesis of carbon dots with tunable long-wavelength emission in a 2-dimensional layered double hydroxide matrix. Nanoscale 2020, 12, 7888–7894. [Google Scholar] [CrossRef] [PubMed]
  8. Emam, A.N.; Loutfy, S.A.; Mostafa, A.A.; Awad, H.; Mohamed, M.B. Cyto-toxicity, biocompatibility and cellular response of carbon dots–plasmonic based nano-hybrids for bioimaging. RSC Adv. 2017, 7, 23502–23514. [Google Scholar] [CrossRef] [Green Version]
  9. Zhao, P.; Zhu, L. Dispersibility of carbon dots in aqueous and/or organic solvents. Chem. Commun. 2018, 54, 5401–5406. [Google Scholar] [CrossRef] [PubMed]
  10. Liu, Y.; Zhou, L.; Li, Y.; Deng, R.; Zhang, H. Highly fluorescent nitrogen-doped carbon dots with excellent thermal and photo stability applied as invisible ink for loading important information and anti-counterfeiting. Nanoscale 2017, 9, 491–496. [Google Scholar] [CrossRef] [PubMed] [Green Version]
  11. Sun, D.; Liu, T.; Wang, C.; Yang, L.; Yang, S.; Zhuo, K. Hydrothermal synthesis of fluorescent carbon dots from gardenia fruit for sensitive on-off-on detection of Hg2+ and cysteine. Spectrochim. Acta Part A Mol. Biomol. Spectrosc. 2020, 240, 118598. [Google Scholar] [CrossRef] [PubMed]
  12. Sharma, A.; Das, J. Small molecules derived carbon dots: Synthesis and applications in sensing, catalysis, imaging, and biomedicine. J. Nanobiotechnol. 2019, 17, 92. [Google Scholar] [CrossRef] [PubMed] [Green Version]
  13. Liu, Q.; Zhang, N.; Shi, H.; Ji, W.; Guo, X.; Yuan, W.; Hu, Q. One-step microwave synthesis of carbon dots for highly sensitive and selective detection of copper ions in aqueous solution. New J. Chem. 2018, 42, 3097–3101. [Google Scholar] [CrossRef]
  14. Ludmerczki, R.; Mura, S.; Carbonaro, C.M.; Mandity, I.M.; Carraro, M.; Senes, N.; Garroni, S.; Granozzi, G.; Calvillo, L.; Marras, S.; et al. Carbon Dots from Citric Acid and its Intermediates Formed by Thermal Decomposition. Chem. A Eur. J. 2019, 25, 11963–11974. [Google Scholar] [CrossRef] [PubMed]
  15. Chen, W.; Hu, C.; Yang, Y.; Cui, J.; Liu, Y. Rapid Synthesis of Carbon Dots by Hydrothermal Treatment of Lignin. Mater. Basel Switz. 2016, 9, 184. [Google Scholar] [CrossRef]
  16. Xia, C.; Zhu, S.; Feng, T.; Yang, M.; Yang, B. Evolution and Synthesis of Carbon Dots: From Carbon Dots to Carbonized Polymer Dots. Adv. Sci. 2019, 6, 1901316. [Google Scholar] [CrossRef]
  17. Park, S.Y.; Lee, C.Y.; An, H.-R.; Kim, H.; Lee, Y.-C.; Park, E.C.; Chun, H.-S.; Yang, H.Y.; Choi, S.-H.; Kim, H.S.; et al. Advanced carbon dots via plasma-induced surface functionalization for fluorescent and bio-medical applications. Nanoscale 2017, 9, 9210–9217. [Google Scholar] [CrossRef] [Green Version]
  18. Wang, X.; Feng, Y.; Dong, P.; Huang, J. A Mini Review on Carbon Quantum Dots: Preparation, Properties, and Electrocatalytic Application. Front. Chem. 2019, 7. [Google Scholar] [CrossRef] [PubMed]
  19. Xu, J.; Wang, C.; Li, H.; Zhao, W. Synthesis of green-emitting carbon quantum dots with double carbon sources and their application as a fluorescent probe for selective detection of Cu2+ ions. RSC Adv. 2020, 10, 2536–2544. [Google Scholar] [CrossRef] [Green Version]
  20. Thongpool, V.; Asanithi, P.; Limsuwan, P. Synthesis of Carbon Particles using Laser Ablation in Ethanol. Procedia Eng. 2012, 32, 1054–1060. [Google Scholar] [CrossRef] [Green Version]
  21. Liu, M.; Xu, Y.; Niu, F.; Gooding, J.J.; Liu, J. Carbon quantum dots directly generated from electrochemical oxidation of graphite electrodes in alkaline alcohols and the applications for specific ferric ion detection and cell imaging. Analyst 2016, 141, 2657–2664. [Google Scholar] [CrossRef] [PubMed]
  22. Qiao, Z.-A.; Wang, Y.; Gao, Y.; Li, H.; Dai, T.; Liu, Y.; Huo, Q. Commercially activated carbon as the source for producing multicolor photoluminescent carbon dots by chemical oxidation. Chem. Commun. 2010, 46, 8812–8814. [Google Scholar] [CrossRef] [PubMed]
  23. Kumar, R.; Kumar, V.B.; Gedanken, A. Sonochemical synthesis of carbon dots, mechanism, effect of parameters, and catalytic, energy, biomedical and tissue engineering applications. Ultrason. Sonochem. 2020, 64, 105009. [Google Scholar] [CrossRef]
  24. Qu, K.; Wang, J.; Ren, J.; Qu, X. Carbon dots prepared by hydrothermal treatment of dopamine as an effective fluorescent sensing platform for the label-free detection of iron(III) ions and dopamine. Chem. Weinh. Bergstr. Ger. 2013, 19, 7243–7249. [Google Scholar] [CrossRef]
  25. Qin, X.; Lu, W.; Asiri, A.M.; Al-Youbi, A.O.; Sun, X. Green, low-cost synthesis of photoluminescent carbon dots by hydrothermal treatment of willow bark and their application as an effective photocatalyst for fabricating Au nanoparticles–reduced graphene oxide nanocomposites for glucose detection. Catal. Sci. Technol. 2013, 3, 1027–1035. [Google Scholar] [CrossRef]
  26. Atchudan, R.; Edison, T.N.J.I.; Shanmugam, M.; Perumal, S.; Somanathan, T.; Lee, Y.R. Sustainable synthesis of carbon quantum dots from banana peel waste using hydrothermal process for in vivo bioimaging. Phys. E Low Dimens. Syst. Nanostruct. 2021, 126, 114417. [Google Scholar] [CrossRef]
  27. Ng, H.K.M.; Lim, G.K.; Leo, C.P. Comparison between hydrothermal and microwave-assisted synthesis of carbon dots from biowaste and chemical for heavy metal detection: A review. Microchem. J. 2021, 165, 106116. [Google Scholar] [CrossRef]
  28. Marouzi, S.; Darroudi, M.; Hekmat, A.; Sadri, K.; Kazemi Oskuee, R. One-pot hydrothermal synthesis of carbon quantum dots from Salvia hispanica L. seeds and investigation of their biodistribution, and cytotoxicity effects. J. Environ. Chem. Eng. 2021, 9, 105461. [Google Scholar] [CrossRef]
  29. Atchudan, R.; Edison, T.N.J.I.; Perumal, S.; Muthuchamy, N.; Lee, Y.R. Hydrophilic nitrogen-doped carbon dots from biowaste using dwarf banana peel for environmental and biological applications. Fuel 2020, 275, 117821. [Google Scholar] [CrossRef]
  30. Liu, Y.; Guo, D.; Gao, Y.; Tong, B.; Li, Y.; Zhu, Y. Non-thermal effect of microwave on the chemical structure and luminescence properties of biomass-derived carbon dots via hydrothermal method. Appl. Surf. Sci. 2021, 552, 149503. [Google Scholar] [CrossRef]
  31. Atchudan, R.; Edison, T.N.J.I.; Aseer, K.R.; Perumal, S.; Lee, Y.R. Hydrothermal conversion of Magnolia liliiflora into nitrogen-doped carbon dots as an effective turn-off fluorescence sensing, multi-colour cell imaging and fluorescent ink. Colloids and Surf. B Biointerfaces 2018, 169, 321–328. [Google Scholar] [CrossRef]
  32. Atchudan, R.; Edison, T.N.J.I.; Sethuraman, M.G.; Lee, Y.R. Efficient synthesis of highly fluorescent nitrogen-doped carbon dots for cell imaging using unripe fruit extract of Prunus mume. Appl. Surf. Sci. 2016, 384, 432–441. [Google Scholar] [CrossRef]
  33. Batool, M.; Junaid, H.M.; Tabassum, S.; Kanwal, F.; Abid, K.; Fatima, Z.; Shah, A.T. Metal Ion Detection by Carbon Dots—A Review. Crit. Rev. Anal. Chem. 2020, 1–12. [Google Scholar] [CrossRef]
  34. Gao, X.; Du, C.; Zhuang, Z.; Chen, W. Carbon quantum dot-based nanoprobes for metal ion detection. J. Mater. Chem. C 2016, 4, 6927–6945. [Google Scholar] [CrossRef]
  35. Boobalan, T.; Sethupathi, M.; Sengottuvelan, N.; Kumar, P.; Balaji, P.; Gulyás, B.; Padmanabhan, P.; Selvan, S.T.; Arun, A. Mushroom-Derived Carbon Dots for Toxic Metal Ion Detection and as Antibacterial and Anticancer Agents. ACS Appl. Nano Mater. 2020, 3, 5910–5919. [Google Scholar] [CrossRef]
  36. Atchudan, R.; Edison, T.N.J.I.; Aseer, K.R.; Perumal, S.; Karthik, N.; Lee, Y.R. Highly fluorescent nitrogen-doped carbon dots derived from Phyllanthus acidus utilized as a fluorescent probe for label-free selective detection of Fe3+ ions, live cell imaging and fluorescent ink. Biosens. Bioelectron. 2018, 99, 303–311. [Google Scholar] [CrossRef] [PubMed]
  37. Teng, X.; Ma, C.; Ge, C.; Yan, M.; Yang, J.; Zhang, Y.; Morais, P.C.; Bi, H. Green synthesis of nitrogen-doped carbon dots from konjac flour with “off–on” fluorescence by Fe3+ and l-lysine for bioimaging. J. Mater. Chem. B 2014, 2, 4631–4639. [Google Scholar] [CrossRef] [PubMed]
  38. Hu, Y.; Yang, J.; Tian, J.; Jia, L.; Yu, J.-S. Waste frying oil as a precursor for one-step synthesis of sulfur-doped carbon dots with pH-sensitive photoluminescence. Carbon 2014, 77, 775–782. [Google Scholar] [CrossRef]
  39. Atchudan, R.; Edison, T.N.J.I.; Perumal, S.; Lee, Y.R. Green synthesis of nitrogen-doped graphitic carbon sheets with use of Prunus persica for supercapacitor applications. Appl. Surf. Sci. 2017, 393, 276–286. [Google Scholar] [CrossRef]
  40. Dager, A.; Uchida, T.; Maekawa, T.; Tachibana, M. Synthesis and characterization of Mono-disperse Carbon Quantum Dots from Fennel Seeds: Photoluminescence analysis using Machine Learning. Sci. Rep. 2019, 9, 14004. [Google Scholar] [CrossRef]
  41. Jo, W.-K.; Kumar, S.; Isaacs, M.A.; Lee, A.F.; Karthikeyan, S. Cobalt promoted TiO2/GO for the photocatalytic degradation of oxytetracycline and Congo Red. Appl. Catal. B Environ. 2017, 201, 159–168. [Google Scholar] [CrossRef] [Green Version]
  42. Zulfajri, M.; Dayalan, S.; Li, W.-Y.; Chang, C.-J.; Chang, Y.-P.; Huang, G.G. Nitrogen-Doped Carbon Dots from Averrhoa carambola Fruit Extract as a Fluorescent Probe for Methyl Orange. Sensors 2019, 19, 5008. [Google Scholar] [CrossRef] [PubMed] [Green Version]
  43. Atchudan, R.; Edison, T.N.J.I.; Mani, S.; Perumal, S.; Vinodh, R.; Thirunavukkarasu, S.; Lee, Y.R. Facile synthesis of a novel nitrogen-doped carbon dot adorned zinc oxide composite for photodegradation of methylene blue. Dalton Trans. 2020, 49, 17725–17736. [Google Scholar] [CrossRef]
  44. Fares, N.V.; Medhat, P.M.; El Maraghy, C.M.; Okeil, S.; Ayad, M.F. Influence of Nitrogen-Doped Carbon Dot and Silver Nanoparticle Modified Carbon Paste Electrodes on the Potentiometric Determination of Tobramycin Sulfate: A Comparative Study. Chemosensors 2021, 9, 52. [Google Scholar] [CrossRef]
  45. Atchudan, R.; Edison, T.N.J.I.; Lee, Y.R. Nitrogen-doped carbon dots originating from unripe peach for fluorescent bioimaging and electrocatalytic oxygen reduction reaction. J. Colloid Interf. Sci. 2016, 482, 8–18. [Google Scholar] [CrossRef] [PubMed]
  46. Alarfaj, N.A.; El-Tohamy, M.F.; Oraby, H.F. CA 19-9 Pancreatic Tumor Marker Fluorescence Immunosensing Detection via Immobilized Carbon Quantum Dots Conjugated Gold Nanocomposite. Int. J. Mol. Sci. 2018, 19, 1162. [Google Scholar] [CrossRef] [PubMed] [Green Version]
  47. Atchudan, R.; Edison, T.N.J.I.; Perumal, S.; Muthuchamy, N.; Lee, Y.R. Eco-friendly synthesis of tunable fluorescent carbon nanodots from Malus floribunda for sensors and multicolor bioimaging. J. Photochem. Photobiol. A Chem. 2020, 390, 112336. [Google Scholar] [CrossRef]
  48. Chandra, S.; Pradhan, S.; Mitra, S.; Patra, P.; Bhattacharya, A.; Pramanik, P.; Goswami, A. High throughput electron transfer from carbon dots to chloroplast: A rationale of enhanced photosynthesis. Nanoscale 2014, 6, 3647–3655. [Google Scholar] [CrossRef] [PubMed]
  49. Atchudan, R.; Jebakumar Immanuel Edison, T.N.; Perumal, S.; Vinodh, R.; Lee, Y.R. Multicolor-emitting carbon dots from Malus floribunda and their interaction with Caenorhabditis elegans. Mater. Lett. 2020, 261, 127153. [Google Scholar] [CrossRef]
  50. Zhao, L.; Wang, Y.; Zhao, X.; Deng, Y.; Xia, Y. Facile Synthesis of Nitrogen-Doped Carbon Quantum Dots with Chitosan for Fluorescent Detection of Fe3+. Polymers 2019, 11, 1731. [Google Scholar] [CrossRef] [Green Version]
  51. Wang, H.; Gao, P.; Wang, Y.; Guo, J.; Zhang, K.-Q.; Du, D.; Dai, X.; Zou, G. Fluorescently tuned nitrogen-doped carbon dots from carbon source with different content of carboxyl groups. APL Mater. 2015, 3, 086102. [Google Scholar] [CrossRef] [Green Version]
  52. Wu, P.; Li, W.; Wu, Q.; Liu, Y.; Liu, S. Hydrothermal synthesis of nitrogen-doped carbon quantum dots from microcrystalline cellulose for the detection of Fe3+ ions in an acidic environment. RSC Adv. 2017, 7, 44144–44153. [Google Scholar] [CrossRef] [Green Version]
  53. Wang, H.; Sun, P.; Cong, S.; Wu, J.; Gao, L.; Wang, Y.; Dai, X.; Yi, Q.; Zou, G. Nitrogen-Doped Carbon Dots for “green” Quantum Dot Solar Cells. Nanoscale Res. Lett. 2016, 11, 27. [Google Scholar] [CrossRef] [PubMed] [Green Version]
  54. Atchudan, R.; Edison, T.N.J.I.; Chakradhar, D.; Perumal, S.; Shim, J.-J.; Lee, Y.R. Facile green synthesis of nitrogen-doped carbon dots using Chionanthus retusus fruit extract and investigation of their suitability for metal ion sensing and biological applications. Sens. Actuators B Chem. 2017, 246, 497–509. [Google Scholar] [CrossRef]
  55. Zhang, R.; Chen, W. Nitrogen-doped carbon quantum dots: Facile synthesis and application as a “turn-off” fluorescent probe for detection of Hg2+ ions. Biosens. Bioelectron. 2014, 55, 83–90. [Google Scholar] [CrossRef] [PubMed]
  56. Ju, J.; Chen, W. Synthesis of highly fluorescent nitrogen-doped graphene quantum dots for sensitive, label-free detection of Fe (III) in aqueous media. Biosens. Bioelectron. 2014, 58, 219–225. [Google Scholar] [CrossRef]
  57. Amer, M.S.; Arunachalam, P.; Al-Mayouf, A.M.; Prasad, S.; Alshalwi, M.N.; Ghanem, M.A. Mesoporous Tungsten Trioxide Photoanodes Modified with Nitrogen-Doped Carbon Quantum Dots for Enhanced Oxygen Evolution Photo-Reaction. Nanomaterials 2019, 9, 1502. [Google Scholar] [CrossRef] [PubMed] [Green Version]
  58. Atchudan, R.; Edison, T.N.J.I.; Perumal, S.; Vinodh, R.; Lee, Y.R. Betel-derived nitrogen-doped multicolor carbon dots for environmental and biological applications. J. Mol. Liq. 2019, 296, 111817. [Google Scholar] [CrossRef]
  59. Nezhad-Mokhtari, P.; Arsalani, N.; Ghorbani, M.; Hamishehkar, H. Development of biocompatible fluorescent gelatin nanocarriers for cell imaging and anticancer drug targeting. J. Mater. Sci. 2018, 53, 10679–10691. [Google Scholar] [CrossRef]
  60. Liu, M.L.; Chen, B.B.; Li, C.M.; Huang, C.Z. Carbon dots: Synthesis, formation mechanism, fluorescence origin and sensing applications. Green Chem. 2019, 21, 449–471. [Google Scholar] [CrossRef]
  61. Edison, T.N.J.I.; Atchudan, R.; Shim, J.-J.; Kalimuthu, S.; Ahn, B.-C.; Lee, Y.R. Turn-off fluorescence sensor for the detection of ferric ion in water using green synthesized N-doped carbon dots and its bio-imaging. J. Photochem. Photobiol. B Biol. 2016, 158, 235–242. [Google Scholar] [CrossRef] [PubMed]
  62. Ding, S.; Gao, Y.; Ni, B.; Yang, X. Green synthesis of biomass-derived carbon quantum dots as fluorescent probe for Fe3+ detection. Inorg. Chem. Commun. 2021, 130, 108636. [Google Scholar] [CrossRef]
  63. Zhou, J.; Ge, M.; Han, Y.; Ni, J.; Huang, X.; Han, S.; Peng, Z.; Li, Y.; Li, S. Preparation of Biomass-Based Carbon Dots with Aggregation Luminescence Enhancement from Hydrogenated Rosin for Biological Imaging and Detection of Fe3+. ACS Omega 2020, 5, 11842–11848. [Google Scholar] [CrossRef] [PubMed]
  64. Zhu, J.; Chu, H.; Wang, T.; Wang, C.; Wei, Y. Fluorescent probe based nitrogen doped carbon quantum dots with solid-state fluorescence for the detection of Hg2+ and Fe3+ in aqueous solution. Microchem. J. 2020, 158, 105142. [Google Scholar] [CrossRef]
  65. Liu, Z.; Chen, M.; Guo, Y.; Zhou, J.; Shi, Q.; Sun, R. Oxidized nanocellulose facilitates preparing photoluminescent nitrogen-doped fluorescent carbon dots for Fe3+ ions detection and bioimaging. Chem. Eng. J. 2020, 384, 123260. [Google Scholar] [CrossRef]
  66. Gao, X.; Zhou, X.; Ma, Y.; Qian, T.; Wang, C.; Chu, F. Facile and cost-effective preparation of carbon quantum dots for Fe3+ ion and ascorbic acid detection in living cells based on the “on-off-on” fluorescence principle. Appl. Surf. Sci. 2019, 469, 911–916. [Google Scholar] [CrossRef]
  67. Shi, Y.; Liu, J.; Zhang, Y.; Bao, J.; Cheng, J.; Yi, C. Microwave-assisted synthesis of colorimetric and fluorometric dual-functional hybrid carbon nanodots for Fe3+ detection and bioimaging. Chin. Chem. Lett. 2021. [Google Scholar] [CrossRef]
Scheme 1. Schematic illustration of the fluorescent KN-CDs formation from leftover kiwi fruit peel.
Chemosensors 09 00166 sch001
Figure 1. (a) XRD patterns and (b) Raman spectra of the KN-CDs.
Chemosensors 09 00166 g001
Figure 2. (a) XPS survey spectra of the KN-CDs. (b) C 1s, (d) N 1s, and (f) O 1s levels of high-resolution XPS of KN-CDs 1. (c) C 1s, (e) N 1s, and (g) O 1s levels of high-resolution XPS of KN-CDs 2.
Chemosensors 09 00166 g002
Figure 3. (a) FESEM image of KN-CDs 1 and the corresponding elemental mapping of (b) carbon, (c) oxygen, and (d) nitrogen, and (e) overlapping of elemental mapping.
Chemosensors 09 00166 g003
Figure 4. (a) FESEM image of KN-CDs 2 and the corresponding elemental mapping of (b) carbon, (c) oxygen, (d) nitrogen, and (e) overlapping of elemental mapping.
Chemosensors 09 00166 g004
Figure 5. (a,b) TEM and (c) HRTEM image of KN-CDs 1. (a) Particle size distribution graph of KN-CD 1). (d,e) TEM and (f) HRTEM image of KN-CDs 2. (d) Particle size distribution graph of KN-CD 2.
Chemosensors 09 00166 g005
Figure 6. (a) UV–vis spectrum; (b) excitation and emission spectra; (c) excitation-dependent emission spectra; (d) excitation-dependent emission normalized spectra of KN-CDs 1.
Chemosensors 09 00166 g006
Figure 7. (a) UV–vis spectrum; (b) excitation and emission spectra; (c) excitation-dependent emission spectra; (d) excitation-dependent emission-normalized spectra of KN-CDs 2.
Chemosensors 09 00166 g007
Figure 8. Fluorescence emission spectra of KN-CDs 1 at (a) different storage times at room temperature and (b) different irradiation times under a UV lamp. Fluorescence emission spectra of KN-CDs 2 at (c) different storage times at room temperature and (d) different irradiation times under UV light.
Chemosensors 09 00166 g008
Figure 9. (a) Changes in the emission spectra of KN-CDs 1 by the addition of different metal ions (1000 μM) and (b) the corresponding metal ion affinity (%). (c) Fluorescence spectra of KN-CDs 1 in the presence of different amounts of Fe3+ ions (5–25 μM), and (d) the linear calibration graph for (F0/F)/F0 with different concentrations of Fe3+ ion.
Chemosensors 09 00166 g009
Figure 10. (a) Changes in the emission spectra of KN-CDs 2 by the addition of different metal ions (1000 μM) and (b) the corresponding metal ion affinity (%). (c) Fluorescence spectra of KN-CDs 2 in the presence of different amounts of Fe3+ ions (5–25 μM), and (d) the linear calibration graph for (F0/F)/F0 with different concentrations of Fe3+ ion.
Chemosensors 09 00166 g010
Table 1. Comparison of different CDs with various carbon precursors for the sensing of Fe3+ ions.
No.Carbon PrecursorExcitation (nm)Linear Range (μM)LOD (μM)Reference
1L-glutamic acid3608–803.8[1]
2Graphite36510–2001.8[21]
3Crop wastes3500–5005.23[62]
4Hydrogenated rosin3100–606.16[63]
5Tartaric acid3500–700.5[64]
6P. avium3100–1000.96[61]
7Cellulose3201–1001.14[65]
8Lignin3200–3505.34[66]
9Citric Acid3600–1503.4[67]
10Kiwi fruit peel3605–250.85This Work
Publisher’s Note: MDPI stays neutral with regard to jurisdictional claims in published maps and institutional affiliations.

