
Graphene Bioelectronic Nose for the Detection of Odorants with Human Olfactory Receptor 2AG1

 , ,
, , 
Abstract
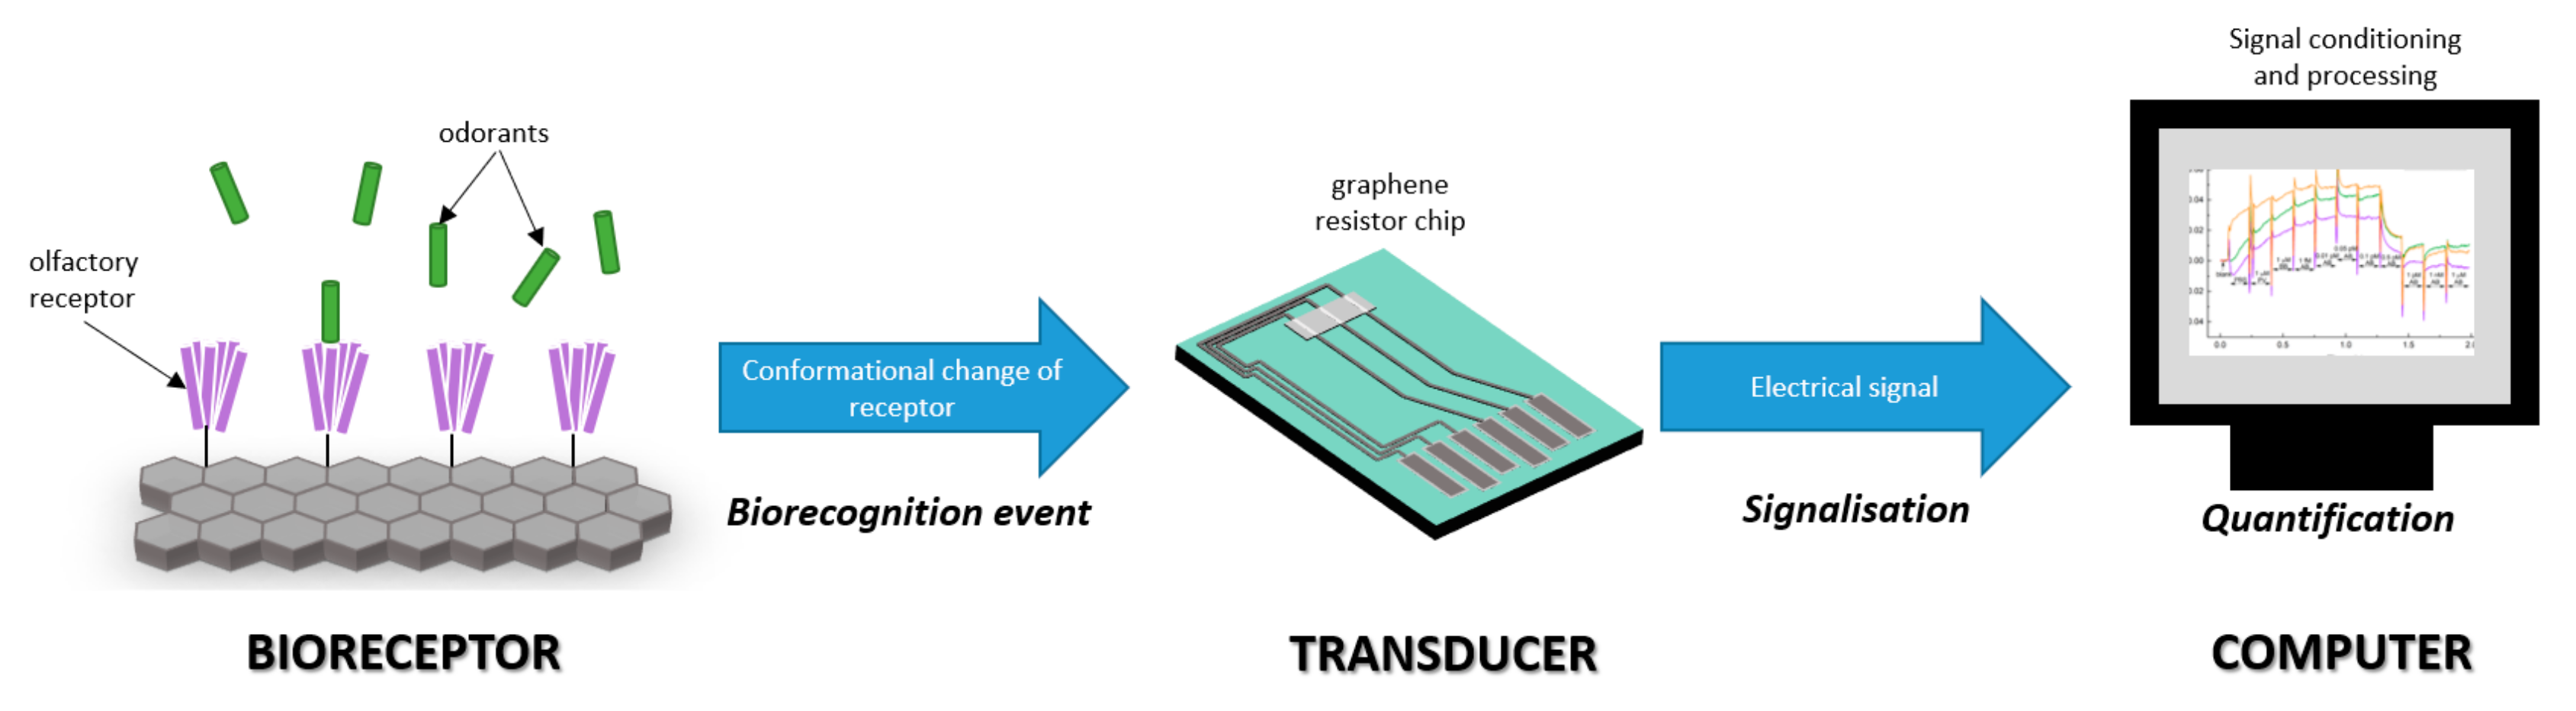
:1. Introduction
2. Materials and Methods
2.1. Materials
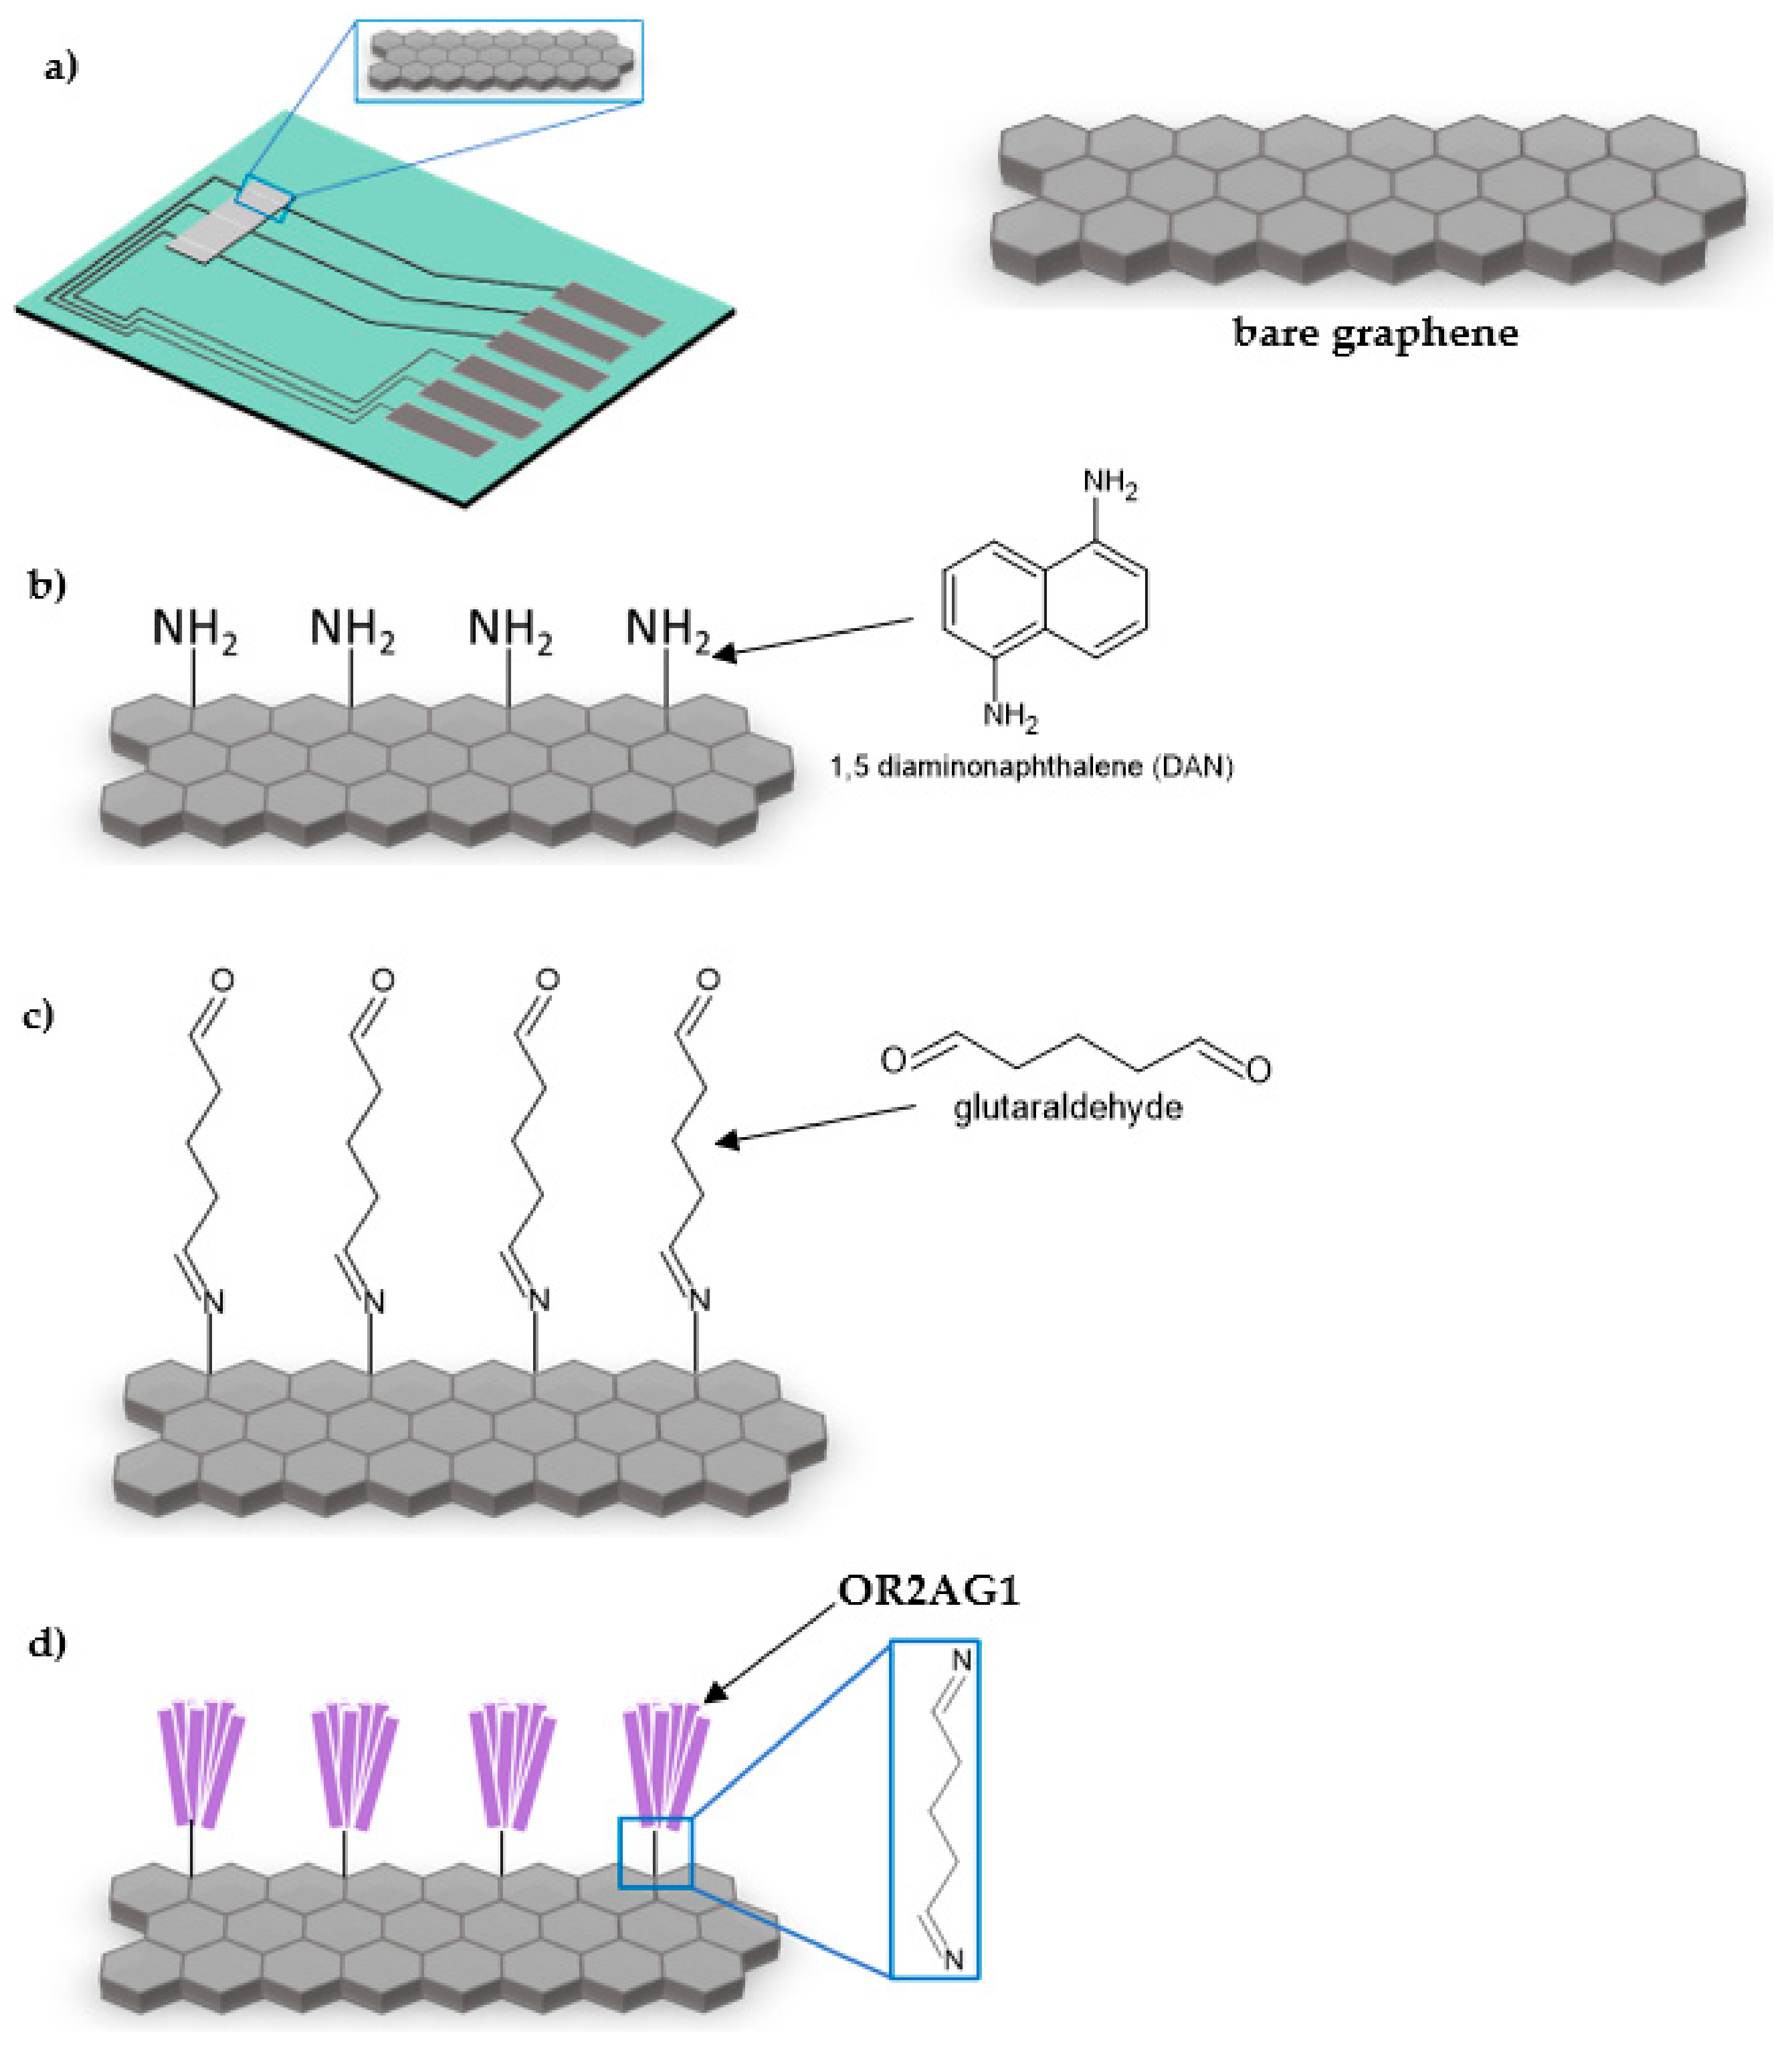
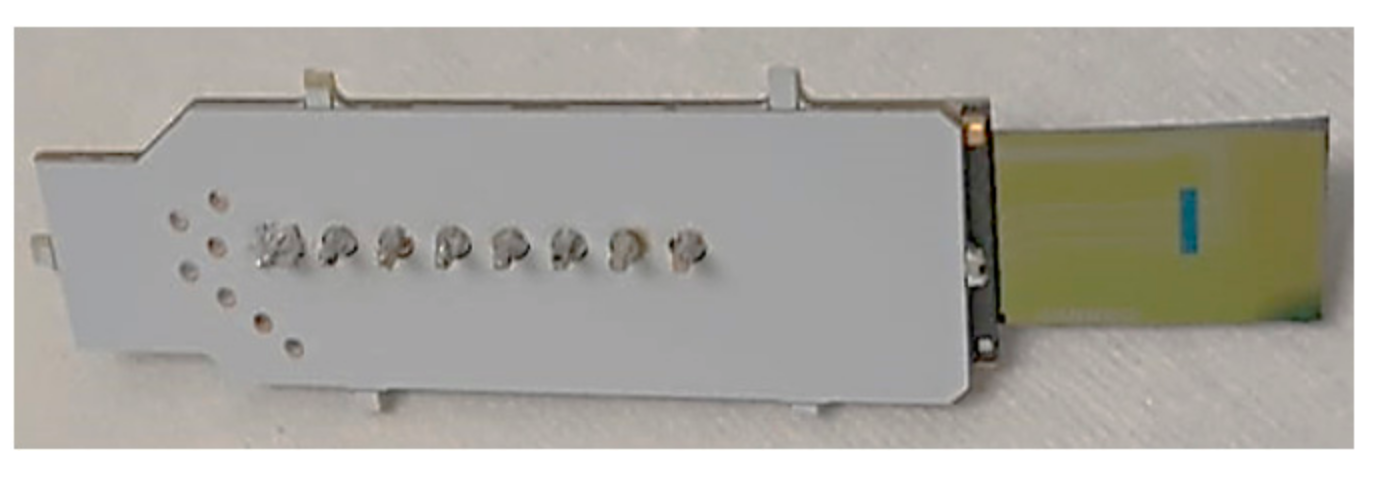
2.2. Device Fabrication
2.3. Functionalization of Graphene
2.3.1. DAN Functionalization
2.3.2. Olfactory Receptor Attachment
2.3.3. Blocker Attachment
2.4. Electrical Measurements
3. Results and Discussion
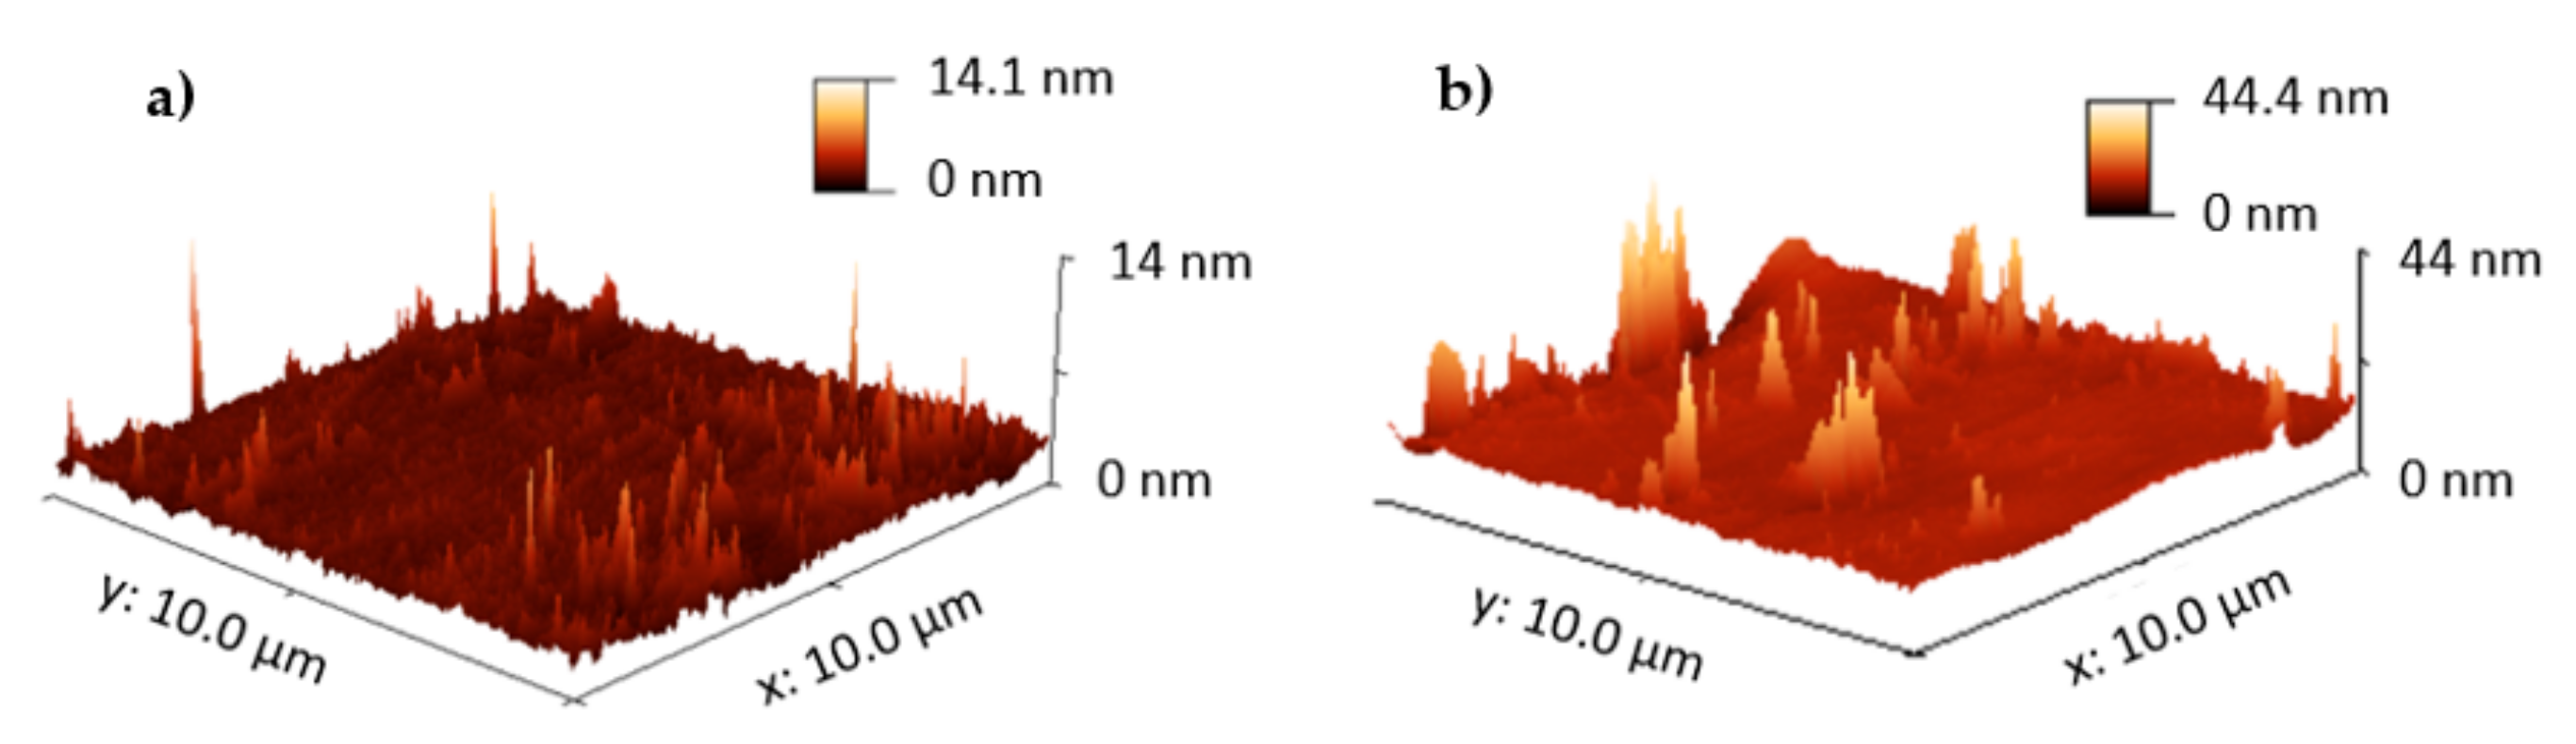
3.1. Surface Characterization: Atomic Force Microscopy
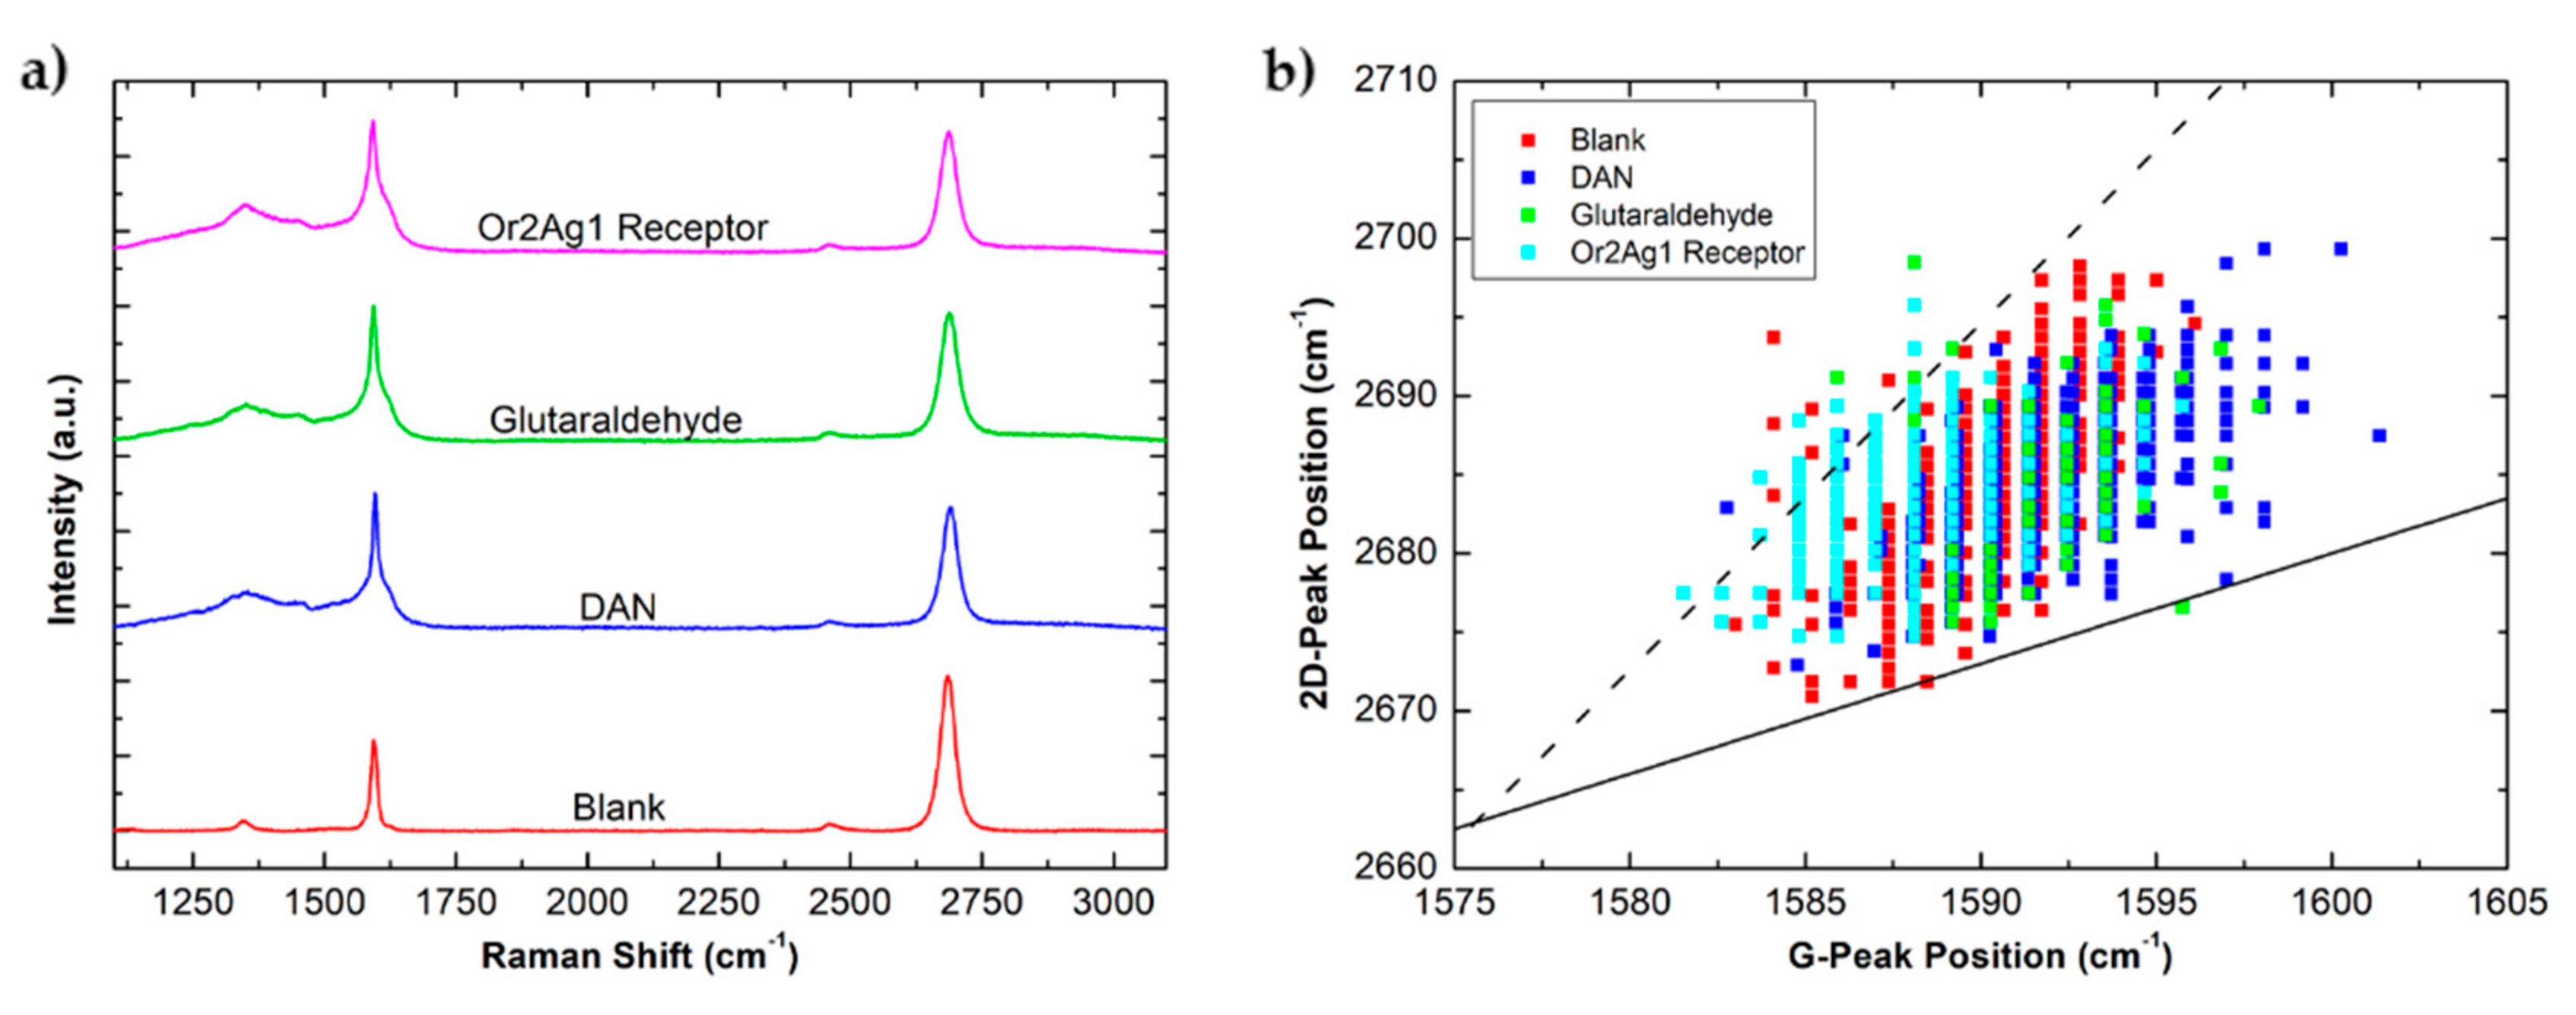
3.2. Surface Characterization: Raman Spectroscopy
3.3. Electrical Measurements
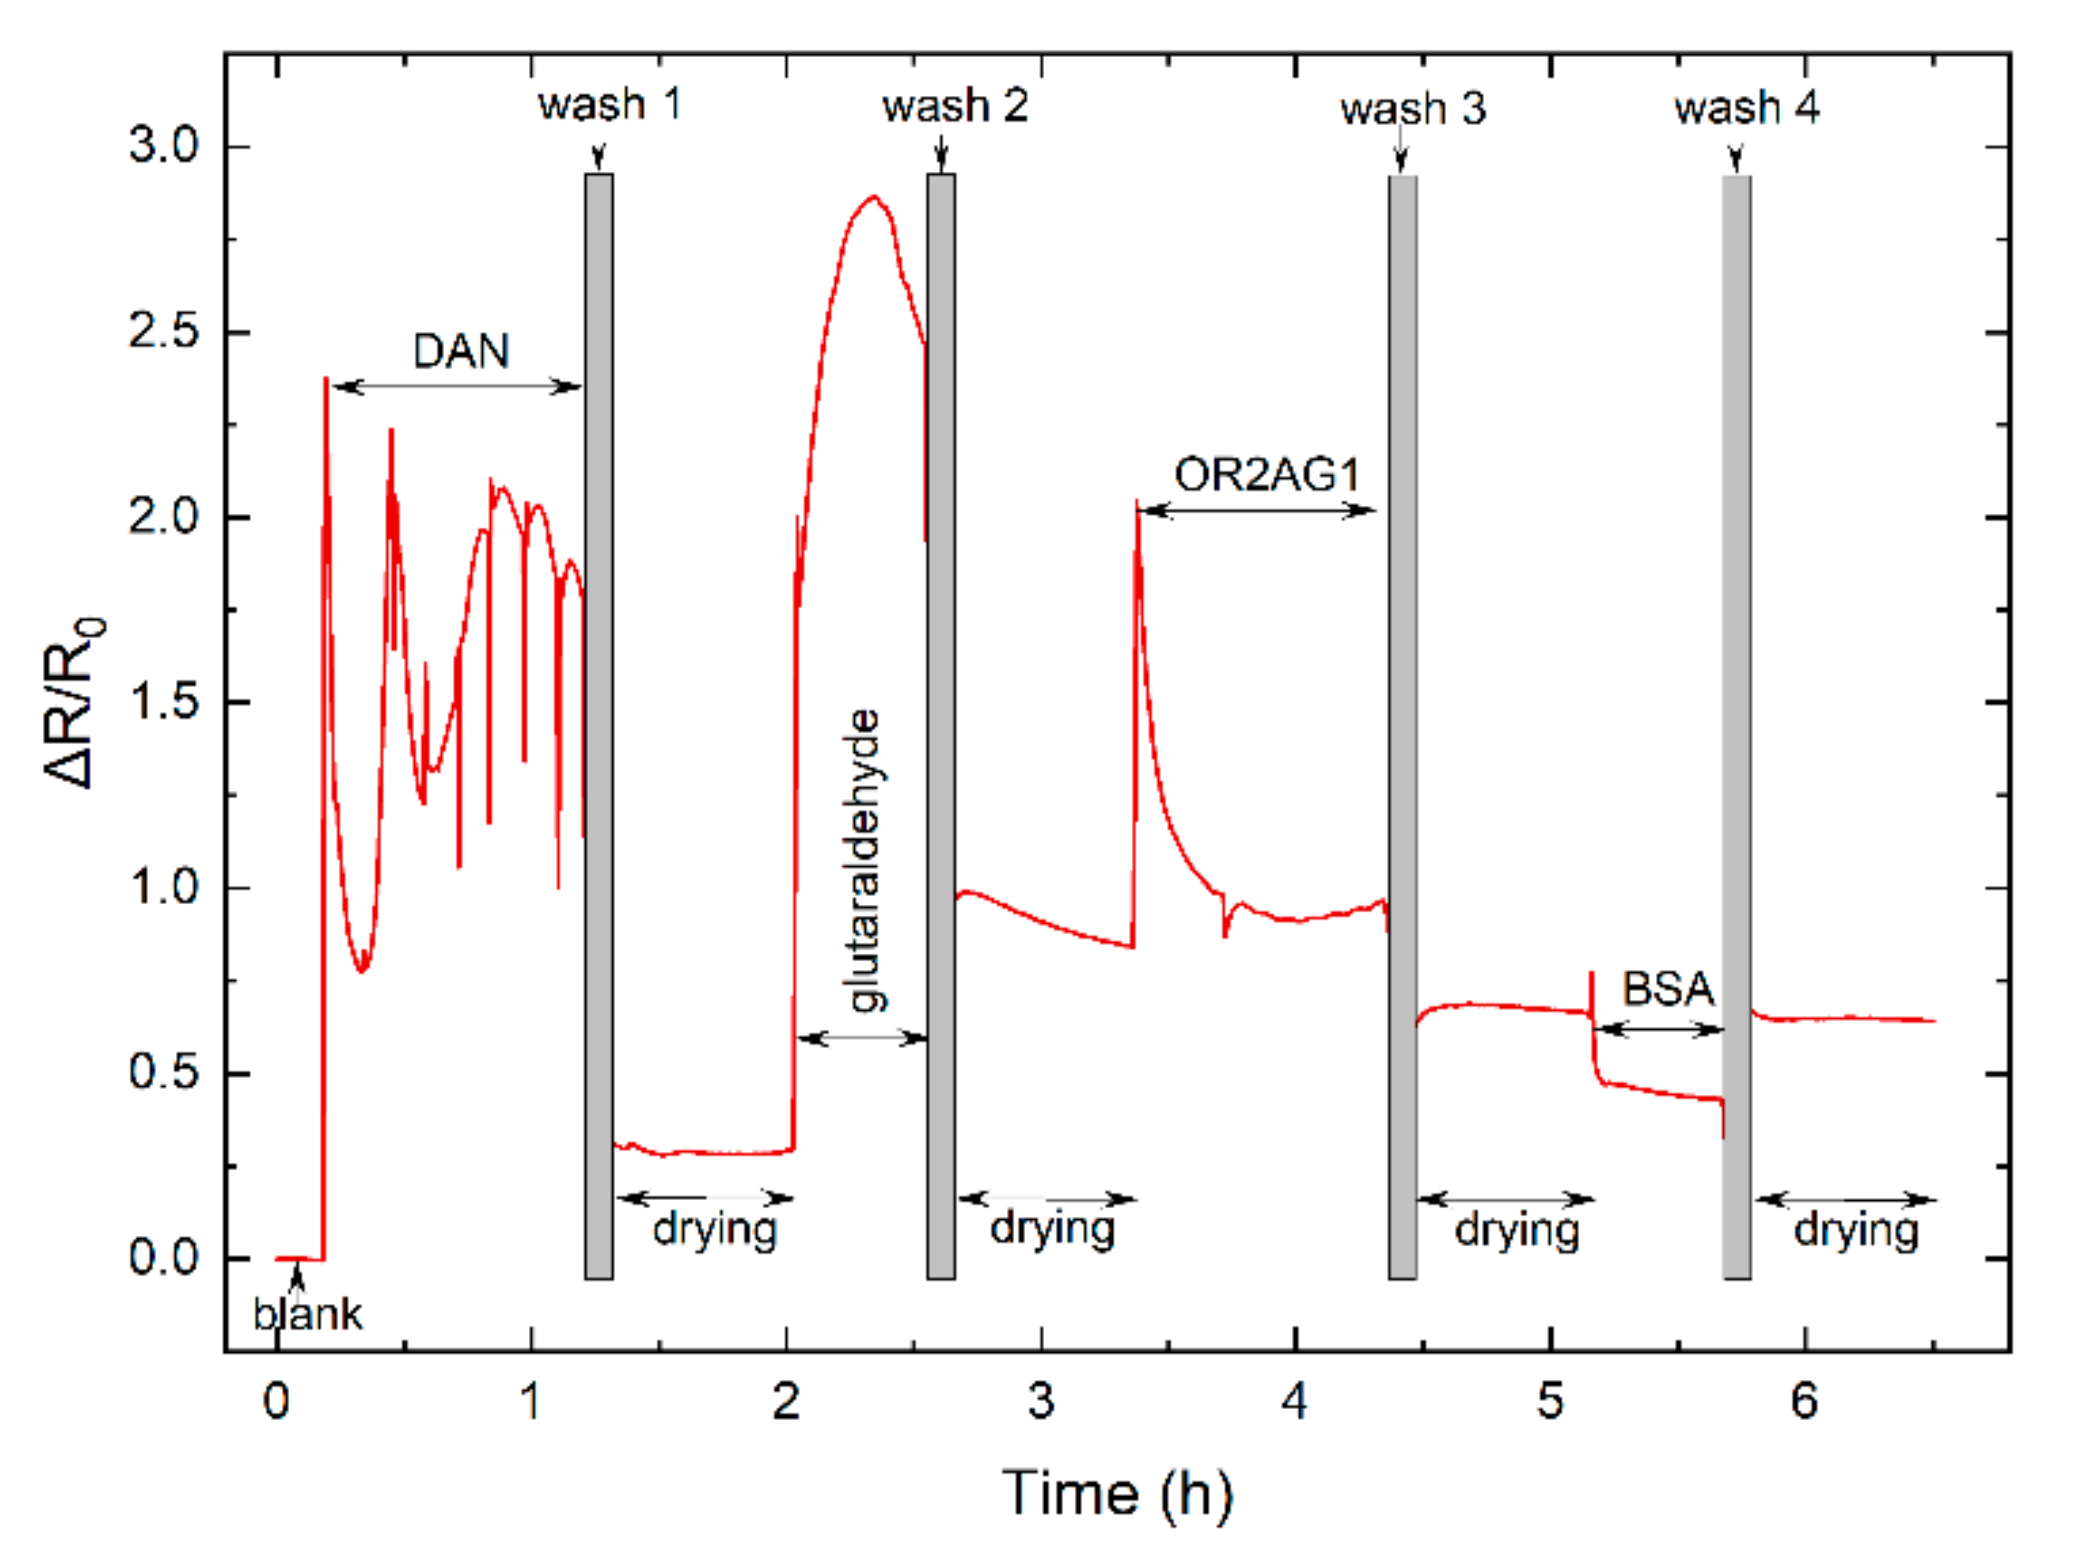
3.3.1. Real-Time Functionalization
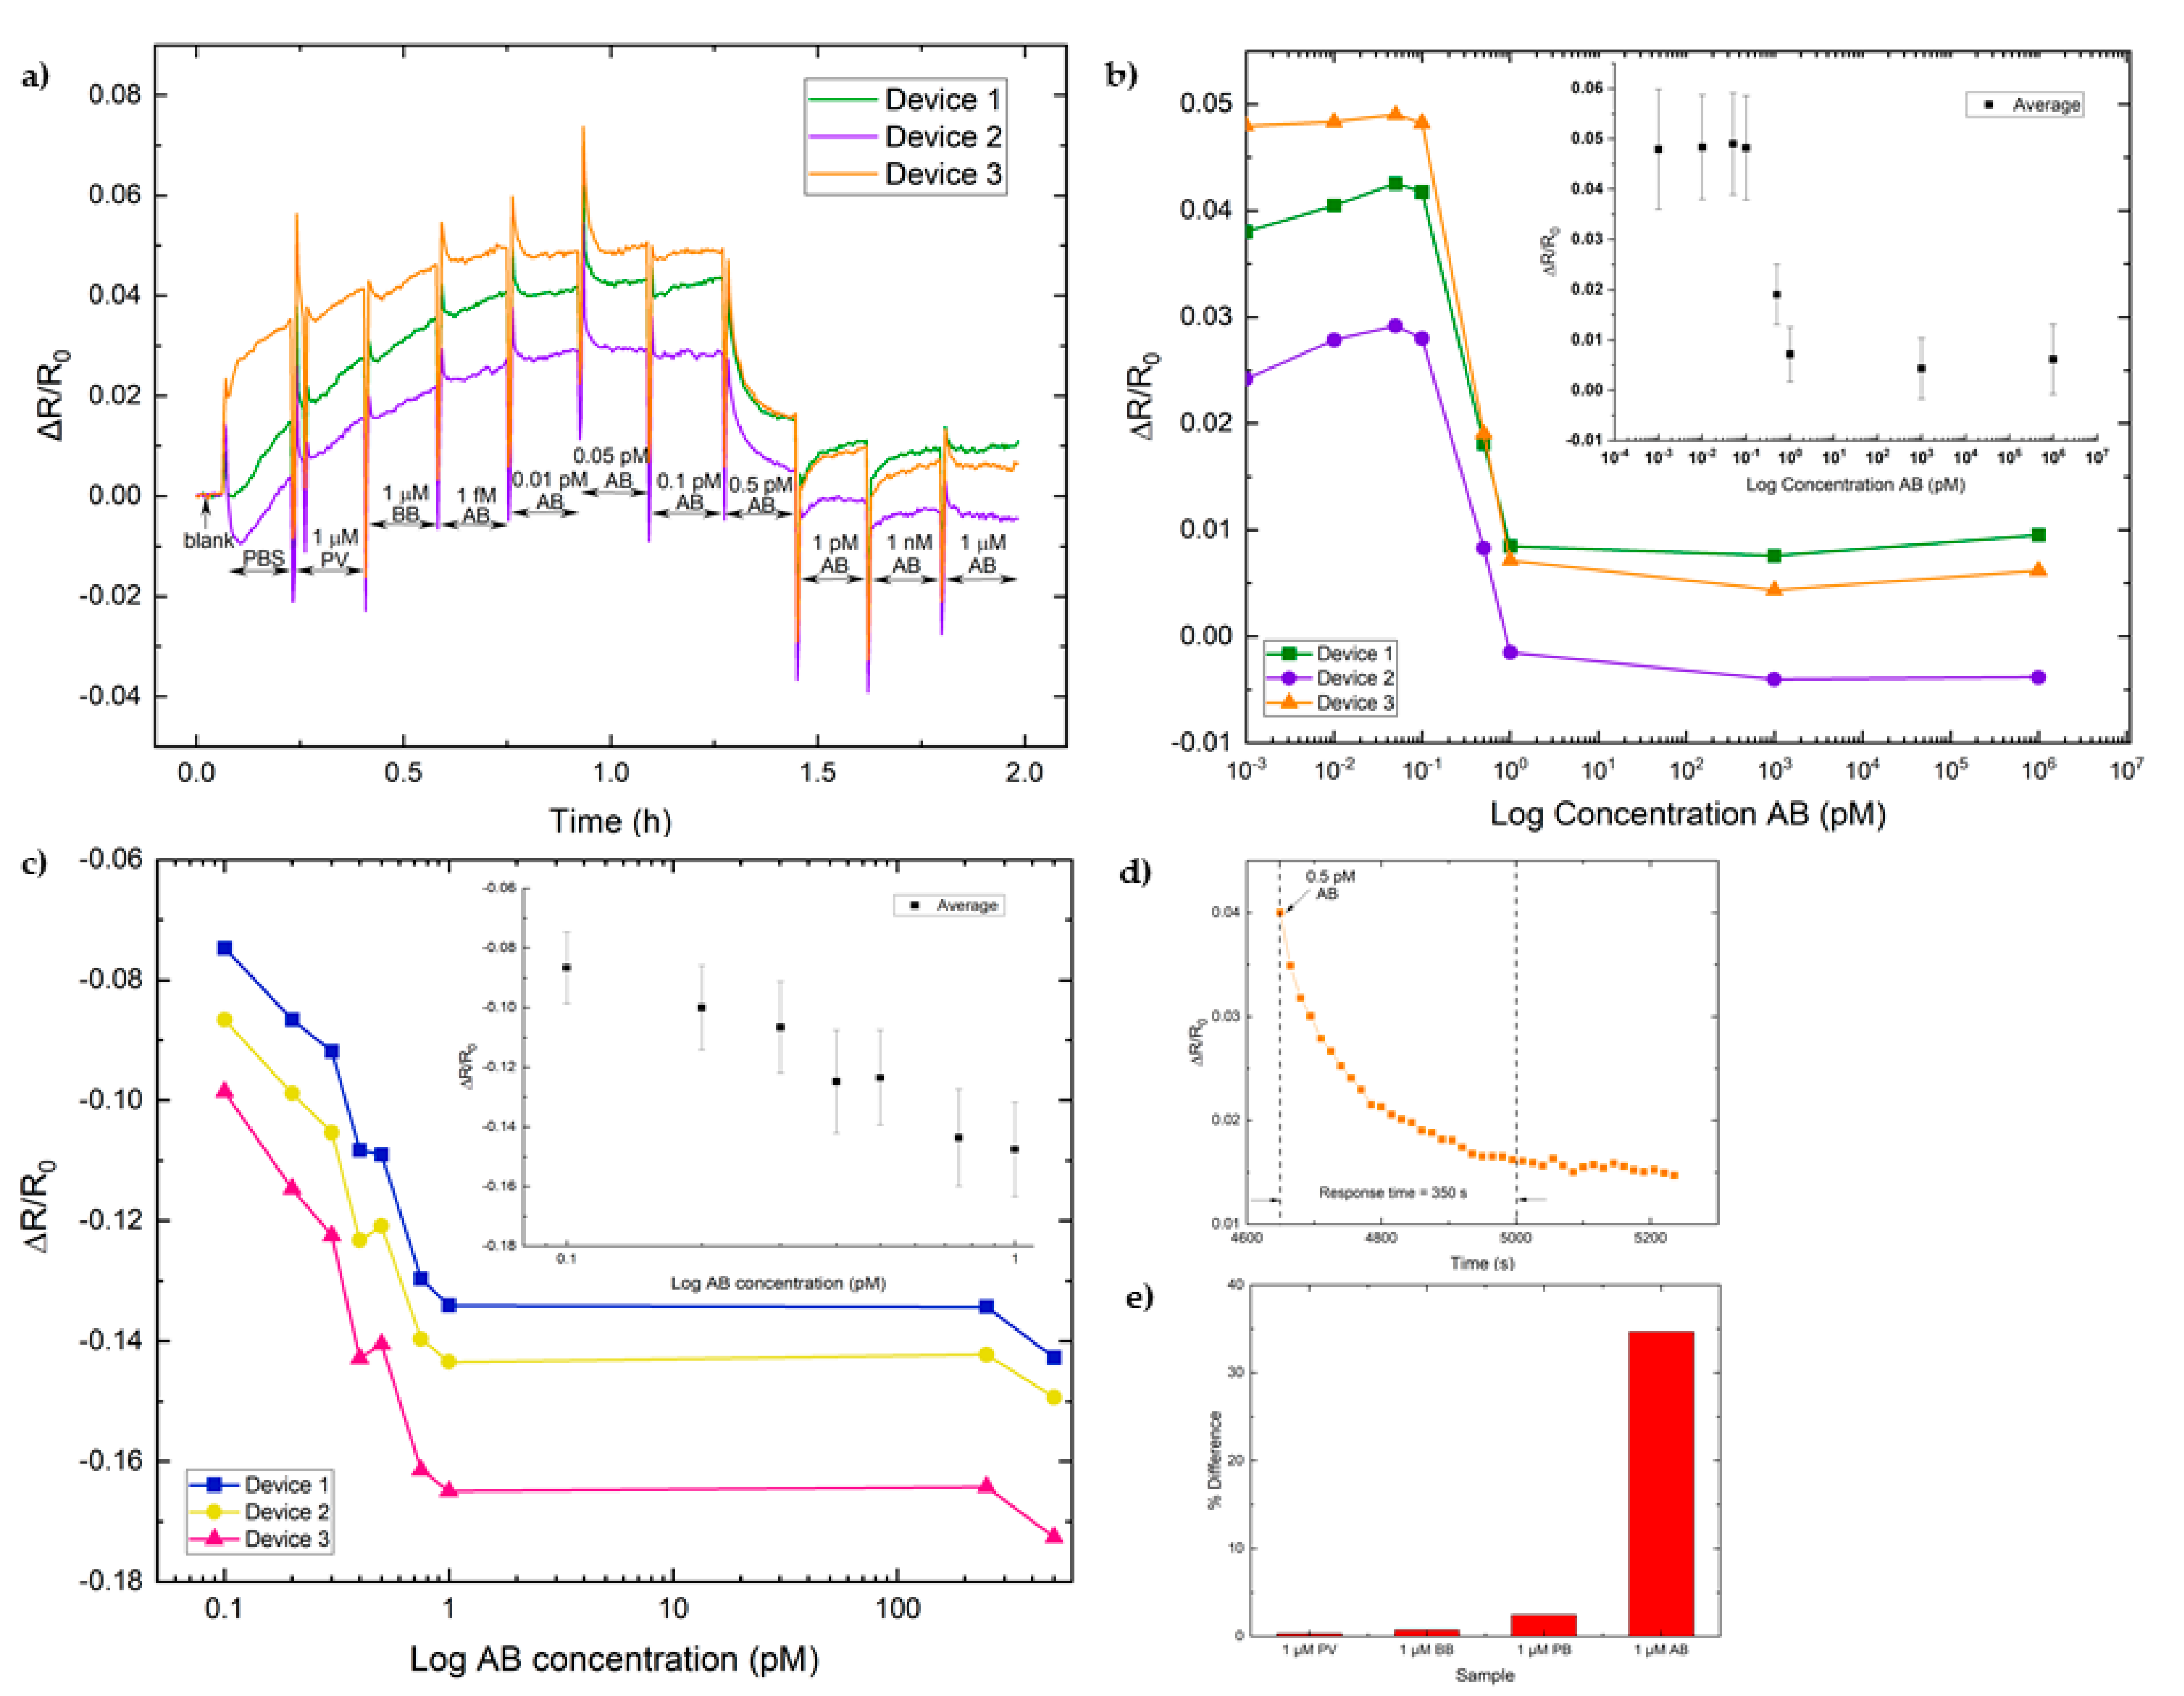
3.3.2. Detection of Odorants
4. Conclusions
Supplementary Materials
Author Contributions
Funding
Institutional Review Board Statement
Informed Consent Statement
Data Availability Statement
Acknowledgments
Conflicts of Interest
References
- Korsching, S.I. Olfactory Receptors, 2nd ed.; Elsevier: Amsterdam, The Netherlands, 2013; Volume 3. [Google Scholar]
- Zozulya, S.; Echeverri, F.; Nguyen, T. The human olfactory receptor repertoire. Genome Biol. 2001, 2, 1–12. [Google Scholar] [CrossRef]
- Park, J.; Lim, J.H.; Jin, H.J.; Namgung, S.; Lee, S.H.; Park, T.H.; Hong, S. A bioelectronic sensor based on canine olfactory nanovesicle–carbon nanotube hybrid structures for the fast assessment of food quality. Analyst 2012, 137, 3249–3254. [Google Scholar] [CrossRef] [PubMed]
- Marshall, B.; Warr, C.G.; De Bruyne, M. Detection of Volatile Indicators of Illicit Substances by the Olfactory Receptors of Drosophila melanogaster. Chem. Senses 2010, 35, 613–625. [Google Scholar] [CrossRef] [PubMed] [Green Version]
- Sarafoleanu, C.; Mella, C.; Georgescu, M.; Perederco, C. The importance of the olfactory sense in the human behavior and evolution. J. Med. Life 2009, 2, 196–198. [Google Scholar]
- Bushdid, C.; Magnasco, M.O.; Vosshall, L.B.; Keller, A.; Mixture, M. 1 Trillion Olfactory Stimuli. Science 2016, 343, 1370–1373. [Google Scholar] [CrossRef] [PubMed] [Green Version]
- Venthur, H.; Zhou, J.-J. Odorant Receptors and Odorant-Binding Proteins as Insect Pest Control Targets: A Comparative Analysis. Front. Physiol. 2018, 9, 1163. [Google Scholar] [CrossRef]
- Hopf, T.A.; Morinaga, S.; Ihara, S.; Touhara, K.; Marks, D.S.; Benton, R. Amino acid coevolution reveals three-dimensional structure and functional domains of insect odorant receptors. Nat. Commun. 2015, 6, 1–7. [Google Scholar] [CrossRef] [Green Version]
- Firestein, S. How the olfactory system makes sense of scents. Nat. Cell Biol. 2001, 413, 211–218. [Google Scholar] [CrossRef] [PubMed]
- Robin, S.; Tacher, S.; Rimbault, M.; Vaysse, A.; Dréano, S.; André, C.; Hitte, C.; Galibert, F. Genetic diversity of canine olfactory receptors. BMC Genom. 2009, 10, 21. [Google Scholar] [CrossRef] [Green Version]
- Malnic, B.; Hirono, J.; Sato, T.; Buck, L.B. Combinatorial Receptor Codes for Odors. Cell 1999, 96, 713–723. [Google Scholar] [CrossRef] [Green Version]
- Purves, D.; Augustine, G.; Fitzpatrick, D. Odorant receptors and olfactory coding. In Neuroscience, 2nd ed.; Sinauer Associates: Sunderland, MA, USA, 2001. [Google Scholar]
- Archunan, G. Odorant Binding Proteins: A key player in the sense of smell. Bioinformation 2018, 14, 36–37. [Google Scholar] [CrossRef] [Green Version]
- Gardner, J.; Bartlett, P.N. A brief history of electronic noses. Sens. Actuators B Chem. 1994, 18, 210–211. [Google Scholar] [CrossRef]
- Purves, D.; Augustine, G.; Fitzpatrick, D. The Transduction of Olfactory Signals. In Neuroscience, 2nd ed.; Sinauer Associates: Sunderland, MA, USA, 2001. [Google Scholar]
- Hou, Y.; Jaffrezic-Renault, N.; Martelet, C.; Zhang, A.; Minic-Vidic, J.; Gorojankina, T.; Persuy, M.-A.; Pajot-Augy, E.; Salesse, R.; Akimov, V.; et al. A novel detection strategy for odorant molecules based on controlled bioengineering of rat olfactory receptor I7. Biosens. Bioelectron. 2007, 22, 1550–1555. [Google Scholar] [CrossRef]
- Lee, S.H.; Jin, H.J.; Song, H.S.; Hong, S.; Park, T.H. Bioelectronic nose with high sensitivity and selectivity using chemically functionalized carbon nanotube combined with human olfactory receptor. J. Biotechnol. 2012, 157, 467–472. [Google Scholar] [CrossRef] [PubMed]
- Jin, H.J.; Lee, S.H.; Kim, T.H.; Park, J.; Song, H.S.; Park, T.H.; Hong, S. Nanovesicle-based bioelectronic nose platform mimicking human olfactory signal transduction. Biosens. Bioelectron. 2012, 35, 335–341. [Google Scholar] [CrossRef]
- Larisika, M.; Kotlowski, C.; Steininger, C.; Mastrogiacomo, R.; Pelosi, P.; Schütz, S.; Peteu, S.F.; Kleber, C.; Reiner-Rozman, C.; Nowak, C.; et al. Electronic Olfactory Sensor Based on A. mellifera Odorant-Binding Protein 14 on a Reduced Graphene Oxide Field-Effect Transistor. Angew. Chem. 2015, 54, 13245–13248. [Google Scholar] [CrossRef]
- Kotlowski, C.; Larisika, M.; Guerin, P.M.; Kleber, C.; Kröber, T.; Mastrogiacomo, R.; Nowak, C.; Pelosi, P.; Schütz, S.; Schwaighofer, A.; et al. Fine discrimination of volatile compounds by graphene-immobilized odorant-binding proteins. Sens. Actuators B Chem. 2018, 256, 564–572. [Google Scholar] [CrossRef]
- Kim, T.H.; Lee, S.H.; Lee, J.; Song, H.S.; Oh, E.H.; Park, T.H.; Hong, S. Single-Carbon-Atomic-Resolution Detection of Odorant Molecules using a Human Olfactory Receptor-based Bioelectronic Nose. Adv. Mater. 2009, 21, 91–94. [Google Scholar] [CrossRef]
- Liu, Q.; Wang, H.; Li, H.; Zhang, J.; Zhuang, S.; Zhang, F.; Hsia, K.J.; Wang, P. Impedance sensing and molecular modeling of an olfactory biosensor based on chemosensory proteins of honeybee. Biosens. Bioelectron. 2013, 40, 174–179. [Google Scholar] [CrossRef] [PubMed]
- Lu, Y.; Yao, Y.; Li, S.; Zhang, Q.; Liu, Q. Olfactory biosensor based on odorant-binding proteins of Bactrocera dorsalis with electrochemical impedance sensing for pest management. Sens. Rev. 2017, 37, 396–403. [Google Scholar] [CrossRef]
- Ravina, R.; Dalal, A.; Mohan, H.; Prasad, M.; Pundir, C. Detection methods for influenza A H1N1 virus with special reference to biosensors: A review. Biosci. Rep. 2020, 40, BSR20193852. [Google Scholar] [CrossRef] [Green Version]
- Lim, H.J.; Saha, T.; Tey, B.T.; Tan, W.S.; Wei, O.C. Quartz crystal microbalance-based biosensors as rapid diagnostic devices for infectious diseases. Biosens. Bioelectron. 2020, 168, 112513. [Google Scholar] [CrossRef]
- Wasilewski, T.; Szulczyński, B.; Wojciechowski, M.; Kamysz, W.; Gębicki, J. A Highly Selective Biosensor Based on Peptide Directly Derived from the HarmOBP7 Aldehyde Binding Site. Sensors 2019, 19, 4284. [Google Scholar] [CrossRef] [Green Version]
- Wasilewski, T.; Szulczyński, B.; Wojciechowski, M.; Kamysz, W.; Gębicki, J. Determination of long-chain aldehydes using a novel quartz crystal microbalance sensor based on a biomimetic peptide. Microchem. J. 2020, 154, 104509. [Google Scholar] [CrossRef]
- Yu, S.; Wang, Z.; Gao, L.; Zhang, B.; Wang, L.; Kong, J.; Li, L. A Highly Selective and Sensitive Peptide-Based Fluorescent Ratio Sensor for Ag+. J. Fluoresc. 2021, 31, 237–246. [Google Scholar] [CrossRef]
- Ahn, S.R.; An, J.H.; Lee, S.H.; Song, H.S.; Jang, J.; Park, T.H. Peptide hormone sensors using human hormone receptor-carrying nanovesicles and graphene FETs. Sci. Rep. 2020, 10, 388. [Google Scholar] [CrossRef] [PubMed]
- Marconcini, P.; Macucci, M. Approximate calculation of the potential profile in a graphene-based device. IET Circuits Devices Syst. 2015, 9, 30–38. [Google Scholar] [CrossRef] [Green Version]
- Singh, V.; Joung, D.; Zhai, L.; Das, S.; Khondaker, S.I.; Seal, S. Graphene based materials: Past, present and future. Prog. Mater. Sci. 2011, 56, 1178–1271. [Google Scholar] [CrossRef]
- Teixeira, S.; Conlan, R.; Guy, O.J.; Sales, M.G.F. Label-free human chorionic gonadotropin detection at picogram levels using oriented antibodies bound to graphene screen-printed electrodes. J. Mater. Chem. B 2014, 2, 1852–1865. [Google Scholar] [CrossRef] [Green Version]
- Walters, F.; Rozhko, S.; Buckley, D.; Ahmadi, E.D.; Ali, M.; Tehrani, Z.; Mitchell, J.J.; Burwell, G.; Liu, Y.; Kazakova, O.; et al. Real-time detection of hepatitis B surface antigen using a hybrid graphene-gold nanoparticle biosensor. 2D Mater. 2020, 7, 024009. [Google Scholar] [CrossRef]
- Walters, F.; Ali, M.M.; Burwell, G.; Rozhko, S.; Tehrani, Z.; Ahmadi, E.D.; Evans, J.E.; Abbasi, H.Y.; Bigham, R.; Mitchell, J.J.; et al. A Facile Method for the Non-Covalent Amine Functionalization of Carbon-Based Surfaces for Use in Biosensor Development. Nanomaterials 2020, 10, 1808. [Google Scholar] [CrossRef] [PubMed]
- Ferrari, A.C.; Basko, D.M. Raman spectroscopy as a versatile tool for studying the properties of graphene. Nat. Nanotechnol. 2013, 8, 235–246. [Google Scholar] [CrossRef] [PubMed] [Green Version]
- Lin-Vien, D.; Colthup, N.B.; Fateley, W.G.; Grasselli, J.G. Aromatic and Heteroaromatic Rings. In The Handbook of Infrared and Raman Characteristic Frequencies of Organic Molecules; Elsevier: Amsterdam, The Netherlands, 1991; pp. 277–306. [Google Scholar]
- Lin-Vien, D.; Colthup, N.B.; Fateley, W.G.; Grasselli, J.G. Compounds Containing the Carbonyl Group. In The Handbook of Infrared and Raman Characteristic Frequencies of Organic Molecules; Elsevier: Amsterdam, The Netherlands, 1991; pp. 117–154. [Google Scholar]
- Vincent, T.; Panchal, V.; Booth, T.; Power, S.R.; Jauho, A.; Antonov, V.; Kazakova, O. Probing the nanoscale origin of strain and doping in graphene-hBN heterostructures. 2D Mater. 2019, 6, 015022. [Google Scholar] [CrossRef] [Green Version]
- Casiraghi, C.; Pisana, S.; Novoselov, K.; Geim, A.K.; Ferrari, A.C. Raman fingerprint of charged impurities in graphene. Appl. Phys. Lett. 2007, 91, 233108. [Google Scholar] [CrossRef] [Green Version]
- Neumann, C.; Reichardt, S.; Venezuela, P.; Droegeler, M.; Banszerus, L.; Schmitz, M.; Watanabe, K.; Taniguchi, T.; Mauri, F.; Beschoten, B.; et al. Raman spectroscopy as probe of nanometre-scale strain variations in graphene. Nat. Commun. 2015, 6, 8429. [Google Scholar] [CrossRef] [PubMed] [Green Version]
- Sitsanidis, E.D.; Schirmer, J.; Lampinen, A.; Mentel, K.K.; Hiltunen, V.-M.; Ruokolainen, V.; Johansson, A.; Myllyperkiö, P.; Nissinen, M.; Pettersson, M. Tuning protein adsorption on graphene surfaces via laser-induced oxidation. Nanoscale Adv. 2021, 3, 2065–2074. [Google Scholar] [CrossRef]
- Pinto, H.; Markevich, A. Electronic and electrochemical doping of graphene by surface adsorbates. Beilstein J. Nanotechnol. 2014, 5, 1842–1848. [Google Scholar] [CrossRef] [Green Version]
- Yoon, H.; Lee, S.H.; Kwon, O.S.; Song, H.S.; Oh, E.H.; Park, T.H.; Jang, J. Polypyrrole Nanotubes Conjugated with Human Olfactory Receptors: High-Performance Transducers for FET-Type Bioelectronic Noses. Angew. Chem. 2009, 121, 2793–2796. [Google Scholar] [CrossRef]
- Neuhaus, E.M.; Mashukova, A.; Zhang, W.; Barbour, J.; Hatt, H. A Specific Heat Shock Protein Enhances the Expression of Mammalian Olfactory Receptor Proteins. Chem. Senses 2006, 31, 445–452. [Google Scholar] [CrossRef] [PubMed] [Green Version]


Publisher’s Note: MDPI stays neutral with regard to jurisdictional claims in published maps and institutional affiliations. |
© 2021 by the authors. Licensee MDPI, Basel, Switzerland. This article is an open access article distributed under the terms and conditions of the Creative Commons Attribution (CC BY) license (https://creativecommons.org/licenses/by/4.0/).
Share and Cite
Goodwin, D.M.; Walters, F.; Ali, M.M.; Daghigh Ahmadi, E.; Guy, O.J. Graphene Bioelectronic Nose for the Detection of Odorants with Human Olfactory Receptor 2AG1. Chemosensors 2021, 9, 174. https://0-doi-org.brum.beds.ac.uk/10.3390/chemosensors9070174
Goodwin DM, Walters F, Ali MM, Daghigh Ahmadi E, Guy OJ. Graphene Bioelectronic Nose for the Detection of Odorants with Human Olfactory Receptor 2AG1. Chemosensors. 2021; 9(7):174. https://0-doi-org.brum.beds.ac.uk/10.3390/chemosensors9070174
Chicago/Turabian StyleGoodwin, Danielle M., Ffion Walters, Muhammad Munem Ali, Ehsaneh Daghigh Ahmadi, and Owen J. Guy. 2021. "Graphene Bioelectronic Nose for the Detection of Odorants with Human Olfactory Receptor 2AG1" Chemosensors 9, no. 7: 174. https://0-doi-org.brum.beds.ac.uk/10.3390/chemosensors9070174