Article

Monitoring of Lactate in Interstitial Fluid, Saliva and Sweat by Electrochemical Biosensor: The Uncertainties of Biological Interpretation

by
Anna-Maria Spehar-Délèze
1,
Salzitsa Anastasova
1,2 and
Pankaj Vadgama
1,*
1
School of Engineering and Materials Science, Queen Mary University of London, Mile End Road, London E1 4NS, UK
2
Institute of Global Health Innovation, Imperial College London, South Kensington, London SW7 2BX, UK
*
Author to whom correspondence should be addressed.
Submission received: 30 May 2021 / Revised: 20 July 2021 / Accepted: 22 July 2021 / Published: 28 July 2021
(This article belongs to the Collection Electrochemical Biosensors for Medical Diagnosis)

Abstract

:
Lactate electrochemical biosensors were fabricated using Pediococcus sp lactate oxidase (E.C. 1.1.3.2), an external polyurethane membrane laminate diffusion barrier and an internal ionomeric polymer barrier (sulphonated polyether ether sulphone polyether sulphone, SPEES PES). In a needle embodiment, a Pt wire working electrode was retained within stainless steel tubing serving as pseudoreference. The construct gave linearity to at least 25 mM lactate with 0.17 nA/mM lactate sensitivity. A low permeability inner membrane was also unexpectedly able to increase linearity. Responses were oxygen dependent at pO2 < 70 mmHg, irrespective of the inclusion of an external diffusion barrier membrane. Subcutaneous tissue was monitored in Sprague Dawley rats, and saliva and sweat during exercise in human subjects. The tissue sensors registered no response to intravenous Na lactate, indicating a blood-tissue lactate barrier. Salivary lactate allowed tracking of blood lactate during exercise, but lactate levels were substantially lower than those in blood (0–3.5 mM vs. 1.6–12.1 mM), with variable degrees of lactate partitioning from blood, evident both between subjects and at different exercise time points. Sweat lactate during exercise measured up to 23 mM but showed highly inconsistent change as exercise progressed. We conclude that neither tissue interstitial fluid nor sweat are usable as surrogates for blood lactate, and that major reappraisal of lactate sensor use is indicated for any extravascular monitoring strategy for lactate.

1. Introduction

Lactate is a byproduct of glycolysis and accumulates when there is either an absolute or relative lack of tissue oxygen [1]. Accordingly, blood lactate has proved to be important for assessing the severity of the clinical shock state. Whilst arterial pO2 provides a measure of the adequacy of central ventilatory and cardiac function [2], lactate serves as the ultimate marker of oxygen utilisation. It serves as the benchmark indicator of a shift in energy utilization via the Krebs citric acid cycle and mitochondrial electron transport to that limited to the glycolytic pathway [3]. The latter provides for urgent short term energy needs, without the requirement for oxygen. However, it comes at the high price of producing only two molecules of ATP (adenosine triphosphate) per glucose, compared with the thirty six derived from aerobic respiration. A further disadvantage is the accumulation of acidic lactic acid which lowers blood pH (acidosis) [4]. Even a minor pH change outside of normal blood pH (7.35–7.45) compromises the body’s metabolic processes, including critical ones in major organs; the heart, for example, manifests a reduced contractility [5]. Lactate is not toxic per se and is in any case produced as a part of normal glycolysis. However, it lies just a single redox equilibrium step from pyruvate at the end of the glycolytic pathway [6], and so is rapidly responsive to the oxygenation state.
Close lactate monitoring has the advantage of identifying metabolic trends earlier, e.g., in shock, circulatory failure and hypoxia. It can also better identify the ‘golden hour’ following traumatic shock when resuscitation has its best chance of success. A further important variant is septic shock, and though more insidious, manifests elevated lactate levels equally justifying close monitoring [7]. In sports medicine, extreme exercise leads to a relative hypoxia, and here also lactate monitoring can have added value.
Given the possibility of rapid dynamic change in lactate in extreme metabolic states, a strong argument can be made for any technology capable of providing a continuous readout of lactate or at least rapid intermittent measurement. As with glucose [8,9,10,11,12], subcutaneous tissue lactate monitoring offers a relatively safe means of achieving real time in vivo monitoring. Tissue has the advantage over blood of avoiding the dissemination of coagulation products and infective agents, since any such adverse outcomes remain localized to the implant site. In contrast to glucose, however, there is limited literature on tissue lactate monitoring using sensors. One possible reason for this is the lower stability of the required lactate oxidase resulting in less stable devices with regard to storage, use or sterilization. We previously used a non-sterilized lactate sensor for saliva measurement during exercise [13]. This demonstrated a mean baseline of 0.3 mM lactate, which is below the blood lactate reference range, but in line with expectations demonstrated consistent elevation during exercise. Saliva thus has potential monitoring value and warrants further consideration as an alternative sampling route.
The ionic nature of lactate makes it an inherently different type of solute to glucose with regard to intercompartment exchange. At the basic cell membrane level, of course, quite different transporters are involved, and these lead to both different exchange equilibria and dynamics. This is evident even for the red cell, where glucose partitions equally between plasma and red cell water, but lactate distribution is unequal with high inter-sample variability [14]. The cell to plasma concentration difference, moreover, is unrelated to absolute lactate levels. For clinical evaluation, this raises the question of how hyperlactatemia should be assessed, e.g., whether measurement should use whole blood, plasma or only the red cell mass. In rapidly changing metabolic situations, plasma lactate is likely to be more acutely responsive than red cell lactate, but transcellular exchange dynamics subsequent to that are an unknown.
With regard to tissue, microdialysis has been the mainstay of lactate monitoring. It has consistently demonstrated high tissue correlation with blood. However, the degree to which this is seen varies with different literature reports. The data, overall, suggests that the dynamic correlation is possibly not as close as that for glucose [15,16], though a very high linkage is also reported [17]. A microdialysis probe in the confines of tissue will inevitably produce lower analyte recovery than in a calibrant solution, so absolute tissue levels are difficult to assess by this means. The standard pragmatic solution has been to calibrate against blood in vivo. This strategy is also used with implanted glucose sensors, as here also diffusional constraints in tissue contribute to underestimated measurement. With oxidase-based enzyme electrodes, some of this may also be due to oxygen co-substrate limitation. In a recent study on brain lactate, a sensor incorporating a catalyst for in situ oxygen regeneration from the H2O2 oxidase enzyme product helped to mitigate this effect [18].
Tissue microdialysis has found either minor or no time lags [19] with respect to dynamic lactate changes in blood. An alternative sampling approach reaches a different conclusion. Here, a push-pull cannula was used to extract interstitial fluid from subcutaneous tissue, with accuracy achieved by referencing recovery against that of electrolyte [20]. This demonstrated that peak lactate was lower than for blood, but also with a significant time lag. By contrast, there was a close match under baseline conditions. This sampling method had good concentration resolution capacity and was able, for example, to identify higher lactate in subcutaneous adipose tissue [21], a net lactate generator. Overall, it seems that the particular physiological circumstance of a tissue measurement needs to be considered when any assessment of a monitoring technique is undertaken.
Recently in a pig model, a lactate oxidase-based sensor, protected by a thromboresistant NO releasing membrane [22], was used to monitor tissue lactate during intravenous lactate infusion. Various confounding elements were evident; thus, tissue lactate was lower than that of blood, lactate infusion generated substantially lower peaks than in blood and measured levels at different tissue locations were different. This blood-tissue divergence was hypothesized as variously being due to sensor fouling, low tissue lactate diffusivity and anesthesia induced circulatory changes. All are important practical considerations, though anesthesia is an unlikely factor, as it has been found to have no effect on skin circulation [23]. These observations are a departure from an early report in the rat showing correlation with plasma [24], including sensor responsiveness down to 10 mmHg pO2. Furthermore, in the dog a close match with blood was seen during exercise [25]. Here, however, return to baseline tissue lactate appeared to be delayed compared with blood. A further, more complex, relationship was seen in a further rat study [26] where the rise in tissue lactate following intravenous infusion preceded that in blood but lagged behind blood during the subsequent fall.
In our own study of haemorrhagic circulatory shock in the pig, and later in the rat [27], we also found tissue sensor locational differences in lactate level (interscapular vs. lower back) with underestimation of peak blood levels. This divergence was more marked in severe shock, and with close correlation under baseline conditions. Our study used slow (1 µL/min) fluid flow delivery to the implant site to hydrate local tissue. This was an adaptation of earlier microflow use for glucose monitoring designed to hydrate tissue for augmented diffusion and an improved glucose sensor response [10].
The present study aimed to revisit tissue lactate dynamics in the rat without microflow. The needle sensor design was similar to that used previously [10,27]. We further extended monitoring to sweat and saliva in human subjects undertaking exercise as non-blood sampling alternatives. The tissue results indicated a substantial blood to tissue barrier, at least in the context of the experimental model we used, and one not previously evidenced for glucose. For the first time also, lactate sensor pO2 dependence was characterized, and we demonstrated an unusual effect on linearity through use of a lower permeability inner membrane. We further considered two vs. three electrode options and compared stainless steel with Ag/AgCl as pseudoreference. Sweat and saliva monitoring indicated that meaningful results can only be obtained with saliva and that sweat changes cannot be considered representative of blood, precluding its use in tracking hyperlactatemia.
Electrodes were made using lactate oxidase (LOx) with H2O2 measurement at +0.65 V, vs. a stainless steel pseudoreference for the needle sensors [28] and vs. Ag/AgCl for the planar constructs:
O 2 + lactate   = pyruvate   + H 2 O 2
H 2 O 2 = O 2 + 2 H + + 2 e
The levels of lactate generated in blood, respectively, in the rats and in the human subjects during human saliva monitoring in the present study are shown in Table 1.

2. Materials and Methods

2.1. Reagents and Materials

Lactate oxidase (EC 1.1.3.2) (Pediococcus sp, Aerococcus viridans) was obtained from Sigma-Aldrich, Dorset UK and microbial enzyme (E. Coli expressed Lactococcus lactis subsp. Cremoris enzyme) from Toyobo, Japan. Sodium and lithium lactate, glutaraldehyde (25% v/v aqueous solution), bovine serum albumin (BSA), phenol red and 4-aminophenol were also purchased from Sigma-Aldrich. Tetrahydrofuran (THF), dimethylsulphoxide (DMSO), bovine serum, Na2HPO4, NaH2PO4, NaCl and NaOH were obtained from BDH, Dorset, U.K. All solutions were prepared in deionized water. Ultrapure (99%) oxygen and nitrogen were purchased from BOC Group plc. The outer polyurethane barrier layer used a moisture curing proprietary prepolymer; Trixene SC7602 (kind gift from Baxenden Chemicals Ltd., Accrington, UK). Sulphonated polyether ether sulphone polyether sulphone (SPEES PES) anionic copolymer was a kind gift from ICI Colloids and Polymer Group, Runcorn, UK. Superglue (3211) was from Loctite, Herts, UK and conducting epoxy from RS Components (UK). Stainless steel tubes (with inner diameter 0.38 mm and outer diameter 0.50 mm) and polyester insulated Pt wire (0.125 mm diameter) were obtained from Goodfellow, Cambridge, UK. Silver UHV deposition on to stainless steel was undertaken by Mantis Deposition Ltd., Thame, UK.

2.2. Preparation and Use of Electrodes

Fabrication of the lactate electrodes has been described previously [27]. Needle constructs were used for the rat studies as for in vitro saliva measurement. Even though working electrode diameter was 125 µm, but these devices should not be considered to be microelectrodes given the large size (0.5 mm o.d.) of the integral needle pseudoreference. Sweat monitoring used planar electrodes with the same applied membranes coatings as for the needle electrodes in the rat study. For fabrication, the Pt working electrode was first held within a stainless-steel tube by means of epoxy glue. Prior to use, the Pt surface was cleaned electrochemically in 50 mM sulfuric acid by sweeping potential between −0.4 and +1.5 V vs. Ag/AgCl at 100 mV/s in N2 purged solution. A PC controlled PalmSens potentiostat (Palm Instruments, Houten, the Netherlands) was used with associated electrochemistry software (PS Trace) for all studies, except for rat tissue lactate monitoring where an Apollo 4000 Free Radical Analyser was used (World Precision Instruments, Hitchin, UK).
Polymer coatings were deposited on the insulated platinum working electrode by dip coating from solution as either the polymer or pre-polymer. To create the SPEES PES inner barrier layer for rejecting electrochemical interferents, electrodes were dip coated in 2 or 10% w/v DMSO solution of polymer and left overnight in a vacuum oven at 40 °C. Enzyme was then immobilized on the tip by dip coating in a mixture comprising 1 mg LOx:20 mg BSA/60 uL then mixed in a 2:1 volume ratio with 1% v/v glutaraldehyde solution made up in phosphate buffer at pH 7.4. The mixture was allowed to crosslink for 10 min, rinsed thoroughly in PBS to remove unreacted glutaraldehyde and dried at room temperature for 2 h. After drying, the electrode tip was sequentially dip coated in polyurethane outer membrane solutions using an increasing concentration series of 20%, 30%, 40% and 50% (v/v) prepolymer. The pre-polymer (Trixene) used for this was used as received and dissolved in THF. 30 min intervals were used between deposition to allow the pre-polymer to complete polymerization, though likely cure time was much shorter.
In the case of the needle sensors for saliva measurements, it was anticipated that lactate levels would be lower than in blood based on our earlier study [13]. Here we had found that a permselective electropolymerized inner barrier layer of poly(phenol red)/poly(4-aminophenol) instead of SPEES PES gave us greater sensitivity by a factor of two. So, in this study of blood comparison the electropolymerized films were used again instead of SPEES PES. The films were self-limiting and were formed chronoamperometrically at +0.85 V vs. Ag/AgCl.
Sensor measurements were undertaken at room temperature (23 ± 1 °C), and in all cases in phosphate buffer saline (PBS) pH 7.4. For sweat monitoring planar enzyme lactate sensors were made using the same coating formulations, but on a planar ceramic base electrode of 3 mm diameter screen printed platinum as working electrode (Type 550, Dropsens, Oviedo, Spain) with Ag as counter and reference. The sensors were positioned within a small well on the ceramic platform. Direct contact with skin, including mechanical pressure, was avoided through this, and ready, direct flow of sweat was achieved over the sensing surface with subsequent unimpeded flow to the device edge.

2.3. Physiological Measurement

Animal monitoring employed subcutaneously implanted lactate needles in Sprague Dawley rats (300–350 g) using a protocol licensed by with the UK Home Office. Sensors were sterilized in 70% ethanol for 1 h, washed for 1 h in ultrapure water and packed in sterile plastic bags (Westfield Medical, Midsomer Norton, UK) and opened just prior implantation. Rats were anesthetized by isoflurane inhalation with 2 mL/min oxygen. Following full anesthesia, the skin was locally shaven in order to simplify subcutaneous needle implantation and to facilitate subsequent needle fixation. Insertion angle was at an angle of approximately 40° with respect to the skin surface. Needles were 3 cm in length with tissue insertion length ~1.5 cm. Blood lactate measurement was carried out on venous blood in the rats and on capillary blood in the human subjects during the saliva studies using a Lactate Pro hand-held meter (Arkray Inc., Kyoto, Japan).
Permission for human studies was granted by the National Research Ethics Service, South East London REC3 (Ref 10/H0808/124), and the work was conducted in accordance with the guidelines of the Declaration of Helsinki. Informed consent was obtained from the subjects involved in the study. Subjects undertook on the spot running exercise described previously [13] comprising 20 min running on a treadmill (Woodway GmbH, Weil am Rhein, Germany) with a series of 5 min intensity increments up to 85–90% maximum heart rate. Cycling and, in one case, a separate running exercise was also used. For sweat monitoring the planar lactate sensor was strapped to the upper arm. An electrode current output was generated once an adequate output of sweat commenced. For tracking saliva, stimulated saliva was collected at regular intervals and saved in plastic vials for later measurement by needle sensor.

3. Results and Discussion

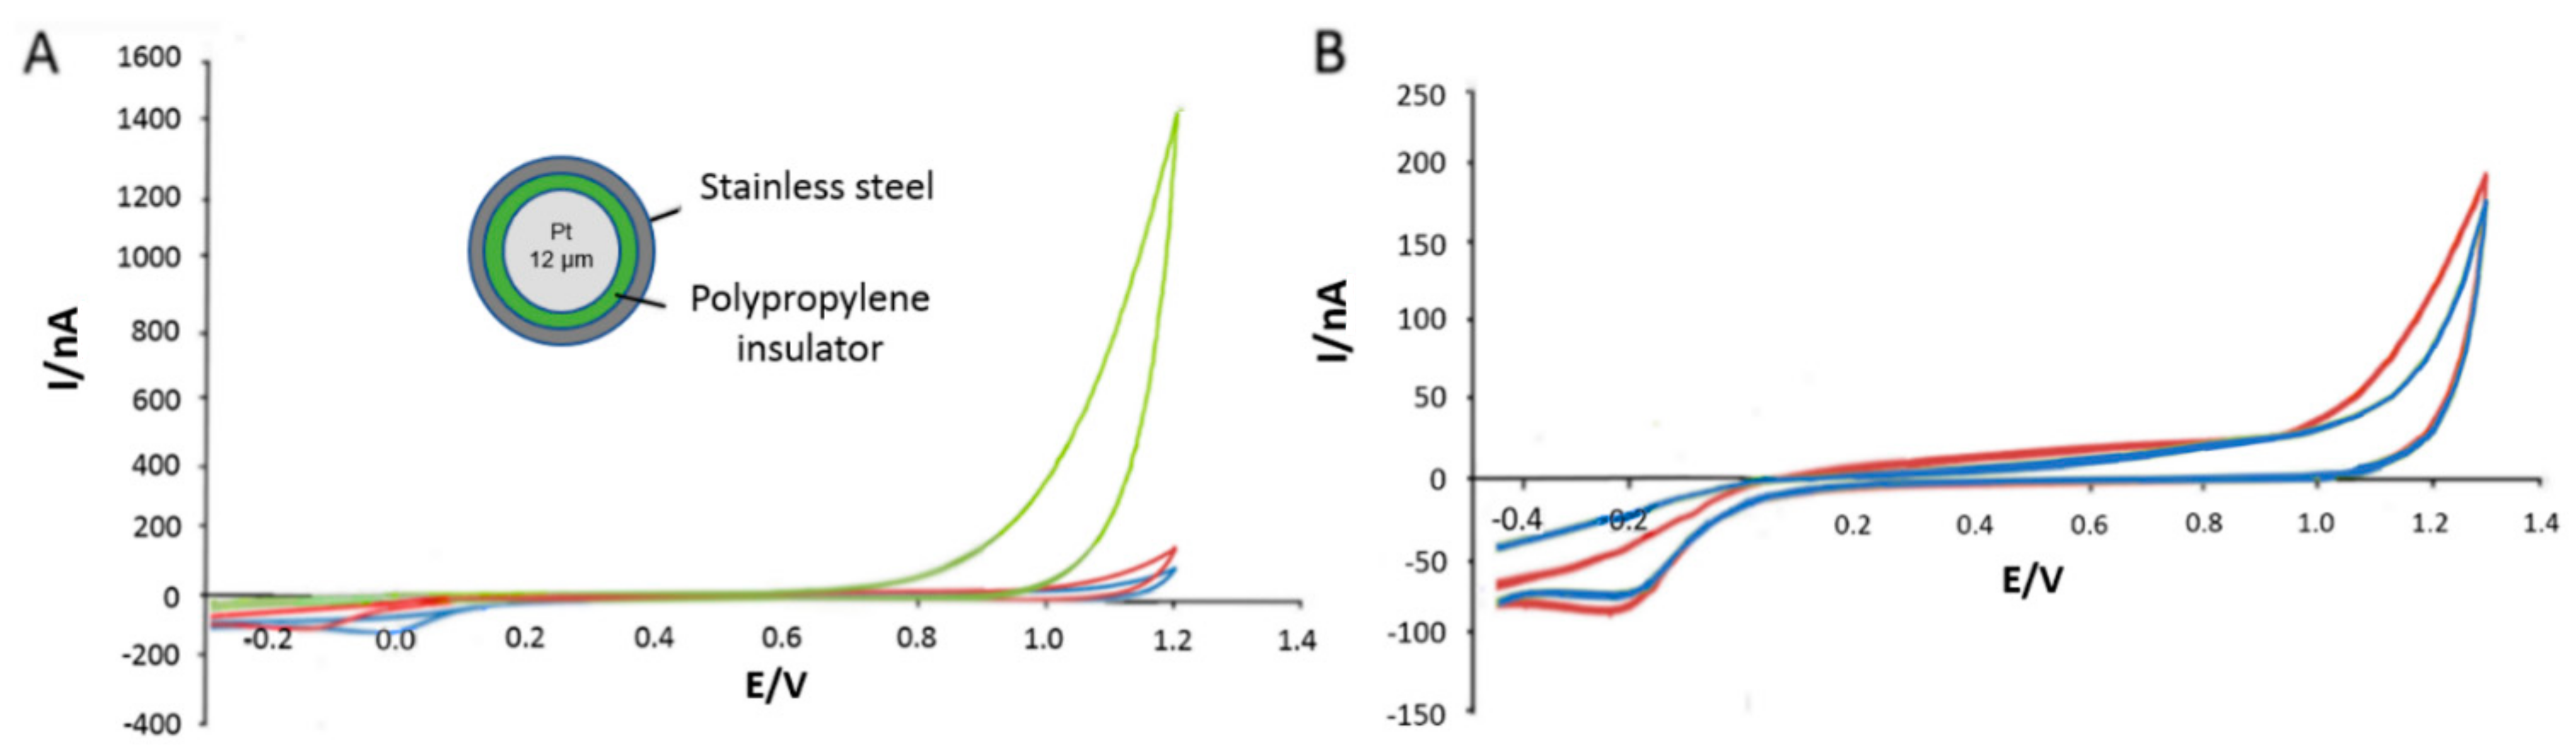
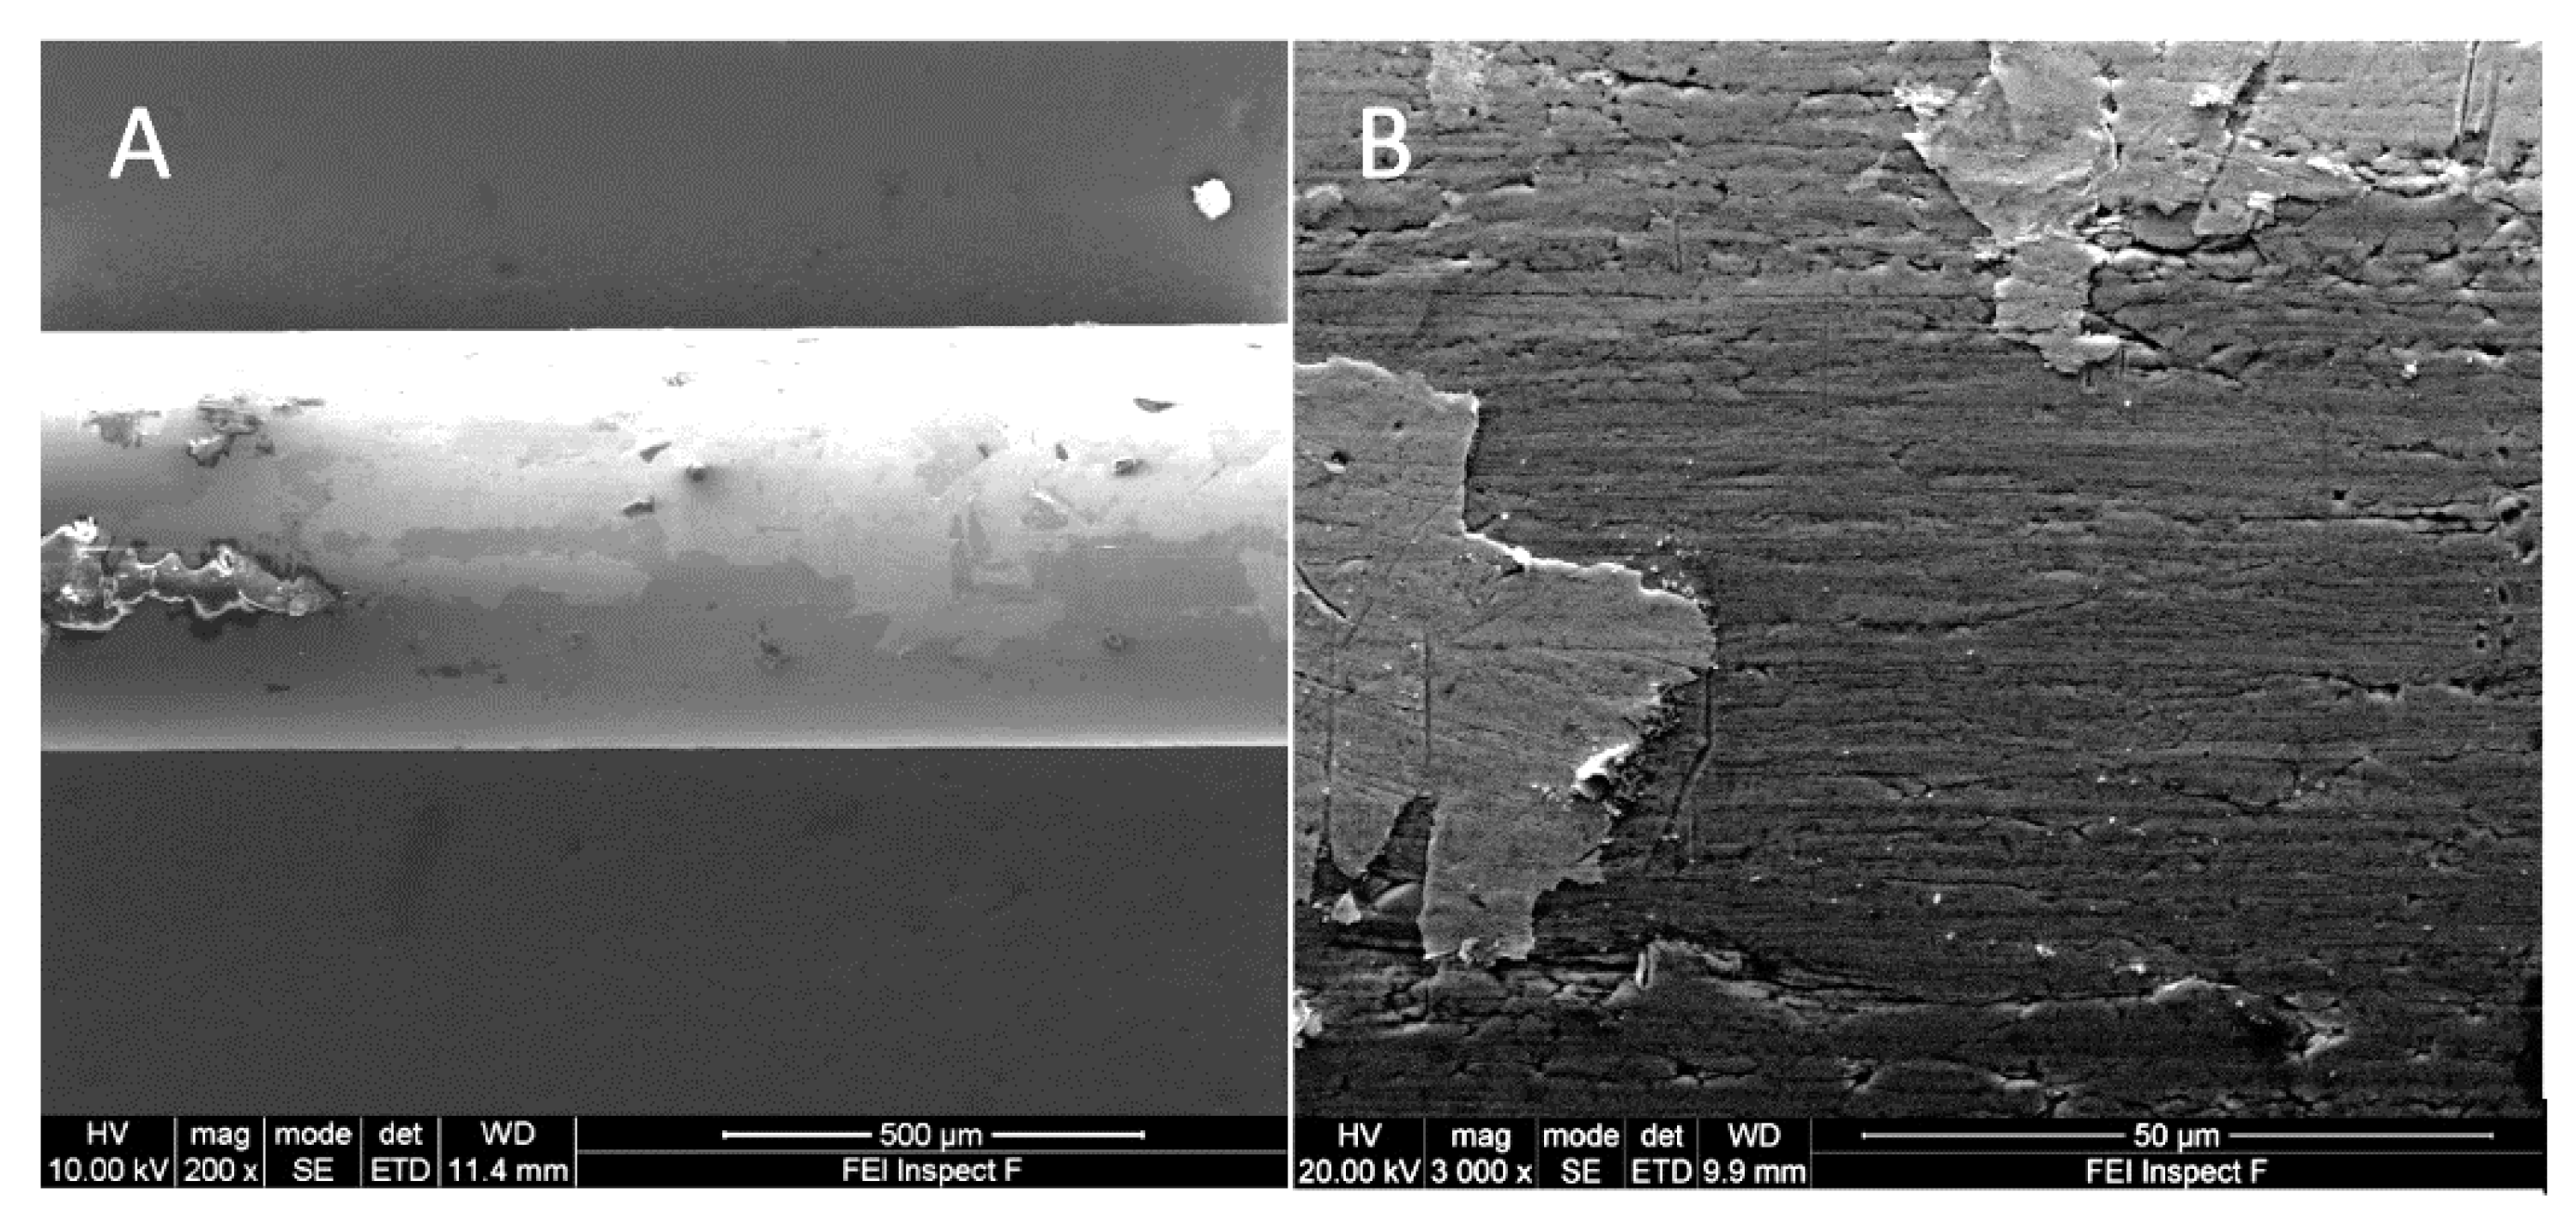
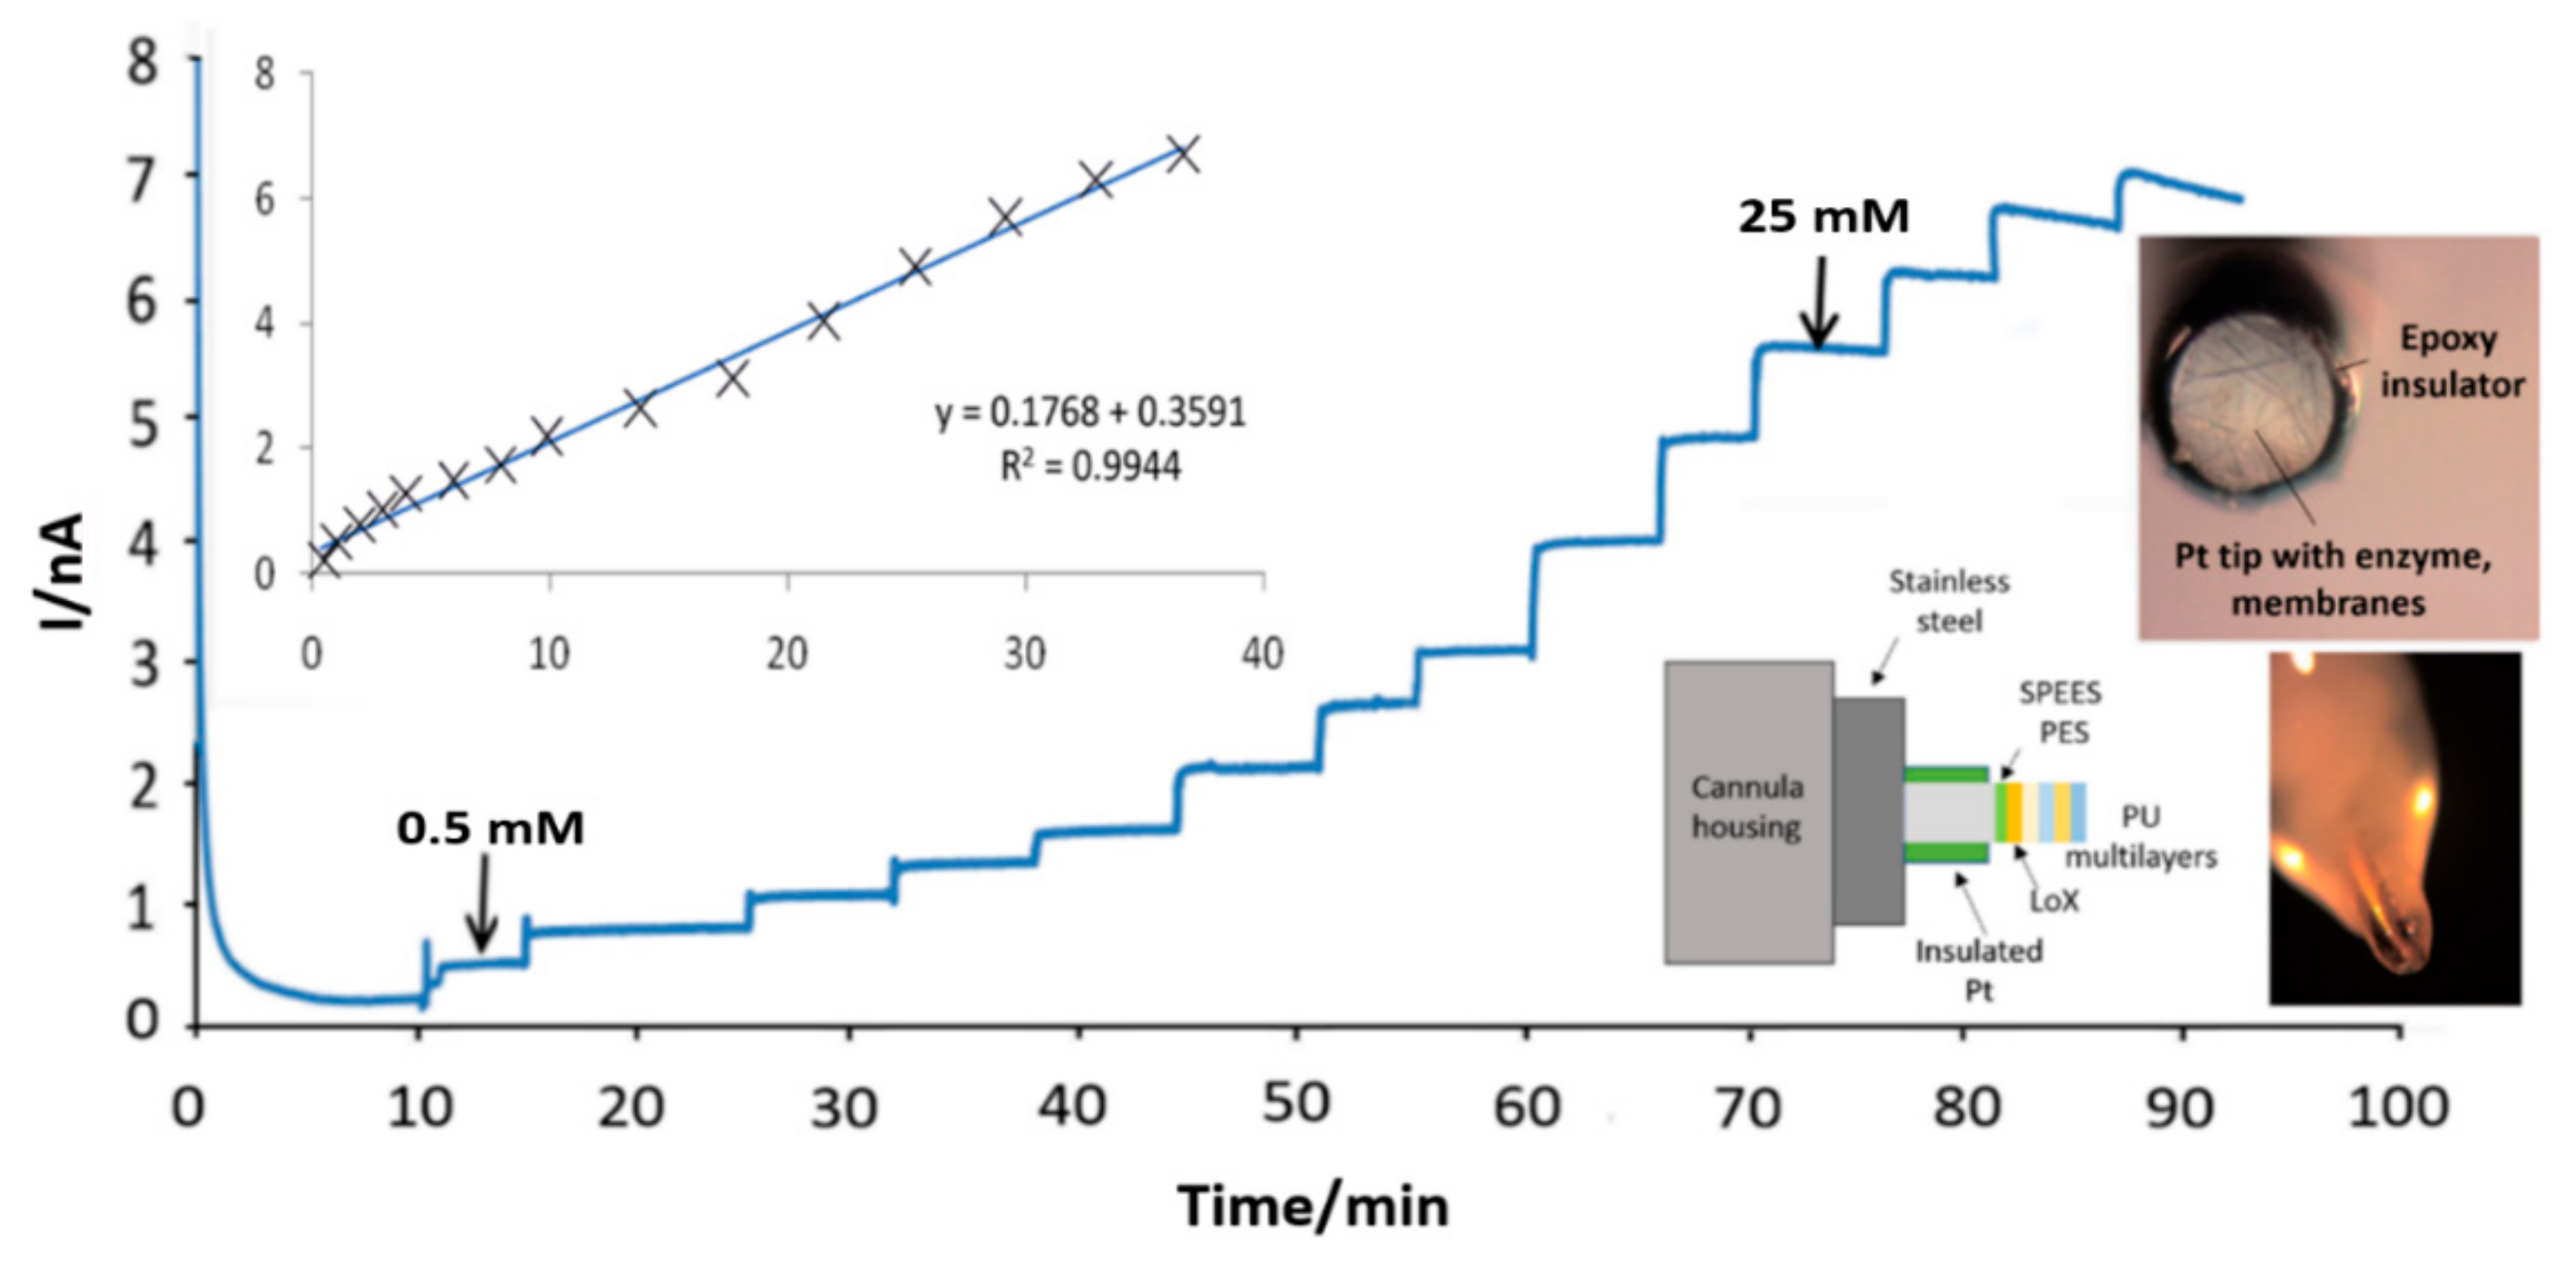
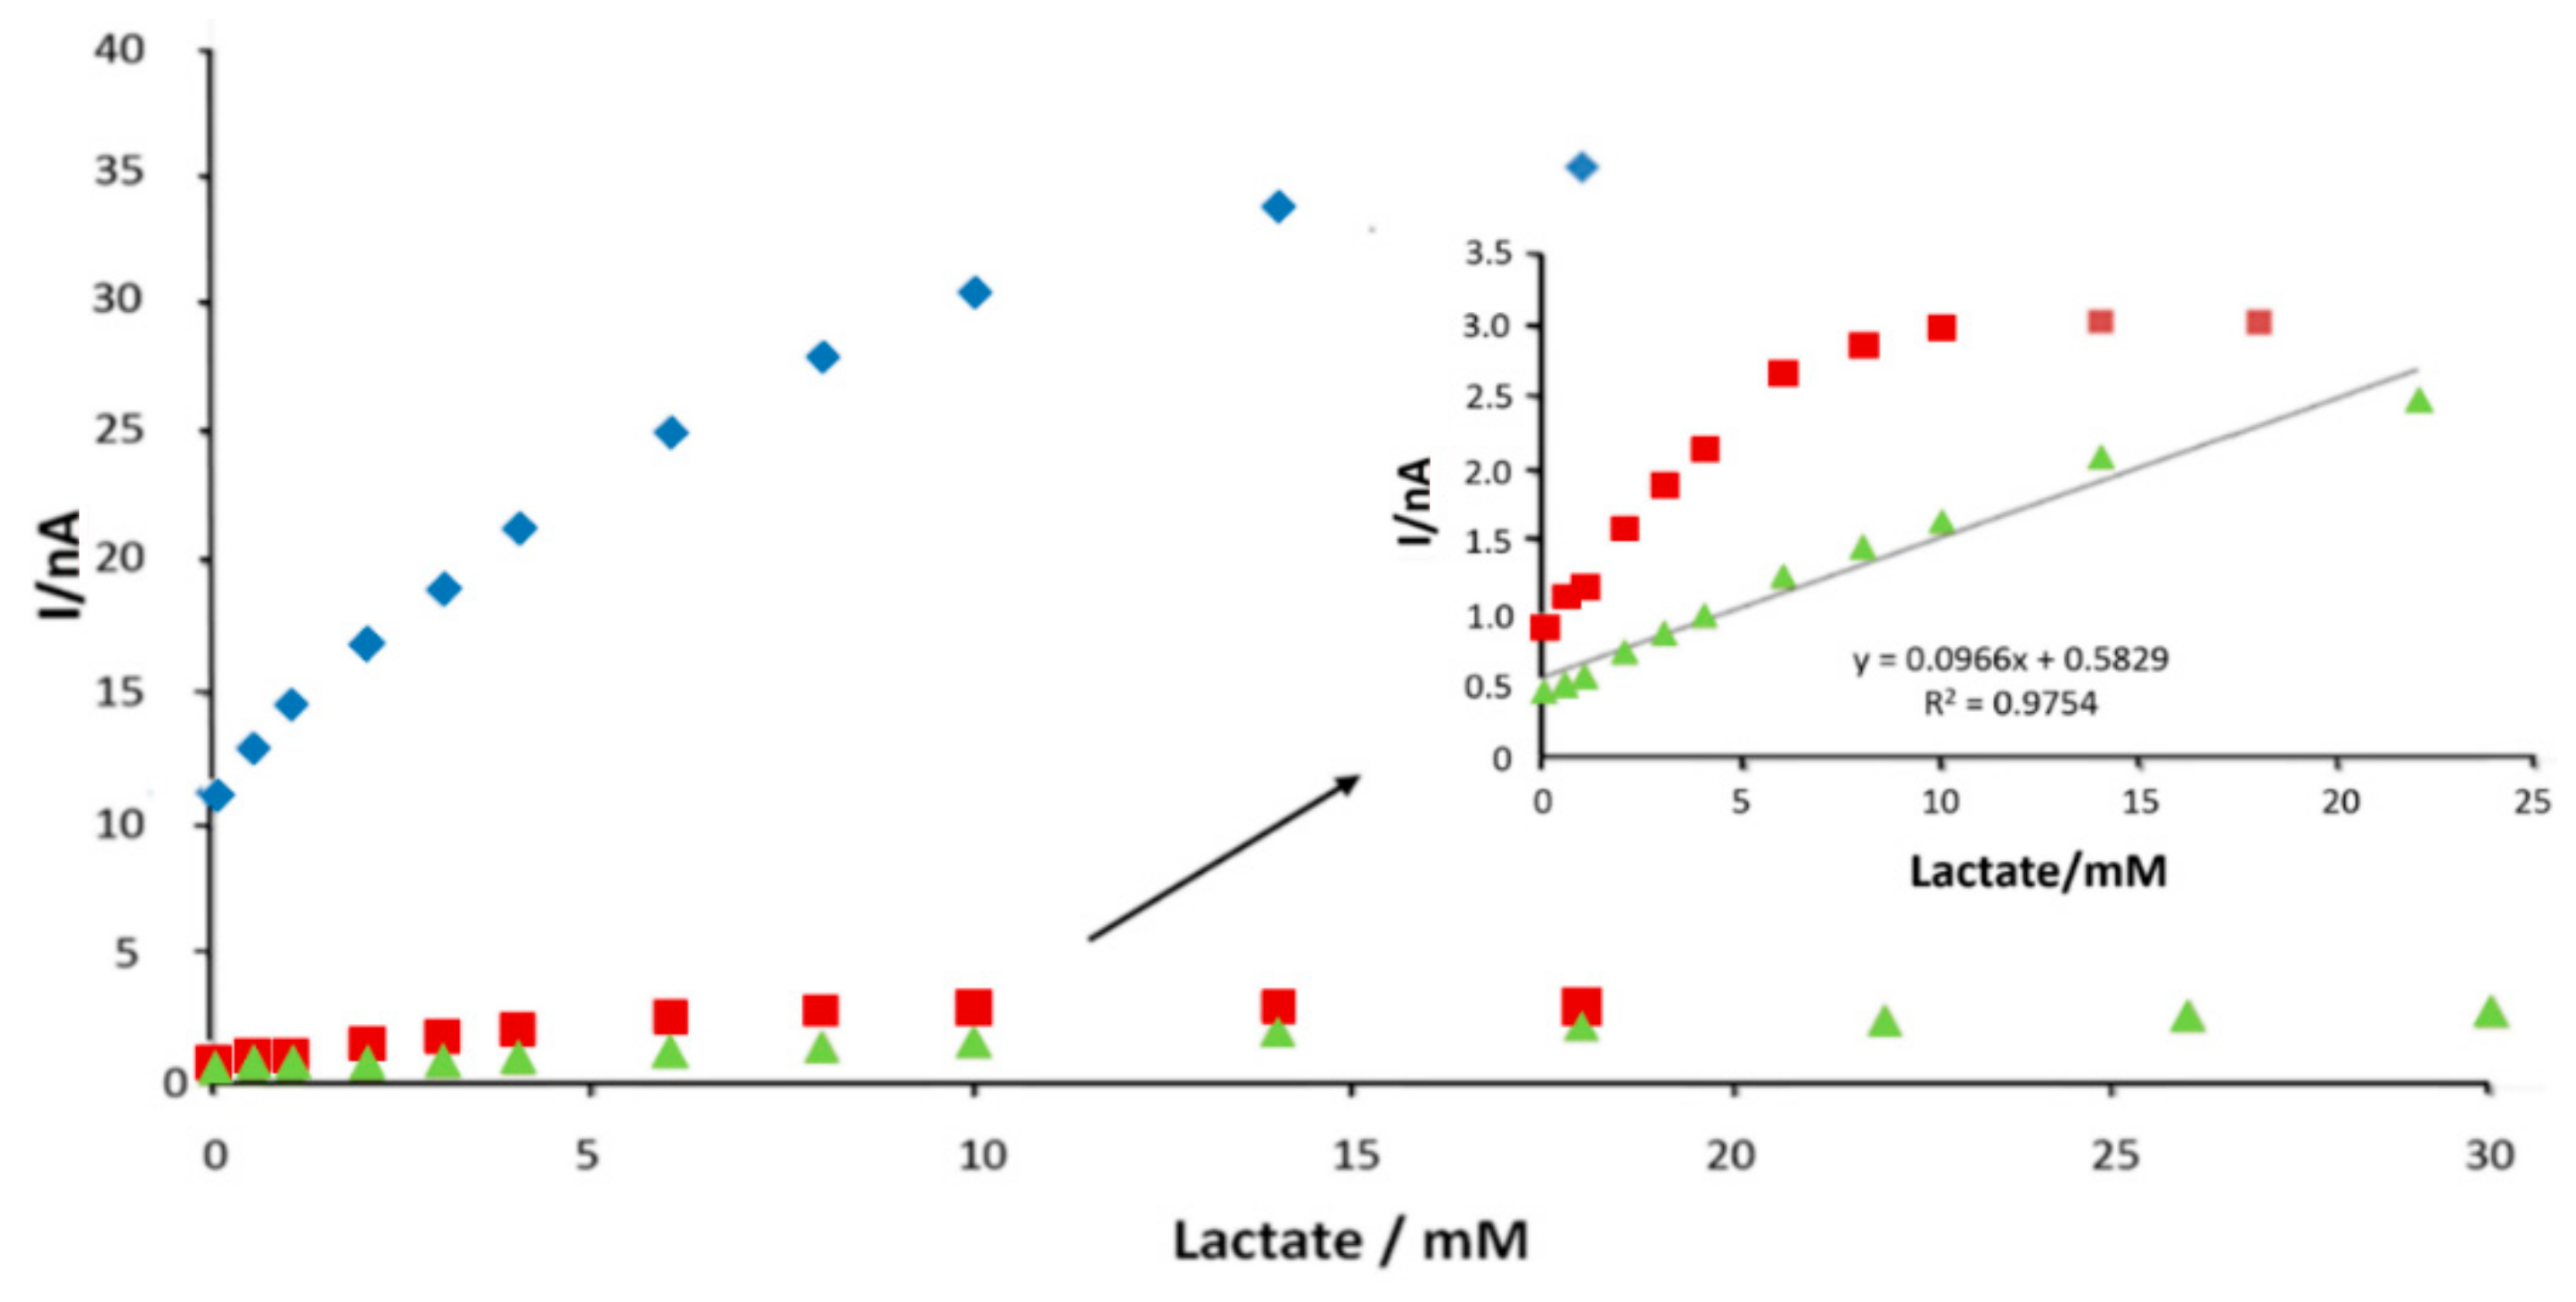
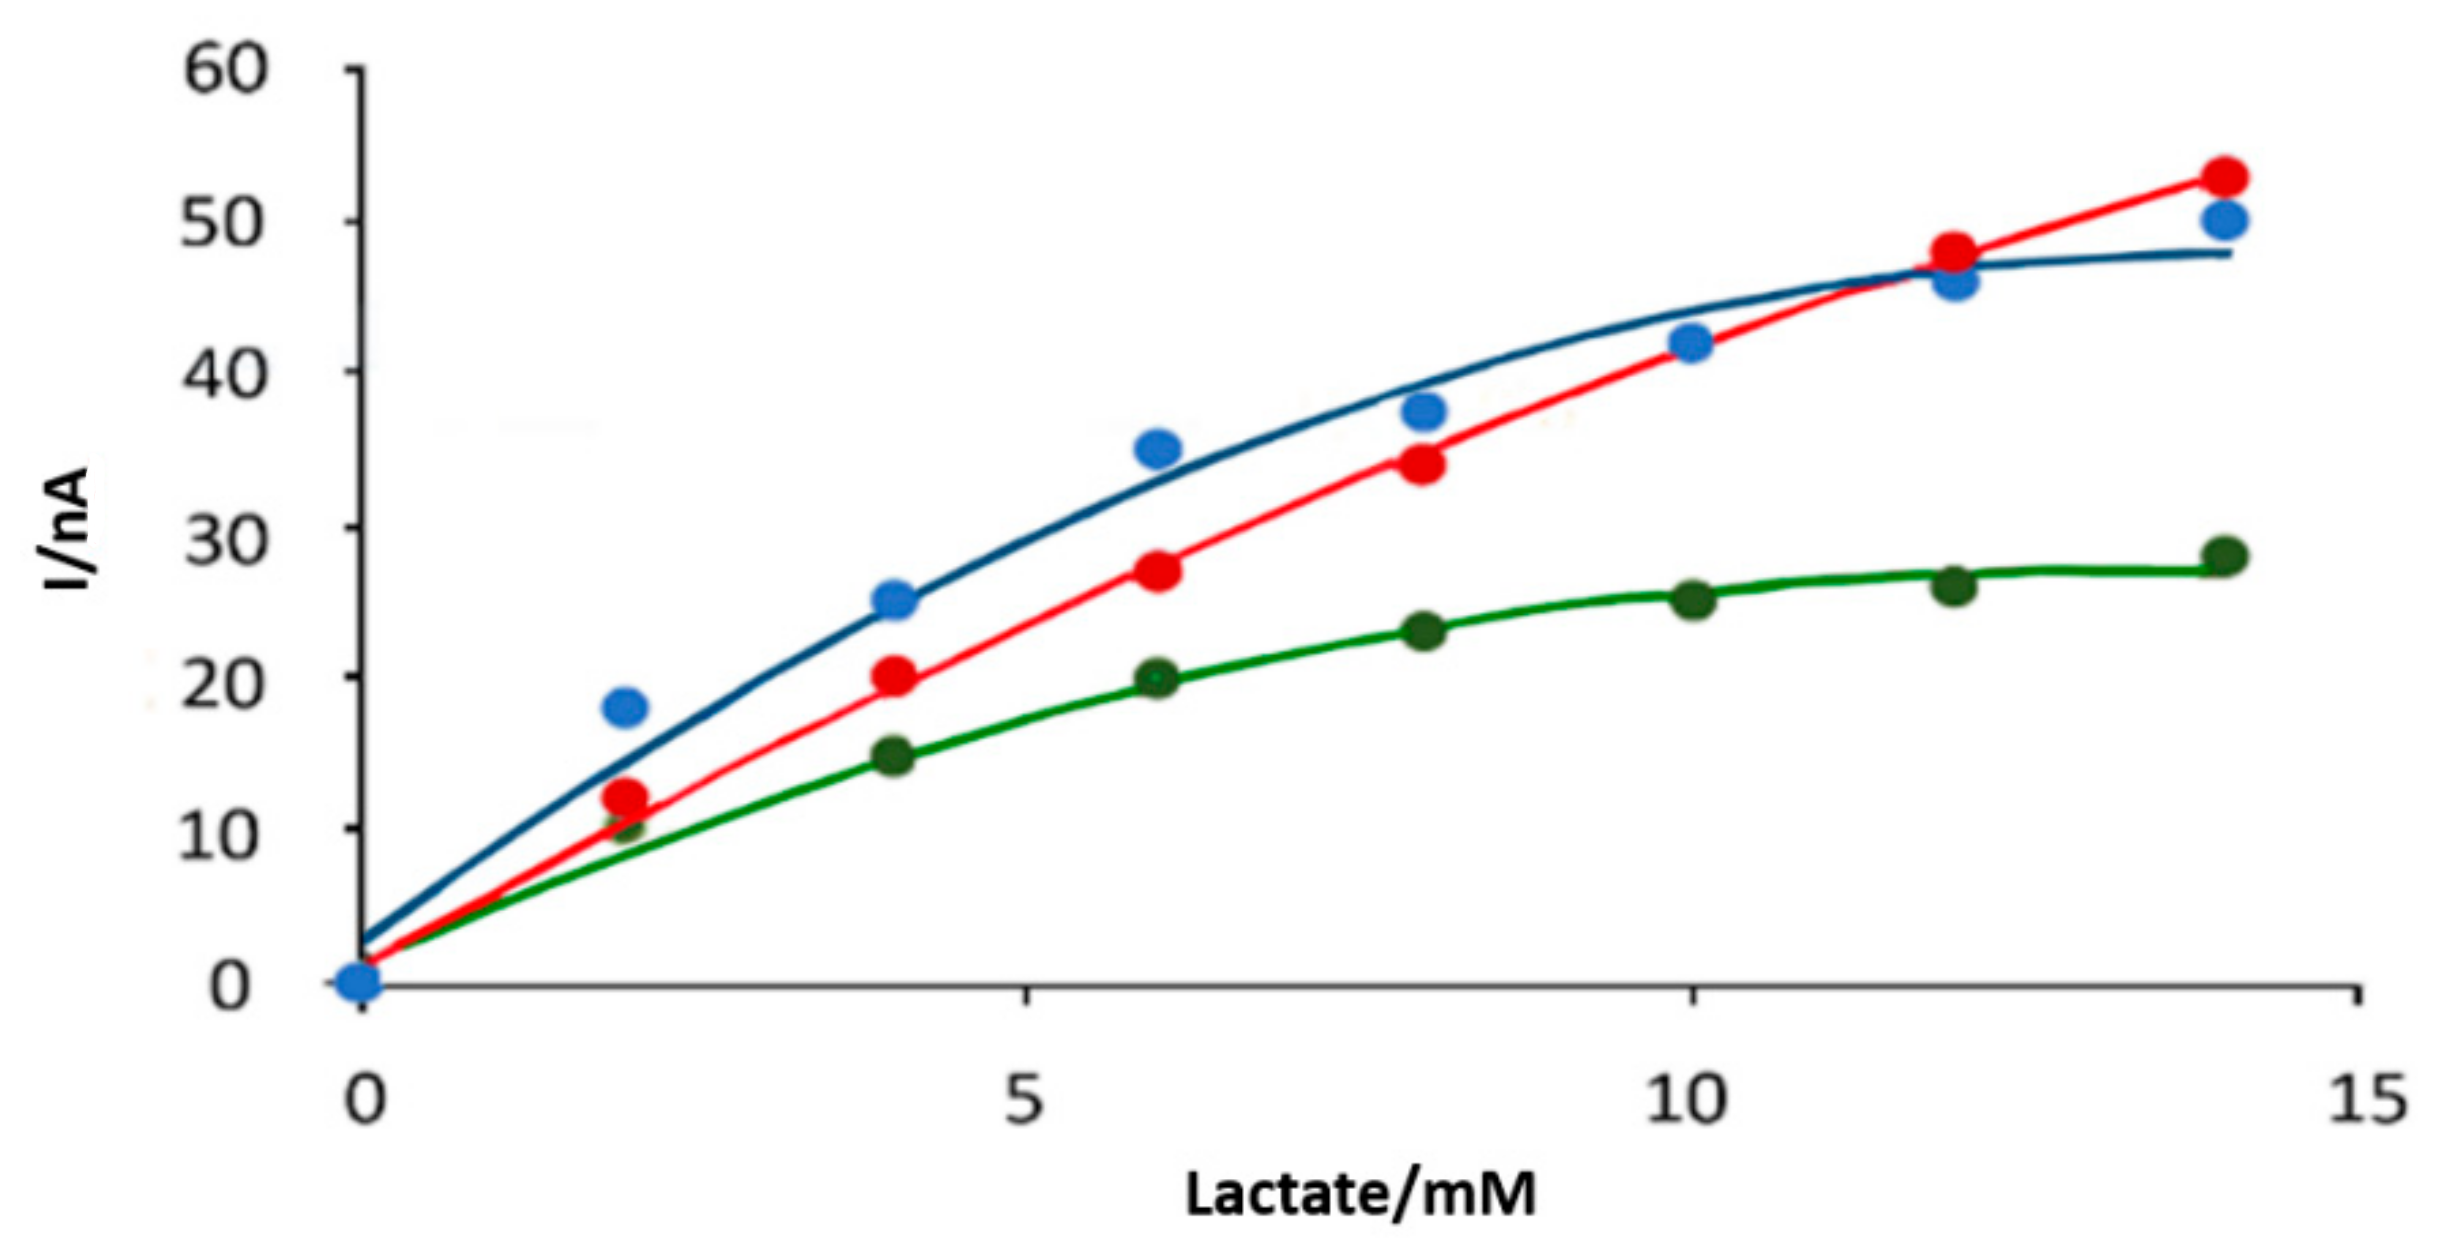
3.1. In Vitro Optimisation of Needle Electrodes

The strength and rigidity of steel and its viability as a pseudoreference has allowed us to use it previously in implantable needle glucose sensors [10,28]. Silver coating of the needle is an attractive option for creating a formal electrochemical cell, so ultra-high vacuum (UHV) deposition of silver was undertaken as a simple, single step means for achieving this. The result was a highly uniform, nano-thickness silver film over the needle shaft. Baseline buffer CV was similar to that with the uncoated steel, though with minor extension of the voltage window (Figure 1A). A change from a two (Pt/stainless steel) to a three electrode arrangement (added Ag/AgCl reference) made little difference to these baseline CVs (Figure 1B) in the H2O2 measurement window around +0.65 V. With these bare Pt electrodes, baseline currents were high (~20 nA), as shown in the expanded scale (Figure 1B). These have the potential to dominate lactate responses, which are also in the nA range, leading to errors through background effects. Experience with membranes, however, indicates that polymeric barriers can suppress this baseline [27], presumably through diffusional restriction to exchange current generation. Ultimately, the UHV deposited Ag films proved difficult to retain on the steel, and delamination occurred during repeat solution exposure (Figure 2) precluding their further use.
Ag/AgCl is understandably the preferred reference for implantable electrochemical devices [29], but little has been reported about its toxicity or biological effects. One early study found that arterioles exposed to Ag/AgCl became hypercontractile and subsequently flaccid and pharmacologically unreactive [30], a clear indication of functional change through toxic damage. More recently, with in vivo implanted Ag plates, a toxic sequence has been described. This comprised vascular dilatation, loss of capillary wall integrity and later tissue inflammation and oedema [31], all occurring within 30 min. We considered stainless steel to be non-toxic, but this study found mild toxicity even with steel. Tissue damage from metal arises from released ions, and Ag+ and Fe3+ both have toxic potential. This is partially mitigated by Cl complexation and protein binding in biological fluids, but soluble bioinorganic chelates also form which are able diffuse to the cell surface leading to toxic outcomes [32]. Greater attention is needed in future to the tissue biology of released metal components, short of overt toxicity, to match the extensive biocompatibility studies on sensor polymeric constituents.

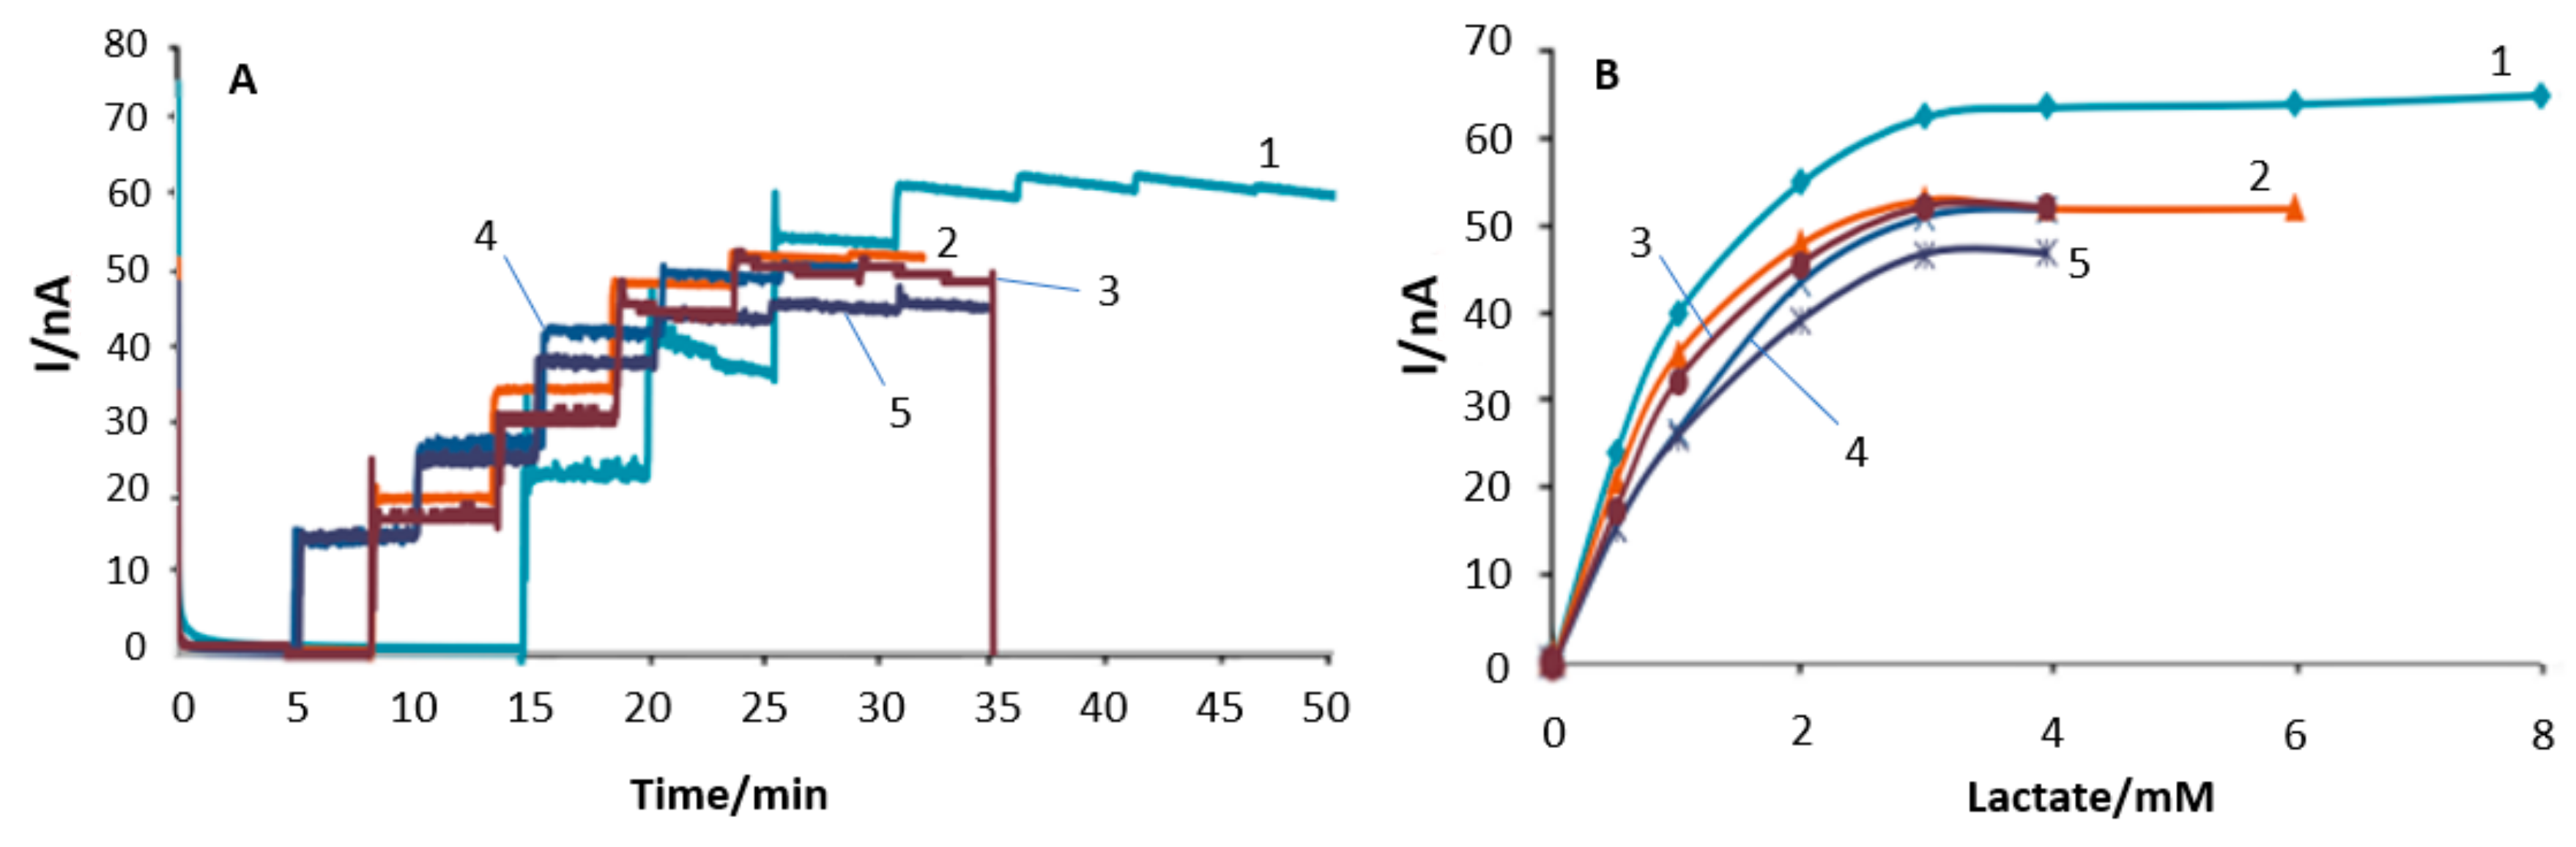
3.2. Polymer Barrier Membrane Effects on Sensors

The relatively low Km of lactate oxidase for lactate presents a challenge for undiluted sample measurement given the wide span of lactate change in blood and other bio-fluids. The reported Aerococcus viridans enzyme Km ranges between 0.104 mM [33] and 0.94 mM [34], though the majority of reports indicate a value around 0.7 mM [35,36,37,38]. Surprisingly, despite the greater use of Pediococcus sp enzyme, there is only one reported Km for this source of 0.52 mM [39]. For the crosslinked Pediococcus sp in this study, based on half maximum current in the calibration plots (Figure 3), the Km would appear to be between 0.6–0.8 mM. This suggests little or no lactate diffusional constraint in the enzyme layer.
With external polyurethane barrier layers to limit diffusion, however, increased apparent Km with linearity to at least 25 mM lactate is achieved (Figure 4). This is consistent with the ability of such barrier layers to reduce enzyme layer lactate concentration to well below enzyme Km. Despite the membrane barrier, responses were sufficiently rapid (2–5 min) to be acceptable for physiological monitoring. Furthermore, in practical terms, a linear range of up to only 8 mM lactate would be sufficient in clinical shock [40]. The final polyurethane coating on the needle tip provided for a smooth surface, as indicated in the optical microscopy images (Figure 4 inset), though a pore structure has been seen in the past by us by SEM. Both polyurethane layer number and density here offer a means for reducing diffusion and extending linear range.
The inner SPEES PES membrane is designed for H2O2 selectivity. When used as a high-density layer here, it imposes a sharp reduction in H2O2 transport to the Pt electrode, but as well as reducing lactate response, it surprisingly led to an extended lactate linear range (Figure 5). This cannot be associated with any outer membrane effect, so we hypothesize that with less H2O2 reaching the working electrode surface, and more retained in the enzyme layer, there was greater opportunity for its non-electrochemical degradation. Any decomposition in the enzyme layer would be able to replenish at least some of the oxygen consumed by the reaction. There would be stochiometric regeneration of oxygen in that event, but the unknown is whether it can actually occur in the enzyme layer.
In work with a low permeability inner PVC barrier [41], we found a linearization effect with glucose oxidase. However, here, decomposition by catalase contaminant was a possibility given the microbial enzyme source, but the organisms sourced for lactate oxidase are catalase and pseudo-catalase free. H2O2 decomposition is known occur at some inorganic and metal surfaces [42], but equivalent studies at polymer or protein surfaces are not yet reported, and perhaps merit consideration.
There are three commercial enzyme sources are available to construct a lactate sensor. These resulted in some difference in response (Figure 6) but the level of this did not appear to be sufficient to merit a change from our previously tried Pediococcus sp enzyme [27].

3.3. Sensor pO2 Dependence

The oxygen dependence of a first generation enzyme electrode is a key consideration for in vivo use because of the likely low ambient pO2 levels it would experience. Our previous study with subcutaneous oxygen needle sensors found pO2 to dip down to 10 mmHg in the rat and in human subjects down to 30 mmHg [43]. Diffusion barrier membranes for in vivo sensors are designed, in part, to reduce the O2 background effect by differentially reducing glucose transport over that of oxygen. Surprisingly, despite this design feature and the extensive clinical use of glucose sensors, little has been reported on either background O2 effects or their membrane mitigation. In the case of lactate sensors, such information is entirely missing.
Accordingly, we produced oxygen calibration curves under fixed lactate backgrounds (Figure 7). These all show a common O2 plateau region at pO2 > 70 mmHg where oxygen change has little or no influence on response. If this is considered to be the Vmax region for the enzyme layer, 0.5 Vmax gives an apparent Km of ~30 mmHg, equating to 0.13 mM oxygen concentration. This is not significantly different from two reported values for the soluble enzyme of 0.069 mM and 0.16 mM [34,38], respectively, and suggests there is little oxygen diffusion limitation within the enzyme layer. It is consistent with the apparent enzyme lactate Km derived from Figure 3 similar to that of the soluble enzyme; gas molecule diffusion would be expected to be less affected by polymeric/biopolymeric barriers than is the case for a microsolute. The similar oxygen plateau regions for both membrane covered and non-membrane electrodes suggests that the outer polyurethane may not have added a further significant barrier to oxygen transport. This would be a useful discriminating feature of such a membrane polymer. Whilst lactate responses in the absence of a membrane indicate limited linearity to 2 mM, comparable to that seen in Figure 3, an extension of this to 5 mM with a barrier membrane confirms lactate diffusional retardation.
The implication of the above for blood measurement is that only in the case of arterial blood (pO2 80–100 mmHg) can oxygen independent responses be safely assumed. For venous blood (pO2 30–40 mmHg) background oxygen variation has to be factored in unless higher barrier layers are used, e.g., as in Figure 4. This was the possible reason for the similarity in lactate responses we previously saw in venous and arterial pO2 matched calibrant solutions with a needle lactate sensor [27].

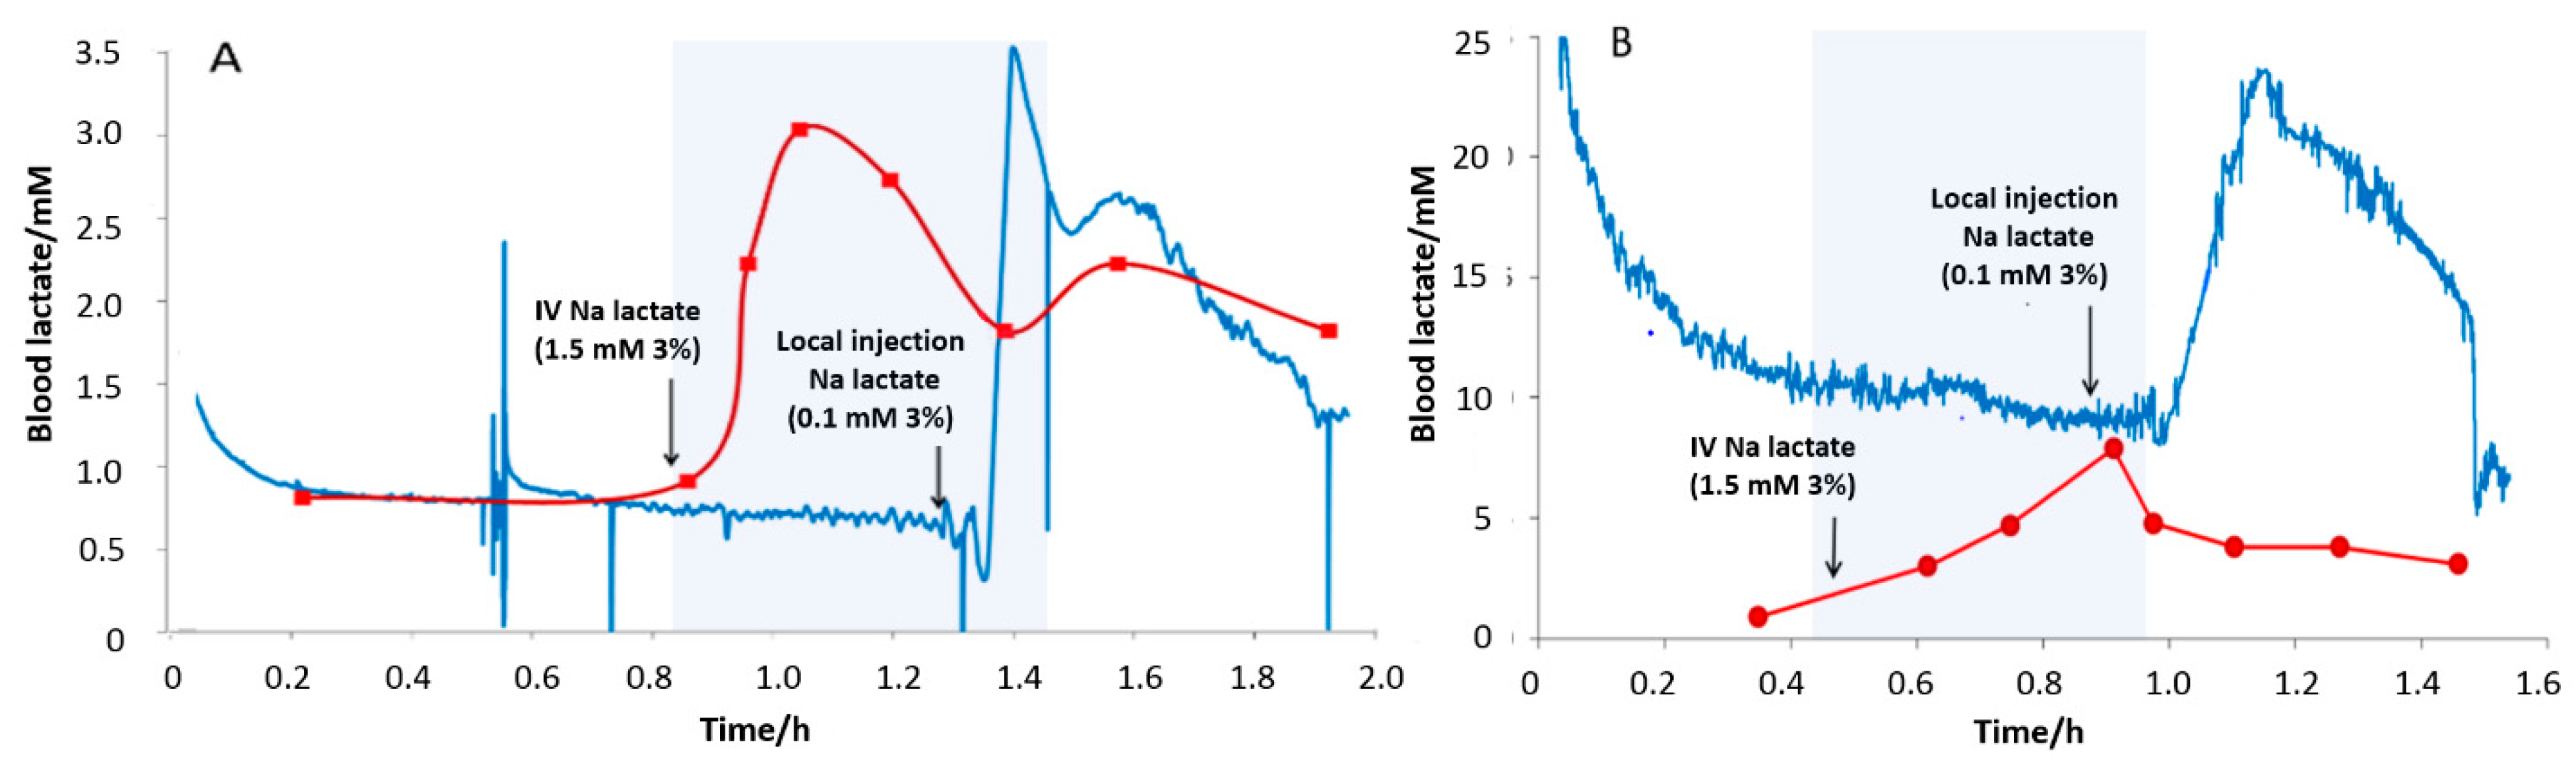
3.4. Subcutaneous Tissue Lactate Monitoring in the Rat

In the rat study, blood lactate was increased using intravenous infusion of 3% (267 mM) Na lactate (Figure 8). This raised blood lactate, but had no effect on tissue sensor output despite the substantial elevations in blood lactate achieved. Direct injection of the same lactate solution into tissue around the devices produced marked electrode responses in each case confirming retained sensor responsiveness to lactate within tissue. Accepting that a low tissue pO2 could have depressed responses (Figure 7), some change in signal output, at least, should have been seen. Electrode mispositioning as a cause of an unresponsiveness seems unlikely given that the same implantation technique has enabled consistent tissue glucose monitoring [28,44], and we have previously seen a tissue lactate rise during induced hypoxia [14].
In the context of the present study, two explanations might be considered. Firstly, lactate as an anion has restricted diffusion through tissue, itself an anionic matrix due to its charged connective tissue biopolymers. Lactate given intravenously, however, disappears rapidly from the circulation. In a rat study, a 20% fall in lactate was observed at 20 min [45]. Much of this, though, will be into the major organs and tissues, and an equivalent, rapid transfer into all extravascular compartments cannot be assumed. In a study using crosslinked collagen membranes as tissue substitute diffusion barriers, we found similar transport reduction for small molecules, including ascorbate. However, when the collagen was loaded with fibronectin, chondroitin sulphate or heparin, all anionic connective tissue constituents, selectively greater reduction of ascorbate diffusion was seen. Thus, its relative diffusion coefficient was reduced to 0.01–20.0% of that seen for the other solutes at the same modified collagen matrix [46]. This strongly suggests that tissue may differentially restrict anionic microsolute transfer. Secondly, whilst dermal tissue provides a loose mesh that should be relatively open to diffusion, its dehydration might lead to reduction in porosity with fewer transport pathways. Skin is susceptible to evaporative water loss; shaved skin in the rat loses 0.8 mg/cm−2/h water even at ambient temperature [47], important at superficial locations. We have previously used tissue hydration, to enhance solute diffusion [10,28]. The possibility of differential glucose/lactate transfer through tissue is suggested in a microdialysis study during exercise where we observed a delayed lactate rise whilst glucose changed throughout [16].
A further barrier effect at capillary level should also be considered. Capillaries have defined open pores of ~3 nm that readily accessible to microsolutes. However, endothelial cell transport modulation cannot be ruled out. Moreover, the capillary wall has an investing glycocalyx layer that is anionic in nature [48] which will confer some ion discriminating properties. Sensor fouling is unlikely as the membranes used here have been shown to be adequate for stable short term monitoring [28,43]. The contrast with the tissue lactate changes seen in our previous rat study suggests that tissue hydration may have facilitated lactate mobility in tissue [27], furthermore, it was a shock study leading to generalised tissue effects, not one reliant on change within a single compartment.
Microdialysis and open cannula push pull sampling [15,16,19,20,21] indicate that there is decidedly not a block to lactate exchange, so the contrast with our sensor outcome needs to be explained. One possibility is that tissue becomes hydrated. With microdialysis, whilst dialysis fluid is designed to be isosmotic, there will be some osmotic mismatch with tissue with the possibility of bulk transfer of water into surrounding tissue. Furthermore, interstitial tissue has a protein concentration that as much as 50% of that of plasma. This equates to an additional (oncotic) osmotic pressure of 10 mmHg [49], quite sufficient to drive out water from a microdialysis probe. Blood-tissue correlations when microdialysis is used clinically have varied [50,51,52], and it would be of interest to consider if tissue hydration state has a bearing on this.
One route to obtaining an absolute value for tissue lactate is to use ultra-slow microdialysis. This reduces the ‘sink’ effect of lactate removal and gives a recovery approaching 100%. With this modified technique, resting subcutaneous tissue lactate in the rat was found to be 1.3 mM, though with a dip observed down to 0.65 mM [53]. Alternatively, the push pull cannula technique and its recovery corrected measurement has given a value for human subcutaneous tissue lactate 1.5 mM [20]. This indicates a close similarity between rat and human subcutaneous tissue lactate. In the case of blood there is also a likely match; 1.5 mM lactate was measured in the Wistar rat at rest [54] which is within the human reference range (0.5–2.0 mM).

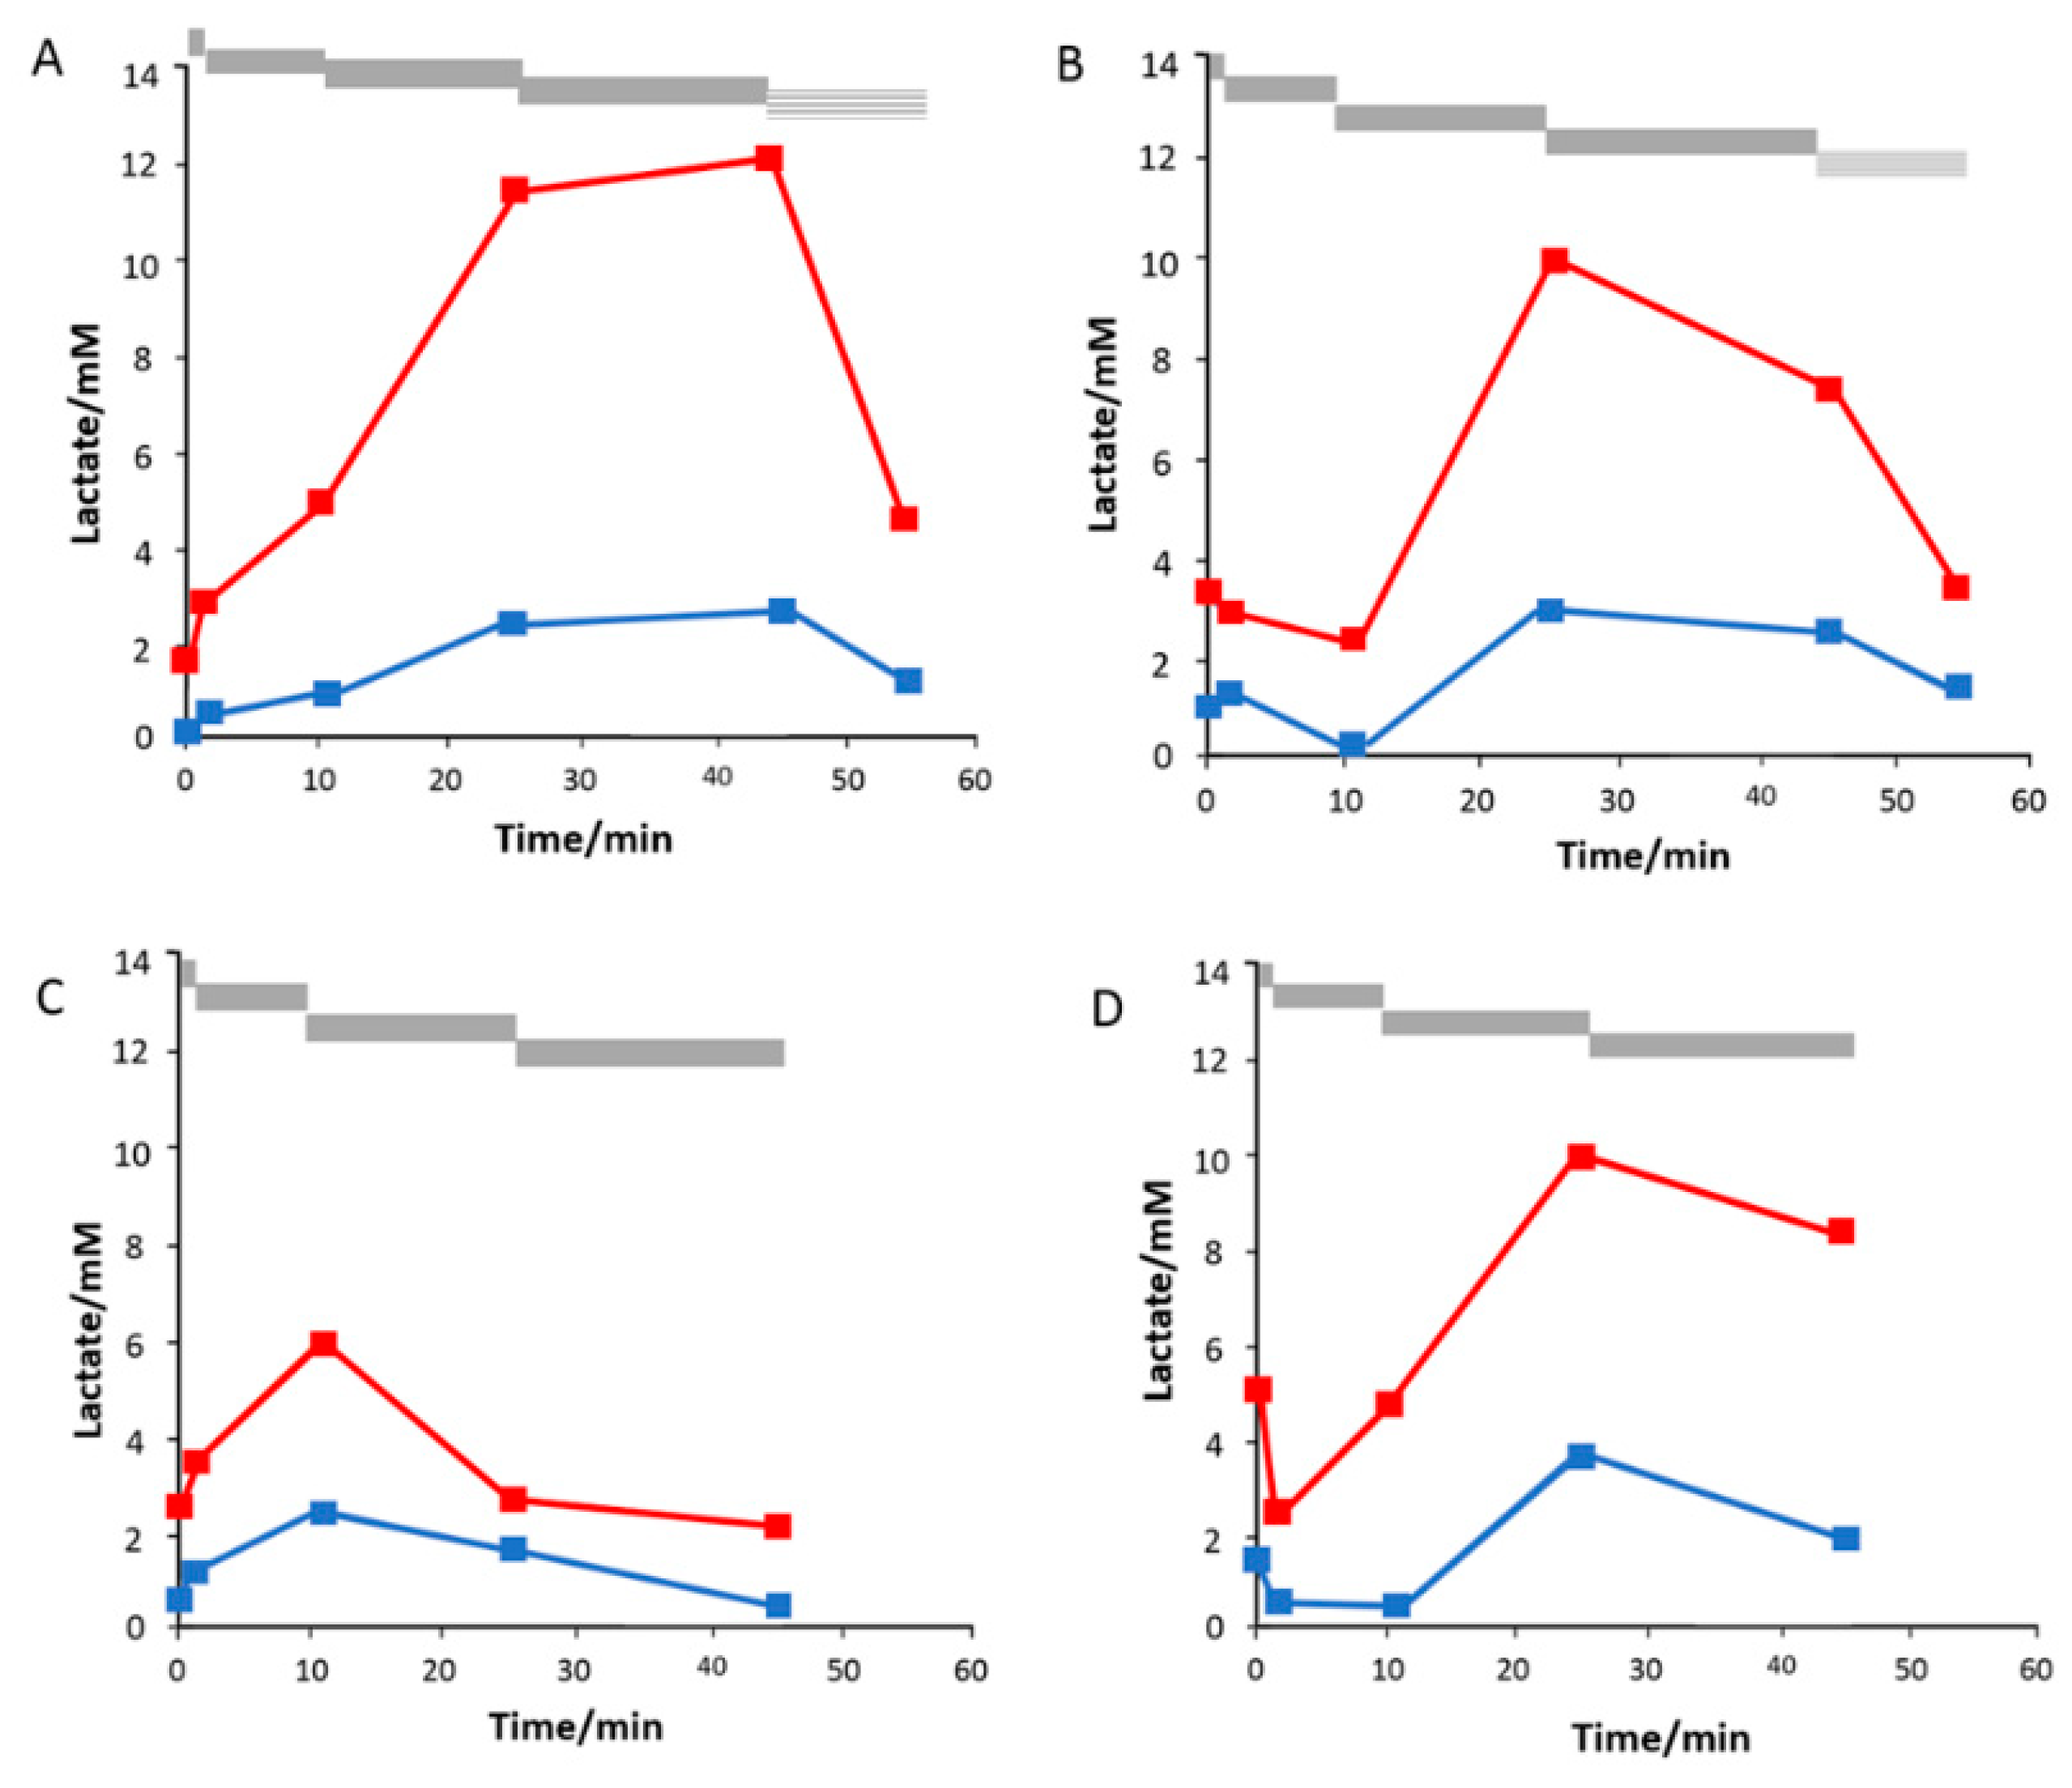
3.5. Saliva Measurement in Exercise

Saliva provides a readily accessible, low protein biofluid option for lactate measurement. In our previous exercise study, we found salivary lactate to increase in all subjects [13] in agreement with previous reports. With the present blood study, levels are seen to rise but are considerably lower than for blood (Figure 9). Furthermore, the ratio of saliva to blood lactate is not a constant, either in an individual or during the course of the exercise. This would seem to lend considerable uncertainty to the use of saliva as a surrogate for blood, and its use as a reference fluid for clinical use has to be ruled out. Previous studies [55,56,57] have found values varying between those below to those approaching blood levels. Saliva, nevertheless, would seem to have potential use outside of healthcare, e.g., for trend monitoring during exercise. The sensors used here employed an inner electropolymerized film for selectivity because these had the advantage over the SPEES PES barrier of conferring greater sensitivity through greater permeability. Their internal deployment meant that they had no effect on surface processes such as fouling or lactate diffusion limitation.
The salivary glands are a rapid responsive secretory system capable of stimulated high-volume outputs over very short intervals. Stimulation is nerve mediated and triggered by taste and mechanical sensors. Secretion rates can increase tenfold, and such post-stimulation samples are the basis for all salivary biochemical monitoring. With the high rate of secretion, protein content and viscosity go down dramatically, a considerable advantage for easy collection and low sensor fouling. Unstimulated saliva is viscous with a high mucopolysaccharide and mucin level, so baseline saliva is difficult to collect. The entry of fluid, microsolute and protein into saliva occurs through the acinar cells, and at that stage saliva is isotonic. Its subsequent passage through the salivary ducts leads to salt reabsorption generating the collectable hypo-osmolar final product. Though this is low in electrolyte, it is sufficient for undiluted electrochemical measurement Lactate is imported into the gland through acinar cell filtration activity, but the duct exchanges mean that its final concentration is altered radically and in a manner that is flow dependent. Moreover, the parotid gland, the main contributor of salivary metabolites [58] varies its secretory contribution depending on stimulation, adding further uncertainty to compositional evaluation.

3.6. Sweat Monitoring in Exercise

Sweat monitoring was undertaken using planar lactate electrodes strapped to the upper arm (Figure 10 inset). In contrast to the use of a microfluidic channel to collect the sweat for delivery to the sensor surface [59], we found direct skin facing sensors to have sufficient sweat exposure during the exercises. Despite similarities in exercise intensity, considerable interindividual variation was seen (Figure 10). Lactate changes were characterized, variously, by a steep rise and fall, a slow progressive rise and fall and a sustained downward trend during the exercise periods. It is difficult to validate these measurements, and indeed the same applies to other reported continuous sweat measurements. The challenge of matched sampling and reference assay of an ultra-low volume dynamically changing fluid remains unmet. This imposes a major limitation to the use of sweat for any definitive clinical interpretation, though advisory information may well be extractable in sports physiology. With respect to the decreasing lactate values seen here whilst exercise was ongoing, dilutional lactate concentration reduction is a possibility; a high sweat production and known to reduce lactate level by a dilutional effect. A peak in lactate value has been evident in earlier studies, though much less obvious and not commented upon [60,61].
With regard to physiology fundamentals, sweat lactate production is a distinctly compartmentalized gland driven activity. There is no evidence of a salivary gland equivalent blood filtration, either passive or active with regard to lactate or, indeed, for any other metabolite. The gland is capable of orchestrating its lactate output over a considerable amplitude, viz 5–40 mM [62]. Such major changes are in keeping with the variations we observe here. From such large swings it is clear that sweat lactate cannot possibly have resulted from a blood filtration process, active or passive. No such blood profile in exercise or shock is possible, no matter what the hypoxia state, leaving aside absolute differences with blood level.
The observed lactate increase during exercise is more realistically linked to multiple non-biochemical stimuli that come into play [63]. These include psychological, hormonal, nervous and mechanical serving, in part, to achieve thermoregulatory control via the sweat gland [64], a critical need during exercise. Within the gland itself, there are two processes to be considered: the primary glandular secretion and then its subsequent modification during passage through the duct. Only in the case of K+ [65] is there any evidence of blood filtration. Even here, when K+ was monitored during exercise [66] the level was well below what would be expected for plasma K+ at the start and rose to supra-plasma levels during exercise. A passive filtering process is difficult to contemplate here and sweat K+ also cannot be considered as an indirect basis for blood K+ monitoring. Evidence that sweat lactate does not reflect blood lactate elevation during exercise exists [63,67]. New uncertainty has been introduced following studies using sensors. In one report a correlation with blood lactate elevation, though not with absolute level, was reported [68], but here priming pharmacological stimulation of the sweat gland was used.
The secretory capacity that the sweat gland has with regard to lactate is unrelated to what may be present in blood. It is results from a uniquely high glycolytic drive which is almost completely arrested at lactate/pyruvate level. The only blood variable that could therefore have an influence here is glucose [69]. Local effects may well be important, thus local muscle activity has been linked to increased sweat lactate [70], but tissue mechanical influence cannot be ruled out; the sweat gland is responsive to both pressure and shear. It is, finally, not in doubt that exercise will induce a major sweat lactate elevation [71], as we also show, but it is highly questionable that any of this reflects blood lactate change. The value of sweat lactate monitoring during exercise remains provided reproducible correlates with exercise regimens can be established or some assessment of training readiness is achieved. As an assay fluid with an extreme low protein content (<0.25 g/L) sweat is certainly highly attractive for sensor use, but this cannot overcome the reality that it is not an available window to blood change.

4. Conclusions

Tissue implantable glucose sensors have demonstrated the clinical value of continuous monitoring, but the lactate sensor so deployed appears not to have seen equivalent use in shock. Certainly, blood-tissue correlations are reported, but tissue handling of the metabolite appears to be quite different from that of glucose; measurement uncertainty is greater and precludes clinical use. The better outcomes with microdialysis suggest that hydration may be a factor in blood-tissue lactate crosstalk. If such an effect is confirmed, it would not only show up a new feature of microdialysis but indicate the structural plasticity of interstitial tissue as a transport conduit. A variation in interstitial space behaviour towards small solute molecules has further implications outside of biochemistry, such as in pharmacology concerning the efficacy and targeting of therapeutic agents. There is also the consideration of how we might open up the extravascular compartment to meaningful monitoring in the future; blood provides only a partial basis for biochemical evaluation in health and disease. The three sampling routes investigated here have shown contrasting outcomes, and only with saliva is tracking of blood a feasible proposition. Sweat, despite all the recent attention given to it and the dedicated sensor designs reported, is distinctly unpromising. The present work highlights the need to unravel basic physiology before sensors are deployed in biofluids outside of blood.

Author Contributions

Data curation, S.A.; Formal analysis, A.-M.S.-D.; Supervision, P.V. All authors have read and agreed to the published version of the manuscript.

Funding

This research was funded by the UK EPSRC, grant number EP/H009744/1.

Institutional Review Board Statement

Regional NHS ethics committee permission was obtained for the human studies (Ref 10/H0808/124) and the animal studies were undertaken in an authorized laboratory in accordance with licensed UK Home Office procedure.

Informed Consent Statement

Informed consent was obtained from all subjects involved in this study.

Data Availability Statement

All the data referable to the study are already contained within the article.

Conflicts of Interest

The authors declare no conflict of interest.

References

  1. Adeva-Andany, M.; Lopez-Ojen, M.; Funcasta-Calderon, R.; Ameneiros-Rodriguez, E.; Donapetry-Garcia, C.; Vila-Altesor, M.; Rodriguez-Seijas, J. Comprehensive review on lactate metabolism in human health. Mitochondrion 2014, 17, 76–100. [Google Scholar] [CrossRef]
  2. Weiss, I.K.; Fink, S.; Harrison, R.; Feldman, J.D.; Brill, J.E. Clinical use of continuous arterial blood gas monitoring in the pediatric intensive care unit. Pediatrics 1999, 103, 440–445. [Google Scholar] [CrossRef]
  3. Brooks, G.A. Cell-cell and intracellular lactate shuttles. J. Physiol. 2009, 587, 5591–5600. [Google Scholar] [CrossRef]
  4. Brinkmann, B.; Fechner, G.; Karger, B.; DuChesne, A. Ketoacidosis and lactic acidosis—Frequent causes of death in chronic alcoholics? Int. J. Legal Med. 1998, 111, 115–119. [Google Scholar] [CrossRef] [PubMed]
  5. Handy, J.M.; Soni, N. Physiological effects of hyperchloraemia and acidosis. Br. J. Anaesth. 2008, 101, 141–150. [Google Scholar] [CrossRef] [PubMed] [Green Version]
  6. Davis, M.A.; Williams, P.E.; Cherrington, A.D. Effect of a mixed meal on hepatic lactate and glucogneogenic precursor metabolism in dogs. Am. J. Physiol. 1984, 247, E362–E369. [Google Scholar] [CrossRef] [PubMed]
  7. Levy, B. Lactate and shock state: The metabolic view. Curr. Opin. Crit. Care 2006, 12, 315–321. [Google Scholar] [CrossRef]
  8. Crane, B.C.; Barwell, N.P.; Gopal, P.; Gopichand, M.; Higgs, T.; James, T.D.; Jones, C.M.; Mackenzie, A.; Mulavisala, K.P.; Paterson, W. The development of a continuous intravascular glucose monitoring sensor. J. Diabetes Sci. Technol. 2015, 9, 751–761. [Google Scholar] [CrossRef] [Green Version]
  9. Xie, X.; Doloff, J.C.; Yesilyurt, V.; Sadraei, A.; McGarrigle, J.J.; Commis, M.; Veiseh, O.; Farah, S.; Isa, D.; Ghanis, S.; et al. Reduction of measurement noise in a continuous glucose monitor by coating the sensor with a zwitterionic polymer. Nat. Biomed. Eng. 2018, 2, 894–906. [Google Scholar] [CrossRef]
  10. Rigby, G.P.; Ahmed, S.; Horseman, G.; Vadgama, P. In vivo glucose monitoring with open microflow—Influences of fluid composition and preliminary evaluation in man. Anal. Chim. Acta 1999, 385, 23–32. [Google Scholar] [CrossRef]
  11. Chen, C.; Zhao, X.L.; Li, Z.H.; Zhu, Z.G.; Qian, S.H.; Flewitt, A.J. Current and emerging technology for continuous glucose monitoring. Sensors 2017, 17, 182. [Google Scholar] [CrossRef] [Green Version]
  12. Hoss, U.; Budiman, E.S.; Liu, H.; Christiansen, M.P. Continuous glucose monitoring in the subcutaneous tissue over a 14-day sensor wear period. J. Diabetes Sci. Technol. 2013, 7, 1210–1518. [Google Scholar] [CrossRef] [PubMed] [Green Version]
  13. Spehar-Deleze, A.M.; Anastasova, S.; Vadgama, P. Electropolymerised phenolic films as internal barriers for oxidase enzyme biosensors. Electroanalysis 2014, 26, 1335–1344. [Google Scholar] [CrossRef]
  14. Spehar-Deleze, A.; Anastasova, S.; Popplewell, J.; Vadgama, P. Extreme physiological state: Development of tissue lactate sensor. In Proceedings of the 2012 Ninth International Conference on Wearable and Implantable Body Sensor Networks, London, UK, 9–12 May 2012; IEEE: Piscataway, NJ, USA, 2012; pp. 17–21. [Google Scholar] [CrossRef]
  15. Nightingale, A.M.; Leong, C.L.; Burnish, R.A.; Hassan, S.U.; Zhang, Y.; Clough, G.F.; Boutelle, M.G.; Voegeli, D.; Niu, X.Z. Monitoring biomolecule concentrations in tissue using a wearable droplet microfluidic-based sensor. Nat. Commun. 2019, 10, 2741. [Google Scholar] [CrossRef] [Green Version]
  16. Gowers, S.A.N.; Curto, V.F.; Seneci, C.A.; Wang, C.; Anastasova, S.; Vadgama, P.; Yang, G.Z.; Boutelle, M.G. 3D printed microfluidic device with integrated biosensors for online analysis of subcutaneous human microdialysate. Anal. Chem. 2015, 87, 7763–7770. [Google Scholar] [CrossRef] [PubMed]
  17. Kastellorizios, M.; Burgess, D. Continuous Metabolic Monitoring Based on Multi-Analyte Biomarkers to Predict Exhaustion. Sci. Rep. 2015, 5, 10603. [Google Scholar] [CrossRef] [Green Version]
  18. Sardesai, N.P.; Ganesana, M.; Karimi, A.; Leiter, J.C.; Andreescu, S. Platinum-Doped ceria based biosensor for in vitro and in vivo monitoring of lactate during hypoxia. Anal. Chem. 2015, 87, 2996–3003. [Google Scholar] [CrossRef] [PubMed]
  19. Poscia, A.; Messeri, D.; Moscone, D.; Ricci, F.; Valgimigli, F. A novel continuous subcutaneous lactate monitoring system. Biosens. Bioelectron. 2005, 20, 2244–2250. [Google Scholar] [CrossRef] [Green Version]
  20. Ellmerer, M.; Schaupp, L.; Trajanoski, Z.; Jobst, G.; Moser, I.; Urban, G.; Skrabal, F.; Wach, P. Continuous measurement of subcutaneous lactate concentration during exercise by combining open-flow microperfusion and thin-film lactate sensors. Biosens. Bioelectron. 1998, 13, 1007–1013. [Google Scholar] [CrossRef]
  21. Ellmerer, M.; Schaupp, L.; Sendlhofer, G.; Wutte, A.; Brunner, G.A.; Trajanoski, Z.; Skrabal, F.; Wach, P.; Pieber, T.R. Lactate metabolism of subcutaneous adipose tissue studied by open flow microperfusion. J. Clin. Endocr. Metab. 1998, 83, 4394–4401. [Google Scholar] [CrossRef]
  22. Wolf, A.; Renehan, K.; Ho, K.K.Y.; Carr, B.D.; Chen, C.V.; Cornell, M.S.; Ye, M.Y.; Rojas-Pena, A.; Chen, H. Evaluation of continuous lactate monitoring systems within a heparinized in vivo porcine model intravenously and subcutaneously. Biosensors 2018, 8, 122. [Google Scholar] [CrossRef] [PubMed] [Green Version]
  23. Gargiulo, S.; Gramanzini, M.; Liuzzi, R.; Greco, A.; Brunetti, A.; Vesce, G. Effects of some anesthetic agents on skin microcirculation evaluated by laser Doppler perfusion imaging in mice. BMC Vet. Res. 2013, 9, 255. [Google Scholar] [CrossRef] [PubMed] [Green Version]
  24. Hu, Y.B.; Zhang, Y.N.; Wilson, G.S. A needle-type enzyme-based lactate sensor for in-vivo monitoring. Anal. Chim. Acta 1993, 281, 503–511. [Google Scholar] [CrossRef]
  25. Pfeiffer, D.; Moller, B.; Klimes, N.; Szeponik, J. Amperometric lactate oxidase catheter for real-time lactate monitoring based on thin film technology. Biosens. Bioelectron. 1997, 12, 539–550. [Google Scholar] [CrossRef]
  26. Ward, W.K.; House, J.L.; Birck, J.; Anderson, E.M.; Jansen, L.B. A wire-based dual-analyte sensor for glucose and lactate: In vitro and in vivo evaluation. Diabetes Technol. Ther. 2004, 6, 389–401. [Google Scholar] [CrossRef] [PubMed]
  27. Rong, Z.M.; Leitao, E.; Popplewell, J.; Alp, B.; Vadgama, P. Needle enzyme electrode for lactate measurement in vivo. IEEE Sens. J. 2008, 8, 113–120. [Google Scholar] [CrossRef]
  28. Rigby, G.P.; Crump, P.W.; Vadgama, P. Stabilized needle electrode system for in vivo glucose monitoring based on open flow microperfusion. Analyst 1996, 121, 871–875. [Google Scholar] [CrossRef]
  29. McGarraugh, G. The chemistry of commercial continuous glucose monitors. Diabetes Technol. Ther. 2009, 11, S17–S24. [Google Scholar] [CrossRef]
  30. Jackson, W.F.; Duling, B.R. Toxic effects of silver-silver chloride electrodes on vascular smooth muscle. Circ. Res. 1983, 53, 105–108. [Google Scholar] [CrossRef] [Green Version]
  31. Kraft, C.N.; Hansis, M.; Arens, S.; Menger, M.D.; Vollmar, B. Striated muscle microvascular response to silver implants: A comparative in vivo study with titanium and stainless steel. J. Biomed. Mater. Res. 2000, 49, 192–199. [Google Scholar] [CrossRef]
  32. Kaiser, J.P.; Roesslein, M.; Diener, L.; Wichser, A.; Nowack, B.; Wick, P. Cytotoxic effects of nanosilver are highly dependent on the chloride concentration and the presence of organic compounds in the cell culture media. J. Nanobiotechnol. 2017, 15, 5. [Google Scholar] [CrossRef] [PubMed] [Green Version]
  33. Taurino, I.; Reiss, R.; Richter, M.; Fairhead, M.; Thony-Meyer, L.; De Micheli, G.; Carrara, S. Comparative study of three lactate oxidases from Aerococcus viridans for biosensing applications. Electrochim. Acta 2013, 93, 72–79. [Google Scholar] [CrossRef] [Green Version]
  34. Yorita, K.; Matsuoka, T.; Misaki, H.; Massey, V. Interaction of two arginine residues in lactate oxidase with the enzyme flavin: Conversion of FMN to 8-formyl-FMN. Proc. Natl. Acad. Sci. USA 2000, 97, 13039–13044. [Google Scholar] [CrossRef] [PubMed] [Green Version]
  35. Li, G.S.; Lian, J.Z.; Xue, H.L.; Jiang, Y.Q.; Wu, M.B.; Lin, J.P.; Yang, L.R. Enzymatic preparation of pyruvate by a whole-cell biocatalyst coexpressing L-lactate oxidase and catalase. Process Biochem. 2020, 96, 113–121. [Google Scholar] [CrossRef]
  36. Unterweger, B.; Stoisser, T.; Leitgeb, S.; Birner-Grunberger, R.; Nidetzky, B. Engineering of Aerococcus viridans L-Lactate Oxidase for Site-Specific PEGylation: Characterization and Selective Bioorthogonal Modification of a S218C Mutant. Bioconj. Chem. 2012, 23, 1406–1414. [Google Scholar] [CrossRef] [PubMed]
  37. Hiraka, K.; Kojima, K.; Tsugawa, W.; Asano, R.; Ikebukuro, K.; Sode, K. Rational engineering of Aerococcus viridans L-lactate oxidase for the mediator modification to achieve quasi-direct electron transfer type lactate sensor. Biosens. Bioelectron. 2020, 151, 111974. [Google Scholar] [CrossRef]
  38. Stoisser, T.; Rainer, D.; Leitgeb, S.; Wilson, D.K.; Nidetzky, B. The Ala95-to-Gly substitution in Aerococcus viridans l-lactate oxidase revisited—Structural consequences at the catalytic site and effect on reactivity with O2 and other electron acceptors. FEBS J. 2015, 282, 562–578. [Google Scholar] [CrossRef] [PubMed]
  39. Ashok, Y.; Maksimainen, M.M.; Kallio, T.; Kilpelainen, P.; Lehtio, L. FMN-dependent oligomerization of putative lactate oxidase from Pediococcus acidilactici. PLoS ONE 2020, 15, e0223870. [Google Scholar] [CrossRef] [Green Version]
  40. Lee, S.M.; An, W.S. New clinical criteria for septic shock: Serum lactate level as new emerging vital sign. J. Thorac. Dis. 2016, 8, 1388–1390. [Google Scholar] [CrossRef]
  41. Reddy, S.M.; Vadgama, P.M. A study of the permeability properties of surfactant modified poly(vinyl chloride) membranes. Anal. Chim. Acta 1997, 350, 67–76. [Google Scholar] [CrossRef]
  42. Wang, H.; Zhao, G.; Pumera, M. Beyond platinum: Bubble-propelled micromotors based on Ag and MnO2 catalysts. JACS 2014, 136, 2719–2722. [Google Scholar] [CrossRef] [PubMed]
  43. Anastasova, S.; Spehar-Deleze, A.M.; Kwasnicki, R.M.; Yang, G.Z.; Vadgama, P. Electrochemical monitoring of subcutaneous tissue pO(2) fluctuations during exercise using a semi-implantable needle electrode. Electroanalysis 2020, 32, 2393–2403. [Google Scholar] [CrossRef]
  44. Anastasova, A.; Spehar-Deleze, A.-M.; Bickham, D.; Uebel, P.; Schmidt, M.; Russell, P.; Vadgama, P. Stabilised biosensing using needle-based recess electrodes. Electroanalysis 2012, 24, 529–538. [Google Scholar] [CrossRef]
  45. Valenza, F.; Pizzocri, M.; Salice, V.; Chevallard, G.; Fossali, T.; Coppola, S.; Froio, S.; Polli, F.; Gatti, S.; Fortunato, F.; et al. Sodium bicarbonate treatment during transient or sustained lactic acidemia in normoxic and normotensive rats. PLoS ONE 2012, 7, e46035. [Google Scholar] [CrossRef]
  46. Adatia, K.; Raja, M.; Vadgama, P. An electrochemical study of microporous track-etched membrane permeability and the effect of surface protein layers. Colloid Surf. B 2017, 158, 84–92. [Google Scholar] [CrossRef]
  47. Kandimalla, K.; Kanikkannan, N.; Andega, S.; Singh, M. Effect of fatty acids on the permeation of melatonin across rat and pig skin in-vitro and on the transepidermal water loss in rats in-vivo. J. Pharm. Pharmacol. 1999, 51, 783–790. [Google Scholar] [CrossRef]
  48. Stace, T.M.; Damiano, E.R. An electrochemical model of the transport of charged molecules through the capillary glycocalyx. Biophys. J. 2001, 80, 1670–1690. [Google Scholar] [CrossRef] [Green Version]
  49. Rosengren, B.I.; Rippe, B.; Tenstad, O.; Wiig, H. Acute peritoneal dialysis in rats results in a marked reduction of interstitial colloid osmotic pressure. J. Am. Soc. Nephrol. 2004, 15, 3111–3116. [Google Scholar] [CrossRef] [Green Version]
  50. Ellmerer, M.; Haluzik, M.; Blaha, J.; Kremen, J.; Svacina, S.; Plasnik, A.; Ikeoka, D.; Bodenlenz, M.; Schaupp, L.; Plank, J.; et al. Clinical evaluation of subcutaneous lactate measurement in patients after major cardiac surgery. Int. J. Endocrinol. 2009, 2009, 390975. [Google Scholar] [CrossRef] [Green Version]
  51. Den Heuvel, I.; Vlasselaers, D.; Wouters, P.J.; Milants, I.; Ellger, B.; Vanhorebeek, I.; Van den Berghe, G. Serial lactate measurements using microdialysis of interstitial fluid do not correlate with plasma lactate in children after cardiac surgery. Pediatr. Crit. Care Med. 2009, 10, 66–70. [Google Scholar] [CrossRef] [PubMed]
  52. Kopterides, P.; Theodorakopoulou, M.; Ilias, I.; Nikitas, N.; Frantzeskaki, F.; Vassiliadi, D.A.; Armaganidis, A.; Dimopoulou, I. Interrelationship between blood and tissue lactate in a general intensive care unit: A subcutaneous adipose tissue microdialysis study on 162 critically ill patients. J. Crit. Care 2012, 27, 742.e9–742.e18. [Google Scholar] [CrossRef]
  53. Kaptein, W.A.; Zwaagstra, J.J.; Venema, K.; Korf, J. Continuous ultraslow microdialysis and ultrafiltration for subcutaneous sampling as demonstrated by glucose and lactate measurements in rats. Anal. Chem. 1998, 70, 4696–4700. [Google Scholar] [CrossRef]
  54. Wren-Dail, M.A.; Dauchy, R.; Blask, D.E.; Hill, S.M.; Ooms, T.G.; Dupepe, M.; Bohm, J.; Rudolf, P. Effect of isoflurane anaesthesia on circadian metabolism and physiology in rats. Comp. Med. 2017, 67, 138–146. [Google Scholar] [PubMed]
  55. Oliveira, L.S.; Oliviera, S.F.; Manchado-Gobatto, F.B.; Costa, M.C. Salivary and blood lactate kinetics in response to maximal workload on cycle ergometer. Rev. Bras. Cineantropom. Desempenho Hum. 2015, 17, 565–574. [Google Scholar] [CrossRef]
  56. Tekus, E.; Kaj, M.; Szabo, E.; Szenasi, N.L.; Kerepesi, I.; Figler, M.; Gabriel, R.; Wilhelm, M. Comparison of blood and saliva lactate level after maximum intensity exercise. Acta Biol. Hung. 2012, 63, 89–98. [Google Scholar] [CrossRef] [PubMed]
  57. Bocanegra, O.L.; Diaz, M.M.; Teixeira, R.R.; Soares, S.S.; Espindola, F.S. Determination of the lactate threshold by means of salivary biomarkers: Chromogranin A as novel marker of exercise intensity. Eur. J. Appl. Physiol. 2012, 112, 3195–3203. [Google Scholar] [CrossRef]
  58. Meleti, M.; Quartieri, E.; Antonelli, R.; Pezzi, M.E.; Ghezzi, B.; Viani, M.V.; Setti, G.; Casali, E.; Ferrari, E.; Ciociola, T.; et al. Metabolic profiles of whole, parotid and submandibular/sublingual saliva. Metabolites 2020, 10, 318. [Google Scholar] [CrossRef] [PubMed]
  59. Enomoto, K.; Shimizu, R.; Kudo, H. Real-time skin lactic acid monitoring system for assessment of training intensity. Electr. Commun. Jpn. 2018, 101, 41–46. [Google Scholar] [CrossRef]
  60. Gao, W.; Emaminejad, S.; Nyein, H.Y.Y.; Challa, S.; Chen, K.V.; Peck, A.; Fahad, H.M.; Ota, H.; Shiraki, H.; Kiriya, D.; et al. Fully integrated wearable sensor arrays for multiplexed in situ perspiration analysis. Nature 2016, 529, 509–514. [Google Scholar] [CrossRef] [PubMed] [Green Version]
  61. Jia, W.Z.; Bandodkar, A.J.; Valdes-Ramirez, G.; Windmiller, J.R.; Yang, Z.J.; Ramirez, J.; Chan, G.; Wang, J. Electrochemical tattoo biosensors for real-time noninvasive lactate monitoring in human perspiration. Anal. Chem. 2013, 85, 6553–6560. [Google Scholar] [CrossRef] [PubMed]
  62. Baker, L.B.; Wolfe, A.S. Physiological mechanisms determining eccrine sweat composition. Eur. J. Appl. Physiol. 2020, 120, 719–752. [Google Scholar] [CrossRef] [Green Version]
  63. Green, J.M.; Bishop, P.A.; Muir, I.H.; McLester, J.R.; Heath, H.E. Effects of high and low blood lactate concentrations on sweat lactate response. Int. J. Sports Med. 2000, 21, 556–560. [Google Scholar] [CrossRef]
  64. Baker, L.B. Sweating Rate and Sweat Sodium Concentration in Athletes: A Review of Methodology and Intra/Interindividual Variability. Sports Med. 2017, 47, S111–S128. [Google Scholar] [CrossRef] [PubMed] [Green Version]
  65. Vairo, D.; Bruzzese, L.; Marlinge, M.; Fuster, L.; Adjriou, N.; Kipson, N.; Brunet, P.; Cautela, J.; Jammes, Y.; Mottola, G.; et al. Towards addressing the body electrolyte environment via sweat analysis: Pilocarpine iontophoresis supports assessment of plasma potassium concentration. Sci. Rep. 2017, 7, 11801. [Google Scholar] [CrossRef] [PubMed] [Green Version]
  66. Parilla, M.; Ortiz-Gomez, I.; Canovas, R.; Salinas-Castillo, A.; Cuartero, M.; Crespo, G.A. Potentiometric ion patch for on-body electrolyte monitoring in sweat: Toward a validation strategy to ensure physiological relevance. Anal. Chem. 2019, 91, 8644–8651. [Google Scholar] [CrossRef] [Green Version]
  67. Green, J.M.; Pritchett, R.C.; Tucker, D.C.; Crews, T.R.; McLester, J.R. Sweat lactate response during cycling at 30 °C and 18 °C WBGT. J. Sports Sci. 2004, 22, 321–327. [Google Scholar] [CrossRef] [PubMed]
  68. Karpova, E.V.; Laptev, A.I.; Andreev, E.A.; Karyakina, E.E.; Karyakin, A.A. Relationship between sweat and blood lactate levels during exhaustive physical exercise. ChemElectroChem 2020, 7, 191–194. [Google Scholar] [CrossRef]
  69. Gordon, R.S.; Thompson, R.H.; Muenzer, J.; Thrasher, D. Sweat lactate in man is derived from blood glucose. J. Appl. Physiol. 1971, 31, 713–716. [Google Scholar] [CrossRef]
  70. Sakharov, D.A.; Shkurnikov, M.U.; Vagin, M.Y.; Yashina, E.I.; Karyakin, A.A.; Tonevitsky, A.G. Relationship between Lactate Concentrations in Active Muscle Sweat and Whole Blood. Bull. Exp. Biol. Med. 2010, 150, 83–85. [Google Scholar] [CrossRef] [PubMed]
  71. Gil, B.; Anastasova, S.; Yang, G.Z.A. Smart Wireless Ear-Worn Device for cardiovascular and sweat parameter monitoring during physical exercise: Design and performance results. Sensors 2019, 19, 1616. [Google Scholar] [CrossRef] [Green Version]
Figure 1. Baseline cyclic voltammograms with bare Pt housed in needle electrode and different pseudoreference electrodes: (A) Uncoated stainless steel (green curve); Ag coated stainless steel (by UHV) (red curve), Ag/AgCl included as reference electrode with the uncoated steel (blue curve). Inset shows cross section of needle electrode with Pt insulated wire as working electrode. (B) Expanded scale cyclic voltammograms from (A) Ag coated stainless steel (red curve); Ag/AgCl included as reference electrode with the uncoated steel (blue curve).
Chemosensors 09 00195 g001
Figure 2. SEM (Scanning Electron Microscope) images of UHV coated stainless steel needle shaft showing partial delamination of silver layer after washing step. (A) Light zones indicate Ag silver layer; dark zones indicate stainless steel. (B) Higher magnification; layer thickness is 150 nm.
Chemosensors 09 00195 g002
Figure 3. Lactate step change responses of five independently fabricated Pt–stainless steel needle electrodes using an identical protocol. Electrodes numbered (1–5) refers to the corresponding electrode with respect to dynamic response (A) and the resulting calibration using the steady state response (B). Protocol used albumin crosslinked lactate oxidase (LOx) from Pediococcus sp. Measurements in PBS pH 7.4 under rapid stirred conditions where response is independent of stirring rate. Responses normalized to a zero baseline currents. (Mean maximum response 50.3 nA, CV 6.2%).
Chemosensors 09 00195 g003
Figure 4. Lactate needle electrode dynamic responses (0.5–36 mM lactate) in stirred PBS solution shown for electrode made with inner SPEES PES membrane deposited from 20% DMSO solution, albumin crosslinked lactate oxidase (LOx) from Pediococcus sp (25 U/mg) as the enzyme layer and final a final coating sequence of four polyurethane layers deposited from 10, 20, 30 and 40% THF solution. Inset shows the resulting lactate calibration plot, again to 36 mM lactate. Schematic shows side view of the needle electrode with the various enzyme and covering polymer layers over an insulated Pt wire retained in stainless steel tubing as pseudoreference. The cannula housing for the assembly serves as a conduit for needle electrode tissue insertion. The light microscopy images show two different electrode needle tips with the completed polyurethane coating.
Chemosensors 09 00195 g004
Figure 5. Lactate sensors with various inner and outer membrane combinations: 2% SPEES PES, 20% polyurethane (blue diamonds); 2% SPEES PES, 40% polyurethane (red squares); 10% SPEES PES, 40% polyurethane (green triangles). Lactate measured in pH 7.4 phosphate buffer, also containing 40 mg/mL BSA and 10 mM ascorbate. Enzyme layer used 25 U/L lactate oxidase from Pediococcus sp. No baseline correction.
Chemosensors 09 00195 g005
Figure 6. Lactate response in stirred PBS of planar ceramic electrode with polyurethane/SPEES PES covering layers designed for sweat monitoring. Calibration curve for three enzyme sources: 25 U/mg Pediococcus sp (blue circles); 161 U/mg Aerococcus viridans (red circles); 119 U/mg from Lactococcus lactis subsp. cremoris (green circles).
Chemosensors 09 00195 g006
Figure 7. Oxygen dependence of the lactate needle response to different lactate levels. (A) sensor without a polyurethane barrier layer (B) sensor with a 20,30% polyurethane external membrane coating.
Chemosensors 09 00195 g007
Figure 8. Lactate monitoring in Sprague Dawley rats using subcutaneous dorsally implanted needle electrodes. Intravenous Na lactate given via the tail vein. (A,B) represent studies of two different animals. Red curves are blood lactate levels, blue curves are continuously monitored tissue lactate by biosensor. The blue shading in each represents the period of IV lactate infusion.
Chemosensors 09 00195 g008
Figure 9. Lactate monitoring in four subjects (AD) undergoing the similar graded exercise. The blue curves show measurements on saliva collected at defined points of the exercise. The red curves indicate parallel blood lactate measurements. The horizontal grey bars represent the following assay points: pre-exercise, and then at the end of a sequence of 1 min, 10 min, 15 min and 20 min exercise. Shaded bars represent 10 min post-exercise rest periods in two subjects (A,B). Needle electrode used for measurement had a permselective electropolymerized inner barrier layer of poly(phenol red)/poly(4-aminophenol) instead pf SPEES PES. Details of the electropolymerisation are provided in [13].
Chemosensors 09 00195 g009
Figure 10. Sweat lactate monitoring during exercise using different combinations (cycling, running treadmill exercise) as indicated at the top of each figure. High, low, medium in green refer to the level of intensity of the treadmill exercise. Vertical bars represent the specific exercise periods. Breakthrough sweating led to sensor activation and sharp a rise in measured lactate response (A,C). There is increase in lactate level commensurate with the intensity of exercise in two subjects (B,C), but no link to exercise progression in the two other subjects (A,D). The optional facility for wireless transmission was used in (D). Planar electrode schematic with membranes (polyurethane, LOx, SPEES PES) as in Figure 4 with surrounding well (not to scale) (red), shown as inset in (D) with final assembly including optional wireless transmitter strapped to the upper arm.
Chemosensors 09 00195 g010
Table 1. Blood lactate levels observed during current monitoring study.
Measurement ModelBaseline Lactate (mM)Peak Lactate (mM)
Rat–IV infusion0.75–1.03.1–8.0
Human-exercise1.6–5.26.0–12.1
Publisher’s Note: MDPI stays neutral with regard to jurisdictional claims in published maps and institutional affiliations.

