Article

Phenolic Compounds from Irradiated Olive Wastes: Optimization of the Heat-Assisted Extraction Using Response Surface Methodology

by
Joana Madureira
1,2,3,
Bruno Melgar
2,
Celestino Santos-Buelga
3,4,*,
Fernanda M. A. Margaça
1,
Isabel C. F. R. Ferreira
2,
Lillian Barros
2 and
Sandra Cabo Verde
1,*
1
Centro de Ciências e Tecnologias Nucleares (C2TN), Instituto Superior Técnico, Universidade de Lisboa, 2695-066 Bobadela, Portugal
2
Centro de Investigação de Montanha (CIMO), Instituto Politécnico de Bragança, Campus de Santa Apolónia, 5300-253 Bragança, Portugal
3
Grupo de Investigación en Polifenoles (GIP-USAL), Facultad de Farmacia, Universidad de Salamanca, Campus Miguel de Unamuno s/n, 37007 Salamanca, Spain
4
Unidad de Excelencia Producción, Agrícola y Medioambiente (AGRIENVIRONMENT), Parque Científico, Universidad de Salamanca, 37185 Salamanca, Spain
*
Authors to whom correspondence should be addressed.
Submission received: 29 June 2021 / Revised: 30 July 2021 / Accepted: 11 August 2021 / Published: 19 August 2021

Abstract

:
Olive pomace, an environmentally detrimental residue generated during olive oil extraction, contains bioactive compounds in demand by the food industry. To valorize this waste product a suitable yield for the extraction process is required. Heat-assisted extraction of bioactive compounds from olive pomace was optimized by a circumscribed central composite design and response surface methodology. Our previous studies indicated that irradiation could improve 2.4-fold the extractability of the main phenolic compounds from olive pomace. The effect of extraction time, temperature and solvent concentration on the yield of polyphenols from irradiated olive pomace at 5 kGy was tested. Hydroxytyrosol-1-β-glucoside, hydroxytyrosol, tyrosol and caffeic acid were quantified by High Performance Liquid Chromatography to calculate the total polyphenol content. The optimal general conditions by RSM modeling were extraction time of 120 min, temperature of 85 °C, and 76% of ethanol in water. Using these selected conditions, 19.04 ± 1.50 mg/g dry weight, 148.88 ± 8.73 mg/g extract of total polyphenols were obtained, representing a yield of 13.7%, which was consistent with the value predicted by the model. This work demonstrated the potential of residues from the olive oil industry as a suitable alternative to obtain compounds that could be used as ingredients for the food industry.

1. Introduction

The olive industry is one of the most important activities in the Mediterranean region countries, which produce 95% of the world’s olive oil. This industry generates large amounts of wastes, where many potentially interesting compounds remain. Olive pomace is rich in bioactive compounds that can be divided in several classes: simple phenols (e.g., tyrosol and hydroxytyrosol) and their derivatives, benzoic and cinnamic acid derivatives (e.g., gallic acid, syringic acid, caffeic acid, p-coumaric acid, verbascoside), flavonoids (e.g., apigenin, luteolin, rutin) and secoiridoids (e.g., oleuropein and oleuropein aglycone isomers) [1,2,3]. Although olive oil wastes can have a negative impact to the environment when discharged without treatment, the recovery of these compounds increases the sustainability of the sector, obtaining high added-value products with low production costs and reducing the environmental risk. In fact, society’s growing demand for healthier foods challenges the scientific community to search and develop new ingredients [4]. Nowadays, with the COVID-19 pandemic situation, more efforts have to be done to develop sustainable and modern food systems. Although the lack of information in correlating the consumption of bioactive ingredients with the prevention or recovery from COVID-19 disease, it became even more imperative to have a healthier immune system which can be achieved with the supplementation of consumers’ diets with vitamins, tannins, polyphenols, flavonoids, bioactive lipids and herbs [5]. In this respect, the compounds obtained from olive pomaces could be both a suitable alternative in the food industry to the use of synthetic antioxidants in order to improve the quality of foods, as well as employed in the formulation of functional foods [6].
Numerous studies have reported the extraction of bioactive compounds from olive pomace [1,3,7,8,9]. The extraction of these compounds can be performed by using conventional or emerging technologies, which can be advantageous since they take reduced extraction time, accelerate heat and mass transfer, increase the extraction selectivity and purity, and use safer solvents comparing to the conventional ones [10,11]. Alu’datt et al. [12] achieved the highest phenolic content extracted from olive pomace using methanol as solvent and performing the extraction for 12 h at 70 °C. Also, Vitali Čepo et al. [13] tried to optimize the extraction of hydroxytyrosol, tyrosol and oleuropein from olive pomace using simple solvent extraction and different conditions (solvent, pH, temperature and duration of extraction). The results demonstrated that the optimum conditions for phenols were 120 min at 70 °C using 60% ethanol as extraction solvent, at solvent-to-sample ratio 5:1 (v/w). Under these conditions, high recoveries of oleuropein, tyrosol and hydroxytyrosol were obtained averaging 115.14 ± 0.19, 86.05 ± 0.34 and 81.80 ± 0.41 mg/kg of fresh olive pomace, respectively. More recently, also Böhmer-Maas et al. [14] studied the extraction optimization of individual compounds from olive pomace, observing that 80% methanol, 45 °C and 180 min were the optimal conditions to recover 154.90 mg/kg dry weight of hydroxytyrosol, 1115.40 mg/kg dry weight of tyrosol, and 153.20 mg/kg dry weight of syringic acid. Zuorro [15] evaluated the effects of temperature, extraction time, solvent composition and liquid-to-solid ratio on the yield of phenolics extraction from olive pomace, showing that temperature was the most influential factor.
Ionizing radiation, a clean and environmentally friendly technology, has proven to be capable of improving phenolic extraction and antioxidant activity on industrial wastewater [16], fresh fruits such as cherry tomatoes [17], raspberries [18,19] and strawberries [20], and dried medicinal plants [21]. More recently, the potential of gamma radiation as an enhancer for phenolic compounds extraction and antioxidant capacity has been shown, with the application of low doses (5 kGy), enough to increase the extractability of the main phenolic compounds from olive pomace by 2.4-fold compared to non-irradiated samples [1].
The current study aims to explore the extraction of some phenolic compounds from olive pomace by heat-assisted extraction (HAE) using a circumscribed central composite design (CCCD) testing different conditions, namely the percentage of ethanol (0–100%), extraction times (20–120 min) and temperature (25–85 °C). The olive pomace samples used in this work were the irradiated ones for which the best results in a previous work of the authors were obtained [1]. The characterization of the individual phenolic compounds was performed, summarized and modeled by Response Surface Methodology (RSM) in order to understand the combined effects of operating variables and to maximize the responses analyzed. RSM is an efficient statistical method for optimizing processes and was originally described by Box & Wilson [22] as a statistical and mathematical tool. RSM allows a more efficient and easier presentation and interpretation of experiments compared to other methodologies. To the best of our knowledge, the optimization of tyrosol, hydroxytyrosol-1-β-glucoside and caffeic acid recovery by RSM has never been reported.

2. Materials and Methods

2.1. Standards and Reagents

HPLC-grade acetonitrile was obtained from Fisher Scientific (Lisbon, Portugal). Ethanol and formic acid were acquired from Sigma-Aldrich (St. Louis, MO, USA) and Honeywell (Charlotte, NC, USA), respectively. Caffeic acid (≥99%) was purchased from Extrasynthese (Genay, France), whereas hydroxytyrosol (≥99%) and tyrosol (≥98%) were obtained from Applichem (Darmstadt, Germany) and TCI (Tokyo, Japan), respectively. Water was treated in a Milli-Q water purification system (Merck Millipore, Burlington, MA, USA).

2.2. Olive Pomace Samples

Samples used in this work were olive pomaces collected in 2018 from UCASUL (União de Cooperativas Agrícolas do Sul, located in the Alentejo region, Alvito, Portugal) and further submitted to an irradiation-assisted extraction [1].

2.3. Irradiation Experiments

Irradiation was carried out in a Co-60 semi-industrial unit (with an activity of 187 kCi in April 2018) located at Technological Unit of Radiosterilization (UTR-IST), University of Lisbon (Portugal). Sealed bags (10 × 7 cm) containing 30 g of extracted olive pomace were irradiated at room temperature at 4.9 kGy using a dose rate of 13 kGy/h. The absorbed doses were measured by Amber Perspex routine dosimeters [23] (dose uniformity DUR = 1.2). The irradiations were performed in triplicate.

2.4. Heat-Assisted Extraction (HAE)

All irradiated olive pomace samples were immediately lyophilized (Heto CD8, Allerod, Denmark) and stored until used. Heat assisted extraction (HAE) was performed according to a methodology previously described by Pinela et al. [24], using 0.6 g of the olive pomace with 20 mL of solvent with different conditions previously defined by the RSM design (Table 1): time (t, 20 to 120 min), temperature (T, 25–85 °C) and ethanol proportion (S, 0–100%). The solid/liquid ratio (S/L) was kept constant at 30 g/L. After the extraction in a thermostatic water bath under continuous electromagnetic stirring, the samples were centrifuged (6000 rpm for 10 min at room temperature) and filtered (paper filter Whatman nº 4) and the supernatant was collected and evaporated at 35 °C under reduced pressure (rotary evaporator Büchi R-210, Flawil, Switzerland) to remove the solvent. The obtained residue was redissolved in ethanol: H2O (20:80, v/v) and the solution was divided into two portions for HPLC-DAD and extraction yield analysis [25].

2.5. Analysed Responses

2.5.1. Extraction Yield

The residue resulting from each extraction was determined gravimetrically using crucibles. A portion (5 mL) of the redissolved extraction liquid was dried in an oven (Memmert, Schwabach, Germany) at 60 °C to evaporate the ethanol, and then at 105 °C to evaporate the water. Afterwards, the dried sample was cooled down and the residue was calculated by difference. The results were expressed in percentage (%, w/w).

2.5.2. Phenolic Fingerprinting and Quantification

The phenolic fingerprinting of the extracts was determined by High Performance Liquid Chromatography (HPLC) (Prominence CBM 20-A, Shimadzu, Kyoto, Japan) with UV-DAD detector. The HPLC column was a Kinetex C18 XB-C18 (5 μm, 250 mm, 4.0 mm, Phenomenex, Torrance, CA, USA) and the detection was made at 280, 330 and 370 nm as preference wavelengths. The phytochemical molecules were analyzed using a previously described methodology [26]. Each re-dissolved solution (3 mL) was filtered through an LC filter disk (nylon filter 0.2 µm, 25 mm diameter, Whatman™, GE Healthcare, Buckinghamshire, UK). Quantitative analysis was performed using 9-level calibration curves (0.78–200 µg/mL) obtained from commercial standards of hydroxytyrosol (y = 19203x + 8392.3, R2 = 0.9999), tyrosol (y = 11762x − 7109.5, R2 = 0.9999) and caffeic acid (y = 38473x − 6243.4, R2 = 0.9996). The results were expressed in mg per g of dry weight (Y1–5) and extract (Y6–10), and the final responses processed for all compounds were summed up to calculate total phenolic content (TPC).

2.6. Extraction Optimization by Response Surface Methodology

2.6.1. Screening Test of Factors and Level Range for Phenolic Compounds Extraction

Primary selection and evaluation of factors and levels were carried out to determine the appropriate experimental domain for the RSM design. Independent variables, which include time (t), temperature (T) and solvent percentage (S) were preliminarily tested.

2.6.2. Experimental Design

A circumscribed central composite design (CCCD) was used, consisting of 28 randomized runs with six replicates at the central point (three replicates per condition). Fixed variables in the designed experiment were defined as X1: time (20–120 min), X2: temperature (25–85 °C), and X3: solvent concentration (0–100% ethanol/water). These variables were selected from a screening analysis, based on experimental data previously obtained by the research group. Each factor was tested at five different levels.
The dependent variable studied were expressed according to eleven responses (Y) format values: the total extraction yield (Y11) and levels of hydroxytyrosol-1-β-glucoside (Y1 and Y6), hydroxytyrosol (Y2 and Y7), tyrosol (Y3 and Y8) and caffeic acid (Y4 and Y9) as well as the total amount resulting from the sum of the four compounds, TPC, (Y5 and Y10). To be clear, the results were expressed in mg of phenolic per g of dry weight (mg/g DW) (Y1–5) and in mg of phenolic per g of extract residue (mg/g ext.) (Y6–10), both used to evaluate the total phenolic purity in the extract.
The experimental data were fitted to the second-order polynomial model (Equation (1)) to obtain the regression coefficients (b) using Statgraphics Centurion XVI (StatPoint Technologies, Inc., Warrenton, VA, USA) and Design expert 12.0.1. (Stat-Ease, Inc., Minneapolis, MN, USA) software programs. The generalized second-order polynomial model used in the response surface analysis was the following:
Y   = b 0 + i = 1 k b i X i + i = 1 k b ii X i 2 + j = i + 1 k b ij X i X j
where Y is the dependent variable (response variable) to be modelled, b0 is a constant coefficient (intercept); bi, bii and bij are the coefficients of the linear, quadratic, and interactive terms, respectively; k is the number of tested variables (k = 3); Xi and Xj are the independent variables.

2.7. Statistical Analysis

The analysis of variance (ANOVA) was carried out to determine individual linear, quadratic and interaction regression coefficient as well as model significance using Statgraphics Centurion XVI software (StatPoint Technologies, Inc.), and the fitness of the polynomial equation to the responses was estimated using the coefficient of determination (R2). The significance of all the terms of the polynomial equation was analysed statistically by computing the F value at p < 0.05. Design expert software was used to optimize the conditions of extraction throughout response surface methodology (RSM) with their respective 3D graphs and statistics diagnostics, such as predicted vs actual, residuals vs predicted, and run vs predicted points, which were assessed along the prior information mentioned in order to fit the model.

3. Results and Discussion

A previous study by the authors identified hydroxytyrosol, hydroxytyrosol-1-β-glucoside and tyrosol as the most abundant phenolic compounds present in olive pomace [1]. It was also verified that irradiation at 5 kGy increased the extractability of bioactive compounds from olive pomace by 2.4-fold compared to the non-irradiated ones. Based on this information, the aim of this work was to optimize the extraction of these three compounds for the 5 kGy irradiated samples. Caffeic acid was chosen to be studied in representation of phenolic acids present in olive pomace.

3.1. Single-Factor Effects for Polyphenolic Extractions

The results of 28 runs (all of them analysed in triplicate) using a circumscribed central composite design (CCCD) are given in Table 1, that includes the experimental design and the corresponding response data. The different response criteria used (yield and Y1–11) are interesting for industrial sectors that promote the recovery of high added-value compounds from agro-industrial residues that can be used as food ingredients. The applied response criteria provide important information about the amount of olive wastes needed to achieve a certain quantity of the target compounds and their concentration in the obtained extracts.
The extraction yield ranged from 2.89 to 19.30% (Table 1). The higher value was achieved with the run 26, which combined the following conditions: t = 70 min, T = 55 °C and S = 50%. A lower yield (10.88%) was obtained by Chanioti & Tzia [27] in the ultrasound-assisted extraction of oil from olive pomace at 50 °C.
TPC (Y5) ranged from 2.60 to 21.42 mg/g DW and the highest content was attained at the run 12. These values are higher than those reported by Böhmer-Maas et al. [14], which obtained up to 1.48 mg/g DW performing an extraction of 180 min with 80% ethanol in water solvent and at 45 °C.

3.1.1. Effect of Extraction Time on Polyphenolic Content and Extractability Yield

In order to understand the effect of time on phenolic compound extraction (Y1–10) and yield (Y11) from olive pomace, the experimental tests were carried out at different extraction times (X1 = 20, 40.3, 70, 99.7 and 120 min), while the other two factors (X2 = Temperature and X3 = Solvent concentration) were adjusted according to the defined CCCD points presented in Table 1.
Table 2 shows the ANOVA estimated coefficients. The extractability of compounds had a small but positive trend implying that, in the range of the used extraction times, the extraction of compounds was higher when longer times were employed. Variability within the collected dataset had shown significant effect (p < 0.05, highlighted in green) in some of the tested phenolic compounds, but no significant repercussion on the extraction yield (grey coloured). This information is displayed at different points in the responses (Table 1) and is shown in Table 2, at the decoded optimization values section. Numerically, inflection points in the responses are mostly at the long end positive points tested (120 min), but also at some lower ones, e.g., 68 min for Y2 and Y5. The lowest inflection point (53 min) is located at Y1, although this response showed no significant effect. Vitali Čepo et al. [13] and Böhmer-Maas et al. [14] also observed higher amounts of polyphenolic content and antioxidant activity in olive pomace with long extraction times, 120 min and 180 min, respectively. Furthermore, Garcia-Castello et al. [28] reported maximum total polyphenols content and antioxidant activity at 413 and 270 min, respectively, in extracts from wastes of grapefruit (Citrus paradisi L.)
The range of temperature tested in this experimental design comprised five different levels (X2 = 25, 37.2, 55, 72.8 and 85 °C). Many phenolic compounds present thermolabile characteristics and it is important to understand which temperatures are within the safe zone before occurring degradation, along with the identification of optimum recovery points.
Positive trend was also found for every analysed response with statistical significance (p < 0.05) (Table 2). Optimum decoded values for temperature were 85 °C in almost all responses, except for Y4 (73 °C) and Y6 (81 °C). It worth noting that the studied compounds seemed to be better extracted at maximum tested temperatures (85 °C). In fact, it is known that high temperatures improve the extraction efficiency [29], since it might weaken the cell membranes and hydrolyze the bonds of phenolic compounds (phenol–protein or phenol–polysaccharide) thus increasing the solubility of the compounds in the solvent [30]. The obtained results are consistent with those reported by Vitali Čepo et al. [13] who determined the higher extraction yields from olive pomace at temperatures of 70 °C and above. Also, Böhmer-Maas et al. [14] and Alu’datt et al. [12] demonstrated the higher extraction of phenolic compounds from olive pomace at higher temperatures (70 °C) using methanol as solvent.

3.1.2. Effect of Solvent Concentration on Polyphenolic Content and Extractability Yield

For solvent concentration monitoring, the whole spectrum of mixture of the two solvents were evaluated (X3 = 0, 20.3, 50, 79.7 and 100% of ethanol in water). Besides exhibiting significant statistical differences (p < 0.05) in all the responses (Table 2), the employed broad ranges allowed to distinguish the maximum inflection point in the eleven different responses with strong variability among them. The results described better yield recovery on slightly polar solvents but very variable percentages within the different phenolic compounds. In fact, the optimum decoded value for the yield extraction (Y11) was 28% of ethanol. The highest inflection points (100%) are located at Y7–Y10, whereas the lowest ones (26 to 45%) are located at Y1–Y6).
The selection of a suitable extraction solvent is one of the most important steps in assuring a successful extraction and the identification of optimal points is mandatory [31]. Thus, even using the same solvents, different percentages of combination are often reported [13,15,24,28,30], which may be due to the large diversification of polyphenolic compounds present in the different matrices. In previous studies, the ethanol percentage to obtain the optimum recoveries of compounds could also be very variable. A 60% ethanol in water was selected as optimal condition for extracting hydroxytyrosol, tyrosol and oleuropein from olive pomace by Vitali Čepo et al. [13], whereas for Citrus paradisi L. wastes the maximum total polyphenol content and total antioxidant activity were achieved using 20% and 50% aqueous ethanol, respectively, as extraction solvent [28]. On the other hand, for Hibiscus sabdariffa calyces the optimal condition to extract anthocyanins was using water (0% ethanol) [24] using HAE, probably due to the polarity of anthocyanins. Another study using methanol as solvent verified that the highest individual phenolics extracted from olive pomace was achieved at the concentration of 80% methanol [14].
Moreover, the obtained results demonstrated that the interaction between extraction temperature and ethanol concentration was statistically significant for all the studied phenolic compounds. On the other hand, the interaction between extraction time and ethanol concentration presented no significant effect for all the studied responses.

3.2. Optimization of HAE Process in Olive Pomace

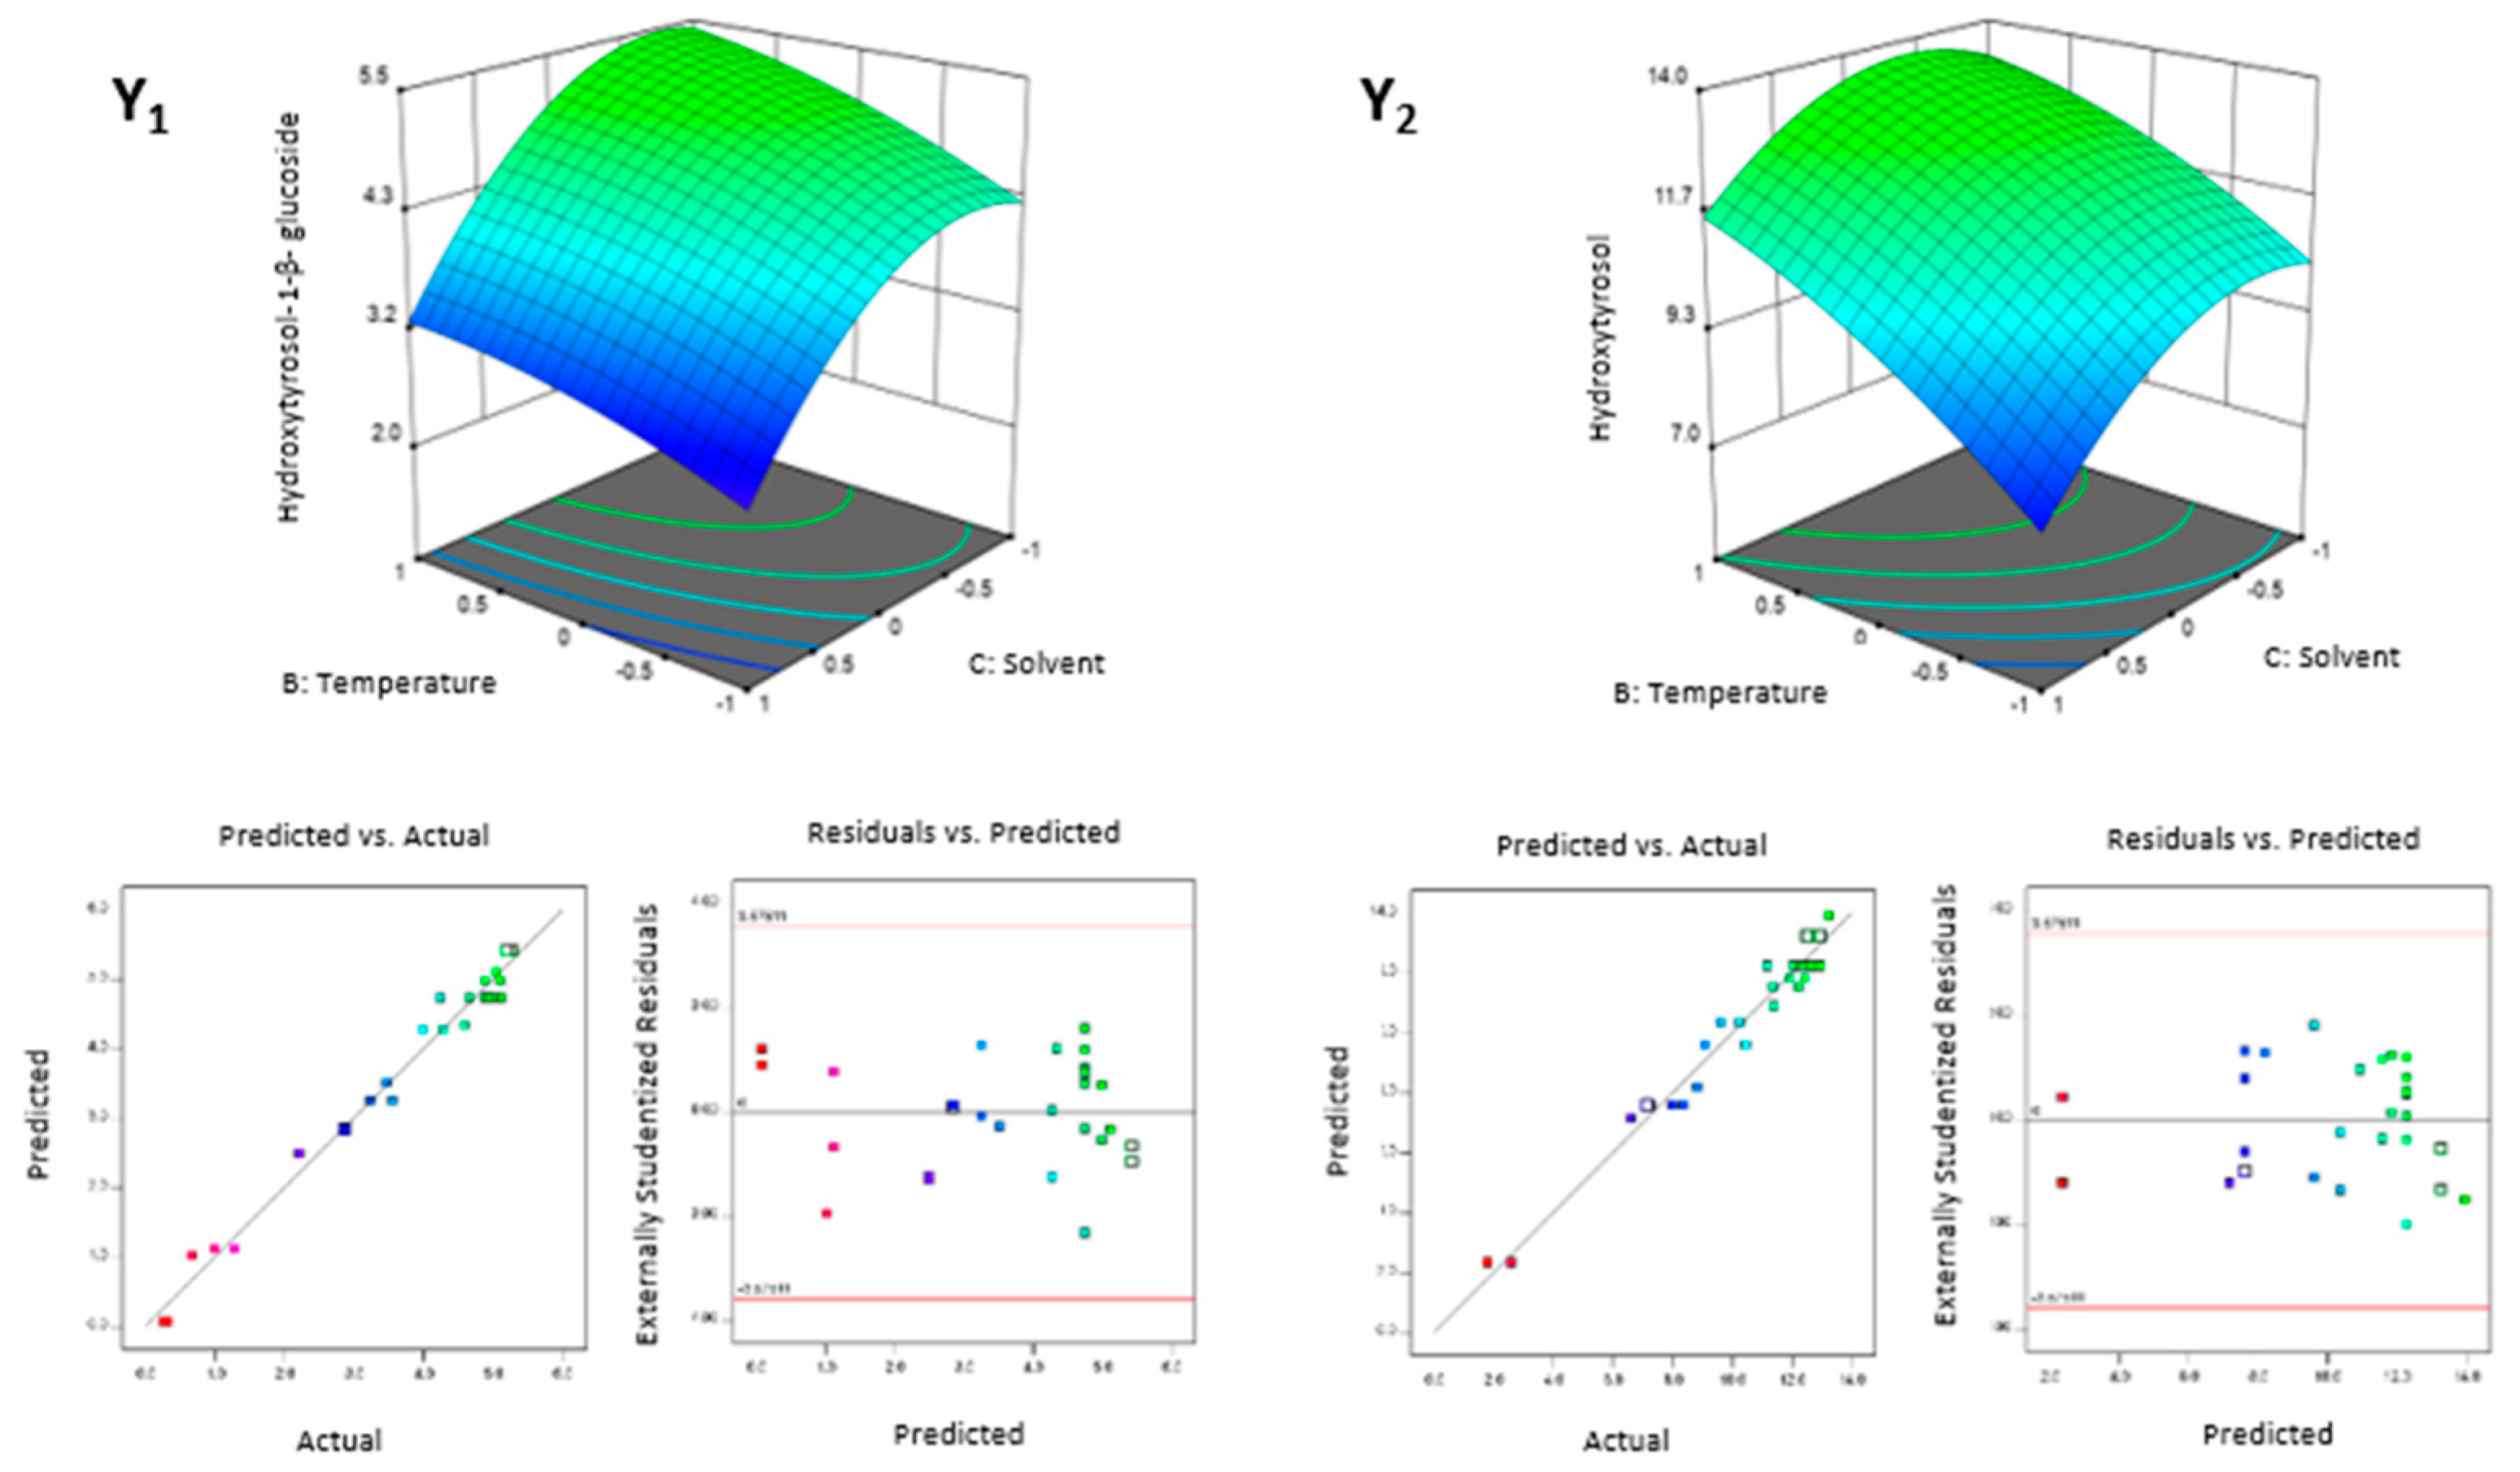
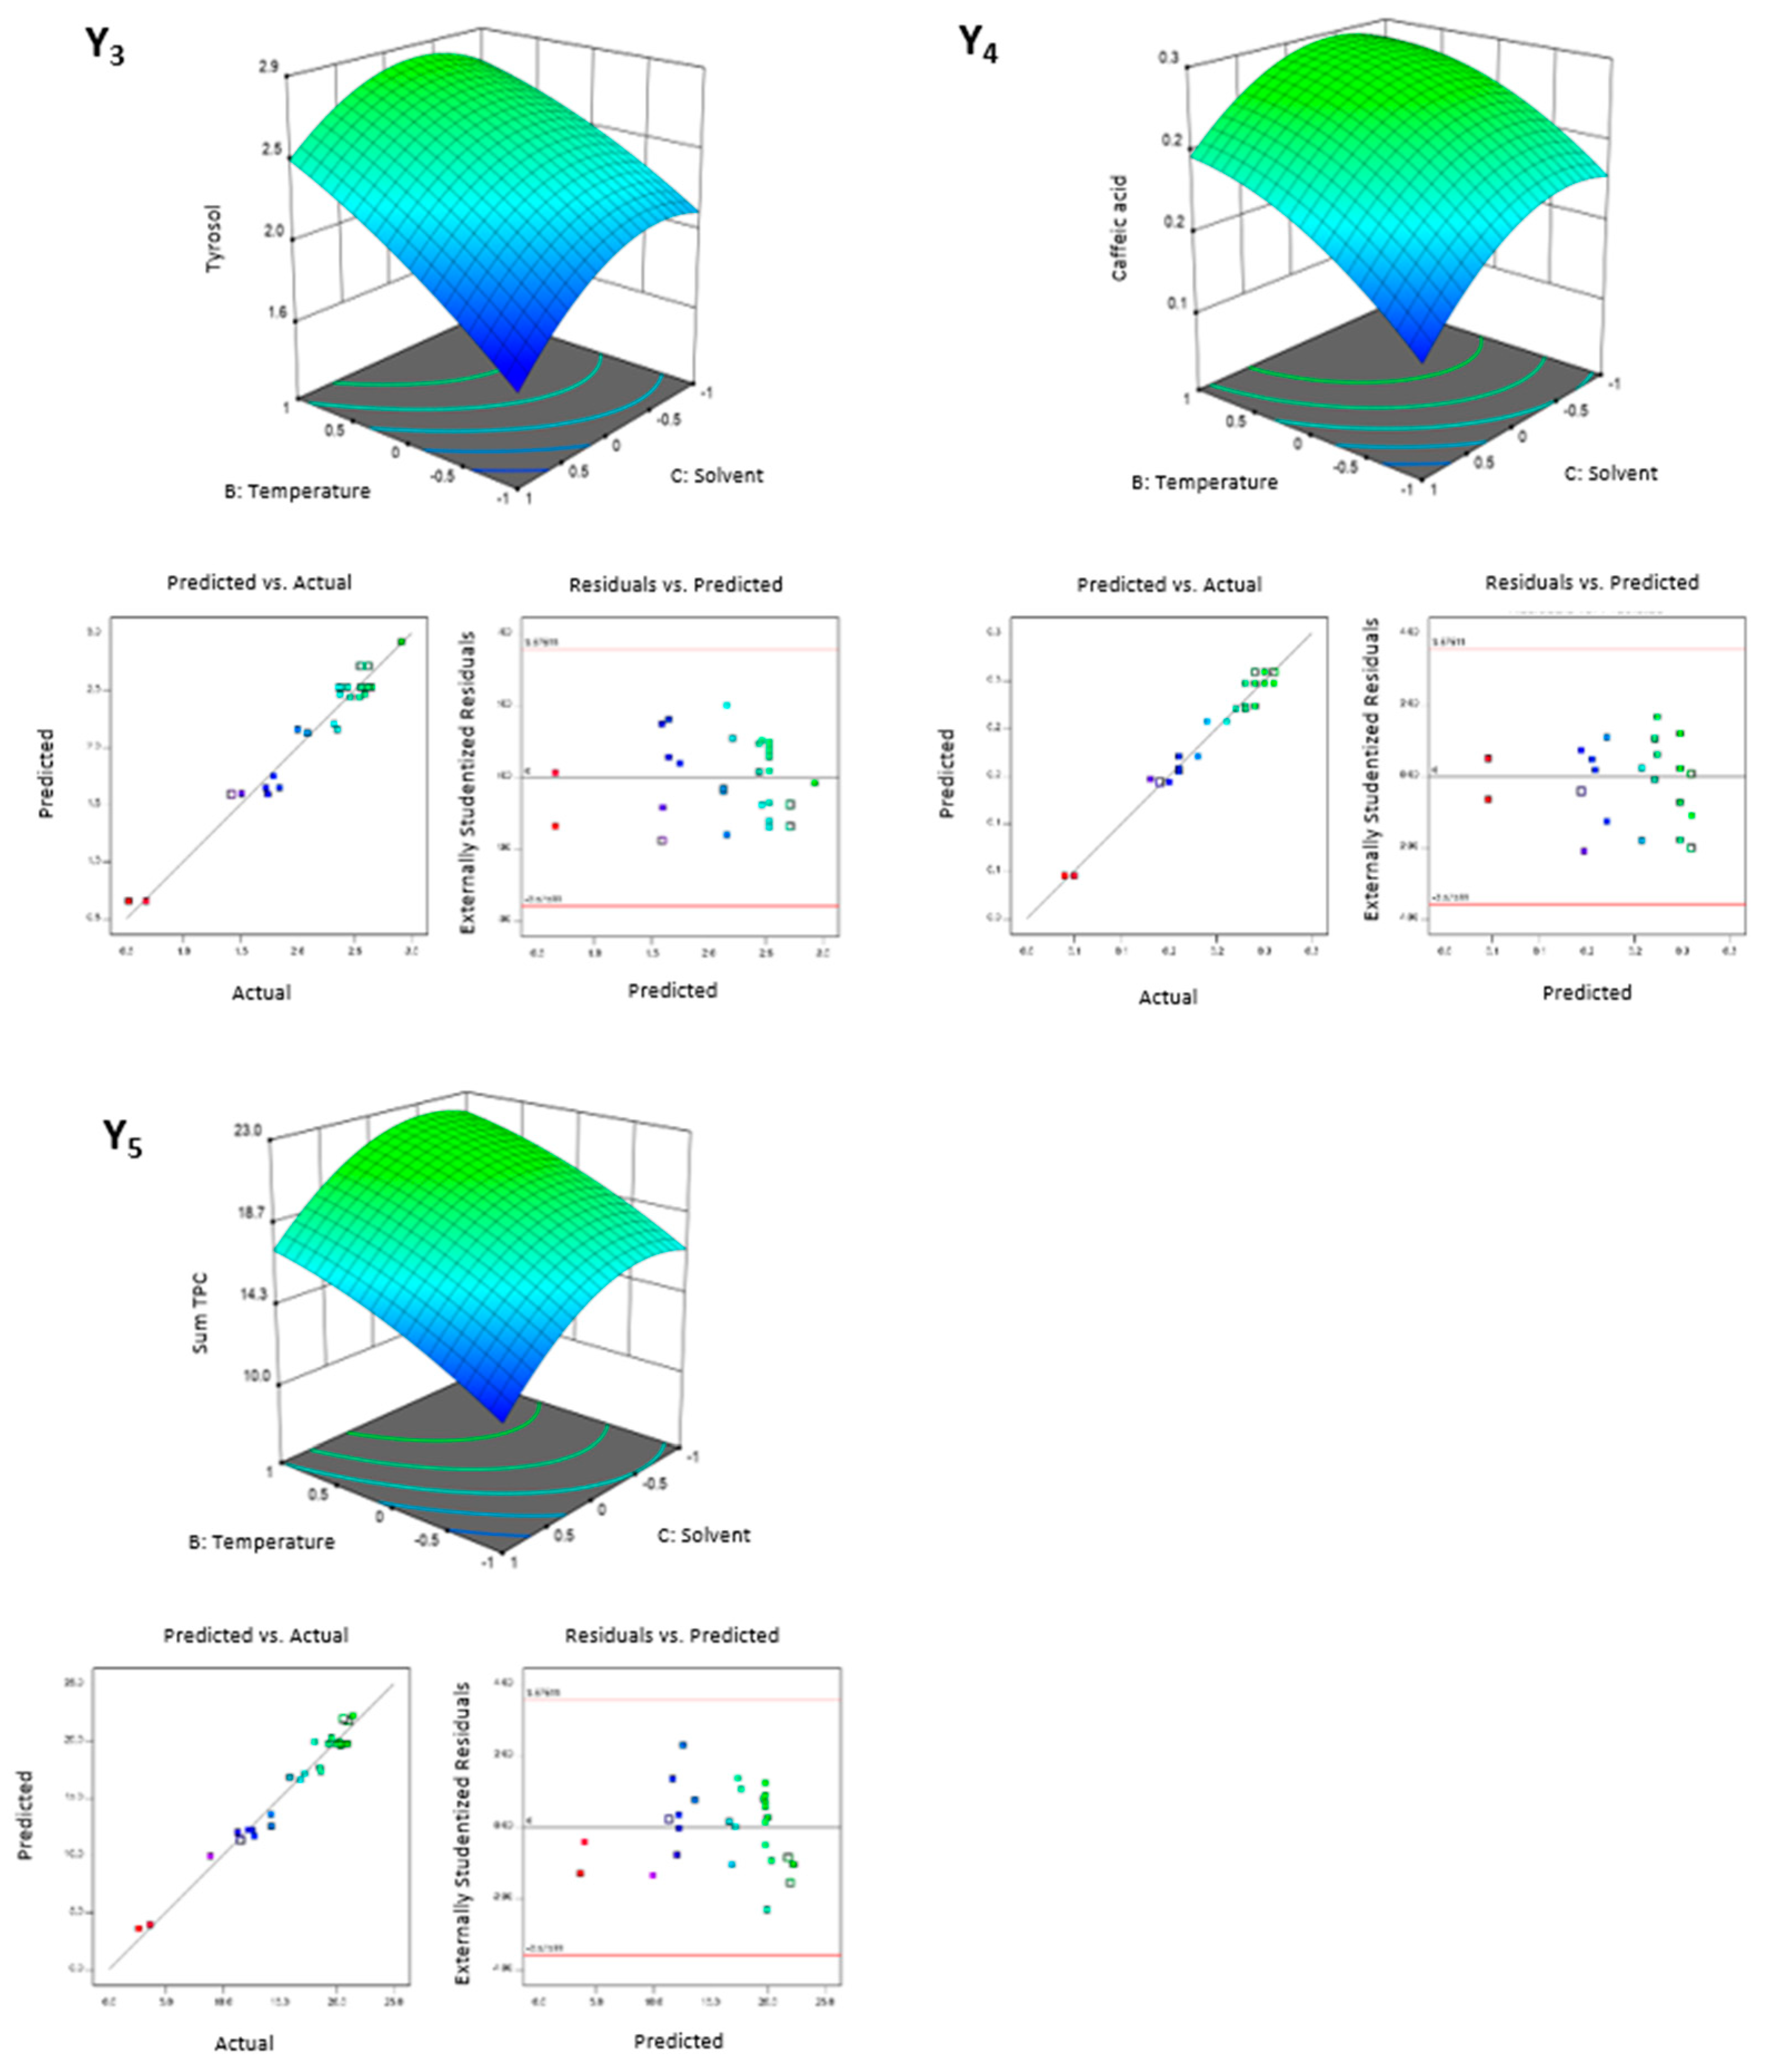
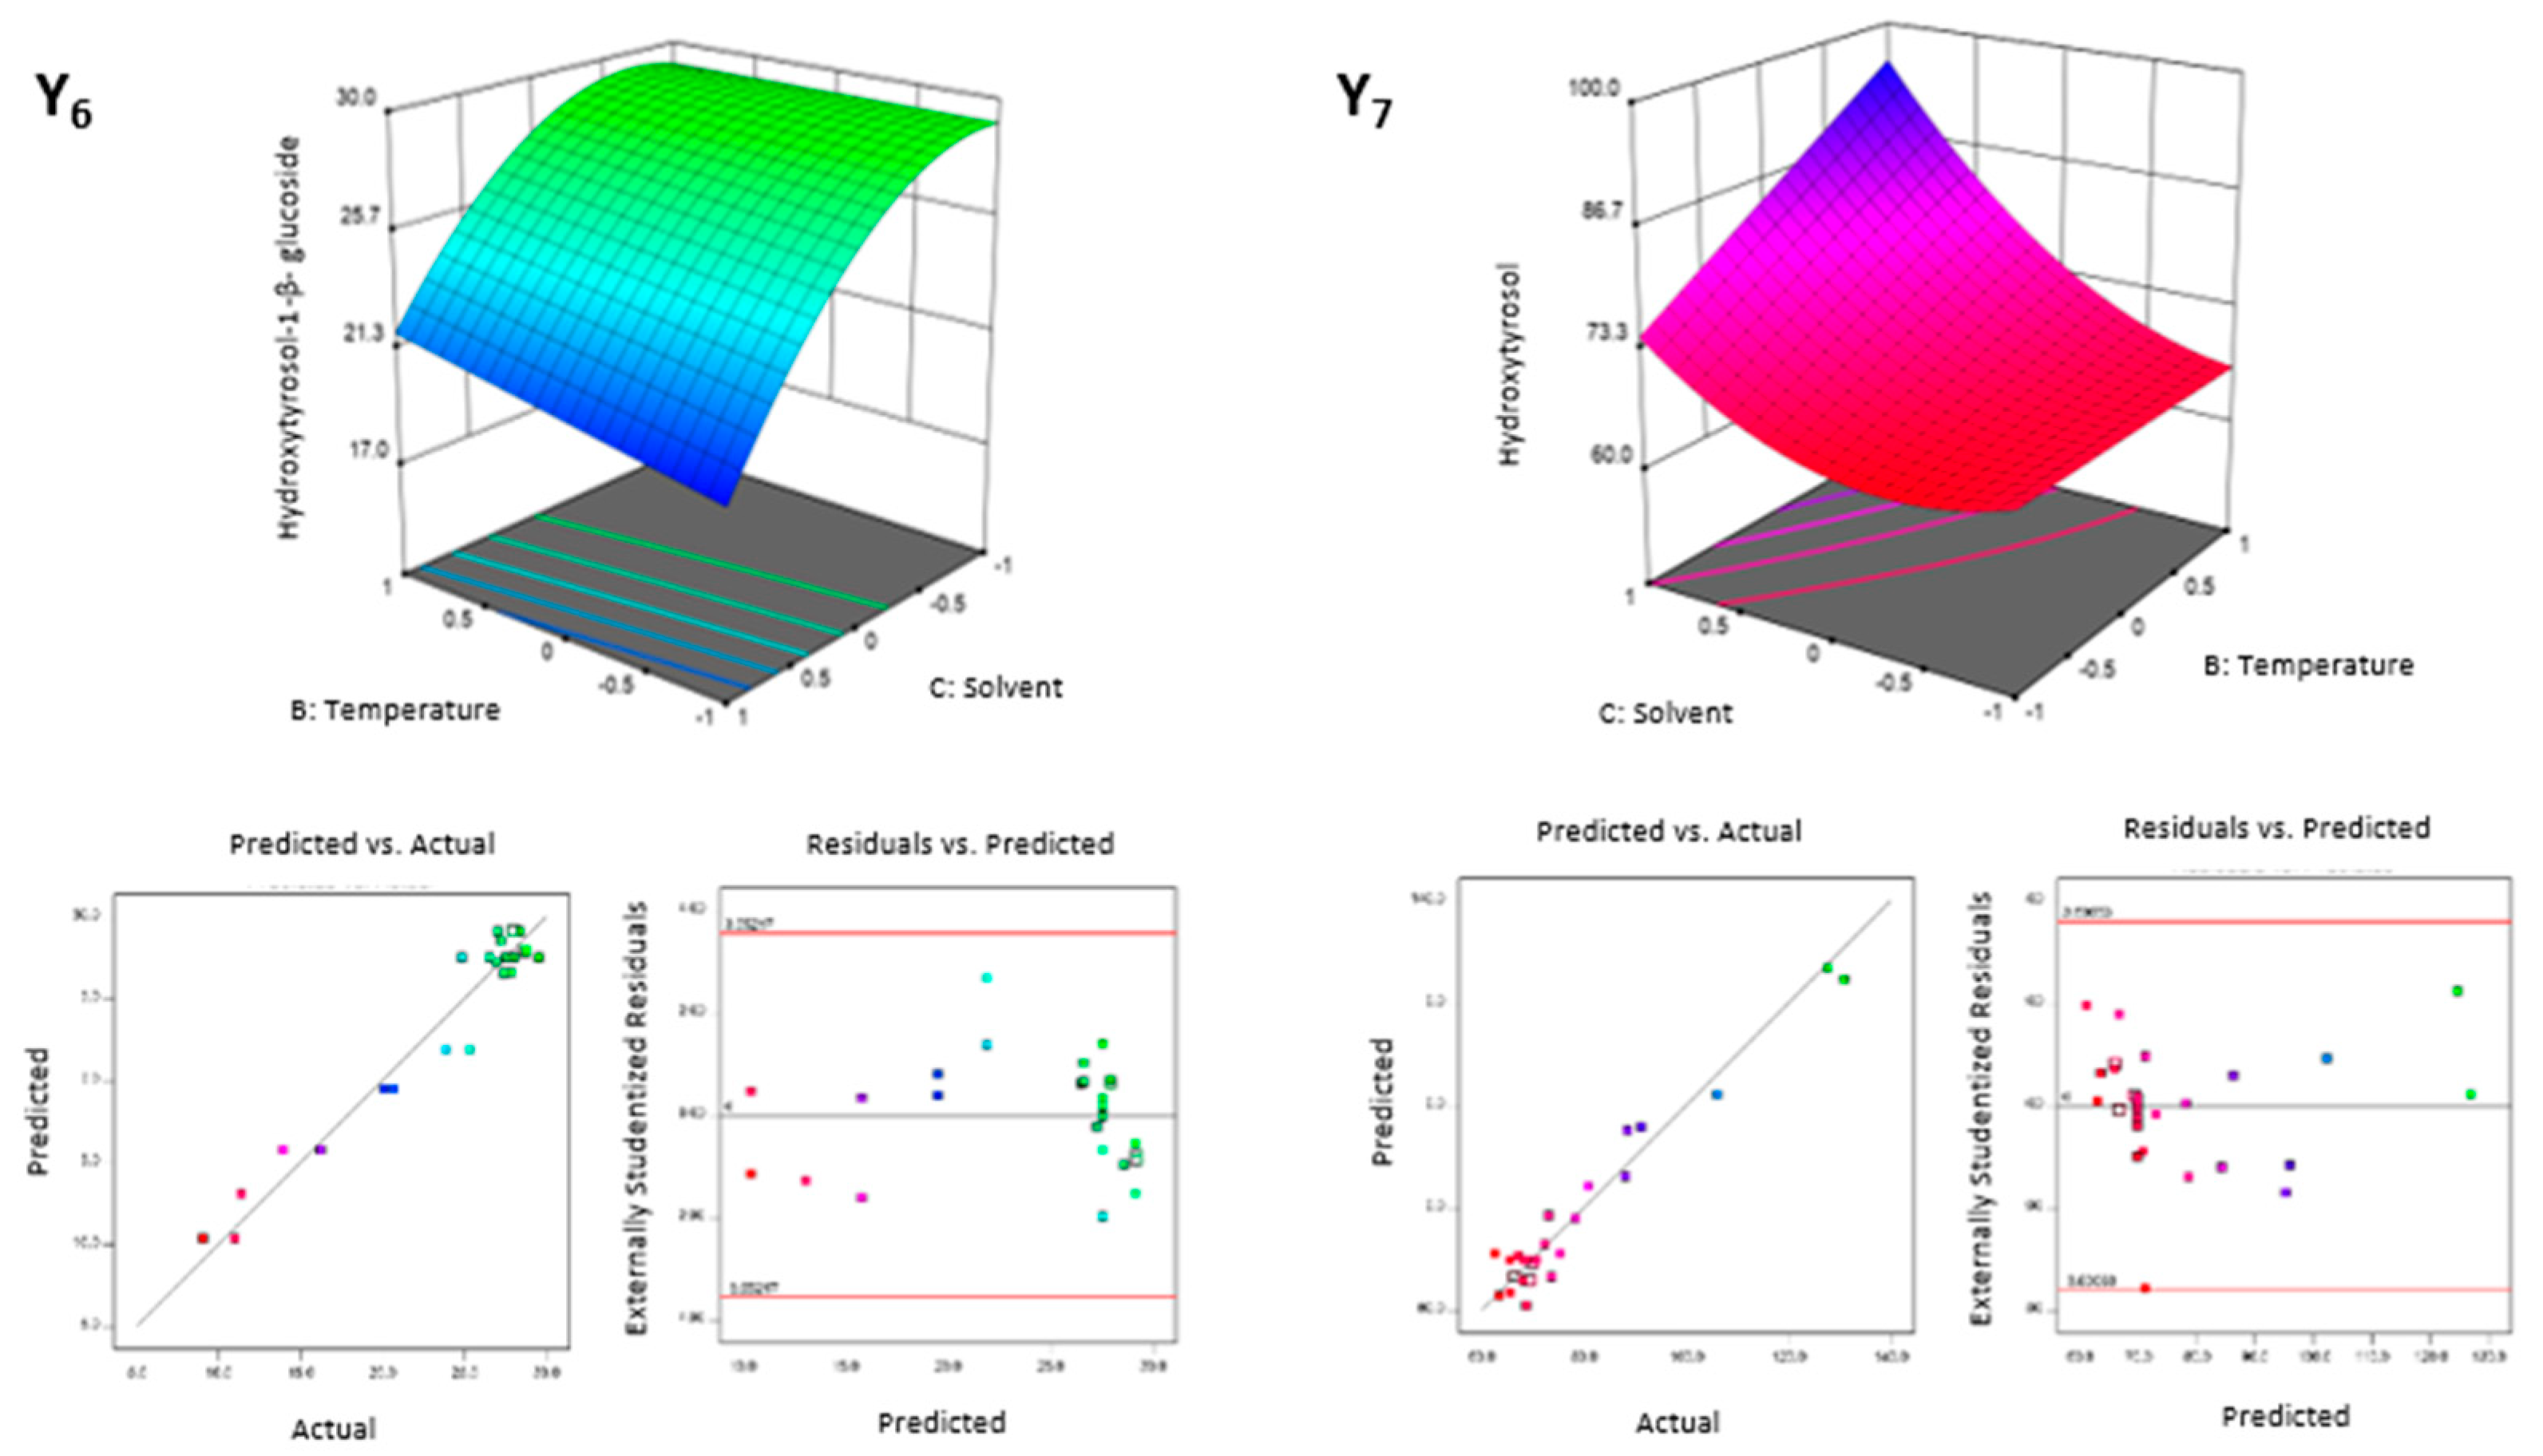
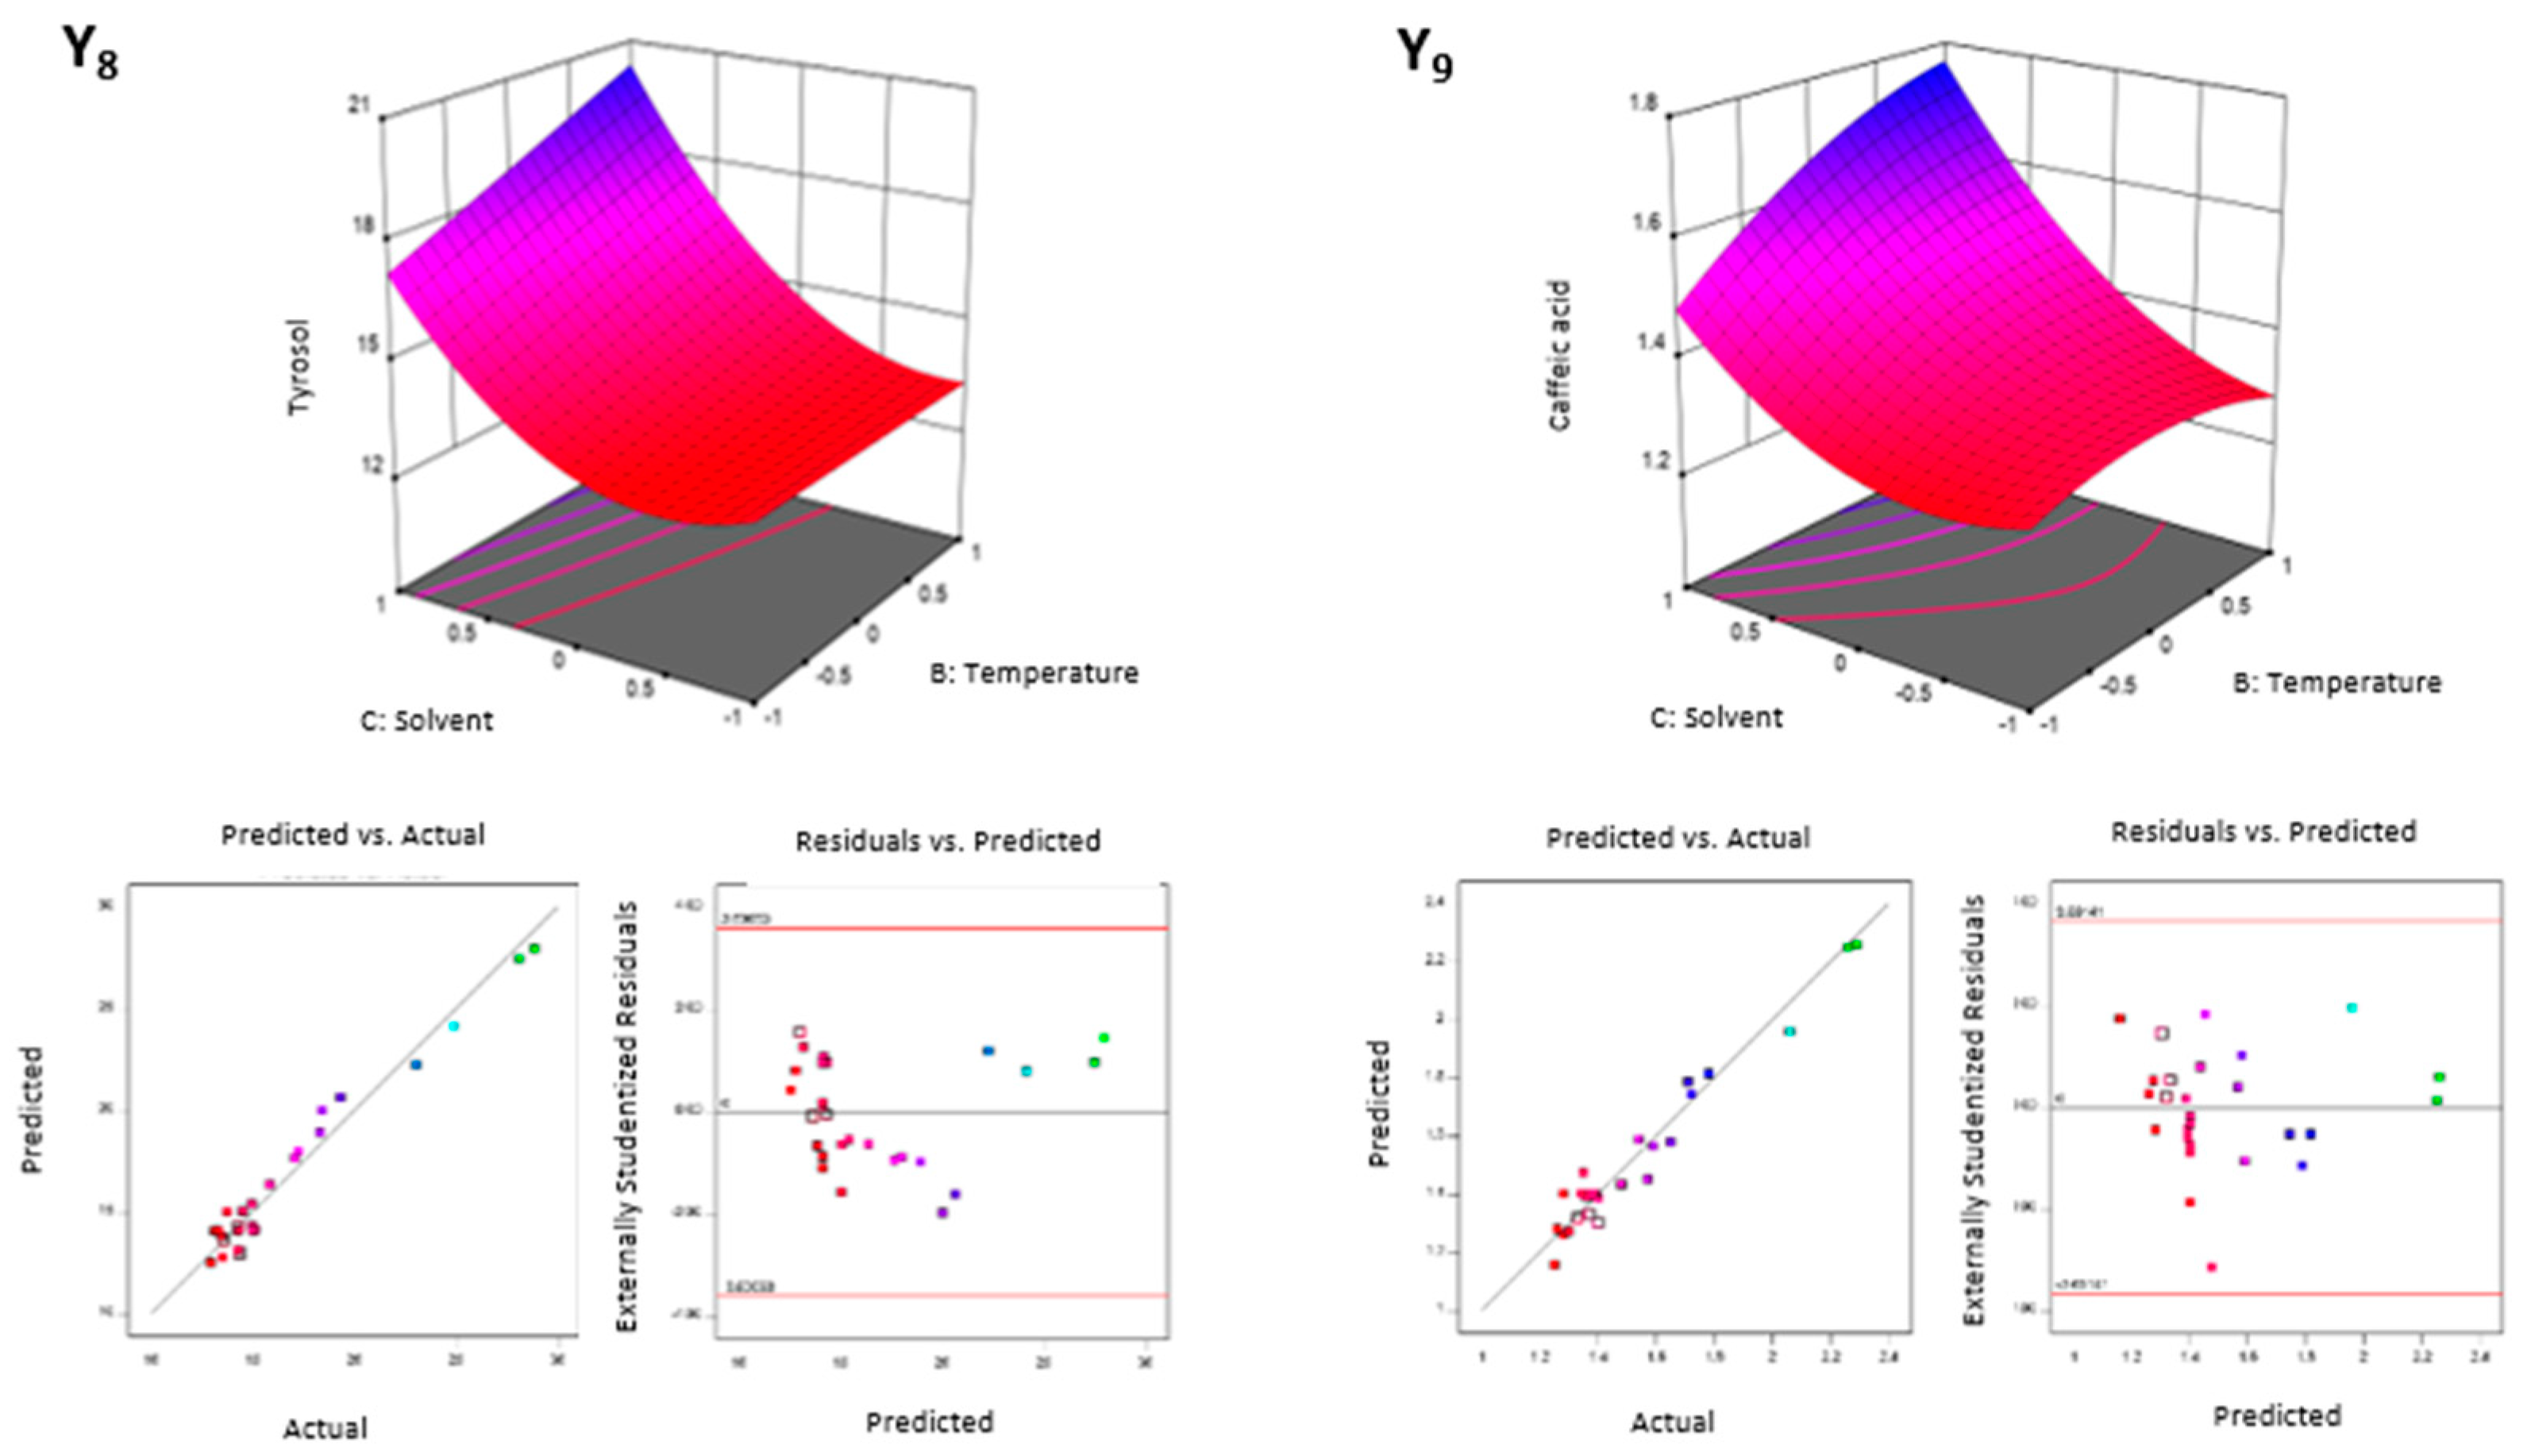
3.2.1. Extracting Modelling and Analysis of Variance

In this study, a one-block experiment circumscribed central composite design (Table 2) based on RSM was used to optimize the HAE of TPC from olive pomace. For this purpose, a complete response analysis was performed with statistical determination of outliers of the raw data, followed by an ANOVA analysis (Table 2) coupled with numerical and graphical statistical diagnostics (Figure 1, Figure 2, Figure 3, Figure 4 and Figure 5).
The increasing of the yield during HAE for longer times has been explained by several authors due to the mechanical effect of stirring coupled with the physicochemical parameters employed which causes a disruption of plant cell releasing the inner compounds embedded. Additionally, mass transfer is enhanced with small particles of the matrix analyzed due to the increment of the contact surface area between solvent and plant material [32,33].
According to the performed analysis of variance, model adjustment and the coefficients for a subsequent second order equation are shown in the first part of Table 2. As mentioned above, for the significant values of the eleven responses, the cells were colored in green, while the non-significant values were colored in grey. The coefficients R2 > 0.94 for each response demonstrated the high correlation. The construction of the second order equations followed the typical notation and only significant values (p < 0.05, green colored) were considered. Some examples are displayed below in the Equations (2)–(4).
Y 1 = 4.73810 + 0.474459 Temperature 0.985634 Solvent 0.097691 Temperature Solvent 0.150406 Temperature 2 0.727928 Solvent 2
Y 10 = 112.86260 + 2.70371 time + 6.67001 Temperature + 8.04413 Solvent 1.83357 time Temperature + 6.70288 Temperature Solvent + 5.33699 Solvent 2
Y 11 = 17.46436 + 1.69988 Temperature 2.62870 Solvent 0.663910 Temperature 2 2.13429 Solvent 2

3.2.2. Factorial and General Optimization

From the 28 runs (each one performed in triplicate) data acquired, the most efficient extraction conditions for maximizing each of the eleven responses using HAE were obtained by constructing 3D response surface curves with underlying contour plots (Figure 1, Figure 2, Figure 3, Figure 4 and Figure 5) and determined by interpolation of experimental values according to the equations mentioned above.
Although ANOVA analysis becomes mandatory in understanding the patterns of the responses, 3D surface plots are the best way to visualize the effects of any independent variable on the extraction of any type of response, helping to comprehend the influence and interaction between the variables. These plots are obtained depicting two variables, temperature vs solvent, within experimental range and keeping the third variable, time, constant at zero level (Figure 1, Figure 2, Figure 3, Figure 4 and Figure 5).
The information summarized in the eleven RSM graphs is the behavior of the responses through all the tested point, which, along with the other statistics diagnostics and mathematical equation, helps creating a net of untested points in order to give us a visual representation of data. From this representation, it becomes easy to observe that in each one of the responses, while temperature increases, the responses do it in the same manner. At the same time, it is interesting to focus on the solvent axis. Although the increments are obvious, it always presents a point of inflection that exhibits the saddle shape form on the graphs on the phenolic compound from the dry weight (Y1–Y5), yield response (Y11) and hydroxytyrosol-1-β -glucoside from extract (Y6). Those combinations of shapes indicate a uniform and increasing value for the factor temperature. Nevertheless, the same cannot be said for solvent factor, since this factor had the optimum point in the middle of the scale, somewhere between the factorial and central points for a big part of responses (Y1–Y6 and Y11), while the other extract responses (Y7–Y10) highlighted at the positive factorial points analyzed. This could be explained by the polarity of the compounds as well as by yielding response. On the dry weight, other polar compounds tend to increase the interaction of the quantified compounds, hence, different profile was found when comparing with the purity of the extract. Lastly, with their own statistics diagnostic attached, it was observed how the predicted point matched well with the actual point showing a smooth straight line. Taking into consideration the lack of fit and R2 values in Table 2, it was possible to realize how the modeling fitted with high precision (Lack of fit < 0.05 and R2 > 0.94), except in Y7 which might be caused by an unexpected outlier in the run 16 obtaining 62.59, instead of 71.17 mg/g of extract. On the other hand, at the bottom, the residual is shown in order to describe the behavior within the runs and check that it does not exist any type of pattern which could influence the modeling.
Furthermore, a compilation of factorial terms is presented in the second part of Table 2, which takes into account the single and interaction effects, the RSM, the statistical diagnostic plots and the quadratic equation. Giving particular interest to a unique response, for example Y2 or Y8 (hydroxytyrosol or tyrosol), maximal optimum values of each response are displayed (14.16 mg/g DW and 28.23 mg/g extract, respectively), as well as the specific combination of the three factors time, temperature and solvent that has to be used in order to obtain the predicted values. Besides presenting the numerical values of the used decoded ranges, the cells were colored from light to strong blue to represent the coded factorial points, intending a better observation of the factorial points.
Even if the main objective of this work was to optimize the total phenolic compounds recovery from olive pomace in order to maximize the eleven responses, a combination of the three factors (time, temperature and solvent percentage) had been adjusted and displayed at the column “Global” (Table 2). Additionally, the last row of Table 2 presents the desirability values obtained from the global optimization for each response. The global factor values for maximizing the responses were obtained at 120 min (X1), 85 °C (X2) and 76 % of ethanol (X3), with a global desirability of 0.71. In these conditions, it was possible to extract 25.09 ± 2.45, 100.77 ± 7.19, 21.19 ± 1.61 and 1.83 ± 0.12 mg/g of extract of hydroxytyrosol-1-β-glucoside, hydroxytyrosol, tyrosol and caffeic acid, respectively. Moreover, extraction yield (Y11) of the global optimization value was 13.70 ± 1.9 %. The global results are similar to the obtained by Vitali Čepo et al. [13] which reported 120 min of time, 70 °C of temperature and 60% of ethanol as the best conditions to extract hydroxytyrosol, tyrosol and oleuropein from olive pomace. Concerning specifically the hydroxytyrosol extraction, the obtained results are higher than those found by Pavez et al. [34] using Pressurized Liquid Extraction and by Böhmer-Maas et al. [14] using maceration, where 0.258 mg/g DW and 0.154 mg/g DW, respectively, were extracted while 12.55 ± 0.99 mg/g DW were reached in the present work. Thus, olive pomace is a promising source of phenolic compounds namely hydroxytyrosol for potential use as natural preservatives.
Further studies have to be performed in order to valorize olive wastes as a source of potentially valuable food ingredients. For instance, other green technologies can be explored to maximize the extraction of bioactive compounds, such as supercritical extraction, microwave-assisted extraction (MAE), ultrasound-assisted extraction (UAE) [32,35,36], or pressurized-liquid extraction (PLE) [34]. The fortification of food, especially meat [37,38,39], beverages [40], bakery [41,42,43] and dairy [44,45] products, with bioactive compounds from olive wastes not only as pure compounds but also in the form of rich extracts, was previous described due to the antioxidant ability of phenols to reduce lipid oxidation during cooking and storage or to their antimicrobial properties.

4. Conclusions

Nowadays, consumers are more interested in what they eat, thus increasing the demand for sustainable and healthier foodstuffs. The food industry tries to address this challenge developing efficient extraction methods for natural added-value ingredients from industrial by-products. In this work, a heat-assisted extraction (HAE) procedure has been optimized combining three independent variables (extraction time, temperature and solvent concentration), in order to maximize the recovery of four relevant bioactive phenolic compounds (i.e., hydroxytyrosol-1-β-glucoside, hydroxytyrosol, tyrosol and caffeic acid) present in olive pomace, a residue generated during olive oil extraction. The achieved experimental data were fitted to theoretical models to determine the optimal extraction conditions, which were established at: t = 120 min, T = 85 °C and S = 76 % of ethanol, with an extraction yield of 13.70%, allowing to recover a total amount of 148.88 ± 8.73 mg/g extract.
This work evidenced that residues produced during olive oil extraction can be valuable sources of bioactive compounds to produce ingredients that can be used by the food industry. More studies have to be performed to further improve the recovery of these and other valuable compounds to compare with the HAE results obtained in this work, such as the application of green technologies like ultrasound-assisted extraction (UAE) or microwave-assisted extraction (MAE). The isolated pure compounds from olive wastes, as well as the obtained rich extracts can be used as preservatives in foods being suitable alternatives to synthetic food additives and/or as functional ingredients to provide consumer health benefits.

Author Contributions

Conceptualization, I.C.F.R.F., L.B. and C.S.-B.; Formal analysis, J.M.; Investigation, J.M. and B.M.; Methodology, I.C.F.R.F., L.B. and S.C.V.; Software, B.M.; Supervision, C.S.-B., L.B. and S.C.V.; Writing—original draft, J.M.; Writing—review & editing, C.S.-B., F.M.A.M., L.B. and S.C.V. All authors have read and agreed to the published version of the manuscript.

Funding

This work was funded by the Foundation for Science and Technology (FCT, Portugal) for financial support through national funds FCT/MCTES to C2TN (UIDB/04349/2020), CIMO (UIDB/00690/2020), J.M. (SFRH/BD/136506/2018); L.B. thank the national funding by FCT, P.I., through the institutional scientific employment program-contract; and the European Regional Development Fund (ERDF) through the Regional Operational Program North 2020, within the scope of Project OliveBIOextract (NORTE-01-0247-FEDER-049865). The GIP-USAL is funded by the Strategic Research Programs for Units of Excellence (ref CLU-2018-04) and Consejería de Educación de la Junta de Castilla y León (Project SA093P20).

Acknowledgments

The authors are grateful to “UCASUL—União de Cooperativas Agrícolas do Sul” agro industrial cooperative for providing the samples, to Technological Unit of Radiosterilization (University of Lisbon) for the samples irradiation, and to Molecular Materials Synthesis Laboratory (responsible Dulce Belo, C2TN) for the solvent evaporations.

Conflicts of Interest

The authors declare no conflict of interest.

References

  1. Madureira, J.; Dias, M.I.; Pinela, J.; Calhelha, R.C.; Barros, L.; Santos-Buelga, C.; Margaça, F.M.A.; Ferreira, I.C.F.R.; Cabo Verde, S. The use of gamma radiation for extractability improvement of bioactive compounds in olive oil wastes. Sci. Total Environ. 2020, 727, 138706. [Google Scholar] [CrossRef]
  2. Malapert, A.; Reboul, E.; Loonis, M.; Dangles, O.; Tomao, V. Direct and Rapid Profiling of Biophenols in Olive Pomace by UHPLC-DAD-MS. Food Anal. Methods 2018, 11, 1001–1010. [Google Scholar] [CrossRef]
  3. Nunes, M.A.; Costa, A.S.G.; Bessada, S.; Santos, J.; Puga, H.; Alves, R.C.; Freitas, V.; Oliveira, M.B.P.P. Olive pomace as a valuable source of bioactive compounds: A study regarding its lipid- and water-soluble components. Sci. Total Environ. 2018, 644, 229–236. [Google Scholar] [CrossRef]
  4. Faustino, M.; Veiga, M.; Sousa, P.; Costa, E.M.; Silva, S.; Pintado, M. Agro-food byproducts as a new source of natural food additives. Molecules 2019, 24, 1056. [Google Scholar] [CrossRef] [PubMed] [Green Version]
  5. Galanakis, C.M.; Aldawoud, T.M.S.; Rizou, M.; Rowan, N.J.; Ibrahim, S.A. Food Ingredients and Active Compounds against the Coronavirus Disease (COVID-19) Pandemic: A Comprehensive Review. Foods 2020, 9, 1701. [Google Scholar] [CrossRef] [PubMed]
  6. De Bruno, A.; Romeo, R.; Fedele, F.L.; Sicari, A.; Piscopo, A.; Poiana, M. Antioxidant activity shown by olive pomace extracts. J. Environ. Sci. Health Part B Pestic. Food Contam. Agric. Wastes 2018, 53, 526–533. [Google Scholar] [CrossRef] [PubMed]
  7. Cardoso, S.M.; Guyot, S.; Marnet, N.; Lopes-da-Silva, J.A.; Renard, C.M.G.C.; Coimbra, M.A. Characterisation of phenolic extracts from olive pulp and olive pomace by electrospray mass spectrometry. J. Sci. Food Agric. 2005, 85, 21–32. [Google Scholar] [CrossRef]
  8. Fernández-Bolaños, J.; Rodríguez, G.; Rodríguez, R.; Guillén, R.; Jiménez, A. Extraction of interesting organic compounds from olive oil waste. Grasas Aceites 2006, 57, 95–106. [Google Scholar] [CrossRef] [Green Version]
  9. Suárez, M.; Romero, M.-P.; Ramo, T.; Macià, A.; Motilva, M.-J. Methods for Preparing Phenolic Extracts from Olive Cake for Potential Application as Food Antioxidants. J. Agric. Food Chem. 2009, 57, 1463–1472. [Google Scholar] [CrossRef] [PubMed]
  10. Galanakis, C.M. Recovery of high added-value components from food wastes: Conventional, emerging technologies and commercialized applications. Trends Food Sci. Technol. 2012, 26, 68–87. [Google Scholar] [CrossRef]
  11. Galanakis, C.M. Emerging technologies for the production of nutraceuticals from agricultural by-products: A viewpoint of opportunities and challenges. Food Bioprod. Process. 2013, 91, 575–579. [Google Scholar] [CrossRef]
  12. Alu’datt, M.H.; Alli, I.; Ereifej, K.; Alhamad, M.; Al-Tawaha, A.R.; Rababah, T. Optimisation, characterisation and quantification of phenolic compounds in olive cake. Food Chem. 2010, 123, 117–122. [Google Scholar] [CrossRef]
  13. Vitali Čepo, D.; Albahari, P.; Zovko Končić, M.; Radić, K.; Jurmanović, S.; Jug, M. Solvent Extraction and Chromatographic Determination of Polyphenols in Olive Pomace. Food Health Dis. 2017, 6, 7–14. [Google Scholar]
  14. Böhmer-Maas, B.W.; Otero, D.M.; Zambiazi, R.C.; Aranha, B.C. Optimization of the extraction of phenolic compounds from olive pomace using response surface methodology. Rev. Ceres 2020, 67, 181–190. [Google Scholar] [CrossRef]
  15. Zuorro, A. Modelling of polyphenol recovery from olive pomace by response surface methodology. Int. Rev. Model. Simul. 2014, 7, 1023–1028. [Google Scholar] [CrossRef]
  16. Madureira, J.; Pimenta, A.I.; Popescu, L.; Besleaga, A.; Dias, M.I.; Santos, P.M.P.; Melo, R.; Ferreira, I.C.F.R.; Cabo Verde, S.; Margaça, F.M.A. Effects of gamma radiation on cork wastewater: Antioxidant activity and toxicity. Chemosphere 2017, 169, 139–145. [Google Scholar] [CrossRef] [Green Version]
  17. Guerreiro, D.; Madureira, J.; Silva, T.; Melo, R.; Santos, P.M.P.; Ferreira, A.; Trigo, M.J.; Falcão, A.N.; Margaça, F.M.A.; Cabo Verde, S. Post-harvest treatment of cherry tomatoes by gamma radiation: Microbial and physicochemical parameters evaluation. Innov. Food Sci. Emerg. Technol. 2016, 36, 1–9. [Google Scholar] [CrossRef]
  18. Cabo Verde, S.; Trigo, M.J.; Sousa, M.B.; Ferreira, A.; Ramos, A.C.; Nunes, I.; Junqueira, C.; Melo, R.; Santos, P.M.P.; Botelho, M.L. Effects of gamma radiation on raspberries: Safety and quality issues. J. Toxicol. Environ. Health A 2013, 76, 291–303. [Google Scholar] [CrossRef]
  19. Elias, M.I.; Madureira, J.; Santos, P.M.P.; Carolino, M.M.; Margaça, F.M.A.; Verde, S.C. Preservation treatment of fresh raspberries by e-beam irradiation. Innov. Food Sci. Emerg. Technol. 2020, 66, 102487. [Google Scholar] [CrossRef]
  20. Barkaoui, S.; Madureira, J.; Santos, P.M.P.; Margaça, F.M.A.; Miloud, N.B.; Mankai, M.; Boudhrioua, N.M.; Cabo Verde, S. Effect of Ionizing Radiation and Refrigeration on the Antioxidants of Strawberries. Food Bioprocess Technol. 2020, 13, 1516–1527. [Google Scholar] [CrossRef]
  21. Pereira, E.; Barros, L.; Antonio, A.L.; Cabo Verde, S.; Santos-Buelga, C.; Ferreira, I.C.F.R.; Rodrigues, P. Is gamma radiation suitable to preserve phenolic compounds and to decontaminate mycotoxins in aromatic plants? A case-study with aloysia citrodora paláu. Molecules 2017, 22, 347. [Google Scholar] [CrossRef] [Green Version]
  22. Box, G.E.P.; Wilson, K.B. On the Experimental Attainment of Optimum Conditions. J. R. Stat. Soc. 1951, 13, 1–45. [Google Scholar] [CrossRef]
  23. Whittaker, B.; Watts, M.F. The influence of dose rate, ambient temperature and time on the radiation response of Harwell PMMA dosimeters. Radiat. Phys. Chem. 2001, 60, 101–110. [Google Scholar] [CrossRef]
  24. Pinela, J.; Prieto, M.A.; Pereira, E.; Jabeur, I.; Barreiro, M.F.; Barros, L.; Ferreira, I.C.F.R. Optimization of heat- and ultrasound-assisted extraction of anthocyanins from Hibiscus sabdariffa calyces for natural food colorants. Food Chem. 2019, 275, 309–321. [Google Scholar] [CrossRef] [PubMed] [Green Version]
  25. Primo da Silva, L.; Pereira, E.; Prieto, M.A.; Simal-Gandara, J.; Pires, T.C.S.P.; Alves, M.J.; Calhelha, R.; Barros, L.; Ferreira, I.C.F.R. Rubus ulmifolius Schott as a Novel Source of Food Colorant: Extraction optimization of coloring pigments and incorporation in a bakery product. Molecules 2019, 24, 2181. [Google Scholar] [CrossRef] [PubMed] [Green Version]
  26. Melgar, B.; Dias, M.I.; Ciric, A.; Sokovic, M.; Garcia-Castello, E.M.; Rodriguez-Lopez, A.D.; Barros, L.; Ferreira, I.C.R.F. Bioactive characterization of Persea americana Mill. by-products: A rich source of inherent antioxidants. Ind. Crops Prod. 2018, 111, 212–218. [Google Scholar] [CrossRef] [Green Version]
  27. Chanioti, S.; Tzia, C. Optimization of ultrasound-assisted extraction of oil from olive pomace using response surface technology: Oil recovery, unsaponifiable matter, total phenol content and antioxidant activity. LWT Food Sci. Technol. 2017, 79, 178–189. [Google Scholar] [CrossRef]
  28. Garcia-Castello, E.M.; Rodriguez-Lopez, A.D.; Mayor, L.; Ballesteros, R.; Conidi, C.; Cassano, A. Optimization of conventional and ultrasound assisted extraction of flavonoids from grapefruit (Citrus paradisi L.) solid wastes. LWT Food Sci. Technol. 2015, 64, 1114–1122. [Google Scholar] [CrossRef]
  29. Santos Felix, A.C.; Novaes, C.G.; Pires Rocha, M.; Barreto, G.E.; do Nascimento, B.B.; Giraldez Alvarez, L.D. Mixture Design and Doehlert Matrix for the Optimization of the Extraction of Phenolic Compounds from Spondias mombin L Apple Bagasse Agroindustrial Residues. Front. Chem. 2018, 5, 1–8. [Google Scholar] [CrossRef] [Green Version]
  30. Shi, J.; Yu, J.; Pohorly, J.; Young, J.C.; Bryan, M.; Wu, Y. Optimization of the extraction of polyphenols from grape seed meal by aqueous ethanol solution. J. Food Agric. Environ. 2003, 1, 42–47. [Google Scholar]
  31. Belwal, T.; Chemat, F.; Venskutonis, P.R.; Cravotto, G.; Jaiswal, D.K.; Bhatt, I.D.; Devkota, H.P.; Luo, Z. Recent advances in scaling-up of non-conventional extraction techniques: Learning from successes and failures. TrAC Trends Anal. Chem. 2020, 127, 115895. [Google Scholar] [CrossRef]
  32. Goldsmith, C.D.; Vuong, Q.V.; Stathopoulos, C.E.; Roach, P.D.; Scarlett, C.J. Ultrasound increases the aqueous extraction of phenolic compounds with high antioxidant activity from olive pomace. LWT Food Sci. Technol. 2018, 89, 284–290. [Google Scholar] [CrossRef] [Green Version]
  33. Hadidi, M.; Amoli, P.I.; Jelyani, A.Z.; Kasiri, Z.; Rouhafza, A.; Ibarz, A.; Khaksar, F.B.; Tabrizi, S.T. Polysaccharides from pineapple core as a canning by-product: Extraction optimization, chemical structure, antioxidant and functional properties. Int. J. Biol. Macromol. 2020, 163, 2357–2364. [Google Scholar] [CrossRef] [PubMed]
  34. Pavez, I.C.; Lozano-Sánchez, J.; Borrás-Linares, I.; Nuñez, H.; Robert, P.; Segura-Carretero, A. Obtaining an Extract Rich in Phenolic Compounds from Olive Pomace by Pressurized Liquid Extraction. Molecules 2019, 24, 3108. [Google Scholar] [CrossRef] [PubMed] [Green Version]
  35. Irakli, M.; Chatzopoulou, P.; Ekateriniadou, L. Optimization of ultrasound-assisted extraction of phenolic compounds: Oleuropein, phenolic acids, phenolic alcohols and flavonoids from olive leaves and evaluation of its antioxidant activities. Ind. Crops Prod. 2018, 124, 382–388. [Google Scholar] [CrossRef]
  36. Fu, X.; Belwal, T.; Cravotto, G.; Luo, Z. Sono-physical and sono-chemical effects of ultrasound: Primary applications in extraction and freezing operations and influence on food components. Ultrason. Sonochem. 2020, 60, 104726. [Google Scholar] [CrossRef]
  37. Balzan, S.; Taticchi, A.; Cardazzo, B.; Urbani, S.; Servili, M.; Di Lecce, G.; Zabalza, I.B.; Rodriguez-Estrada, M.T.; Novelli, E.; Fasolato, L. Effect of phenols extracted from a by-product of the oil mill on the shelf-life of raw and cooked fresh pork sausages in the absence of chemical additives. LWT Food Sci. Technol. 2017, 85, 89–95. [Google Scholar] [CrossRef]
  38. Chaves-López, C.; Serio, A.; Mazzarrino, G.; Martuscelli, M.; Scarpone, E.; Paparella, A. Control of household mycoflora in fermented sausages using phenolic fractions from olive mill wastewaters. Int. J. Food Microbiol. 2015, 207, 49–56. [Google Scholar] [CrossRef] [PubMed]
  39. Elama, C.; Tarawa, M.; Al-Rimawi, F. Oleuropein from Olive Leaf Extract as Natural Antioxidant of Frozen Hamburger. J. Food Sci. Eng. 2017, 7, 406–412. [Google Scholar] [CrossRef] [Green Version]
  40. Guglielmotti, M.; Passaghe, P.; Buiatti, S. Use of olive (Olea europaea L.) leaves as beer ingredient, and their influence on beer chemical composition and antioxidant activity. J. Food Sci. 2020, 85, 2278–2285. [Google Scholar] [CrossRef]
  41. Cedola, A.; Cardinali, A.; D’Antuono, I.; Conte, A.; Del Nobile, M.A. Cereal foods fortified with by-products from the olive oil industry. Food Biosci. 2020, 33, 100490. [Google Scholar] [CrossRef]
  42. Cedola, A.; Palermo, C.; Centonze, D.; Del Nobile, M.A.; Conte, A. Characterization and bio-accessibility evaluation of olive leaf extract-enriched “Taralli”. Foods 2020, 9, 1268. [Google Scholar] [CrossRef] [PubMed]
  43. Galanakis, C.M.; Tsatalas, P.; Charalambous, Z.; Galanakis, I.M. Control of microbial growth in bakery products fortified with polyphenols recovered from olive mill wastewater. Environ. Technol. Innov. 2018, 10, 1–15. [Google Scholar] [CrossRef]
  44. Georgakouli, K.; Mpesios, A.; Kouretas, D.; Petrotos, K.; Mitsagga, C.; Giavasis, I.; Jamurtas, A.Z. The effects of an olive fruit polyphenol-enriched yogurt on body composition, blood redox status, physiological and metabolic parameters and yogurt microflora. Nutrients 2016, 8, 344. [Google Scholar] [CrossRef] [PubMed] [Green Version]
  45. Palmeri, R.; Parafati, L.; Trippa, D.; Siracusa, L.; Arena, E.; Restuccia, C.; Fallico, B. Addition of olive leaf extract (OLE) for producing fortified fresh pasteurized milk with an extended shelf life. Antioxidants 2019, 8, 255. [Google Scholar] [CrossRef] [PubMed] [Green Version]
Figure 1. RSM graphs from the responses Y1 (Hydroxytyrosol-1-beta-glucoside, mg/g DW) and Y2 (Hydroxytyrosol, mg/g DW), with statistical diagnostic representations. Each graph displays temperature vs solvent factors, with a time factor adjusted to 0, along with two statistical diagnostics attached. On the left, the graphical representation of the adjustment between predicted vs actual points, and on the right, the graphical representation of residuals vs predicted points.
Chemosensors 09 00231 g001
Figure 2. RSM graphs from the responses Y3 (Tyrosol, mg/g DW), Y4 (Caffeic acid, mg/g DW) and Y5 (Total phenolic content, mg/g DW), with statistical diagnostic representations. Each graph displays temperature vs solvent factors, with a time factor adjusted to 0, along with two statistical diagnostics attached. On the left, the graphical representation of the adjustment between predicted vs actual points, and on the right, the graphical representation of residuals vs predicted points.
Chemosensors 09 00231 g002
Figure 3. RSM graphs from the responses Y6 (Hydroxytyrosol-1-beta-glucoside, mg/g Ext) and Y7 (Hydroxytyrosol, mg/g Ext), with statistical diagnostic representations. Each graph displays temperature vs solvent factors, with a time factor adjusted to 0, along with two statistical diagnostics attached. On the left, the graphical representation of the adjustment between predicted vs actual points, and on the right, the graphical representation of residuals vs predicted points.
Chemosensors 09 00231 g003
Figure 4. RSM graphs from the responses Y8 (Tyrosol, mg/g Ext) and Y9 (Caffeic acid, mg/g Ext), with statistical diagnostic representations. Each graph displays temperature vs solvent factors, with a time factor adjusted to 0, along with two statistical diagnostics attached. On the left, the graphical representation of the adjustment between predicted vs actual points, and on the right, the graphical representation of residuals vs predicted points.
Chemosensors 09 00231 g004
Figure 5. RSM graphs from the responses Y10 (Total phenolic acids, mg/g Ext) and Y11 (Yield, %), with statistical diagnostic representations. Each graph displays temperature vs solvent factors, with a time factor adjusted to 0, along with two statistical diagnostics attached. On the left, the graphical representation of the adjustment between predicted vs actual points, and on the right, the graphical representation of residuals vs predicted points.
Chemosensors 09 00231 g005
Table 1. Circumscribed central composite design and experimental data for 5-level-3-factor response surface.
Factors Responses
RunX1X2X3X1:t
min
X2: T
°C
X3: S
%
Y1Y2Y3Y4Y5Y6Y7Y8Y9Y10Y11
1−1−1−140.337.220.34.2810.232.080.2116.7927.0163.3612.921.28104.5716.12
2−1−1140.337.279.72.197.251.720.1611.3120.0875.2315.811.57112.7010.90
3−11−140.372.820.35.2612.932.550.2420.9828.0569.4114.331.40113.1816.98
4−11140.372.879.73.2311.352.370.2317.1823.8488.4918.411.71132.4413.23
51−1−199.737.220.33.989.612.090.1915.8728.3469.6015.131.40114.4713.81
61−1199.737.279.72.218.351.840.1612.5520.6678.2617.241.65117.8110.67
711−199.772.820.35.1912.502.620.2620.5727.9166.3713.561.37109.2018.83
811199.772.879.73.5512.222.590.2418.6125.3091.1619.301.78137.5513.67
91.680012055504.8712.552.640.2620.3329.5173.6414.241.48118.8717.80
10−1.68002055504.2311.172.380.2518.0228.0372.3414.501.59116.4614.59
110−1.6807025503.468.811.790.1614.2227.3868.6813.511.25110.8212.63
1201.6807085505.0413.222.910.2521.4227.2373.0114.941.37116.5518.49
1300−1.68705504.5811.382.320.2318.5126.9567.1013.741.36109.1516.99
14001.6870551000.666.591.510.138.8911.37106.0324.852.06144.315.83
15−1.68−1.68−1.68202502.867.131.420.1411.5428.6869.8614.281.33114.159.96
16−1.68−1.681.6820251000.261.780.520.042.609.0462.5918.301.3591.282.89
17−1.681.68−1.68208505.0912.432.460.2320.2127.8468.0613.441.26110.6018.28
18−1.681.681.6820851000.999.082.000.1612.2313.93127.6528.102.29171.977.11
191.68−1.68−1.681202502.877.991.740.1512.7528.7680.7217.061.54128.0811.01
201.68−1.681.68120251000.322.570.670.053.6110.9788.0323.021.72123.742.93
211.681.68−1.681208504.8811.912.540.2219.5527.4265.4914.951.30109.1617.22
221.681.681.68120851001.2810.442.350.1814.2616.21130.8128.852.26178.128.30
230007055505.0212.732.600.2520.6126.5468.0913.121.35109.0918.72
240007055504.6612.032.360.2319.2827.5370.1215.041.39114.0817.17
250007055504.9212.592.650.2620.4227.7970.0314.231.39113.4417.97
260007055504.9412.582.550.2520.3224.8465.5613.311.28104.9919.31
270007055505.1112.952.620.2520.9227.8170.5714.981.38114.7418.35
280007055504.9212.302.440.2419.9027.5168.8214.281.34111.9617.88
X1: Time (min), X2: Temperature (°C), X3: Solvent concentration (% ethanol), and Y1: Hydroxytyrosol−1-beta-glucoside (mg/g DW), Y2: Hydroxytyrosol (mg/g DW), Y3: Tyrosol (mg/g DW), Y4: Caffeic acid (mg/g DW), Y5: Total phenolic content (mg/g DW), Y6: Hydroxytyrosol-1-beta-glucoside (mg/g Ext), Y7: Hydroxytyrosol (mg/g Ext), Y8: Tyrosol (mg/g Ext), Y9: Caffeic acid (mg/g Ext), Y10: Total phenolic acids (mg/g Ext), Y11: Yield (%).
Table 2. Statistical analysis (ANOVA) of the CCCD design and decoded optimization values, including response terms for building the predictive models and optimal response values for the parametric response criteria.
ANOVA Estimated Coefficients
TermY1Y2Y3Y4Y5Y6Y7Y8Y9Y10Y11
Intercept4.7512.282.5319.8119.5627.2969.5014.021.40112.2217.56
A-time−0.020.080.040.100.090.201.900.570.042.70−0.10
B-Temp0.471.710.352.572.530.615.210.780.076.671.70
C-Solvent−0.99−1.11−0.18−2.30−2.28−4.229.382.710.178.04−2.63
AB0.01−0.030.00−0.02−0.02−0.01−1.54−0.26−0.02−1.830.03
AC0.030.110.010.150.150.190.830.060.001.090.06
BC−0.100.270.060.230.230.595.240.800.076.70−0.20
A2−0.03−0.09−0.01−0.12−0.130.500.700.100.041.35−0.32 Not significantSignificant
B2−0.14−0.39−0.06−0.60−0.59−0.02−0.060.05−0.04−0.07−0.54
C2−0.72−1.11−0.22−2.06−2.04−2.905.511.850.104.56−2.01
R20.980.970.970.980.980.960.960.970.950.940.96
Lack of fit0.100.060.380.490.090.250.020.350.080.140.12
Decoded Optimization
FactorY1Y2Y3Y4Y5Y6Y7Y8Y9Y10Y11Global
Time (min)53681201206812012012012012066120
Temperature (°C)84.9484.9484.9472.5584.9481.1984.9484.9484.8784.8784.9484.94
Solvent (%)2641454036351001001001002876 −1.6 0 1.6
Single Opt Value5.6314.162.990.2822.8630.65127.4628.232.27174.8620
Global Opt Value (mg/g dry weight or mg/g extract)3.50 ± 0.4312.55 ± 0.992.75 ± 0.210.24 ± 0.0219.04 ± 1.5025.09 ± 2.45100.77 ± 7.1921.19 ± 1.611.83 ± 0.12148.88 ± 8.7313.70 ± 1.90
Desirability0.640.880.920.890.830.780.570.530.600.660.660.71
ANOVA estimated coefficients: all numerical terms to construct second-order equations display color separated (grey: not significant, green: significant). Decoded Optimization values: separated in single response optimization values (with their respective factorial conditions exhibited numerically and colored using coded values light blue for negative extreme point −1.68 light blue to positive extreme point 1.68 dark blue), global optimization, and desirability values for each of the eleven responses. Y1: Hydroxytyrosol-1-β-glucoside (mg/g DW), Y2: Hydroxytyrosol (mg/g DW), Y3: Tyrosol (mg/g DW), Y4: Caffeic acid (mg/g DW), Y5: Total phenolic content (mg/g DW), Y6: Hydroxytyrosol-1-β-glucoside (mg/g Ext), Y7: Hydroxytyrosol (mg/g Ext), Y8: Tyrosol (mg/g Ext), Y9: Caffeic acid (mg/g Ext), Y10: Total phenolic acids (mg/g Ext), Y11: Yield (%).
Publisher’s Note: MDPI stays neutral with regard to jurisdictional claims in published maps and institutional affiliations.

