Review

A Comprehensive Review on Raman Spectroscopy Applications

1
Department of Applied Science and Technology, Politecnico di Torino, C.so Duca degli Abruzzi 24, 10129 Turin, Italy
2
Center for Sustainable Future Technologies @POLITO, Fondazione Istituto Italiano di Tecnologia, Via Livorno 60, 10144 Turin, Italy
3
Consorzio Interuniversitario Nazionale per la Scienza e Tecnologia dei Materiali (INSTM), Via G. Giusti 9, 50121 Florence, Italy
4
Faculty of Science, OntarioTech University, Simcoe Street North, Oshawa, ON L1G 0C5, Canada
*
Author to whom correspondence should be addressed.
Submission received: 30 July 2021 / Revised: 2 September 2021 / Accepted: 10 September 2021 / Published: 13 September 2021
(This article belongs to the Section Optical Chemical Sensors)

Abstract

:
Raman spectroscopy is a very powerful tool for material analysis, allowing for exploring the properties of a wide range of different materials. Since its discovery, Raman spectroscopy has been used to investigate several features of materials such carbonaceous and inorganic properties, providing useful information on their phases, functions, and defects. Furthermore, techniques such as surface and tip enhanced Raman spectroscopy have extended the field of application of Raman analysis to biological and analytical fields. Additionally, the robustness and versatility of Raman instrumentations represent a promising solution for performing on-field analysis for a wide range of materials. Recognizing the many hot applications of Raman spectroscopy, we herein overview the main and more recent applications for the investigation of a wide range of materials, such as carbonaceous and biological materials. We also provide a brief but exhaustive theoretical background of Raman spectroscopy, also providing deep insight into the analytical achievements.

1. Introduction

Non-destructive spectroscopic techniques represent the top-choice for any kind of process monitoring [1,2].
Among all of the available techniques, Raman spectroscopy is one of the most solid and versatile tools to analyze several materials, both in lab and on-field conditions [3]. Raman spectroscopy was first independently developed in the first half of the 20th century by the Nobel laureate Chandrasekhara Venkata Raman [4] and Grigorij Samuilovič Landsberg [5], but it was established after the implementation of laser light equipped spectrometers in the second half of the century [6,7].
The establishment of Raman spectroscopy opened the path to a more detailed knowledge about materials, with a particular emphasis on carbonaceous materials such as graphite [8].
Throughout the years, Raman analysis has grown, reaching several industrial sectors such the food [9] and textiles sectors [10].
Raman spectroscopy displays several advantageous features over other techniques like infrared spectroscopy. For example, the quality of the signal collected is barely affected by the presence of water, allowing for use in plenty of applications where infrared analyses are not reliable [11]. A representative case study is the in-situ monitoring of a fermentative process where Raman techniques outperformed any other spectroscopic approach [12]. Nonetheless, Raman analysis suffers from some difficulties such as the challenge of developing quantitative robust and trustworthy methods of data analysis [13]. Furthermore, the presence of highly active Raman species such as carbon particles could mask the presence of other species [14]. Several studies have been devoted to overcoming these drawbacks [15,16].
In this review, we overview the applications of Raman spectroscopy for the characterization of a wide range of materials. We also discuss in detail the phenomena behind the Raman scattering, thus providing a theoretical background for readers. Due to the immensity of the possible applications of Raman spectroscopy, we believe that a comprehensive overview of the state of the art of this technique is an essential asset to spread its knowledge.

2. Raman Spectroscopy: Principles and Instrumentation

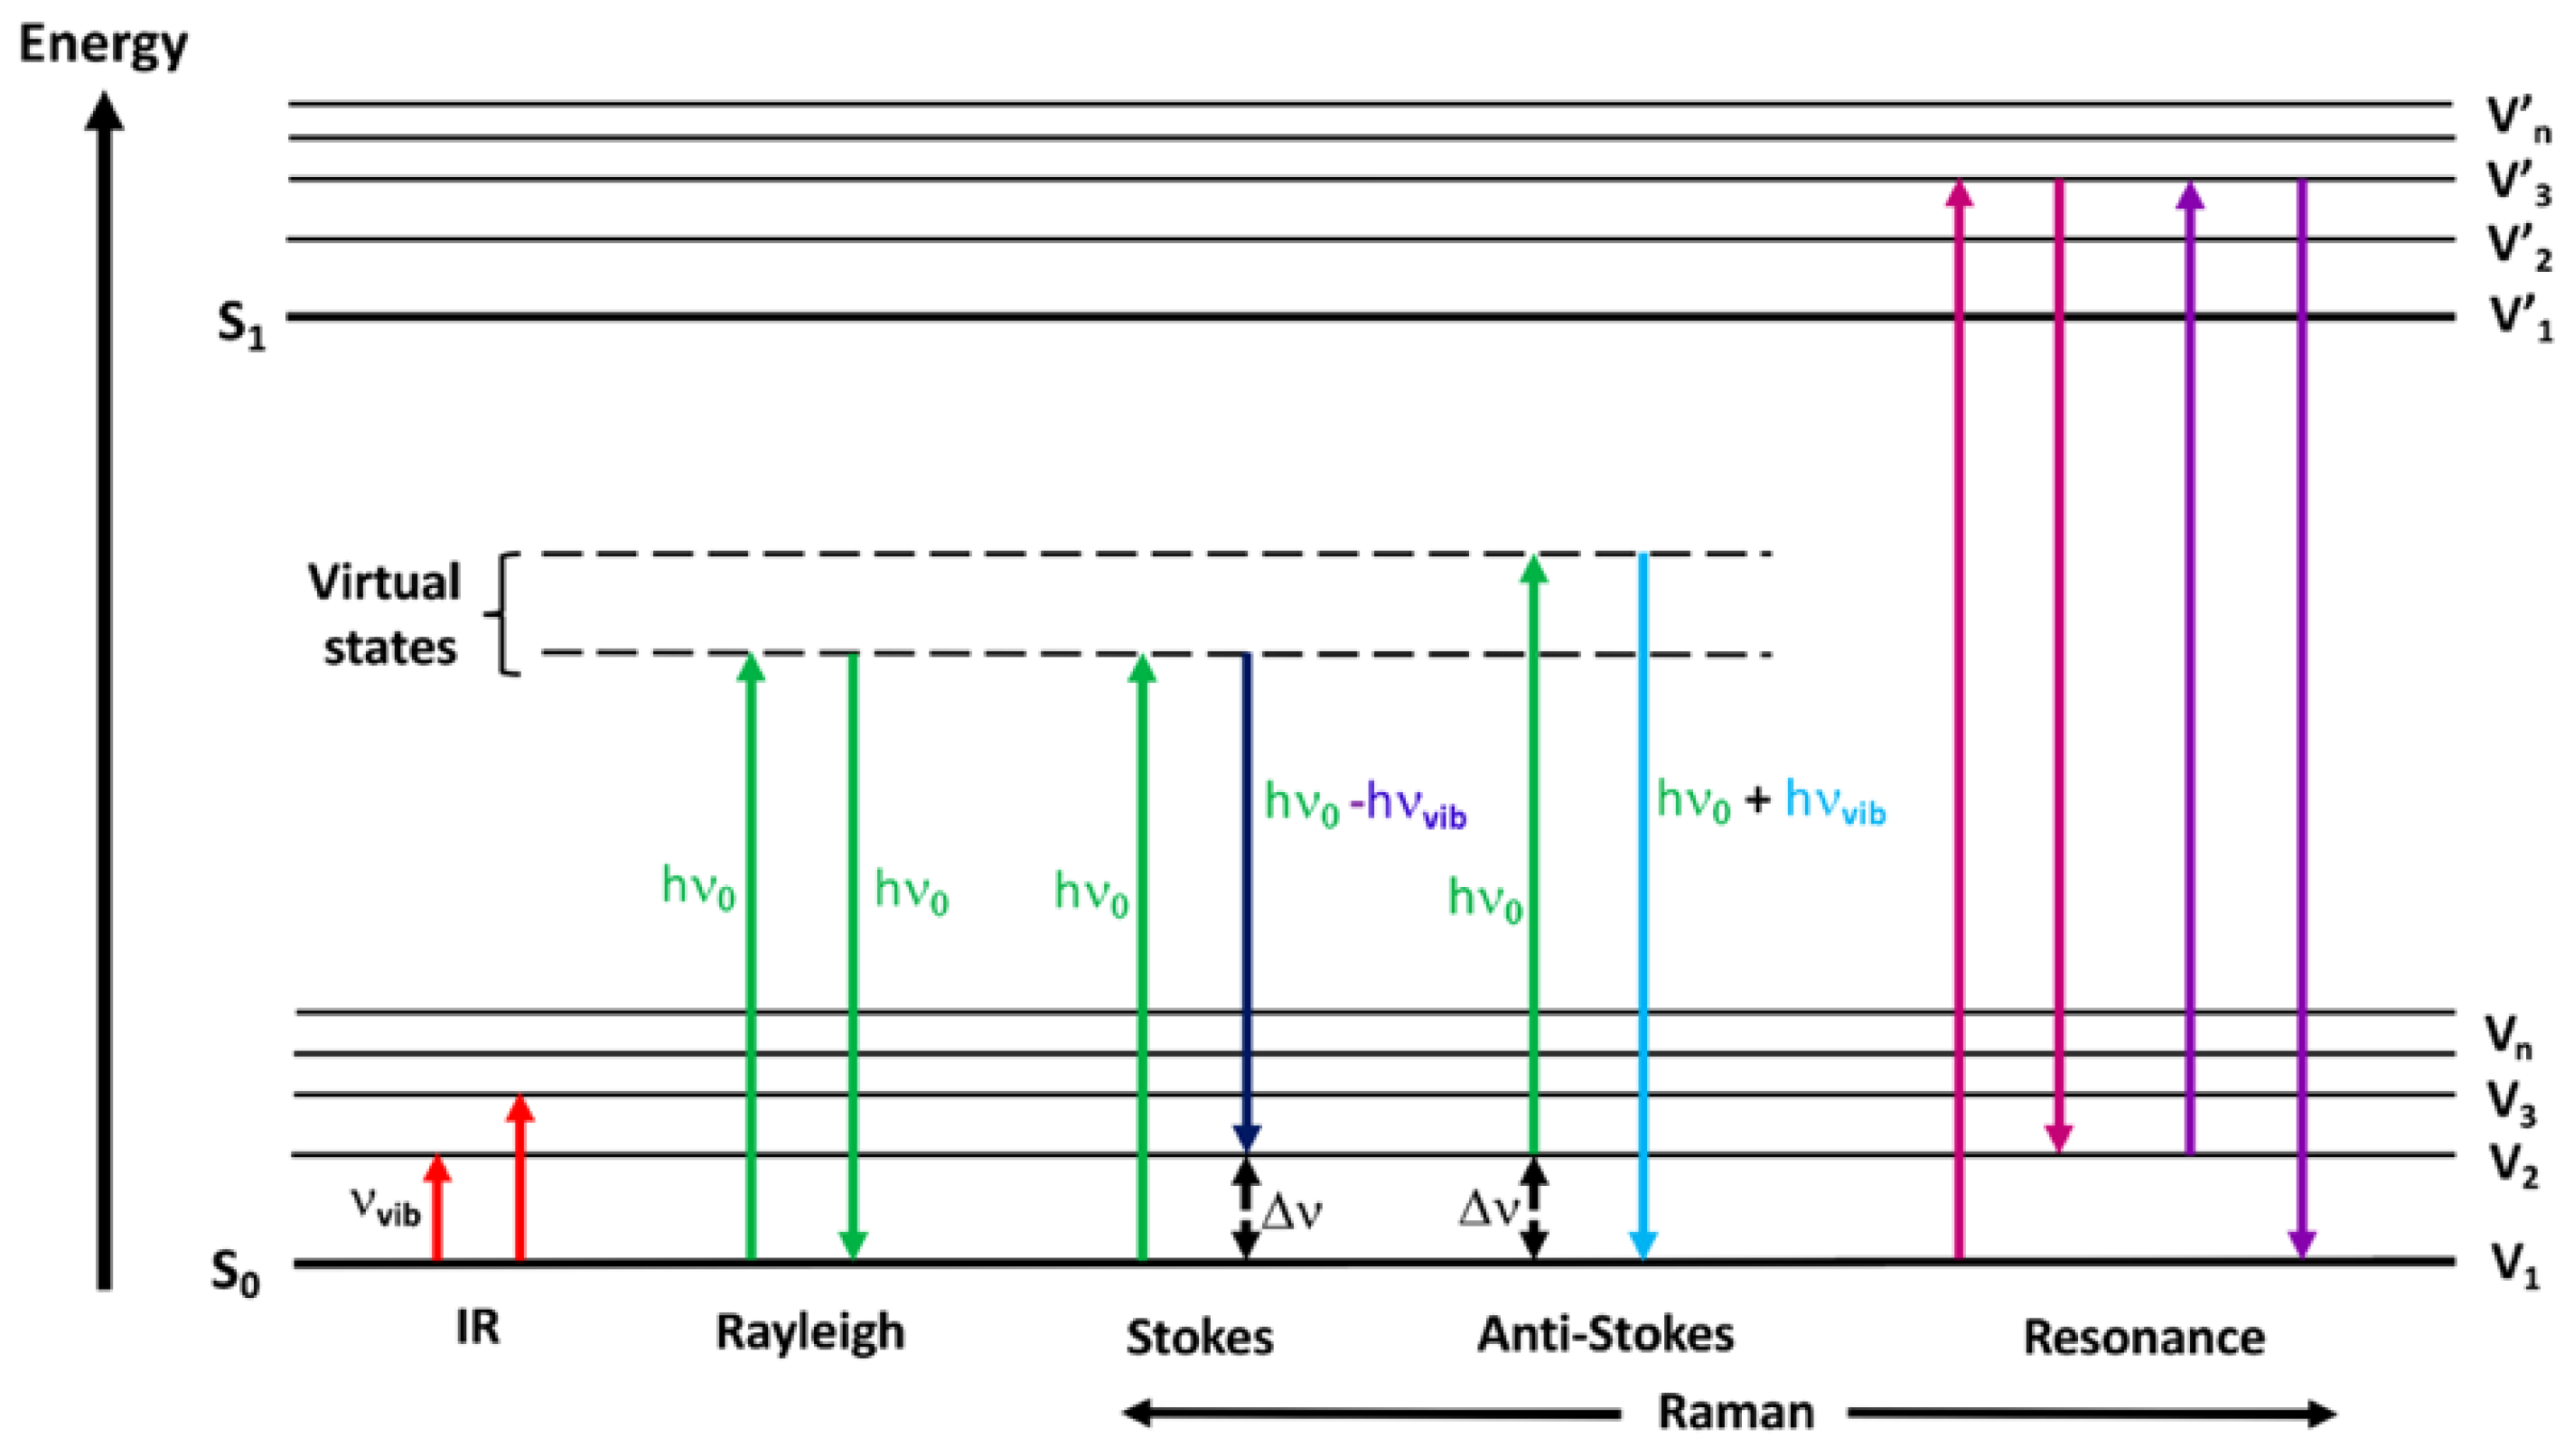
2.1. Theoretical Principles: A Quantum Mechanical Approach

Electromagnetic radiation interacts with matter through absorption, transmittance, and/or scattering phenomena. An absorption process requires the matching of the incident photon’s energy with the energy gap between the two electronic energy levels [17]. Conversely, the process of scattering does not require the presence of adequate energy levels, as this mechanism occurs when a photon interacts with a crystal lattice or a molecule, inducing a distortion of its electron cloud and changing the species polarization involving virtual states [18]. Nevertheless, the virtual state is a short lived one and it decays leaving the electron in the real electronic level of the system while the photon departs from the system. If the energy of the scattered photon matches the incoming one and the electron involved returns in a state with the same energy as the initial one, the scattering is elastic (termed Rayleigh—see Figure 1), otherwise it is inelastic. During inelastic scattering, the loss or gain of the photon energy is equal to the energy difference between the initial and final electronic levels. If the outgoing photon has a lower energy than the incoming one, the scattering is a Stokes one (Figure 1); in the opposite case, the scattering is an anti-Stokes one (Figure 1). The energy difference between the incoming photon and the outgoing one is called “Raman shift”.
From a quantum mechanical approach, the energy corresponding to each vibrational level for a diatomic molecule is described by the following:
E υ = h υ ( n + 1 2 )
where υ is the frequency of the vibration, h is Plank’s constant, and n is the vibrational quantum number with integer values. For the sake of simplicity, the harmonic approximation expression is presented, but it has its limits. Chiefly, it only allows for fundamental transitions ( Δ υ = ± 1 ) and the separation between adjacent levels is supposedly constant, which is not the case for a real diatomic molecule [19]. From Equation (1), it can be seen that for n = 0 , the energy is E = h υ 2 , a direct consequence of the Heisenberg principle.
Figure 1. Jablonski energy diagram showing the transitions involved during infrared absorption, Rayleigh, Raman Stokes, anti-Stokes, and resonance Raman scattering as reported by Geraldes [20]. Reprinted from Ref. [20].
Chemosensors 09 00262 g001
The matrix element that defines the transition probability for a single Raman event between two electronic states is the same for the Stokes and anti-Stokes processes. The difference in the number of scattered photons is due to the different electron populations at the thermal equilibrium of the two electronic levels involved in the Raman process.
At room temperature, the majority of molecules populate the ground state, and the anti-Stokes components are much less intense than the Stokes ones. The different populations of the energy levels are described by the Boltzmann equation
N e x N g = g e x g g e ( E e x E g ) k T
where N e x and N g are the number of molecules in the excited state and in the ground state of energies Eex and Eg, respectively, and g is the degeneracy of the energy level.
If the energy of the incoming photon is such that the electron can reach a real electronic state of the molecule, the Raman is called resonant (see Figure 1), and enhancements of up to 10 6 in signal intensity have been observed [21].
It should be emphasized that Raman scattering is a particularly weak phenomenon compared with Rayleigh, and only one in 108 scattered photons will undergo Raman scattering. On that account, all Raman spectrometers are equipped with some kind of device (usually a notch filter) to remove the Rayleigh component.
The intensity of the Raman scattered radiation is described by the following [22]:
I R   I 0 υ 4   N   ( α Q ) 2
where I 0 and υ are the intensity and the frequency of the incident light, respectively; N is the number of scattering molecules in a given state; α is the polarizability; and Q is the amplitude of the vibrational coordinate. The last term on the right side shows that Raman scattering can occur only if a change in polarizability occurs due to the interaction with the incoming photon.
A misinterpretation of Equation (3) could lead to the fallacious conclusion that the best signal-to-noise ratio in Raman spectroscopy could be obtained by simply maximizing the frequency of the incident light. Unfortunately, as the beam of light on the sample becomes more energetic, the photon absorption and/or the material photodegradation increases substantially. For this reason, visible light lasers are commonly used. However, fluorescent phenomena could be very intense, significantly rising the background noise.
It is possible to enhance the Raman signal by exploiting the plasmonic effects induced by the presence of metal nanoparticles. This technique, known as surface-enhanced Raman spectroscopy (SERS), represents a powerful, highly specific, and sensitive technique for the investigation of the molecular structure at the single-molecular level based on Raman scattering. In the next section, the SERS theoretical background will be discussed.

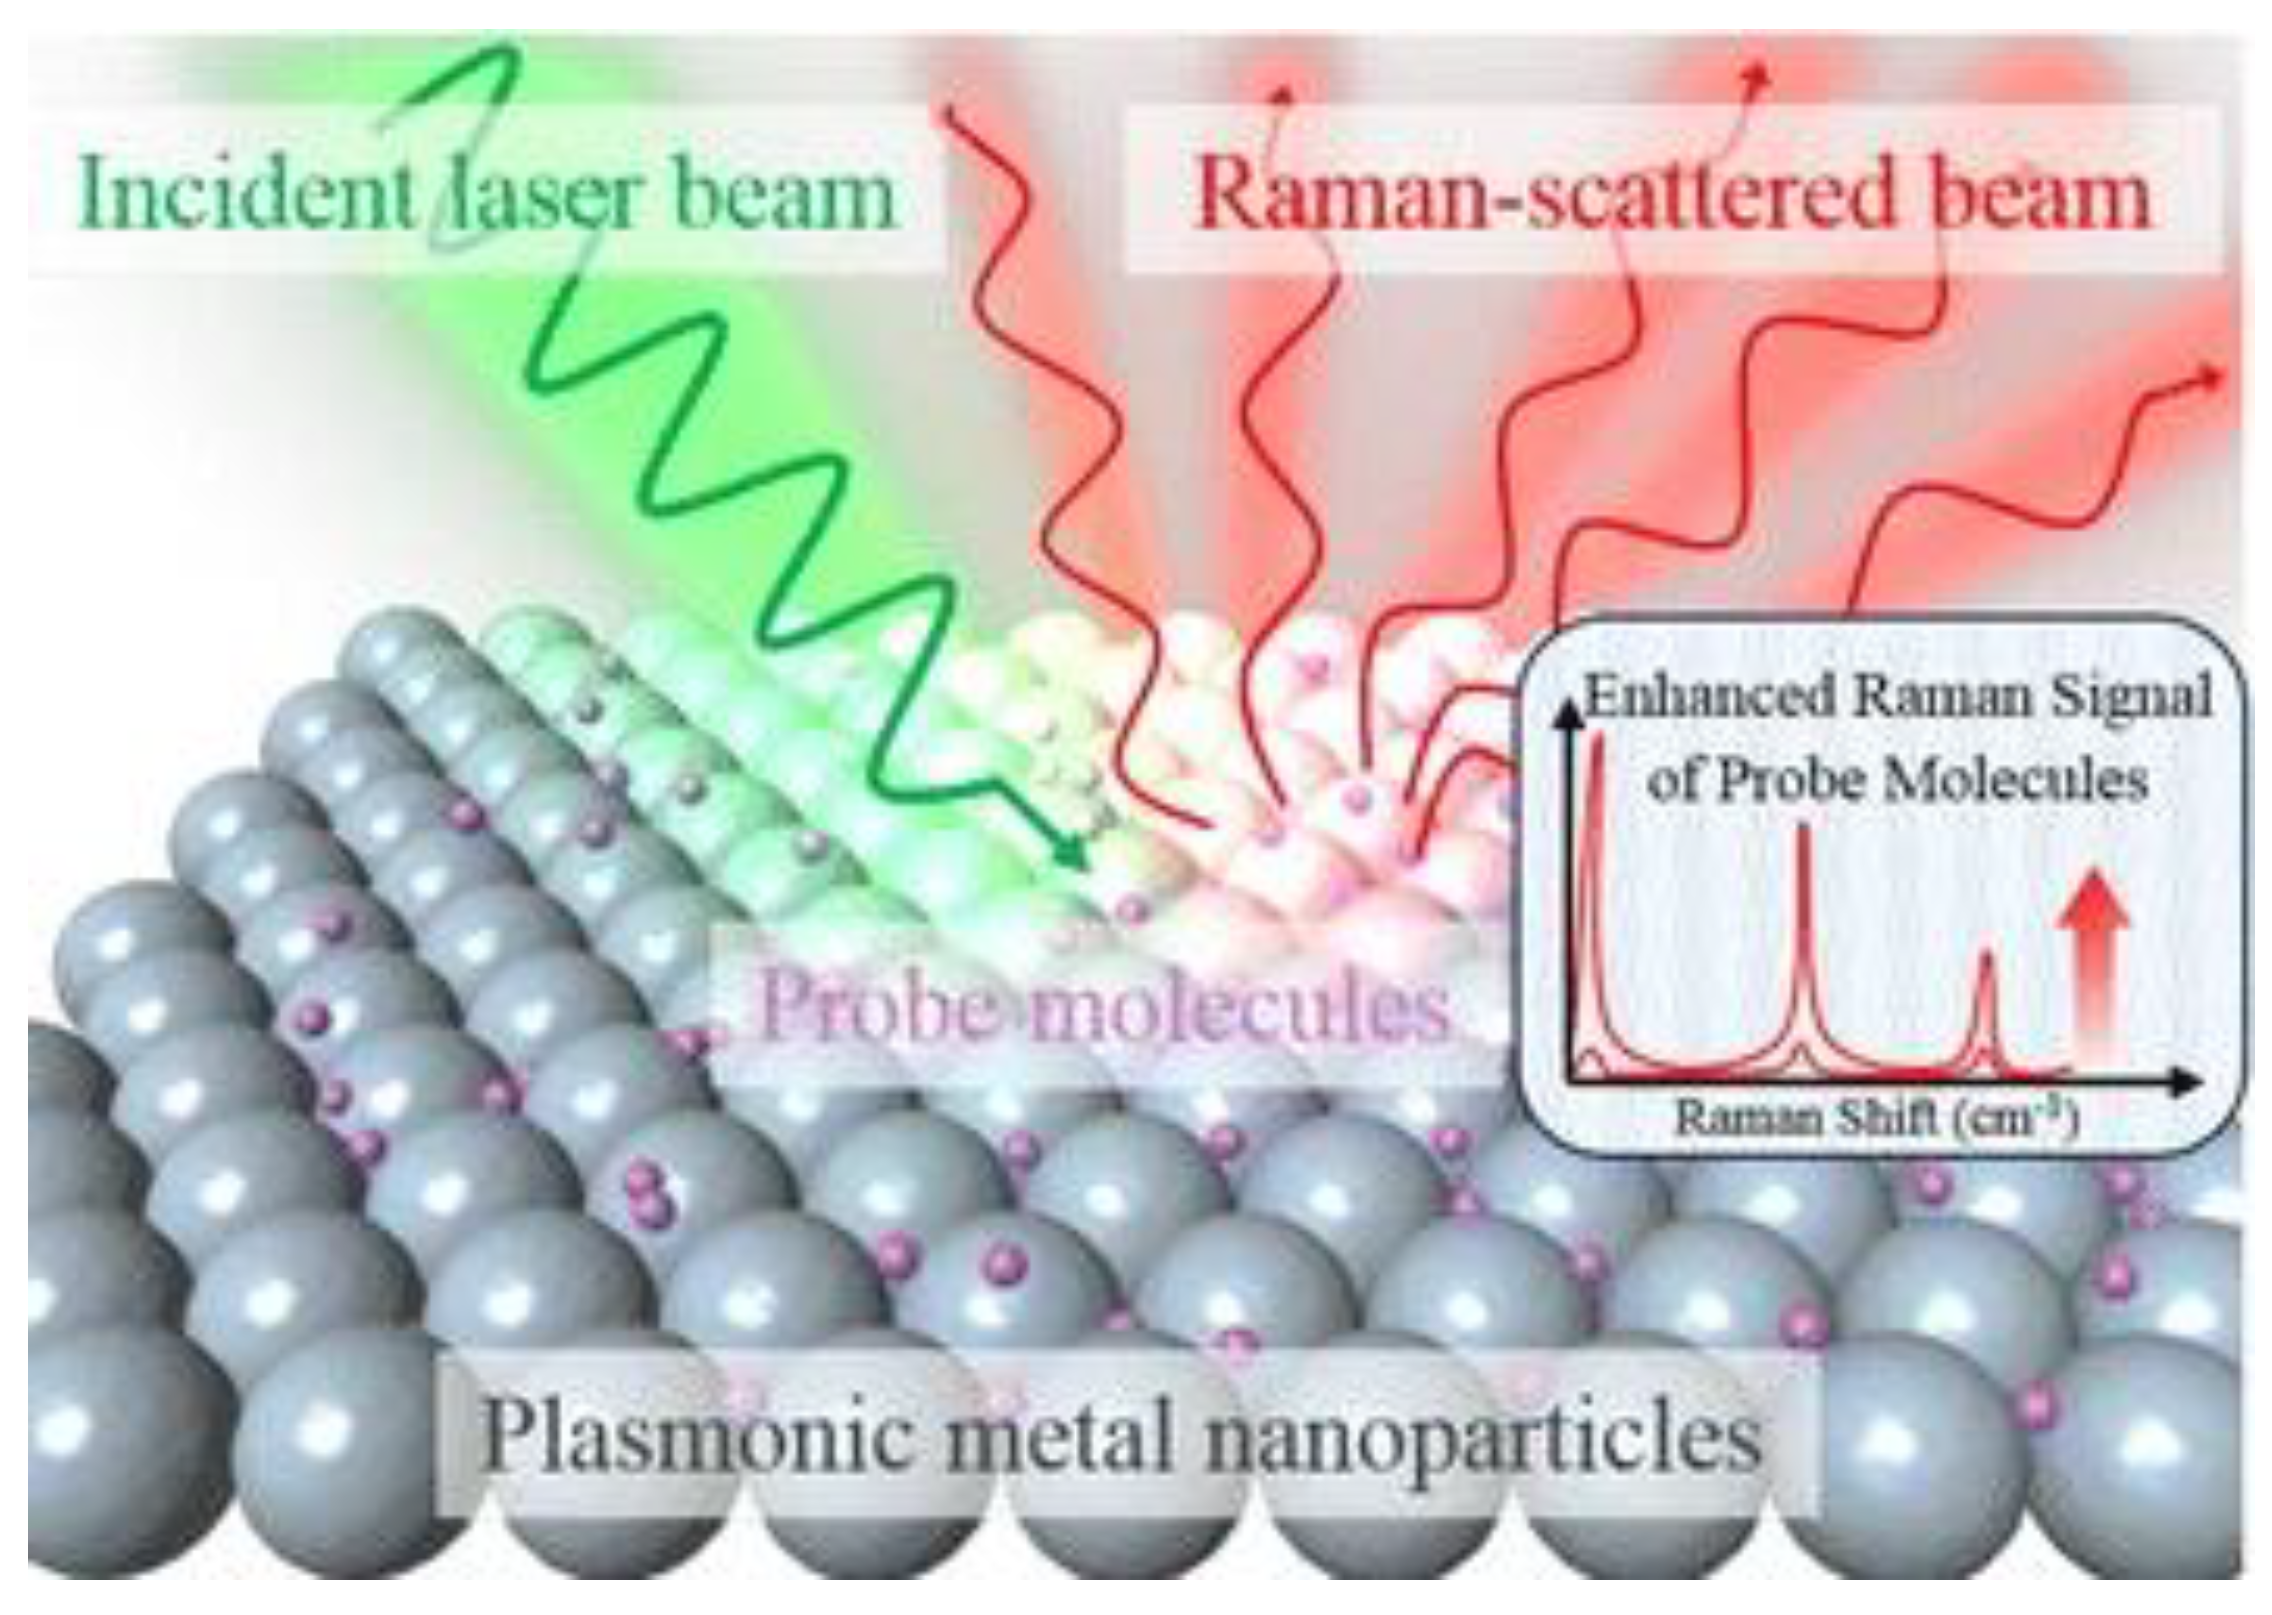
2.2. Theoretical Background of Surface Enhanced Raman Spectroscopy Techniques

SERS is mainly exploited through the interaction between the surface of plasmonic nanostructures and the molecules adsorbed on it. Often, noble metals or copper nanoparticles [23] are used due to their resonant interaction with the electromagnetic waves, inducing localized surface plasmons covering almost all of the visible and near infrared wavelength range [24], as summarized in Figure 2.
The optical properties of the noble metal nanoparticles are dominated by strong features in the extinction spectra. The localized surface plasmons can be so intense that they significantly modify the local electromagnetic field [26]. This phenomenon could be explained using two different theories—the electromagnetic and chemical theories. The electromagnetic theory has strong experimental support [27] and will be the only one discussed in this section.
In order to explain the SERS dynamics, the optical response of a metal nanoparticles has to be analyzed according to Mie’s theory [28,29]. A crucial parameter in Mie’s theory is the complex dielectric function of the nanoparticle, which is calculated by the phenomenological Drude theory [30]. The dielectric function has its contributions from interband ( ε i n t e r ( ω ) ) and intraband ( ε i n t r a ( ω ) ) electron transitions, and can be written as follows:
ε E X P ( ω ) = ε i n t e r ( ω ) + ε i n t r a ( ω )
Interband contributions are due to electron transitions from occupied to empty states sitting in bands separated by an energy gap. Intraband contributions come from electron transitions at the Fermi level in incompletely filled bands. This contribution to the ε(ω) is described by the Drude model, including an extra damping term τ. In the case of nanoparticles, the damping term is mainly related to the effect of the nanoparticle surface. The electron motion is altered by the NP surface, because the electron’s mean free path λ, related to the lifetime τ, is comparable or larger than the particle size. The effect of the surface not only depends on the particle size, but also on its shape [31]. In order to include surface dispersion in the Drude model, the intraband contribution is modified by changing the damping term. Finally, the dielectric function, which depends on the nanoparticles structure and includes the contribution of the free electrons, interband transition, and surface damping, is obtained as follows [32]:
ε ( ω , a ) = ε i n t e r ( ω ) + ε i n t r a N P ( ω , α ) = ( ε e x p ( ω ) ε i n t r a ( ω ) ) + ( ω p 2 ω ( ω + i τ + i τ ( a ) ) )
where ωp is the plasma frequency and 1/τ is the damping constant due to the dispersion of the electrons. The surface dispersion of a sphere of radius, a, is given by 1/τ (σ) = vf/a, where vf is the Fermi velocity of the electron cloud. Accordingly, the smaller the particle, the more important the surface dispersion effect.
Electromagnetic enhancement occurs when the incident light is in resonance with the surface plasmon modes of a metallic thin film or nanoparticle. In this case, it is crucial to fine-tune the spectral positions of the surface plasmons to achieve the resonance condition. When the electromagnetic field is induced on the metal surface, the Raman modes of the particle under analysis adsorbed on the metal surface are strongly enhanced. The average field of the Raman scattered light due to the described mechanism, given by the following Equation [33]:
E R α R A ( v L ) E 0
where E 0 is the magnitude of the incident field, A ( v L ) is the field enhancement averaged over the surface of the metal particle, and α R is the component that takes into account the Raman scattering. Thus, the amplitude of the SERS-scattered field ( E S E R S ) is given by the following equation
E S E R S α S E R S A ( v L ) A ( v S ) E 0
where A ( v S ) is the enhancement factor of the second enhancement process and α S E R S describes a cross-section of the new Raman process of the adsorbed molecule, and the average SERS intensity will be proportional to the square modulus of E S E R S . So, the SERS Stokes power ( P S E R S ) is given by
P S E R S ( v s ) = N α S E R S | A ( v L ) | 2 | A ( v S ) | 2 I ( v L )  
where N is the number of molecules involved in the SERS process and I ( v L ) the excitation laser intensity.
As reported by Álvarez-Puebla [34], the Raman signal enhancement for a given excitation wavelength (ER(λ)) is
E R ( λ ) = | E o u t ( λ ) | 2 | E o u t ( λ λ s ) | 2 E 0 4
where Eout(λ) and Eout(λ−λs) are the electromagnetic fields generated by the incident excitation and the Stokes’s shifted Raman, respectively. Using Equation (9) for the estimation of the enhancement of the Raman signal is quite difficult, so it generally evaluated experimentally using the following equation
E R ( λ ) = I S E R S I R a m a n f
where I S E R S is the intensity of SERS signal, I R a m a n is the intensity of Raman signal, and f is ratio between the number of molecules in the Raman and SERS experiment.
According to Equations (9) and (10), the average SERS electromagnetic enhancements are of the order of ∼ 10 4 10 6 , and are sometimes as high as ∼ 10 8 (depending on the definition and measurement procedure). Maximum values for electromagnetic enhancement for isolated single colloidal silver and gold spheroids are of the order of 10 6 10 7 [35,36,37]. As discussed, the theory predicts a stronger enhancement of electromagnetic fields for sharp features and large curvature regions of the metal nanoparticles. For example, it was shown that the electromagnetic SERS enhancement factor could be increased up to nearly 10 11 when the sphere degenerates and becomes sharper [38]. In assition, closely spaced interacting particles can provide extra field enhancement [39]. For example, electromagnetic enhancement factors up to 10 11 have been estimated for the mid-point between two silver or gold spherical particles separated by a gap of 1 nm [38]. Furthermore, the metal nanoparticles exhibit fractal properties [40], such as colloidal clusters formed by aggregation of colloidal particles or metal island films [41]. In such colloidal cluster structures, the individual dipole oscillators of the isolated nanoparticles are coupled and cover wide frequency region from the visible to the near infrared. In this case, the excitation is not distributed uniformly over the entire cluster, but tends to be spatially localized in some hot spots, and the surface of a fractal colloidal cluster structure shows a very inhomogeneous field distribution [42]. The size of the “hot spots” can be as small as a few nm. Their locations depend strongly on the geometry of the fractal object and on the excitation wavelength and polarization of the optical fields [43]. SERS enhancement is estimated to be up to 10 6 for spatially isolated small colloids and 10 7 10 8 for colloidal clusters [44].
The applications of SERS include sensing and imaging applications such as spectroelectrochemistry, single molecule SERS, and analytical and biological applications [45,46,47,48]. The power of SERS is its great ability to identify chemical species and to obtain accurate structural information regarding polymer and materials science, biochemistry and biosensing, catalysis, and electrochemistry [49,50]. Interestingly, SERS can also be used to investigate the orientation of single molecules, as reported by Moskovits et al. [51]. The authors observed the rise of normally forbidden vibrations in SERS spectra as a result of the fast spatial rate of the radiative electric field. Accordingly, they assumed that the change in Raman spectra was due to the different spatial arrangement of the adsorbed molecules on the SERS substrate. As exhaustively discussed by Aroca [52], this approach could be used for evaluating several parameters, ranging from structural to electrical.
Another interesting technique based on the enhancement of the Raman signal is tip enhanced Raman spectroscopy (TERS) [53].
TERS is a near-field method to spectroscopically analyze a wide range of chemical and biological samples with a high spatial resolution of a few nanometers, only limited by the tip apex size and shape (generally of diameter ~10 nm). The tip acts as an individual plasmonic nanostructure and is scanned over the sample using a scanning probe microscopy technique, as comprehensively explained by Fiederling et al. [54]. It provides a localized region of SERS enhancement when brought within a few nanometers from the sample [53]. In this way, it is possible to overcome the limitations of SERS enhancement due to its critical dependence on the substrate preparation. TERS offers the unique ability to attain enhanced Raman signals and topographical information simultaneously. Due to the highly localized nature of the probe, TERS provides signal-to-noise ratios of 10 4 10 5 and achieves an enhancement factor up to 10 6 [55]. It has been used to obtain high-quality Raman spectra of DNA pyrimidine bases [56], and for the nucleobases in a single RNA strand, it provided a high sensitivity at a lateral resolution, down to a few tens of nucleobases [57]. Investigations of cytochrome C revealed that the TERS spectra from different areas of biomacromolecules could be significantly different from those obtained with bulk Raman measurements of the sample [58].
The metallic tip can be replaced by a monolayer of metal nanoparticles, each coated with an ultrathin shell of silica or alumina. Each nanoparticle acts as a tip in the TERS system, and the use of a chemically inert shell coating around the nanoparticle protects the SERS-active nanostructure from contact with the sample, and can overcome the SERS limitation of the roughened metal substrates. SHINERS (shell-isolated nanoparticle-enhanced Raman spectroscopy) can obtain an enhancement that is two to three orders of magnitude higher than that for a single TERS tip, and its main advantage is a much higher detection sensitivity and several practical applications to a great amount of materials with diverse morphologies [59].

2.3. Instrumentation: Raman and microRaman

The first Raman spectroscopy approach employed a non-coherent light sources [4], but today all Raman spectrometers employ a laser source, either a continuous wave or a pulsed laser. Since few years ago, CW lasers were Kr, Ar, or Kr−Ar lasers, which supplied the sample with a continuous source of photons in the visible or IR range, but these have been largely replace by diode-pumped solid-state laser [60]. Pulsed lasers are usually Nd:YAG (1064 nm) or excimer lasers, and are characterized by a much higher power output (10–100 mW) [19]. It should be noted that given the limited duration of the pulse, the detector needs to be locked-in. Moreover, the use of ultrafast lasers combined with gated detectors allows for exploiting the difference in emission time between Raman scattering and fluorescence, substantially removing the latter from the recorded spectrum [61,62]. Different systems can be employed in Raman spectrometers in order to collect the spectral intensity of the signal. The dispersive method requires the use of a diffraction grating, composed of a series of grooves on a reflective support. By changing the angle of incidence of the scattered polychromatic radiation, a frequency selection is possible, thus measuring the intensity versus the frequency or wavenumber. Conversely, the use of an interferometric spectral analyzers allows for acquiring the whole spectrum. Then, by means of a computer algorithm, Fourier transformation is performed, switching from the time domain to the frequency domain. This technique is referred to as FT−Raman spectroscopy.
Conventional Raman spectroscopy has a relatively low spatial resolution ( ~ 1   mm 2 ), hence, for the characterization of nanostructured inorganic and organic materials alike, micro-Raman spectroscopy is preferred. Micro-Raman spectroscopy combines a Raman spectrometer with an optical microscope. By using a high magnification objective, the laser beam can be focused on an area of approximately 1 μ m , being limited only by the diffraction limit of light, reaching a scanning sample depth ranging from few hundreds of nm up to 1 μm [63,64].
Micro-Raman spectroscopy has found relevant applications in the evaluation of internal stresses in various nanocomposite materials [65,66,67], mapping phase and composition of polymer blends [68,69], probing structure and electronic properties of graphene [70], and in carbon nanotubes [71]. Another important use for μ RS is in the determination of the crystal orientation of nanometric structures, such as CdS or GaN nanowires [72,73], which is particularly critical in the fields of electronic and optoelectronic materials.

3. Applications of Raman Spectroscopy

3.1. Carbon Based Materials

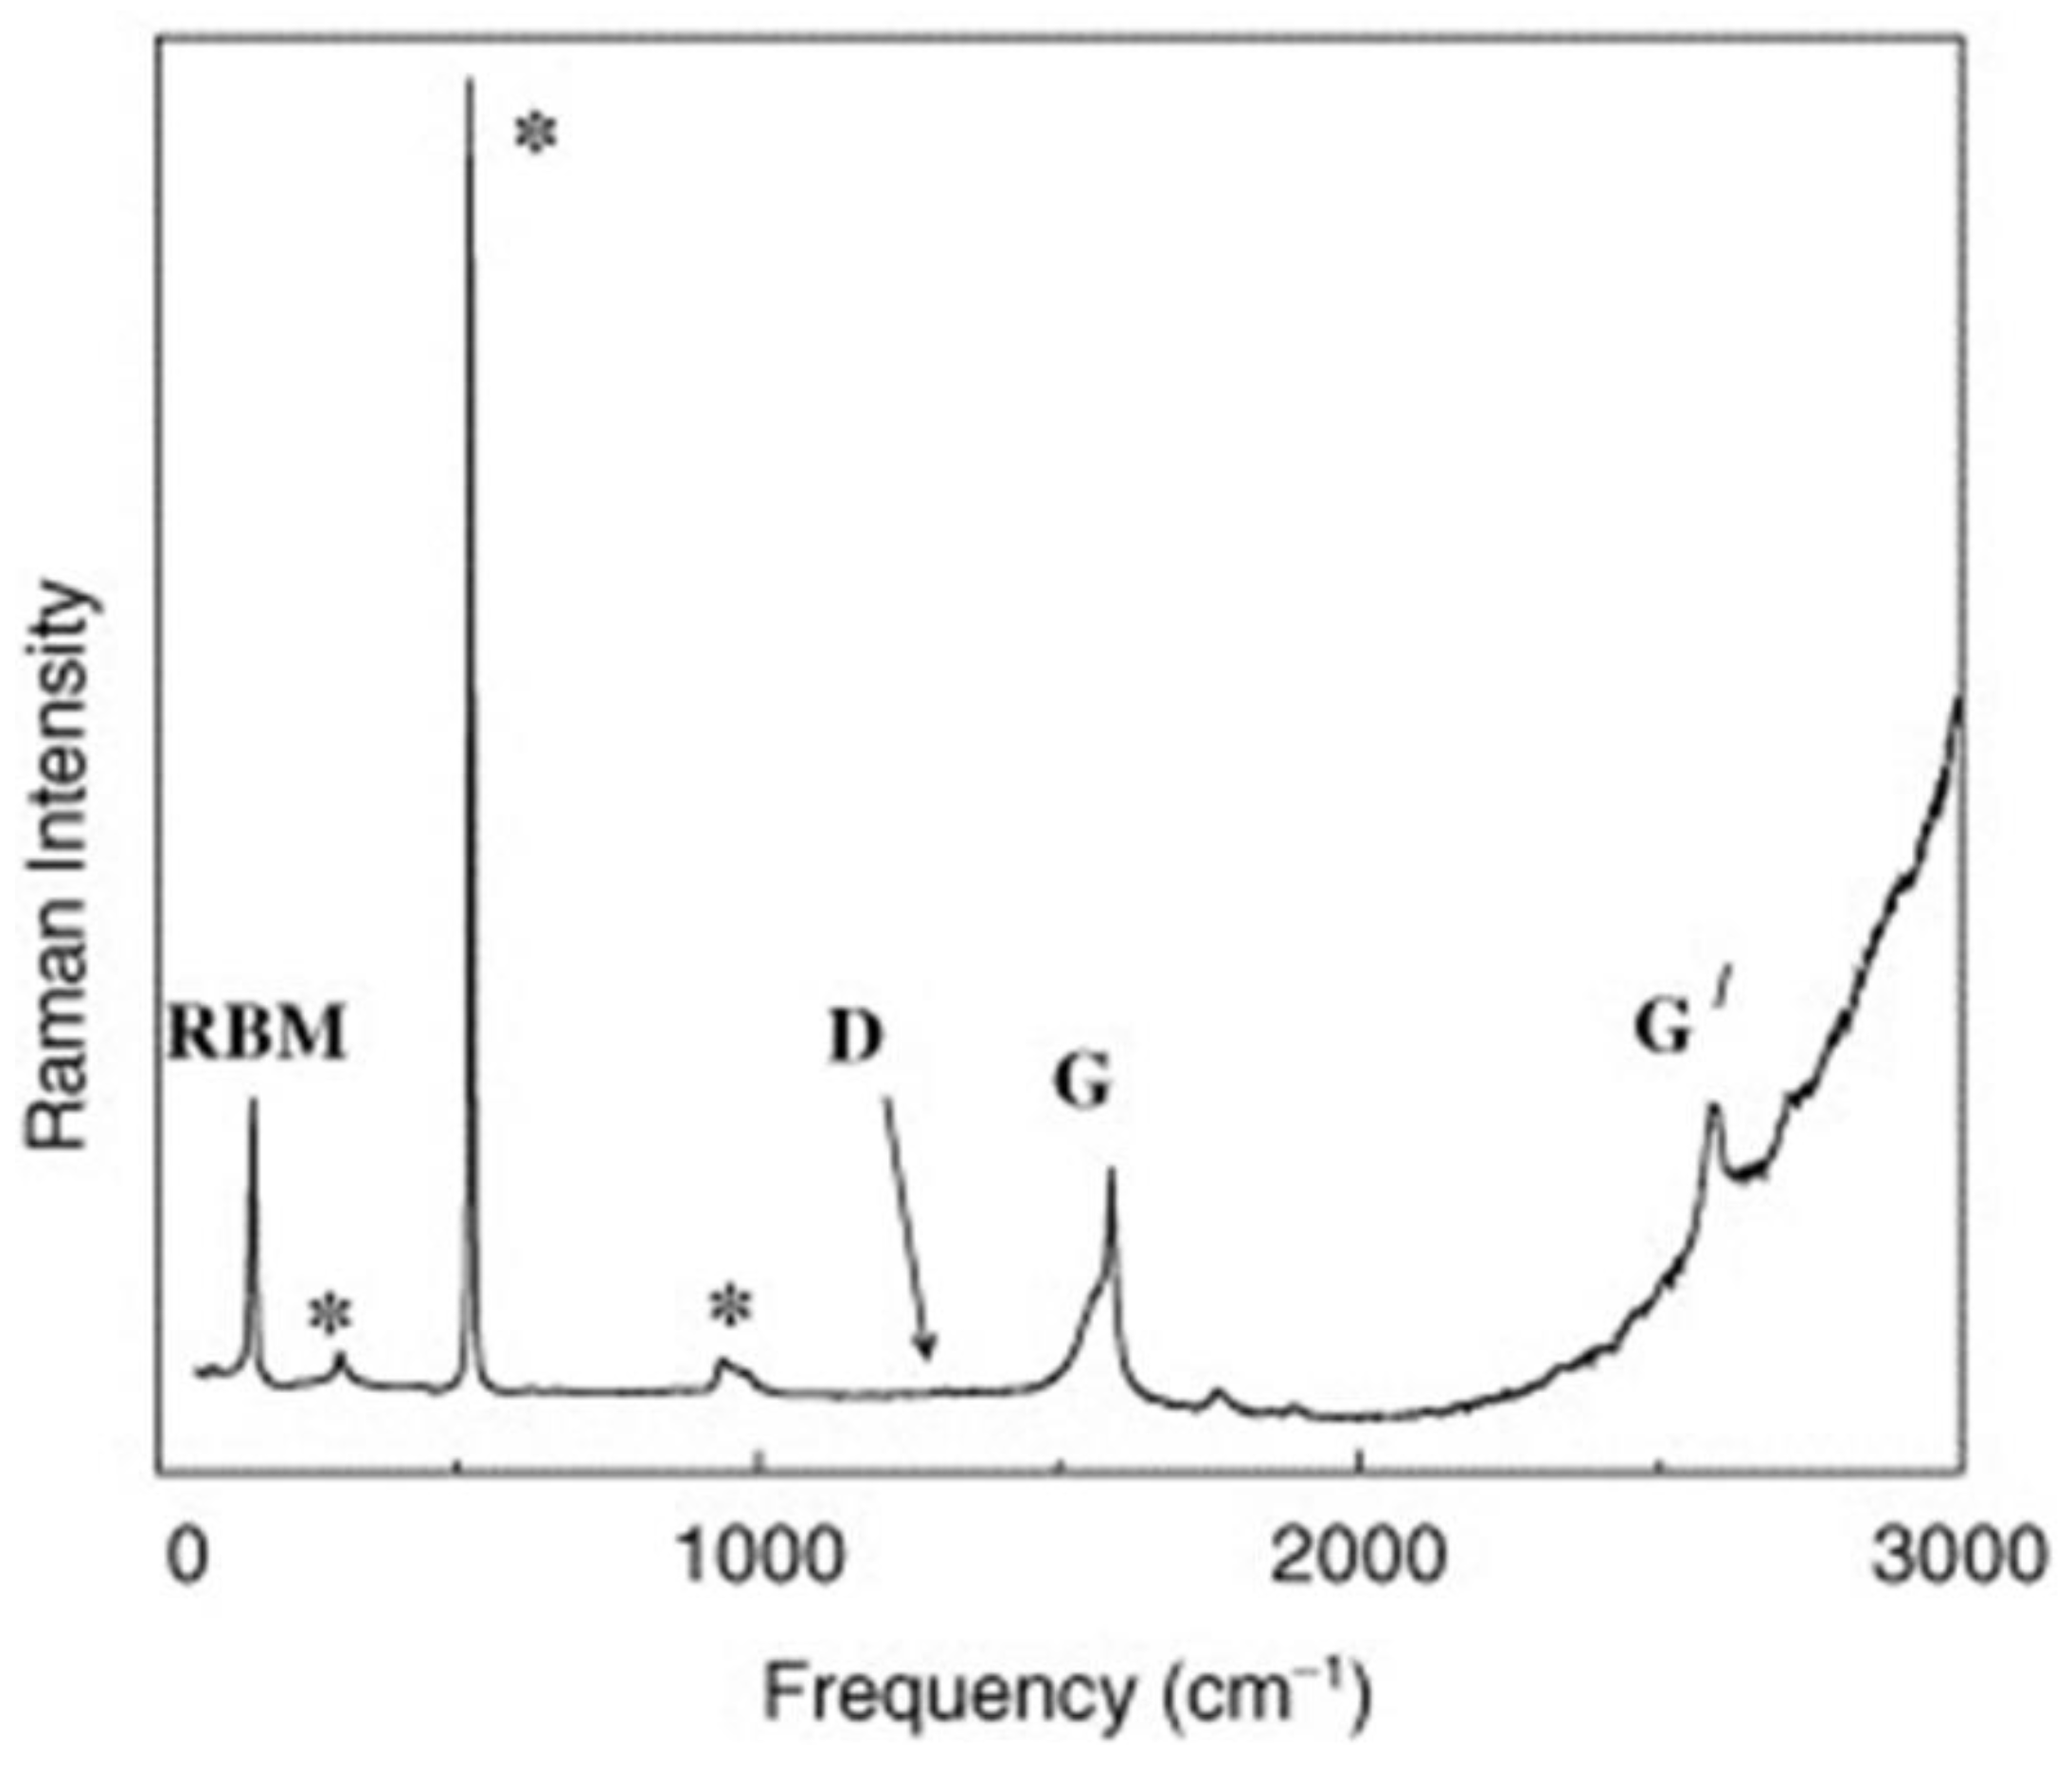
3.1.1. Carbon Nanotubes

Raman spectroscopy can be a powerful tool for the characterization of carbonaceous materials [74]. Accordingly, carbon nanotubes (CNT) have been deeply studied with Raman spectroscopy, helping to unravel the unique features of single-(SWCNTs), double (DWCNTs), and multiwalled (MWCNTs) carbon nanotubes. The one-dimensional (1D) confinement of electronic and phonon states is responsible for the optical and spectroscopic properties observed in SWNTs [75]. Every CNT has a unique Raman active mode, called a radial breathing mode (RMB), at around 100–200 cm−1 [76], as reported in Figure 3.
RBM is crucial for the identification of the different types of CNTs geometry and represents proof the presence of SWNTs, while it is hardly detectable for other CNTs without using SERS [78]. RBM is inversely proportional on the CNT diameter through the equation Equation (11) [75], as follows:
ω R B M = A d + B  
where A and B are determined experimentally and d is the diameter of the CNT. If d > 2 μm, it is difficult to observe RBM because its intensity is very low. With d values obtained from ω R B M and if the electronic transition energy (Eii)~the laser energy (EL), it is possible to perform chiral indice (n,m) assignments for the isolated SWNCTs [79], the diameter d, the density of electronic states, the electronic energy, and the chiral angle θ [79]. Another important feature in the Raman spectra of SWNTs is the so-called G band spectra, which is split into two features around 1580 cm−1 (one peak at 1570 cm−1 and the other at 1590 cm−1). The peak at 1570 cm−1 is also called G, and is associated with vibrations of the carbon atoms around the circumferential direction. The peak at 1590 cm−1 is called G+. G + corresponds to the longitudinal wave mode in the CNT axial direction, and G corresponds to the transverse wave mode perpendicular to the axis. The G Raman shift is proportional to the inverse square of the CNT diameter (α 1/d2). The frequency of G+ appears near 1590 cm−1, regardless of the diameter of the carbon nanotube. The G band is derived from the optical vibration of two adjacent carbon atoms on the wall of the CNT [80], and its frequency does not depend on the excitation wavelength. It can be useful for distinguishing between semiconducting from metallic SWNTs and from the determination of d. Furthermore, the analysis of the G band could be a solid choice for evaluating the ì transfer of charge after SWCNT doping [75]. Concerning the characterization between metallic and semiconducting SWNTs, the following is know: for metallic nanotubes, the lower frequency component of the G peak ( ω G ) has a wide and asymmetric profile, while for semiconducting CNTs, ω G and ω G + have a narrow profile that fits to a Lorentzian line shape [74]. Considering that G band is a first order process, the frequency ω G + is independent of the diameter and chiral angle (θ) [75]. However, ω G depends on d, but not on θ. There are other two features, called second order features [80], named the G’ band (between 2775 and 2950 cm−1) and the D band (1340 cm−1), originating from a highly dispersive double resonance process [78]. The D peak is generally around 1350 cm−1 and derived from defective structures. The intensity ratio of the G band to D band (ID/IG ratio) is used as an indicator of the defect amounts in CNTs, increasing with their growth of defectiveness.
Their band frequencies strongly depend on d [79]. The presence of the G’ band indicates the presence of a long-range order in the sample and is shown for MWCNTs with more than four layers [81]. G’ and D are useful for studying the structural modification of the CNTs sidewalls. Kang al. [82] studied the D band dependence through heating and irradiation. They observed three components of the D band, called D1 (1313 cm−1), D2 (1340 cm−1), and D3 (1355 cm−1). If the laser irradiation increased, the D1 and D2 also intensity increased, while the D3 intensity increased with heating in the air. These were due to the different defects introduced in the structure of the SWCNTs. The purity of the sample can also be investigated using the band intensity ratio ID/IG.
Concerning MWCNTs, the interpretation of their Raman spectra is generally more difficult than for SWCNTs [83]. Accordingly, its interpretation is often based on the results obtained for SWCNTs. In many cases, it is impossible to see the presence of RBM or the splitting of the G band, because the inner shell in MWCNTs has a diameter that is too much big. This proves that the MWCNT spectrum is similar to that of graphite, and shows little or no effects of cylindrical geometry. The G band of MWCNTs is made up of a broad range asymmetric features. With the use of polarized Raman scattering on an SERS substrate, Zhao et al. [84] observed the presence of RBM peaks at low frequency regions (100–600 cm−1). The inner diameter distribution calculated from the RBM frequencies coincided with the observation of high resolution transmission electron microscopy. The intensity of the modes decreases if the dimension of the diameter increased, and when d > 2 μm, the modes disappeared. By using SERS, a splitting of the tangential stretching G band modes was found, proving that MWCNTs have different Raman spectra characteristics compared with other sp2 carbon allotropes [83]. These results were reached by assigning a G band mode from the inner tube and a graphite-like mode from the outer cylinders. The wall−wall charge transfer is responsible for the relative frequencies of the modes. A splitting of the D band in two different features has also been found when the temperature is low [85]. Due to the carbon impurities effect, the ratio between ID and IG cannot be used to calculate the purity of MWCNT. The G’ peak can be used in order to overcome this difficult, because the G’ band intensity depends on the purity of the sample: a disorder structure would not allow for the coupling effect that is fundamental for the two-phonon process. This is due to the fact that the G’ band results from a two phonons process and its intensity is highly sensitive to the sample purity. A ratio containing the G’ peak at about 2700 cm−1 can represent a good measurement of the MWNT quality [86]. In the Raman spectra of MWCNTs bundles, two graphitic bands are visible—the G band at 1580 cm−1 [87] (associated to the in-plane vibration of the C–C bond) and the D band at around 1342 cm−1. Rao et al. [88] showed that the D band of MWCNTs does not imply that the structure of the sample is disordered. Kumar et al. [89] analyzed the effect of the laser and energetic ion irradiation on the Raman spectroscopy. The ratio ID/IG decreases if the laser power density increases. The authors reported the same results with ion irradiation: the ratio between D and G peak (ID/IG) decreases at a low ion influence and increases at a high ion flux. Raman spectroscopy can be useful in order to evaluate the number of carbon nanotube walls. Indeed, Chaunchaiyakul et al. [90] demonstrated that the G’ and G band intensity ratios are correlated with the number of walls of the carbon nanotubes. The G’ band intensity can increase thanks to the inner-tube interaction between the carbon nanotubes. This phenomenon is due to the quantum interference between Raman scattering paths resulting from the interaction between the walls of the carbon nanotubes.

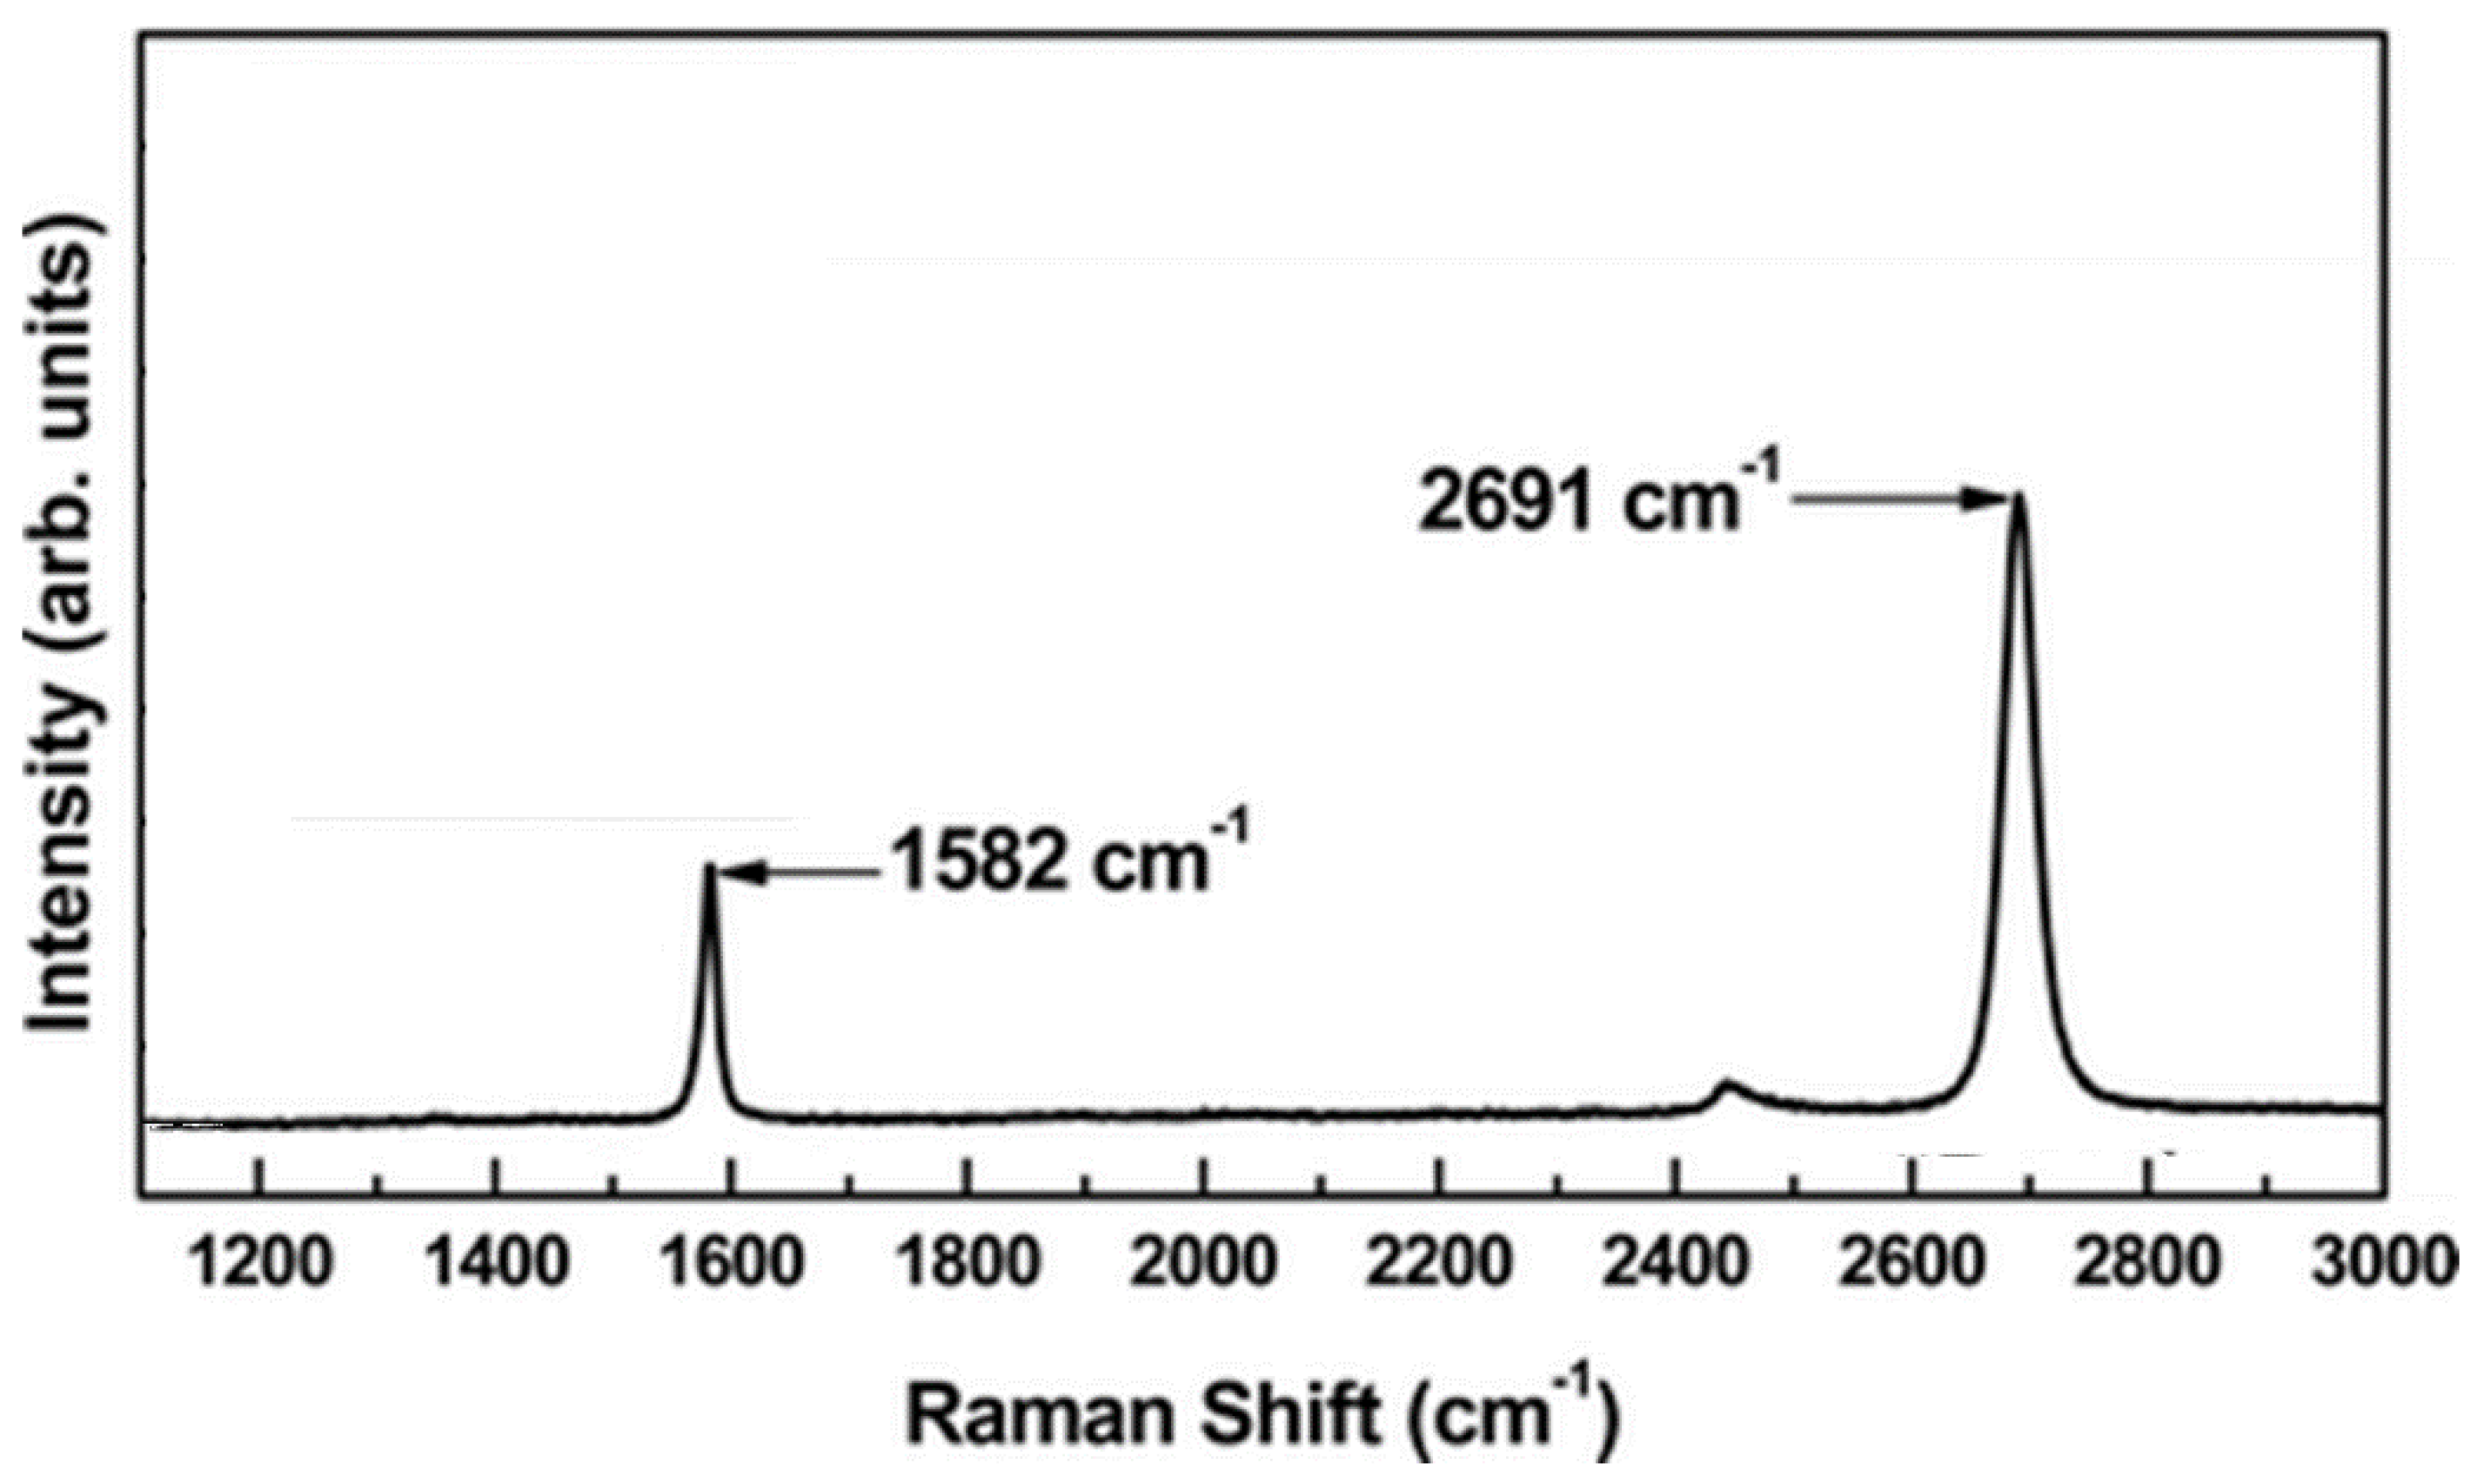
3.1.2. Graphene and Graphene-Like Materials

Over the years, graphene has found plenty interest thanks to its properties, like is mechanical, thermal, optical, and electrical properties. It is a two-dimensional material of sp2 hybridized carbon atoms [91] and has a hexagonal lattice with conjugate covalent bonds formed between the two adjacent carbon atoms [92]. We can distinguish several types of graphene and graphene-like materials, named monolayer graphene, bilayer graphene (2-LG), tri-layer graphene, and multilayer graphene, with a structure resembling that of graphite [93]. The Raman spectra of pure single graphene displays two important peaks named G (at around 1582 cm−1) and 2D (at around 2700 cm−1) [92] (Figure 4).
The G band can be used for the analysis of the structure of the graphene lattice that can be of two types: zigzag or armchair. Defective graphene displays a D peak arising from the presence of boards and defects. However, only armchair edges show the D peak because they are able to experience elastic scattering. We can see the D peak in the zigzag edges, but its intensity is very low, and its presence is due to the roughness and non-uniformity of the edge structure. The bands are also influenced by the temperature [95,96] with a split up of the G band and the G’ band at a low temperature, and a downshift of the G band’s frequency at a high temperature. These changes are reversible in thermal cycles with cooling and heating. Another parameter that can be used to calculate the number of graphene layers is the ratio between G’ and G; this ratio IG’/IG is low if the number of layers is high. In their work, Ferrari et al. [70] observed that the intensities of the D and G’ peaks changed in position shape and intensity with the number of graphene layers. This is due to the evolution of the electronic structure and electron−phonon interactions. Regarding the G band, its intensity increases in a linear fashion if the number of layers is increased. Al-Hazmi et al. [97] used Raman spectroscopy in order to calculate the number of atomic planes of the graphene film grown on the Si substrate. This was possible thanks to the ratio between the intensity of the graphene G band and the optical phonon band of the Si substrate (IG/ISi). Koo et al. [98] used Raman spectroscopy in order to evaluate the role of poly(methyl methacrylate) (PMMA) on graphene fabricated by chemical vapor deposition. They compared bare PMMA-covered supported and PMMA-covered suspended graphene: their G and G’ band positions were progressively downshifted. They also demonstrated, thanks to the mapping of G and G’ shifts into strain and doping contributions, that PMMA residue exerts a tensile strain of about 0.15% on the graphene/substrate compared with that of bare graphene. Woo et al. [99] reported a method to measure the carrier mobility of chemical vapor deposited graphene from their Raman spectra. They found that the width of the G’ peak decreased in proportion to the carrier mobility, while the ratio of ID/IG did not show changes. Furthermore, the mobility generated from the long-range scattering showed a linear relationship with the carrier mobility logarithm. For the monolayer graphene, one of the most important features in the Raman spectra is the G band at 1582 cm−1. This is a normal first order Raman scattering process. There are also G’ and D bands; the G’ band frequency is twice the D band frequency and for this reason it is also called 2D—as they are second order process. Both the D and G’ band frequencies change as a function of the laser intensity; the frequency of the D band changes in a linear way, while the upshift of the G’ band is double that of the D band. The G’ band has a single Lorentzian feature with a width of about 24 cm−1; this spectrum is much larger than the G band spectrum, which can reach four times the G band intensity [100]. Bilayer graphene shows four-peak G’ components due to its electronic structure, and consists of two conduction bands and two valence bands. If we compare the peaks of mono-, bi-, and tri-layer graphene with highly oriented pyrolytic graphite, it is possible to observe that highly ordered graphite shows a higher intensity peak at higher frequencies. Regarding graphene growth on an SiC substrate, there is the problem for the Raman spectra: the SiC spectra (between 1450 and 1750 cm−1) is superimposed on the G-band of the graphene. Moreover, Gokturk et al. [101] showed that during sequential exposure to hydrochloric acid vapors and ammonia of a poly(vinylchloride) supported graphene film, a shift can be appreciated in the Raman 2D band towards a lower and then higher wavenumber. This suggests n-type doping and restoration of graphene to its original state.

3.1.3. Amorphous and Disordered Carbon

Amorphous carbon has attracted much interest in previous years thanks to its wide-ranging properties, allowing for it to be used in many fields like plastic, textile, and health-care industries [102]. Depending on the chemical bonds formed, carbon atoms’ orbitals can hybridize in three different ways—sp3, sp2, and sp. The properties of the amorphous carbon film are defined by the atoms and their arrangements. The sp3 atoms are accounted for their mechanical properties, while the sp2 atoms can determine the optical properties [103]. The atoms can coexist despite having different hybridizations. We can distinguish two forms of amorphous carbon: the hydrogenated amorphous carbon, fabricated by plasma deposition of hydrocarbons, and the black semiconducting film, prepared via sputtering or evaporation [104]. Raman spectroscopy can excite the π and σ states, so it is able to detect sp2 and sp3 sites [105]. It is also used in order to evaluate the disorder of the carbon structures. The Raman spectrum depends on the sp2/sp3 ratio, bond disorder, presence of sp2 rings or chains, and clustering of the sp2 phase. The ordering of the sp2 phase can be explained through the use of a three-stage model proposed by Ferrari et al. [105], with (i) a transition from graphite to nanocrystalline graphite, (ii) a transition from nanocrystalline graphite to amorphous carbon (a-C), and (iii) a final transition from a-C to tetrahedral amorphous carbon (ta–C). During these transitions, the G peak’s position upshifts to higher values and the sp3 content is enhanced. Amorphous carbon often displays a Raman spectrum with a large G band (1510 cm−1) and D band (1350 cm−1), which are sometimes overlapped. Furthermore, there is the so called T peak (at 1060 cm−1), which is visible only with ultraviolet (UV) excitation [105]. The T peak is generated by the C-C sp3 vibrations. Regarding the G peak, it originates from the bond stretching of sp2 atoms in the rings and chains, while the D peak is due to the breathing modes of sp2 atoms that are present in the ring [105]. If there are no rings, there is no D peak. G’ is very low in intensity and is very broad, so it cannot be used in order to characterize amorphous carbon. The Raman spectrum of amorphous carbon is dominated by G and D bands, because the π states are of a lower energy than the σ sites, so they are much more polarizable and there is much scattering by the sp2 sites [106]. The width of the G peak is useful in order to analyze the degree of disorder of the sample: the higher is the disorder, the higher the width. Ferrari et al. [105] defined G peak dispersion as the change of the G peak position for different excitation wavelengths. There is a linear variation for the G peak with different excitation wavelengths: this demonstrates that the higher is the disorder, the higher the dispersion. However, we can also observe a decrement of the Raman shift and shape changes at different wavelengths. The G peak dispersion is due to a selection of sp2 configurations or clusters with a broad π band gap and, correspondingly, more elevated vibration frequencies. Furthermore, the dispersion can be used in order to discriminate two types of material: in the material with only sp2 rings, there is a saturation of G peak dispersion at a maximum of 1600 cm−1. However, if the materials contain sp2 chains, the G peak can reach 1690 cm−1 and this is the case for ta-C or ta-C:H [105]. Concerning the clusters of sp2, they enhanced the G peak position in the Raman spectrum. On the other hand, if a UV light is used as a source of excitation, a decrease of the G peak position can be discerned if the number of clusters is high [105]. Thanks to this property, if two different samples have the same (or similar) Raman spectra, with UV excitation we can discriminate them as follows: the sample with the lower G peak position has more sp2 clustering. The use of UV Raman is particularly useful for the investigation of hydrogenated amorphous carbon (a-C:H) [107], because for highly hydrogenated samples, the Raman spectra is overlapped by photoluminescence. UV Raman is able to overcome this problem and allows for measuring G and D peaks. The D band position is related to the type of amorphous carbon [107] and its intensity is due to the presence of six-fold aromatic rings. With the passage from amorphous carbon to tetrahedral amorphous carbon, the D peak disappears if a Breit Wigner Fano fit is used due to the increment of sp3 sites, and so the ratio ID/IG is close to 0. During the transition from a–C to ta–C, there is also an increment of the amount of sp3 sites (from 10–20% to 85%), while the sp2 sites change from rings to chains [105]. There is also an increase in the G peak position (from 1510 cm−1 to 1570 cm−1) with sp3 content, and this is due to the change of sp2 configuration from rings to olefinic groups. Tuinstra and Koening [8] exposed an equation useful to evaluate the ratio of ID/IG in graphite structures, as reported in Equation (12):
C ( λ ) L a = I D I G
where La is the graphite crystallite size and C is the Raman coefficient. This relation is not valid for amorphous carbon structures, because there are more defects and there is an increase of ordered rings. So, in this case the ratio become proportional to M, the number of ordered rings. A new relationship was proposed by Ferrari et al. [105], as reported in Equation (13):
I D I G = C ( λ ) L a 2
Mariotto et al. [108] found that the ratio of ID/IG is enhanced if the annealing temperature is increased, and so there is a progressive increase in the graphitic domains. The ID/IG ratio in amorphous carbon is a measure useful to evaluate the dimension of the sp2 phase that is organized in rings. The G peak dispersion is notable in more disordered carbon because in that case there are different configurations with different local band gaps and different phonon modes. In contrast, the D peak dispersion and the ratio of ID/IG decrease if there is a higher disorder. Wang et al. [109] found a correlation between the G peak and sp3 atoms. They analyzed hydrogenated and H-free diamond-like carbon (DLC) samples. For the hydrogenated samples, the dispersion rate of the G peaks showed a linear correlation with sp3, while the FWHM of the G peak was non-linearly correlated with the sp3 of the H-free DLC samples. Zhang et al. [110] proposed a method useful for calculating the intensity of the G band as a sum of three different Raman scattering intensities that derive from three different sp2 clusters, as reported in Equation (14):
I G ( ω , λ ) =   I g ( ω , λ ) +   I r ( ω , λ ) +   I c ( ω , λ )
where ω is the Raman frequency; λ is the wavelength of the excitation laser; and Ig Ir, and Ic are the intensities of the scattering of the nanocrystalline graphite, fused aromatic ring, and olefinic chain cluster, respectively. The ratio between the area of the T peak and the G peak IT/IG is useful in order to calculate the sp3 content for ta-C [111]. Ta-C has a spectrum with two bands at around 1100 cm−1 and 1600 cm−1, which are derived from sp2 and sp3, respecitvley. A T peak of about 1060 cm−1 and a ratio of IT/IG of ~0.40–0.42 in H-free samples implies a sp3 content of about 80% [105]. If the ratio of IT/IG is about 0.30–0.40, the sp3 content is about 60–80% [105]. Furthermore, a ratio of IT/IG < 0.2 indicates a poor sp3 content (lower than 20–30%). Gilkes et al. [112] demonstrated that the 1100 cm−1 mode is derived from a mode of 1400 cm−1 that shifts to 1100 cm−1 when the sp3 content is increased. If the structure contains atoms such H (a-C:H), a parameter called m/IG can be used in order to calculate the amount of hydrogen bonded. In the ratio, m indicates the slope of the photoluminescence background in the range 800–1800 cm−1. However, Pardanaud et al. [113] demonstrated that the ratio of m/IG is not very accurate because it can be influenced by various photoluminescence quenching processes and also because it is not sensitive to H bonded to C sp2. They used Raman spectroscopy to identify the H content in a-C. They found a band at 860 cm−1 attributed to H bonded to C (sp2). The height ratio between D and G can be used in order to estimate the H content, because it is almost linear in the full range of H content. Casiraghi et al. [107] analyzed different a-C:H. They found two different behaviors. In the first case, the G peak width and G peak dispersion increased simultaneously, and the Raman parameters varied in the same way as in the hydrogen-free carbon film. In the second case (and this is the case of polymeric a-C:H), they found the opposite results, with the G peak dispersion varied in relation to the optical gap and hydrogen content, while the G peak width varied with the density. Liu et al. [114] studied the spectra of ta-C films as a function of substrate bias voltage. The higher the substrate bias, the higher the sp3 atoms of the diamond-like carbon film (they tested films of about 70 nm), while for a ta-C of 2nm, they observed a linear decrease in sp3 content when the bias was incremented. In another study by Liu et al. [115], they used the Raman spectral of ta–C as a function of the oblique angles of substrates. From the spectra, they observed that the higher the substrate tilting angle, the higher the sp2 content, while less sp3 content was observed. The substrate tilting depends on the sp3 content and on the order of the sp2 cluster, so from the Raman data, they observed a decrease of internal stress while there were no changes in hardness that depended on only the sp3 content. Schwan et al. [116] found two additional peaks at 1180 cm−1 and 1490 cm−1 in the spectra of the carbon film prepared by magnetron sputtering. They demonstrated that the peak at 1180 cm−1 was due to the presence of sp3 stretching in the carbon film.
Another interesting material is the disordered carbon produced from the pyrolytic conversion of both natural and synthetic polymeric materials [117]. As shown in Figure 5, the Raman spectra of pyrolytic carbon displays a G and D peak with more components compared with graphite, but a profile that is not close enough to be similar to diamond-like materials. Accordingly, pyrolytic carbon could be described as a very highly defective graphitic material.
The evolution of G and D peaks could be used to investigate the temperature used for the pyrolytic conversion of polymeric feedstock [119,120,121,122,123,124], but also to evaluate the different feedstock used for the production of carbon [125]. The main issue related to the interpretation of pyrolytic disordered carbon is represented by the fitting procedure that is affected by the uncertainty in the number and the lineshape of the components used. Tagliaferro et al. [118] introduced a symmetric lineshape named GauLor, composed of a central domain with a Lorentzian lineshape linked with to Gaussian tails. GauLor lineshape perfectly matches the stretched exponential decay and represents the first physical approach to overcome the arbitrary use of any kind of lineshape.

3.2. Inorganic Materials

3.2.1. Biological Applications

Metals, ceramics, and polymer nanoparticles may present interesting properties for biological applications such as biocompatibility [126], magnetism [127], and photoluminescence [128]. Their characterization with Raman spectroscopy can reveal important features of the materials under study, for example by probing the interaction between the nanoparticles and the biological environment.
Bhaumik et al. [129] successfully investigated the nano−bio boundaries between ZnO nanoparticles and adenosine triphosphate (ATP; the major player in the energetic transport in cells), showing a pH-dependence on the interaction. Zinc oxide nanoparticles are nontoxic, biocompatible, and usable in drug delivery, medical materials, and cosmetics. Furthermore, the Raman activity of ZnO is very high, making this technique a good probe for studying their interaction with biomolecules. Considerable Raman shifts related to the interaction between ZnO and NH2 bonds in the adenine ring, N7 atom in the adenine ring, and the phosphate bonds have been detected in acidic environments.
Agressott et al. [130] studied protein-coated silver nanoparticles synthetized by common fungi (Rhodotorula mucilaginosa and Rhodotorula glutinis) following a green and biocompatible approach. Using TERS, they successfully investigated the size and the morphology of the protein capping layer, how it interacts with the Ag nanoparticles (the sulphur bridge in amino acids was detected), and how the whole system interacts with the visible light.
The detection of uric acid using silver nanoparticle-coated ZnO/Fe3O4 composites was performed by Alula et al. [131] using surface enhanced Raman spectroscopy (SERS). A linear response was obtained, for up to 10 µM concentrations, for an aqueous solution of uric acid. Finally, an application to determine the uric acid concentration in a real sample of non-treated urine was performed.
Caprara et al. [132] studied the DNA molecule formation using SERS with single DNA chain coated gold nanoparticles, comparing the Raman spectra of the final solution with the starting one. This paved the way for a bottom-up approach for the design of tailored nanostructures, taking advantage of the programmable assembly of DNA. The SERS response showed the successful formation of ordered nanostructures with a controlled interparticle distance.
An interesting improvement with respect to TERS is represented by the SHINERS technique, as reported by Li et al. [59]. It is based on the covering of a targeted substrate with silica encapsulated noble metal nanoparticles. This approach could be combined with portable instrumentation to boost the on-field analysis sensitivity. Furthermore, it has been used by El-Said et al. to detect two of the main neurotransmitters in the human brain (γ-aminobutyric acid and glutamate) that are important in the diagnosis of neurological diseases, using gold nanobipyramids coated with a thin layer of polypyrrole [133]. This process can be used to probe concentrations of γ-aminobutyric acid and glutamate in human serum within a wide range of concentrations.
Erythrosine B coated gold nanoparticles were used by Pinilla-Peñalver et al. [134] as a probe to sense both compounds as a result of the high Raman activity of the dye. For the Au NPs, a linear response was obtained in the 1–12 ng/L range, while for erythrosine B, the linear region resulted in between 5 and 150 µg/L. The detection limits were at 0.3 ng/L and 1.4 µg/L, respectively.
Raman spectroscopy can also be used for the direct sensing of biomolecules such as DNA, proteins, lipids, and carbohydrates. Kuhar et al. [135] showed that this technique can successfully probe inside a set of pure biomolecules: bovine serum albumin (BSA), calf thymus DNA, cholesterol, and glucose. Several unique marker bands have been identified and reproduced.
Butler et al. [136] proposed a detailed protocol to perform Raman spectroscopy on biological samples (i.e., plant tissues, cells, biofluids, etc.), both in vivo and in vitro. The results obtained included a mapping of a portion of endometrial tissue and a classification of blood plasma and serum.
The diagnosis accuracy of tumors can be significantly improved using Raman spectroscopy [137]. Evidence was found for the diagnosis of enchondroma and chondrosarcomas [138], thyroid cancer [139], lung cancer [140], ovarian cancer [141], breast cancer [142], colorectal cancer [143], prostate cancer [144], and many others [145].The advantage of this technique is that the analyses are carried out directly on biological samples that are often easy to obtain (serum, blood, saliva, urine, sperm, etc.), and the results are obtained in a short time. Furthermore, several pathologies and infections can be detected through this technique, and this is especially important in a pandemic event. An example is offered by the research of Ryzhikova et al. [146], who describe a way to anticipate the diagnosis of Alzheimer’s disease using Raman spectroscopy. This is important because this pathology can nowadays be diagnosed through specific neuropsychological tests, but only in the advanced stage. The development of the technique cited in this work could reduce diagnosis times and anticipate treatments and prevention.
Nonalcoholic fatty liver disease is a chronic disease that occurs in two stages. The first phase (NAFL) consists of an initial accumulation of fat in the liver, the second phase (NASH) is steatohepatitis, a degenerative form that can lead to liver cirrhosis and cancer. Gurian et al. [147] developed a SERS-based diagnostic system to discriminate between NAFL and NASH by testing 5 µL of blood plasma on an Ag nanoparticles substrate. The short response time and the ability to differentiate indicates to researchers that SERS could be an excellent method for future diagnoses of NAFL and NASH.
Active tuberculosis and latent tuberculous infection can be detected with both Raman spectroscopy and SERS. Kaewseekhao et al. [148] developed a protocol based on Raman spectroscopy to diagnose and distinguish between active and latent tuberculosis with an accuracy of 91.15%. Furthermore, SERS can distinguish between all TB-infection categories with 100% sensitivity and specificity.
Raman spectroscopy of urine samples can diagnose chronic renal failure (CRF) disease with an acceptable accuracy, as shown in the work of Chen et al. [149], in which genetic algorithms aided in RS obtained accuracies of between approximately 65% and 85%.
Hepatitis C virus (HCV) was detected in blood serum samples from positive patients and healthy individuals using Ag nanoparticles as a substrate for SERS. A similar study showed that Raman spectroscopy is not able to identify single RNA groups of the virus, while SERS is able to [150]. Furthermore, surface enhanced Raman spectroscopy can detect different levels of viral flow in the analyzed biological cells with a good sensitivity.
The Hepatitis B virus has a distinctive Raman signature, and can be detected with SERS by developing algorithms for data processing and recognition, achieving a 98.82% accuracy [151].
Picomolar concentrations in the biofluids of biomarkers of traumatic brain injuries were measured by Rickard et al. [152]. Sub-micrometric pillars covered with a gold nanolayer made it possible to achieve a considerable sensitivity using a hand-held, optofluidic SERS device.
Cardiac troponins are isoforms released by the heart into the blood, especially when it has been damaged. Their concentration in the blood is proportional to the extent of the damage suffered. A troponin LOD has been demonstrated between 7.6 × 10⁻⁴ ng/L and 800 ng/L for SERS devices, whereas the available LOD of laboratory and point-of-care testing for cardiac troponin ranges from 100 to 800 ng/L. The device of Su et al. [153] used a three-dimensional ordered macroporous coupling Au–Ag–Au plasmonic array substrate in addition to Ag−Au nanostars as nanotags [154].
Biomarkers of amyotrophic lateral sclerosis (ALS) could be detected in the saliva of patients using Raman spectroscopy [155]. Such an approach can drastically shorten diagnosis times, which are lengthened by symptom checks, which are often very similar between different pathologies (Alzheimer’s disease, Parkinson’s disease, ALS, etc.). Thus, a fingerprint of the different biomarkers could lead to precise and quick diagnoses of the most dangerous neurogenerative diseases.
Recently, Acri et al. [156] proposed a method to diagnose the pediatric onset of inflammatory dowel diseases, such as ulcerative colitis and Crohn’s disease. Their approach involved taking fecal samples to be analyzed with Raman spectroscopy and compared with the fingerprints of the various pathologies. The secondary structure of some proteins is modified by inflammation—there is a greater ratio between non-reducible and reducible cross-linking in the case of infection, which can be detected by Raman spectroscopy.
The COVID-19 pandemic has changed the lives of billions of people around the world. One of the challenges is to develop a quick, effective, and low-cost test to diagnose this virus as well as those to come. Jadhav et al. [157] proposed a microfluidic device coupled with Raman spectroscopy to trap the virus collected by biological secretions (saliva, tears, and nasopharyngeal fluid) and study its SERS signature. The signal enhancement is produced by Ag/Au nanoparticles that cover the carbon nanotubes placed in the microfluidic device.
Gang Yin et al. [158] proposed a Raman approach to identify Coronavirus infection in human serum. A machine learning support-vector machine (SVM) was used to create a fingerprint database, in order to improve the quality and speed of diagnosis over time.
Another approach was recently proposed by Elsharif et al. [159], using a layered surface to detect SARS-CoV-2 in a biological sample. The SERS structure is composed of a polydimethylsiloxane nanoarray creating a nanocavity in which light reflects on the sample several times. A gold nanorod substrate is then placed on the top, which could improve the SERS influence by three orders of magnitude.
A very interesting field of study is represented by the Raman spectroscopy of a living cell [160]. As reported by Li et al. [161], this approach could be used to evaluate the functionalities of lipid droplets and bacteria by analyzing the finger print region showing the relative abundance of chemical functions, as reported in Figure 6.
This approach was also used to monitor the organelle in vivo [162,163], the chromosomes [164], and for the evaluation of the hemoglobin in red blood cells and for the density of water inside the cells [165]. This last study is particularly interesting because it proved the presence of a strong and highly organized hydrogen bond network in the cytosol.
Raman spectroscopy has also been used for analyzing the structural features of epithelial tissue [166,167] in order to detect and diagnose precancerous changes [168].

3.2.2. Mineralogy

Raman spectroscopy, being a non-destructive, precise, and fast technique, is a common tool in mineralogy for the analysis of a large variety of samples. Furthermore, the Raman analysis of a mineralogical sample can provide a punctual, linear, surface, and in some cases even three-dimensional mapping of the analyzed sample. Due to these characteristics, Raman spectroscopy is used to analyze jewels, minerals, works of art, and historical artifacts.
Nasdala et al. [169] reported that this technique can investigate inside the inner structure of mineralogic samples in different temperature and pressure conditions. These in situ experiments can be interesting in the case of a sample with temperature and pressure related properties. Raman band shifts can be used for indirect measurement of the condition of the sample under analysis. This led Schmidt et al. [170] to present a Raman-based pressure sensor that can work even at high temperatures, at which the ruby luminescence technique does not. Their research discovered a linear dependence of the ν3 Raman band of fully crystalline synthetic zircon (Zr0.987Hf0.013[SiO4]) with pressure between 0.1 MPa and 6.6 GPa.
Raman spectroscopy also helps rovers on other planets to analyze extraterrestrial rocks. The Perseverance rover is equipped with two Raman instruments: SHERLOC (Scanning Habitable Environments with Raman and Luminescence for Organics and Chemicals) and SuperCam. The first is located on the arm turret of the rover and is associated with an X-ray fluorescence instrument. It works at an excitation wavelength of 248.6 nm (deep UV) and is used to study the surface of the samples taken. The second includes laser-induced breakdown spectroscopy (LIBS), time-resolved Raman and luminescence spectroscopy, and visible–infrared (VISIR) spectroscopy [171].
Yiheng et al. [172] scanned the lunar meteorite NWA 10480, found in 2015, with Raman, finding shifts related to olivine, plagioclase, pyroxene, and Fe-Ti oxide. The data elaborated from the 650+ collected 2D spectra showed that NWA 10480 consists of 49 vol.% pyroxene, 20 vol.% plagioclase, 15 vol.% olivine, and 3 vol.% Fe-Ti oxides.
A similar work was done by Haijun et al. [173], who performed a Raman analysis on the NWA 4884 meteorite, reporting a large amount of Raman modes for the mineral phases of the sample. The composition of the analyte appeared to be very different from that of the study mentioned above. In fact, the results showed a composition of 42.4 vol.% pyroxene, 26.6 vol.% plagioclase, 20.7 vol.% olivine, and only traces of Fe-Ti oxides. These results are an average taken along the whole sample, which consisted of domains in which a single phase prevailed among the others. This proved the great lunar mineralogical variety and that the lunar meteorites arriving on the Earth’s surface may come from different and distant areas of our satellite.
Polavaram et al. [174] proposed an innovative protocol to create 2D maps of mineralogical samples. The method proposed in this work greatly reduce the analysis times as it is able to analyze non-polished samples with an auto-focusing Z-mapping feature that allows for identifying different polymorphs with great accuracy (<97%) and a high spatial resolution (<0.3–2 µm).
Raman spectroscopy has been used as new certification method for precious minerals (especially diamonds, rubies, and sapphires) [175]. The idea consists of marking the mineral using a femtosecond laser, and creating a QR code in which all the information on the material (carat weight, origin, processing, etc.) is saved. Raman mappings and scanning electron microscope images revealed that the dots had a diameter of 14 microns and were spaced 14–18 microns apart. The effectiveness of the marking can be seen from the Raman spectra. For example, diamond exhibits graphitization in the areas exposed to the laser and this is very noticeable from the Raman spectrum. In fact, here, the classic Raman peak of the diamond (sp3 carbon) located at about 1340 cm−1 is accompanied by the D and G bands, which underline the presence of the sp2 bond. This is further confirmed by the presence of second order peaks at 2740 cm−1 (2D peak) and 2940 cm−1 (D and G peak).
Culka et. al. [176] proposed an easy, fast, and portable method for the in situ identification of minerals using a portable sequentially shifted excitation Raman spectrometer and the online RRUFF database. The Raman apparatus automatically removes the fluorescence background and compares the obtained spectra with the RRUFF database for matching minerals. In the test proposed by the researchers, the system recognized 19 out of 20 mineral species, confirming itself as a good method for the in situ identification of gemstones.

3.3. Advanced Applications

3.3.1. Cultural Heritage

Raman spectroscopy has gained great attention in the field of cultural heritage diagnostics [177]. The non-destructive Raman analysis has been used to evaluate the ageing and degradation of plenty of precious artifacts, paints, and statues [178].
Prieto et al. [179] investigated, through Raman spectroscopy, a relatively recent paper-based artifact, a 18 century Spanish playing card found in Perú. The authors were able to identify the composition of the inorganic pigments used and the degradation of the cellulosic materials. Cellulose-based historical artifacts represent a very interesting family for Raman investigation [180,181]. The analysis of pigments used in medieval manuscripts enlightens modern researchers about the techniques developed in the monastery during the middle ages [182,183]. Micro Raman analysis could be also used to explore the ageing of far older cellulosic materials, such as a three-thousand-year-old mummy dating back to the late period of ancient Egypt. Mummies are another relic of the past that have been deeply analyzed using Raman spectroscopy. Several studies have investigated organic tissue ageing in different and far regions of the global [184,185]. Ancient inorganic-based artifacts represent another field of interest for Raman analysis. Barone et al. [186] investigated the composition of a Roman jewels collection, identifying each gemstone used.
Colomban et al. [187] investigated the arsenic content in European porcelain. By using Raman spectroscopy, the authors were able to build a timeline of the evolution of ceramic pigments across centuries in the European region.
The Raman analysis of painting is very interesting considering the amount of information recovered from a simple Raman spectrum.
Antunes and co-workers [188] were able to evaluate even the ground layers behind 15−16 century Portuguese paint though micro Raman analysis. The authors identified gypsum and inorganic anhydrite with a good match. Furthermore, wall painting could be analyzed as reported by Appolonia et al. [189]. The authors described with a great accuracy the inorganic species used in the realization of wall paint preserved in the northwest of Italy, finding a good agreement between Raman outputs and X-ray fluorescence investigation.
Raman spectroscopy has also been used for evaluating bronze patinas, reporting the negative effect of several environmental conditions [190,191]. Based on this study, a more efficient preservation policy could be enforced to limit the environment degradation of rare and ancient artifacts.

3.3.2. Quality Control and Analytical Processes

Raman spectroscopy could also be used as a quality control tool for monitoring chemicals crystallization [192]. Roozeboom et al. [193] reported a study about the use of the Raman technique as an analytical tool for monitoring the precipitation and crystallization of different types of zeolite. The authors described the disappearance of complex aluminum hydroxide with the advancement of zeolite formation, and they were able to discriminate between zeolite A, B, and Y by observing the signals in the region from 300 cm−1 up to 680 cm−1. The production of pharmaceutics could be also monitored by the Raman technique, as reported by Strachan et al. [194]. In this field, the ability of Raman spectroscopy to identify the different crystalline configurations of bio-active molecules represents a solid point in favor of the use of this approach [195]. Wang et al. [196] estimated the shelf life of aspirin tablets through simple Raman analysis, achieving results comparable with those from high performance liquid chromatography. As a quality control tool, Raman spectroscopy was used by Hali et al. [197] to evaluate the distribution of paracetamol and caffeine in drug grains. The authors were able to provide a positive/negative control regarding the presence of the correct ratio between the active bio-molecule identifying the unacceptable materials.
Raman spectrometers are also used in the food industry as rapid on-line and in-situ quality control for fish, meat, and drink production [198].
Kneipp et al. [199] firstly reported single molecule SERS that offers significant advantages when compared with single molecule fluorescence [44]. SERS is also developed for use in spectroelectrochemistry, and in conjunction with electrochemistry, it allows for detecting the behavior of molecules in different oxidation states. The structural changes and redox properties of the molecule tetrathiafulvalene were monitored by SERS [200]. Dynamic SERS imaging inside a living cell can be examined by means of a gold nanoparticle, which travels through the intracellular space to probe the local molecular information. Simultaneous tracking of the particle motion and SERS spectroscopy provides molecular maps of organelle transport and lysosomal accumulation [201]. SERS imaging can provide chemical information with a spatial resolution in the micrometer range, and label-free imaging of biofilms has also been performed [202]. In addition, the SERS capability to detect the chemical vapor for the sensing of highly toxic molecules, such as chemical warfare agents and toxic industrial chemicals, has been demonstrated. Overcoming the lack of interaction between of these molecules with the surface, detection was run using a device such as a combined microfluidics-SERS sensor [203]. Explosives such as the half-mustard agent [204] and dinitrobenzenethiol [205] have been successfully detected using SERS. Of significant interest is the transition of SERS detection from the lab to the field [206]. The advent of portable Raman spectrometers allows for on-field SERS measurements of real-time environmental chemical analysis and monitoring, ranging from the structural characterization of soils, through ultrasensitive detection of pollutants and heavy metal ions, to the analysis of plants, tissues, and microorganisms [207]. Stand-off detection by SERS is made possible with optical fiber probes [208], relevant for in vivo measurement or biomedical applications involving offset measurements through the skin, and the stand-off molecular detection from samples at distances of 15 m [206]. The detection and identification of dilute bacterial samples by SERS has been explored by mixing aqueous suspensions of bacteria with a suspension of nanocolloidal silver particles. The detection limit of this technique is ~ 10 3 cfu/mL, which is quite promising compared with conventional detection methods [209].
SERS is also a promising method for the ultrasensitive detection of chemical species that are relevant to homeland security [210].

4. Considerations about the Limitations and Advantages of Raman Spectroscopy

Raman spectroscopy has found many applications in advanced materials science characterization. Nonetheless, its spread has led to a several misunderstandings in data elaboration and interpretations. The best example of this misleading approach is represented by the elaboration of disordered carbon. In the scientific literature, many papers faced the fitting of a Raman signal using an arbitrary number of components [211,212,213], selecting lineshapes without a solid physical reason [214,215].
A more general and neglected issue is represented by the baseline correction of the spectra. Baselining is the first and most crucial step for any Raman spectra elaboration, and even though many approaches have been developed [216,217,218,219], not enough researchers use them in an appropriate way.
Moreover, Raman quantitative analysis may be unreliable if not compared with and validated by supported well established procedures [220].
Nonetheless, Raman spectroscopy could provide a very good insight for investigating many materials, and with the creation of large databases, qualitative Raman analysis will be more and more reliable [221,222,223,224].
A concise summary of the information and limitations encountered for several materials and stressed in manuscript are reported in Table 1.

5. Conclusions

Raman spectroscopy is a very powerful and polyhedral tool that could be used for the investigation of many fields and many more materials.
As we discussed, Raman is useful for advanced materials science and real-life applications, always providing a deep and meaningful insight into the properties and arrangement of the sample analyzed. Considering the decreasing cost of Raman instruments and their portability, the spread of on-field Raman analysis will mark a new game changing event establishing the advanced materials characterization as a routine analysis.
Considering the vast literature discussed above, we firmly hope that this review will represent a reference point for newcomers and a useful tool for field experts as well.

Author Contributions

Conceptualization, M.B.; writing—original draft preparation, A.O., F.F., C.M., S.P., M.B., M.R. and A.T.; writing—review and editing, A.O., F.F., C.M., S.P., M.B., M.R. and A.T.; supervision, A.T. All authors have read and agreed to the published version of the manuscript.

Funding

This research received no external funding.

Conflicts of Interest

The authors declare no conflict of interest.

References

  1. Scotter, C.N.G. Non-destructive spectroscopic techniques for the measurement of food quality. Trends Food Sci. Technol. 1997, 8, 285–292. [Google Scholar] [CrossRef]
  2. Bicchieri, M.; Sodo, A.; Piantanida, G.; Coluzza, C. Analysis of degraded papers by non-destructive spectroscopic techniques. J. Raman Spectrosc. 2006, 37, 1186–1192. [Google Scholar] [CrossRef]
  3. Pelletier, M.J. Analytical Applications of Raman Spectroscopy; Blackwell Science: Oxford, UK, 1999. [Google Scholar]
  4. Raman, C.V. A new radiation. Indian J. Phys. 1928, 2, 387–398. [Google Scholar] [CrossRef]
  5. Landsberg, G.; Mandelstam, L. Eine neue Erscheinung bei der Lichtzerstreuung in Krystallen. Die Nat. 1928, 16, 557–558. [Google Scholar]
  6. Platonenko, V.T.; Khokhlov, R.V. On the mechanism of operation of a raman laser. J. Exptl. Theor. Phys. 1966, 19, 555–559. [Google Scholar]
  7. Hendra, P.J.; Stratton, P.M. Laser-raman spectroscopy. Chem. Rev. 1969, 69, 325–344. [Google Scholar] [CrossRef]
  8. Tuinstra, F.; Koenig, J.L. Raman Spectrum of Graphite. J. Chem. Phys. 1970, 53, 1126–1130. [Google Scholar] [CrossRef] [Green Version]
  9. Yang, D.; Ying, Y. Applications of Raman Spectroscopy in Agricultural Products and Food Analysis: A Review. Appl. Spectrosc. Rev. 2011, 46, 539–560. [Google Scholar] [CrossRef]
  10. Parimaladevi, R.; Sathe, V.; Mahalingam, U. Graphene boosted silver nanoparticles as surface enhanced Raman spectroscopic sensors and photocatalysts for removal of standard and industrial dye contaminants. Sens. Actuators B Chem. 2019, 281, 679–688. [Google Scholar] [CrossRef]
  11. Auer, B.M.; Skinner, J.L. IR and Raman spectra of liquid water: Theory and interpretation. J. Chem. Phys. 2008, 128, 224511. [Google Scholar] [CrossRef]
  12. Picard, A.; Daniel, I.; Montagnac, G.; Oger, P. In situ monitoring by quantitative Raman spectroscopy of alcoholic fermentation by Saccharomyces cerevisiae under high pressure. Extremophiles 2007, 11, 445–452. [Google Scholar] [CrossRef]
  13. Rohleder, D.R.; Kocherscheidt, G.; Gerbe, K.; Köhler, W.; Möcks, J.; Petrich, W.H. Comparison of mid-infrared and Raman spectroscopy in the quantitative analysis of serum. J. Biomed. Opt. 2005, 10, 31108–31118. [Google Scholar] [CrossRef] [Green Version]
  14. Jung, N.; Crowther, A.C.; Kim, N.; Kim, P.; Brus, L. Raman Enhancement on Graphene: Adsorbed and Intercalated Molecular Species. ACS Nano 2010, 4, 7005–7013. [Google Scholar] [CrossRef] [PubMed]
  15. Sadeghi-Jorabchi, H.; Wilson, R.H.; Belton, P.S.; Edwards-Webb, J.D.; Coxon, D.T. Quantitative analysis of oils and fats by Fourier transform Raman spectroscopy. Spectrochim. Acta Part A Mol. Spectrosc. 1991, 47, 1449–1458. [Google Scholar] [CrossRef]
  16. Frausto-Reyes, C.; Medina-Gutiérrez, C.; Sato-Berrú, R.; Sahagún, L.R. Qualitative study of ethanol content in tequilas by Raman spectroscopy and principal component analysis. Spectrochim. Acta Part A Mol. Biomol. Spectrosc. 2005, 61, 2657–2662. [Google Scholar] [CrossRef]
  17. Born, M.; Wolf, E. Principles of Optics: Electromagnetic Theory of Propagation, Interference and Diffraction of Light; Pergamon Press: New York, NY, USA, 2013. [Google Scholar]
  18. Kudelski, A. Analytical applications of Raman spectroscopy. Talanta 2008, 76, 1–8. [Google Scholar] [CrossRef]
  19. Ferraro, J.R. Introductory to Raman Spectroscopy; Academic Press: San Diego, CA, USA, 2003. [Google Scholar]
  20. Geraldes, C.F.G.C. Introduction to Infrared and Raman-Based Biomedical Molecular Imaging and Comparison with Other Modalities. Molecules 2020, 25, 5547. [Google Scholar] [CrossRef] [PubMed]
  21. Smith, E.; Dent, G. Modern Raman Spectroscopy: A Practical Approach; Wiley: Hoboken, NJ, USA, 2005. [Google Scholar]
  22. Colthup, N. Introduction to Infrared and Raman Spectroscopy; Academic Press: New York, NY, USA, 2012. [Google Scholar]
  23. Naik, G.V.; Shalaev, V.M.; Boltasseva, A. Alternative plasmonic materials: Beyond gold and silver. Adv. Mater. 2013, 25, 3264–3294. [Google Scholar] [CrossRef]
  24. Naik, G.V.; Kim, J.; Boltasseva, A. Oxides and nitrides as alternative plasmonic materials in the optical range. Opt. Mater. Express 2011, 1, 1090–1099. [Google Scholar] [CrossRef] [Green Version]
  25. Jeon, T.Y.; Kim, D.J.; Park, S.-G.; Kim, S.-H.; Kim, D.-H. Nanostructured plasmonic substrates for use as SERS sensors. Nano Converg. 2016, 3, 1–20. [Google Scholar] [CrossRef] [Green Version]
  26. Kooij, E.S.; Ahmed, W.; Zandvliet, H.J.; Poelsema, B. Localized plasmons in noble metal nanospheroids. J. Phys. Chem. C 2011, 115, 10321–10332. [Google Scholar] [CrossRef]
  27. Tsuneda, T.; Iwasa, T.; Taketsugu, T. Roles of silver nanoclusters in surface-enhanced Raman spectroscopy. J. Chem. Phys. 2019, 151, 094102. [Google Scholar] [CrossRef] [PubMed]
  28. Duque, J.; Blandón, J.; Riascos, H. Localized Plasmon resonance in metal nanoparticles using Mie theory. J. Phys. Conf. Ser. 2017, 850, 012017. [Google Scholar] [CrossRef]
  29. Horvath, H. Gustav Mie and the scattering and absorption of light by particles: Historic developments and basics. J. Quant. Spectrosc. Radiat. Transf. 2009, 110, 787–799. [Google Scholar] [CrossRef]
  30. Drude, P. Zur elektronentheorie der metalle. Ann. Der Phys. 1900, 306, 566–613. [Google Scholar] [CrossRef] [Green Version]
  31. Coronado, E.A.; Schatz, G.C. Surface plasmon broadening for arbitrary shape nanoparticles: A geometrical probability approach. J. Chem. Phys. 2003, 119, 3926–3934. [Google Scholar] [CrossRef]
  32. Kreibig, U. Electronic properties of small silver particles: The optical constants and their temperature dependence. J. Phys. F Met. Phys. 1974, 4, 999. [Google Scholar] [CrossRef]
  33. Kneipp, K.; Kneipp, H.; Itzkan, I.; Dasari, R.R.; Feld, M.S. Surface-enhanced Raman scattering and biophysics. J. Phys. Condens. Matter 2002, 14, R597. [Google Scholar] [CrossRef] [Green Version]
  34. Álvarez-Puebla, R.A. Effects of the Excitation Wavelength on the SERS Spectrum. J. Phys. Chem. Lett. 2012, 3, 857–866. [Google Scholar] [CrossRef] [PubMed]
  35. Kerker, M.; Siiman, O.; Bumm, L.; Wang, D.-S. Surface enhanced Raman scattering (SERS) of citrate ion adsorbed on colloidal silver. Appl. Opt. 1980, 19, 3253–3255. [Google Scholar] [CrossRef] [PubMed]
  36. Wang, D.-S.; Kerker, M. Enhanced Raman scattering by molecules adsorbed at the surface of colloidal spheroids. Phys. Rev. B 1981, 24, 1777–1790. [Google Scholar] [CrossRef]
  37. Zeman, E.J.; Schatz, G.C. An accurate electromagnetic theory study of surface enhancement factors for silver, gold, copper, lithium, sodium, aluminum, gallium, indium, zinc, and cadmium. J. Phys. Chem. 1987, 91, 634–643. [Google Scholar] [CrossRef]
  38. Xu, H.; Aizpurua, J.; Käll, M.; Apell, P. Electromagnetic contributions to single-molecule sensitivity in surface-enhanced Raman scattering. Phys. Rev. E 2000, 62, 4318–4324. [Google Scholar] [CrossRef] [Green Version]
  39. Inoue, M.; Ohtaka, K. Surface enhanced Raman scattering by metal spheres. I. Cluster effect. J. Phys. Soc. Jpn. 1983, 52, 3853–3864. [Google Scholar] [CrossRef]
  40. Qiu, T.; Wu, X.L.; Shen, J.C.; Xia, Y.; Shen, P.N.; Chu, P.K. Silver fractal networks for surface-enhanced Raman scattering substrates. Appl. Surf. Sci. 2008, 254, 5399–5402. [Google Scholar] [CrossRef]
  41. Weitz, D.; Oliveria, M. Fractal structures formed by kinetic aggregation of aqueous gold colloids. Phys. Rev. Lett. 1984, 52, 1433–1436. [Google Scholar] [CrossRef]
  42. Shalaev, V.M. Electromagnetic properties of small-particle composites. Phys. Rep. 1996, 272, 61–137. [Google Scholar] [CrossRef]
  43. Sarychev, A.K.; Shalaev, V.M. Electromagnetic field fluctuations and optical nonlinearities in metal-dielectric composites. Phys. Rep. 2000, 335, 275–371. [Google Scholar] [CrossRef]
  44. Kneipp, K.; Kneipp, H.; Kartha, V.B.; Manoharan, R.; Deinum, G.; Itzkan, I.; Dasari, R.R.; Feld, M.S. Detection and identification of a single DNA base molecule using surface-enhanced Raman scattering (SERS). Phys. Rev. E 1998, 57, R6281. [Google Scholar] [CrossRef]
  45. Abalde-Cela, S.; Aldeanueva-Potel, P.; Mateo-Mateo, C.; Rodríguez-Lorenzo, L.; Alvarez-Puebla, R.A.; Liz-Marzán, L.M. Surface-enhanced Raman scattering biomedical applications of plasmonic colloidal particles. J. R. Soc. Interface 2010, 7, S435–S450. [Google Scholar] [CrossRef] [Green Version]
  46. Garcia-Rico, E.; Alvarez-Puebla, R.A.; Guerrini, L. Direct surface-enhanced Raman scattering (SERS) spectroscopy of nucleic acids: From fundamental studies to real-life applications. Chem. Soc. Rev. 2018, 47, 4909–4923. [Google Scholar] [CrossRef]
  47. Alvarez-Puebla, R.A.; Liz-Marzán, L.M. SERS-based diagnosis and biodetection. Small 2010, 6, 604–610. [Google Scholar] [CrossRef] [PubMed]
  48. Langer, J.; Jimenez de Aberasturi, D.; Aizpurua, J.; Alvarez-Puebla, R.A.; Auguié, B.; Baumberg, J.J.; Bazan, G.C.; Bell, S.E.J.; Boisen, A.; Brolo, A.G.; et al. Present and Future of Surface-Enhanced Raman Scattering. ACS Nano 2020, 14, 28–117. [Google Scholar] [CrossRef] [Green Version]
  49. Sharma, B.; Frontiera, R.R.; Henry, A.-I.; Ringe, E.; Van Duyne, R.P. SERS: Materials, applications, and the future. Mater. Today 2012, 15, 16–25. [Google Scholar] [CrossRef]
  50. Zhao, F.; Wang, W.; Zhong, H.; Yang, F.; Fu, W.; Ling, Y.; Zhang, Z. Robust quantitative SERS analysis with Relative Raman scattering intensities. Talanta 2021, 221, 121465. [Google Scholar] [CrossRef] [PubMed]
  51. Moskovits, M.; DiLella, D.; Maynard, K. Surface Raman spectroscopy of a number of cyclic aromatic molecules adsorbed on silver: Selection rules and molecular reorientation. Langmuir 1988, 4, 67–76. [Google Scholar] [CrossRef]
  52. Aroca, R. Surface-Enhanced Vibrational Spectroscopy; John Wiley & Sons: Cichester, UK, 2006. [Google Scholar]
  53. Stöckle, R.M.; Suh, Y.D.; Deckert, V.; Zenobi, R. Nanoscale chemical analysis by tip-enhanced Raman spectroscopy. Chem. Phys. Lett. 2000, 318, 131–136. [Google Scholar] [CrossRef]
  54. Fiederling, K.; Abasifard, M.; Richter, M.; Deckert, V.; Gräfe, S.; Kupfer, S. The chemical effect goes resonant–a full quantum mechanical approach on TERS. Nanoscale 2020, 12, 6346–6359. [Google Scholar] [CrossRef]
  55. Bailo, E.; Deckert, V. Tip-Enhanced Raman Spectroscopy of Single RNA Strands: Towards a Novel Direct-Sequencing Method. Angew. Chem. Int. Ed. 2008, 47, 1658–1661. [Google Scholar] [CrossRef]
  56. Rasmussen, A.; Deckert, V. Surface- and tip-enhanced Raman scattering of DNA components. J. Raman Spectrosc. 2006, 37, 311–317. [Google Scholar] [CrossRef]
  57. He, Z.; Qiu, W.; Kizer, M.E.; Wang, J.; Chen, W.; Sokolov, A.V.; Wang, X.; Hu, J.; Scully, M.O. Resolving the Sequence of RNA Strands by Tip-Enhanced Raman Spectroscopy. ACS Photonics 2020, 8, 424–430. [Google Scholar] [CrossRef]
  58. Yeo, B.-S.; Mädler, S.; Schmid, T.; Zhang, W.; Zenobi, R. Tip-Enhanced Raman Spectroscopy Can See More:  The Case of Cytochrome c. J. Phys. Chem. C 2008, 112, 4867–4873. [Google Scholar] [CrossRef]
  59. Li, J.F.; Huang, Y.F.; Ding, Y.; Yang, Z.L.; Li, S.B.; Zhou, X.S.; Fan, F.R.; Zhang, W.; Zhou, Z.Y.; Wu, D.Y.; et al. Shell-isolated nanoparticle-enhanced Raman spectroscopy. Nature 2010, 464, 392–395. [Google Scholar] [CrossRef]
  60. Hoehse, M.; Gornushkin, I.; Merk, S.; Panne, U. Assessment of suitability of diode pumped solid state lasers for laser induced breakdown and Raman spectroscopy. J. Anal. At. Spectrom. 2011, 26, 414–424. [Google Scholar] [CrossRef]
  61. Ariese, F.; Meuzelaar, H.; Kerssens, M.M.; Buijs, J.B.; Gooijer, C. Picosecond Raman spectroscopy with a fast intensified CCD camera for depth analysis of diffusely scattering media. Analyst 2009, 134, 1192–1197. [Google Scholar] [CrossRef] [PubMed]
  62. Burgess, S.; Shepherd, I. Fluorescence suppression in time-resolved Raman spectra. J. Phys. E Sci. Instrum. 1977, 10, 617–620. [Google Scholar] [CrossRef]
  63. Yoo, W.S.; Kim, J.H.; Han, S.M. Multiwavelength Raman characterization of silicon stress near through-silicon vias and its inline monitoring applications. J. Micro/Nanolithography MEMS MOEMS 2014, 13, 011205. [Google Scholar] [CrossRef]
  64. Sekar, S.K.V.; Mosca, S.; Farina, A.; Martelli, F.; Taroni, P.; Valentini, G.; Cubeddu, R.; Pifferi, A. Frequency offset Raman spectroscopy (FORS) for depth probing of diffusive media. Opt. Express 2017, 25, 4585–4597. [Google Scholar] [CrossRef] [Green Version]
  65. Dietrich, B.; Dombrowski, K. Experimental challenges of stress measurements with resonant micro-Raman spectroscopy. J. Raman Spectrosc. 1999, 30, 893–897. [Google Scholar] [CrossRef]
  66. Wermelinger, T.; Charpentier, C.; Yüksek, M.D.; Spolenak, R. Measuring stresses in thin metal films by means of Raman microscopy using silicon as a strain gage material. J. Raman Spectrosc. 2009, 40, 1849–1857. [Google Scholar] [CrossRef]
  67. Zhao, Q.; Wagner, H.D. Raman spectroscopy of carbon–nanotube–based composites. Philos. Trans. R. Soc. Lond. Ser. A Math. Phys. Eng. Sci. 2004, 362, 2407–2424. [Google Scholar] [CrossRef]
  68. Hashida, T.; Jeong, Y.G.; Hua, Y.; Hsu, S.L.; Paul, C.W. Spectroscopic study on morphology evolution in polymer blends. Macromolecules 2005, 38, 2876–2882. [Google Scholar] [CrossRef]
  69. Van Overbeke, E.; Devaux, J.; Legras, R.; Carter, J.; McGrail, P.; Carlier, V. Phase separation in epoxy-copolyethersulphone blends: Morphologies and local characterisation by micro-Raman spectroscopy. Polymer 2003, 44, 4899–4908. [Google Scholar] [CrossRef]
  70. Ferrari, A.C.; Meyer, J.C.; Scardaci, V.; Casiraghi, C.; Lazzeri, M.; Mauri, F.; Piscanec, S.; Jiang, D.; Novoselov, K.S.; Roth, S. Raman spectrum of graphene and graphene layers. Phys. Rev. Lett. 2006, 97, 187401. [Google Scholar] [CrossRef] [Green Version]
  71. Anderson, N.; Hartschuh, A.; Novotny, L. Chirality changes in carbon nanotubes studied with near-field Raman spectroscopy. Nano Lett. 2007, 7, 577–582. [Google Scholar] [CrossRef] [Green Version]
  72. Fan, H.; Fan, X.; Ni, Z.; Shen, Z.; Feng, Y.; Zou, B. Orientation-dependent Raman spectroscopy of single wurtzite CdS nanowires. J. Phys. Chem. C 2008, 112, 1865–1870. [Google Scholar] [CrossRef]
  73. Livneh, T.; Zhang, J.; Cheng, G.; Moskovits, M. Polarized Raman scattering from single GaN nanowires. Phys. Rev. B 2006, 74, 035320. [Google Scholar] [CrossRef]
  74. Aqel, A.; Abou El-Nour, K.M.; Ammar, R.A.; Al-Warthan, A. Carbon nanotubes, science and technology part (I) structure, synthesis and characterisation. Arab. J. Chem. 2012, 5, 1–23. [Google Scholar] [CrossRef] [Green Version]
  75. Dresselhaus, M.S.; Dresselhaus, G.; Saito, R.; Jorio, A. Raman spectroscopy of carbon nanotubes. Phys. Rep. 2005, 409, 47–99. [Google Scholar] [CrossRef]
  76. Jorio, A.; Saito, R. Raman spectroscopy for carbon nanotube applications. J. Appl. Phys. 2021, 129, 021102. [Google Scholar] [CrossRef]
  77. Dresselhaus, M.S.; Jorio, A.; Souza Filho, A.G.; Dresselhaus, G.; Saito, R. Raman spectroscopy on one isolated carbon nanotube. Phys. B Condens. Matter 2002, 323, 15–20. [Google Scholar] [CrossRef]
  78. Belin, T.; Epron, F. Characterization methods of carbon nanotubes: A review. Mater. Sci. Eng. B 2005, 119, 105–118. [Google Scholar] [CrossRef]
  79. Dresselhaus, M.; Dresselhaus, G.; Jorio, A.; Souza Filho, A.; Saito, R. Raman spectroscopy on isolated single wall carbon nanotubes. Carbon 2002, 40, 2043–2061. [Google Scholar] [CrossRef]
  80. Dresselhaus, M.; Dresselhaus, G.; Hofmann, M. The big picture of Raman scattering in carbon nanotubes. Vib. Spectrosc. 2007, 45, 71–81. [Google Scholar] [CrossRef]
  81. Cooper, C.; Young, R.; Halsall, M. Investigation into the deformation of carbon nanotubes and their composites through the use of Raman spectroscopy. Compos. Part A Appl. Sci. Manuf. 2001, 32, 401–411. [Google Scholar] [CrossRef]
  82. Kang, D.; Hakamatsuka, M.; Kojima, K.; Tachibana, M. Influence of heating and laser irradiation on the Raman D band in single-wall carbon nanotubes. Diam. Relat. Mater. 2010, 19, 578–580. [Google Scholar] [CrossRef]
  83. Lehman, J.H.; Terrones, M.; Mansfield, E.; Hurst, K.E.; Meunier, V. Evaluating the characteristics of multiwall carbon nanotubes. Carbon 2011, 49, 2581–2602. [Google Scholar] [CrossRef]
  84. Zhao, X.; Ando, Y.; Qin, L.-C.; Kataura, H.; Maniwa, Y.; Saito, R. Radial breathing modes of multiwalled carbon nanotubes. Chem. Phys. Lett. 2002, 361, 169–174. [Google Scholar] [CrossRef]
  85. Gohil, S.; Ghosh, S. Surface enhanced Raman scattering from multiwalled carbon nanotubes at low temperatures. Appl. Phys. Lett. 2010, 96, 143108. [Google Scholar] [CrossRef]
  86. DiLeo, R.A.; Landi, B.J.; Raffaelle, R.P. Purity assessment of multiwalled carbon nanotubes by Raman spectroscopy. J. Appl. Phys. 2007, 101, 064307. [Google Scholar] [CrossRef] [Green Version]
  87. Maciel, I.O.; Anderson, N.; Pimenta, M.A.; Hartschuh, A.; Qian, H.; Terrones, M.; Terrones, H.; Campos-Delgado, J.; Rao, A.M.; Novotny, L. Electron and phonon renormalization near charged defects in carbon nanotubes. Nat. Mater. 2008, 7, 878–883. [Google Scholar] [CrossRef]
  88. Rao, A.; Jorio, A.; Pimenta, M.; Dantas, M.; Saito, R.; Dresselhaus, G.; Dresselhaus, M. Polarized Raman study of aligned multiwalled carbon nanotubes. Phys. Rev. Lett. 2000, 84, 1820–1823. [Google Scholar] [CrossRef]
  89. Kumar, A.; Singh, F.; Koinkar, P.; Avasthi, D.; Pivin, J.; More, M. Effect of intense laser and energetic ion irradiation on Raman modes of Multiwalled Carbon Nanotubes. Thin Solid Film 2009, 517, 4322–4324. [Google Scholar] [CrossRef]
  90. Chaunchaiyakul, S.; Yano, T.; Khoklang, K.; Krukowski, P.; Akai-Kasaya, M.; Saito, A.; Kuwahara, Y. Nanoscale analysis of multiwalled carbon nanotube by tip-enhanced Raman spectroscopy. Carbon 2016, 99, 642–648. [Google Scholar] [CrossRef]
  91. Asiya, S.; Kyzas, G.Z.; Pal, K.; de Souza, F.G. Graphene functionalized hybrid nanomaterials for industrial-scale applications: A systematic review. J. Mol. Struct. 2021, 130518. [Google Scholar]
  92. Nanda, S.S.; Kim, M.J.; Yeom, K.S.; An, S.S.A.; Ju, H.; Yi, D.K. Raman spectrum of graphene with its versatile future perspectives. TrAC Trends Anal. Chem. 2016, 80, 125–131. [Google Scholar] [CrossRef]
  93. Malard, L.; Pimenta, M.A.; Dresselhaus, G.; Dresselhaus, M. Raman spectroscopy in graphene. Phys. Rep. 2009, 473, 51–87. [Google Scholar] [CrossRef]
  94. Calizo, I.; Balandin, A.A.; Bao, W.; Miao, F.; Lau, C.N. Temperature Dependence of the Raman Spectra of Graphene and Graphene Multilayers. Nano Lett. 2007, 7, 2645–2649. [Google Scholar] [CrossRef] [PubMed]
  95. Liu, Y.; Shi, Y.; Zhou, W.; Shi, W.; Dang, W.; Li, X.; Liang, B. The split-up of G band and 2D band in temperature-dependent Raman spectra of suspended graphene. Opt. Laser Technol. 2021, 139, 106960. [Google Scholar] [CrossRef]
  96. Tsujimoto, M.; Tanimura, M.; Tachibana, M. Temperature dependence of the Raman spectra of multilayer graphene nanoribbons fabricated by unzipping method. Diam. Relat. Mater. 2020, 109, 108047. [Google Scholar] [CrossRef]
  97. Al-Hazmi, F.; Beall, G.W.; Al-Ghamdi, A.; Alshahrie, A.; Shokr, F.; Mahmoud, W.E. Raman and ellipsometry spectroscopic analysis of graphene films grown directly on Si substrate via CVD technique for estimating the graphene atomic planes number. J. Mol. Struct. 2016, 1118, 275–278. [Google Scholar] [CrossRef]
  98. Koo, E.; Ju, S.-Y. Role of residual polymer on chemical vapor grown graphene by Raman spectroscopy. Carbon 2015, 86, 318–324. [Google Scholar] [CrossRef]
  99. Woo, Y.S.; Lee, D.W.; Kim, U.J. General Raman-based method for evaluating the carrier mobilities of chemical vapor deposited graphene. Carbon 2018, 132, 263–270. [Google Scholar] [CrossRef]
  100. Saito, R.; Hofmann, M.; Dresselhaus, G.; Jorio, A.; Dresselhaus, M.S. Raman spectroscopy of graphene and carbon nanotubes. Adv. Phys. 2011, 60, 413–550. [Google Scholar] [CrossRef]
  101. Gokturk, P.A.; Kakenov, N.; Kocabas, C.; Suzer, S. Raman and X-ray photoelectron spectroscopic studies of graphene devices for identification of doping. Appl. Surf. Sci. 2017, 425, 1130–1137. [Google Scholar] [CrossRef] [Green Version]
  102. Ferralis, N.; Maboudian, R.; Carraro, C. Evidence of Structural Strain in Epitaxial Graphene Layers on 6H-SiC(0001). Phys. Rev. Lett. 2008, 101, 156801. [Google Scholar] [CrossRef] [Green Version]
  103. Merlen, A.; Buijnsters, J.G.; Pardanaud, C. A Guide to and Review of the Use of Multiwavelength Raman Spectroscopy for Characterizing Defective Aromatic Carbon Solids: From Graphene to Amorphous Carbons. Coatings 2017, 7, 153. [Google Scholar] [CrossRef]
  104. Robertson, J.; O’Reilly, E.P. Electronic and atomic structure of amorphous carbon. Phys. Rev. B 1987, 35, 2946–2957. [Google Scholar] [CrossRef] [PubMed]
  105. Ferrari, A.C.; Robertson, J. Interpretation of Raman spectra of disordered and amorphous carbon. Phys. Rev. B 2000, 61, 14095. [Google Scholar] [CrossRef] [Green Version]
  106. Robertson, J. Diamond-like amorphous carbon. Mater. Sci. Eng. R Rep. 2002, 37, 129–281. [Google Scholar] [CrossRef] [Green Version]
  107. Casiraghi, C.; Ferrari, A.C.; Robertson, J. Raman spectroscopy of hydrogenated amorphous carbons. Phys. Rev. B 2005, 72, 085401. [Google Scholar] [CrossRef] [Green Version]
  108. Mariotto, G.; Vinegoni, C.; Jacobsohn, L.G.; Freire, F.L. Raman spectroscopy and scanning electron microscopy investigation of annealed amorphous carbon–germanium films deposited by d.c. magnetron sputtering. Diam. Relat. Mater. 1999, 8, 668–672. [Google Scholar] [CrossRef]
  109. Cui, W.G.; Lai, Q.B.; Zhang, L.; Wang, F.M. Quantitative measurements of sp3 content in DLC films with Raman spectroscopy. Surf. Coat. Technol. 2010, 205, 1995–1999. [Google Scholar] [CrossRef]
  110. Zhang, L.; Wei, X.; Lin, Y.; Wang, F. A ternary phase diagram for amorphous carbon. Carbon 2015, 94, 202–213. [Google Scholar] [CrossRef]
  111. Ferrari, A.C.; Kleinsorge, B.; Adamopoulos, G.; Robertson, J.; Milne, W.I.; Stolojan, V.; Brown, L.M.; LiBassi, A.; Tanner, B.K. Determination of bonding in amorphous carbons by electron energy loss spectroscopy, Raman scattering and X-ray reflectivity. J. Non-Cryst. Solids 2000, 266–269, 765–768. [Google Scholar] [CrossRef]
  112. Gilkes, K.W.R.; Sands, H.S.; Batchelder, D.N.; Milne, W.I.; Robertson, J. Direct observation of sp3 bonding in tetrahedral amorphous carbon UV Raman spectroscopy. J. Non-Cryst. Solids 1998, 227-230, 612–616. [Google Scholar] [CrossRef]
  113. Pardanaud, C.; Martin, C.; Roubin, P.; Giacometti, G.; Hopf, C.; Schwarz-Selinger, T.; Jacob, W. Raman spectroscopy investigation of the H content of heated hard amorphous carbon layers. Diam. Relat. Mater. 2013, 34, 100–104. [Google Scholar] [CrossRef] [Green Version]
  114. Liu, F.-X.; Yao, K.-L.; Liu, Z.-L. Substrate bias effect on structure of tetrahedral amorphous carbon films by Raman spectroscopy. Diam. Relat. Mater. 2007, 16, 1746–1751. [Google Scholar] [CrossRef]
  115. Liu, F.-X.; Yao, K.-L.; Liu, Z.-L. Substrate tilting effect on structure of tetrahedral amorphous carbon films by Raman spectroscopy. Surf. Coat. Technol. 2007, 201, 7235–7240. [Google Scholar] [CrossRef]
  116. Schwan, J.; Ulrich, S.; Batori, V.; Ehrhardt, H.; Silva, S.R.P. Raman spectroscopy on amorphous carbon films. J. Appl. Phys. 1996, 80, 440–447. [Google Scholar] [CrossRef] [Green Version]
  117. Bartoli, M.; Giorcelli, M.; Jagdale, P.; Rovere, M.; Tagliaferro, A. A Review of Non-Soil Biochar Applications. Materials 2020, 13, 291. [Google Scholar] [CrossRef] [PubMed] [Green Version]
  118. Tagliaferro, A.; Rovere, M.; Padovano, E.; Bartoli, M.; Giorcelli, M. Introducing the Novel Mixed Gaussian-Lorentzian Lineshape in the Analysis of the Raman Signal of Biochar. Nanomaterials 2020, 10, 1748. [Google Scholar] [CrossRef]
  119. Giorcelli, M.; Bartoli, M.; Sanginario, A.; Padovano, E.; Rosso, C.; Rovere, M.; Tagliaferro, A. High-Temperature Annealed Biochar as a Conductive Filler for the Production of Piezoresistive Materials for Energy Conversion Application. ACS Appl. Electron. Mater. 2021, 3, 838–844. [Google Scholar] [CrossRef]
  120. Savi, P.; Yasir, M.; Bartoli, M.; Giorcelli, M.; Longo, M. Electrical and Microwave Characterization of Thermal Annealed Sewage Sludge Derived Biochar Composites. Appl. Sci. 2020, 10, 1334. [Google Scholar] [CrossRef] [Green Version]
  121. Noori, A.; Bartoli, M.; Frache, A.; Piatti, E.; Giorcelli, M.; Tagliaferro, A. Development of Pressure-Responsive PolyPropylene and Biochar-Based Materials. Micromachines 2020, 11, 339. [Google Scholar] [CrossRef] [Green Version]
  122. Bartoli, M.; Nasir, M.A.; Passaglia, E.; Spiniello, R.; Jagdale, P.; Rosso, C.; Giorcelli, M.; Rovere, M.; Tagliaferro, A. Influence of pyrolytic thermal history on olive pruning biochar and related epoxy composites mechanical properties. J. Compos. Mater. 2020, 54, 1863–1873. [Google Scholar] [CrossRef]
  123. Giorcelli, M.; Bartoli, M. Development of Coffee Biochar Filler for the Production of Electrical Conductive Reinforced Plastic. Polymers 2019, 11, 17. [Google Scholar] [CrossRef] [Green Version]
  124. Bartoli, M.; Giorcelli, M.; Rovere, M.; Jagdale, P.; Tagliaferro, A.; Chae, M.; Bressler, D.C. Shape tunability of carbonized cellulose nanocrystals. SN Appl. Sci. 2019, 1, 1661–1676. [Google Scholar] [CrossRef] [Green Version]
  125. Bartoli, M.; Giorcelli, M.; Rosso, C.; Rovere, M.; Jagdale, P.; Tagliaferro, A. Influence of Commercial Biochar Fillers on Brittleness/Ductility of Epoxy Resin Composites. Appl. Sci. 2019, 9, 13. [Google Scholar] [CrossRef] [Green Version]
  126. Naahidi, S.; Jafari, M.; Edalat, F.; Raymond, K.; Khademhosseini, A.; Chen, P. Biocompatibility of engineered nanoparticles for drug delivery. J. Control. Release 2013, 166, 182–194. [Google Scholar] [CrossRef]
  127. Papaefthymiou, G.C. Nanoparticle magnetism. Nano Today 2009, 4, 438–447. [Google Scholar] [CrossRef]
  128. Iskandar, F. Nanoparticle processing for optical applications—A review. Adv. Powder Technol. 2009, 20, 283–292. [Google Scholar] [CrossRef]
  129. Bhaumik, A.; Shearin, A.; Delong, R.; Wanekaya, A.; Ghosh, K. Probing the Interaction at the Nano–Bio Interface Using Raman Spectroscopy: ZnO Nanoparticles and Adenosine Triphosphate Biomolecules. J. Phys. Chem. C 2014, 118, 18631–18639. [Google Scholar] [CrossRef] [PubMed] [Green Version]
  130. Agressott, E.V.; de Moura, T.A.; Marinho, N.L.; Vasconcelos, T.d.L.; Cunha, F.A.; Fechine, P.; de Souza Filho, A.G.; Paschoal, A.R. Tip-Enhanced Raman spectroscopy investigations of core-shell Ag-proteins nanoparticles synthesized by Rhodotorula mucilaginosa and Rhodotorula glutinis fungi. Vib. Spectrosc. 2020, 110, 103104. [Google Scholar] [CrossRef]
  131. Alula, M.T.; Lemmens, P.; Bo, L.; Wulferding, D.; Yang, J.; Spende, H. Preparation of silver nanoparticles coated ZnO/Fe3O4 composites using chemical reduction method for sensitive detection of uric acid via surface-enhanced Raman spectroscopy. Anal. Chim. Acta 2019, 1073, 62–71. [Google Scholar] [CrossRef] [PubMed]
  132. Caprara, D.; Ripanti, F.; Capocefalo, A.; Sarra, A.; Brasili, F.; Petrillo, C.; Fasolato, C.; Postorino, P. DNA-functionalized gold nanoparticle assemblies for Surface Enhanced Raman Scattering. Colloids Surf. A Physicochem. Eng. Asp. 2020, 589, 124399. [Google Scholar] [CrossRef] [Green Version]
  133. El-Said, W.A.; Alshitari, W.; Choi, J.-w. Controlled fabrication of gold nanobipyramids/polypyrrole for shell-isolated nanoparticle-enhanced Raman spectroscopy to detect γ-aminobutyric acid. Spectrochim. Acta Part A Mol. Biomol. Spectrosc. 2020, 229, 117890. [Google Scholar] [CrossRef] [PubMed]
  134. Pinilla-Peñalver, E.; Villaseñor, M.J.; Contento, A.M.; Ríos, Á. Erythrosine B–coated gold nanoparticles as an analytical sensing tool for the proper determination of both compounds based on surface-enhanced Raman spectroscopy. Microchem. J. 2020, 157, 104937. [Google Scholar] [CrossRef]
  135. Kuhar, N.; Sil, S.; Verma, T.; Umapathy, S. Challenges in application of Raman spectroscopy to biology and materials. RSC Adv. 2018, 8, 25888–25908. [Google Scholar] [CrossRef] [Green Version]
  136. Butler, H.J.; Ashton, L.; Bird, B.; Cinque, G.; Curtis, K.; Dorney, J.; Esmonde-White, K.; Fullwood, N.J.; Gardner, B.; Martin-Hirsch, P.L.; et al. Using Raman spectroscopy to characterize biological materials. Nat. Protoc. 2016, 11, 664–687. [Google Scholar] [CrossRef] [Green Version]
  137. Guerrini, L.; Pazos-Perez, N.; Garcia-Rico, E.; Alvarez-Puebla, R. Cancer characterization and diagnosis with SERS-encoded particles. Cancer Nanotechnol. 2017, 8, 1–24. [Google Scholar] [CrossRef]
  138. D’Acunto, M.; Gaeta, R.; Capanna, R.; Franchi, A. contribution of Raman Spectroscopy to Diagnosis and Grading of chondrogenic tumors. Sci. Rep. 2020, 10, 2155. [Google Scholar] [CrossRef]
  139. Sbroscia, M.; Di Gioacchino, M.; Ascenzi, P.; Crucitti, P.; di Masi, A.; Giovannoni, I.; Longo, F.; Mariotti, D.; Naciu, A.M.; Palermo, A. Thyroid cancer diagnosis by Raman spectroscopy. Sci. Rep. 2020, 10, 13342. [Google Scholar] [CrossRef] [PubMed]
  140. Ke, Z.-Y.; Ning, Y.-J.; Jiang, Z.-F.; Zhu, Y.-Y.; Guo, J.; Fan, X.-Y.; Zhang, Y.-B. The efficacy of Raman spectroscopy in lung cancer diagnosis: The first diagnostic meta-analysis. Lasers Med. Sci. 2021. [Google Scholar] [CrossRef] [PubMed]
  141. Giamougiannis, P.; Morais, C.L.; Grabowska, R.; Ashton, K.M.; Wood, N.J.; Martin-Hirsch, P.L.; Martin, F.L. A comparative analysis of different biofluids towards ovarian cancer diagnosis using Raman microspectroscopy. Anal. Bioanal. Chem. 2021, 413, 911–922. [Google Scholar] [CrossRef] [PubMed]
  142. Shang, L.-W.; Ma, D.-Y.; Fu, J.-J.; Lu, Y.-F.; Zhao, Y.; Xu, X.-Y.; Yin, J.-H. Fluorescence imaging and Raman spectroscopy applied for the accurate diagnosis of breast cancer with deep learning algorithms. Biomed. Opt. Express 2020, 11, 3673–3683. [Google Scholar] [CrossRef]
  143. Hong, Y.; Li, Y.; Huang, L.; He, W.; Wang, S.; Wang, C.; Zhou, G.; Chen, Y.; Zhou, X.; Huang, Y. Label-free diagnosis for colorectal cancer through coffee ring-assisted surface-enhanced Raman spectroscopy on blood serum. J. Biophotonics 2020, 13, e201960176. [Google Scholar] [CrossRef]
  144. Correia, N.A.; Batista, L.T.; Nascimento, R.J.; Cangussú, M.C.; Crugeira, P.J.; Soares, L.G.; Silveira, L., Jr.; Pinheiro, A.L. Detection of prostate cancer by Raman spectroscopy: A multivariate study on patients with normal and altered PSA values. J. Photochem. Photobiol. B Biol. 2020, 204, 111801. [Google Scholar] [CrossRef]
  145. Téllez-Plancarte, A.; Haro-Poniatowski, E.; Picquart, M.; Morales-Méndez, J.G.; Lara-Cruz, C.; Jiménez-Salazar, J.E.; Damián-Matsumura, P.; Escobar-Alarcón, L.; Batina, N. Development of a nanostructured platform for identifying HER2-heterogeneity of breast cancer cells by surface-enhanced raman scattering. Nanomaterials 2018, 8, 549. [Google Scholar] [CrossRef] [Green Version]
  146. Ryzhikova, E.; Ralbovsky, N.M.; Sikirzhytski, V.; Kazakov, O.; Halamkova, L.; Quinn, J.; Zimmerman, E.A.; Lednev, I.K. Raman spectroscopy and machine learning for biomedical applications: Alzheimer’s disease diagnosis based on the analysis of cerebrospinal fluid. Spectrochim. Acta Part A Mol. Biomol. Spectrosc. 2021, 248, 119188. [Google Scholar] [CrossRef]
  147. Gurian, E.; Giraudi, P.; Rosso, N.; Tiribelli, C.; Bonazza, D.; Zanconati, F.; Giuricin, M.; Palmisano, S.; de Manzini, N.; Sergo, V. Differentiation between stages of non-alcoholic fatty liver diseases using surface-enhanced Raman spectroscopy. Anal. Chim. Acta 2020, 1110, 190–198. [Google Scholar] [CrossRef]
  148. Kaewseekhao, B.; Nuntawong, N.; Eiamchai, P.; Roytrakul, S.; Reechaipichitkul, W.; Faksri, K. Diagnosis of active tuberculosis and latent tuberculosis infection based on Raman spectroscopy and surface-enhanced Raman spectroscopy. Tuberculosis 2020, 121, 101916. [Google Scholar] [CrossRef]
  149. Chen, C.; Yang, L.; Zhao, J.; Yuan, Y.; Chen, C.; Tang, J.; Yang, H.; Yan, Z.; Wang, H.; Lv, X. Urine Raman spectroscopy for rapid and inexpensive diagnosis of chronic renal failure (CRF) using multiple classification algorithms. Optik 2020, 203, 164043. [Google Scholar] [CrossRef]
  150. Kashif, M.; Majeed, M.I.; Hanif, M.A.; ur Rehman, A. Surface Enhanced Raman Spectroscopy of the serum samples for the diagnosis of Hepatitis C and prediction of the viral loads. Spectrochim. Acta Part A Mol. Biomol. Spectrosc. 2020, 242, 118729. [Google Scholar] [CrossRef]
  151. Saleem, M.; Ali, S.; Khan, M.B.; Amin, A.; Bilal, M.; Nawaz, H.; Hassan, M. Optical diagnosis of hepatitis B virus infection in blood plasma using Raman spectroscopy and chemometric techniques. J. Raman Spectrosc. 2020, 51, 1067–1077. [Google Scholar] [CrossRef]
  152. Rickard, J.J.; Di-Pietro, V.; Smith, D.J.; Davies, D.J.; Belli, A.; Oppenheimer, P.G. Rapid optofluidic detection of biomarkers for traumatic brain injury via surface-enhanced Raman spectroscopy. Nat. Biomed. Eng. 2020, 4, 610–623. [Google Scholar] [CrossRef]
  153. Su, Y.; Xu, S.; Zhang, J.; Chen, X.; Jiang, L.-P.; Zheng, T.; Zhu, J.-J. Plasmon near-field coupling of bimetallic nanostars and a hierarchical bimetallic SERS “hot field”: Toward ultrasensitive simultaneous detection of multiple cardiorenal syndrome biomarkers. Anal. Chem. 2018, 91, 864–872. [Google Scholar] [CrossRef] [PubMed]
  154. Low, J.S.Y.; Thevarajah, T.M.; Chang, S.W.; Goh, B.T.; Khor, S.M. Biosensing based on surface-enhanced Raman spectroscopy as an emerging/next-generation point-of-care approach for acute myocardial infarction diagnosis. Crit. Rev. Biotechnol. 2020, 40, 1191–1209. [Google Scholar] [CrossRef]
  155. Carlomagno, C.; Banfi, P.; Gualerzi, A.; Picciolini, S.; Volpato, E.; Meloni, M.; Lax, A.; Colombo, E.; Ticozzi, N.; Verde, F. Human salivary Raman fingerprint as biomarker for the diagnosis of Amyotrophic Lateral Sclerosis. Sci. Rep. 2020, 10, 10175. [Google Scholar] [CrossRef] [PubMed]
  156. Acri, G.; Venuti, V.; Costa, S.; Testagrossa, B.; Pellegrino, S.; Crupi, V.; Majolino, D. Raman Spectroscopy as Noninvasive Method of Diagnosis of Pediatric Onset Inflammatory Bowel Disease. Appl. Sci. 2020, 10, 6974. [Google Scholar] [CrossRef]
  157. Jadhav, S.A.; Biji, P.; Panthalingal, M.K.; Krishna, C.M.; Rajkumar, S.; Joshi, D.S.; Sundaram, N. Development of integrated microfluidic platform coupled with Surface-enhanced Raman Spectroscopy for diagnosis of COVID-19. Med. Hypotheses 2021, 146, 110356. [Google Scholar] [CrossRef] [PubMed]
  158. Yin, G.; Li, L.; Lu, S.; Yin, Y.; Su, Y.; Zeng, Y.; Luo, M.; Ma, M.; Zhou, H.; Orlandini, L. An efficient primary screening of COVID-19 by serum Raman spectroscopy. J. Raman Spectrosc. 2021, 52, 949–958. [Google Scholar] [CrossRef] [PubMed]
  159. Elsharif, A.M. Rapid Detection of COVID 19 via Surface Enhanced Raman Spectroscopy. Int. J. Res. Appl. Sci. Eng. Technol. 2020, 8, 715–720. [Google Scholar] [CrossRef]
  160. Kneipp, K.; Haka, A.S.; Kneipp, H.; Badizadegan, K.; Yoshizawa, N.; Boone, C.; Shafer-Peltier, K.E.; Motz, J.T.; Dasari, R.R.; Feld, M.S. Surface-enhanced raman spectroscopy in single living cells using gold nanoparticles. Appl. Spectrosc. 2002, 56, 150–154. [Google Scholar] [CrossRef]
  161. Li, X.; Zhang, D.; Bai, Y.; Wang, W.; Liang, J.; Cheng, J.-X. Fingerprinting a Living Cell by Raman Integrated Mid-Infrared Photothermal Microscopy. Anal. Chem. 2019, 91, 10750–10756. [Google Scholar] [CrossRef]
  162. Wattanavichean, N.; Nishida, I.; Ando, M.; Kawamukai, M.; Yamamoto, T.; Hamaguchi, H.o. Organelle specific simultaneous Raman/green fluorescence protein microspectroscopy for living cell physicochemical studies. J. Biophotonics 2020, 13, e201960163. [Google Scholar] [CrossRef]
  163. Xie, C.; Goodman, C.; Dinno, M.A.; Li, Y.-Q. Real-time Raman spectroscopy of optically trapped living cells and organelles. Opt. Express 2004, 12, 6208–6214. [Google Scholar] [CrossRef]
  164. Puppels, G.; De Mul, F.; Otto, C.; Greve, J.; Robert-Nicoud, M.; Arndt-Jovin, D.; Jovin, T. Studying single living cells and chromosomes by confocal Raman microspectroscopy. Nature 1990, 347, 301–303. [Google Scholar] [CrossRef]
  165. Takeuchi, M.; Kajimoto, S.; Nakabayashi, T. Experimental evaluation of the density of water in a cell by Raman microscopy. J. Phys. Chem. Lett. 2017, 8, 5241–5245. [Google Scholar] [CrossRef]
  166. Gurjar, R.S.; Backman, V.; Perelman, L.T.; Georgakoudi, I.; Badizadegan, K.; Itzkan, I.; Dasari, R.R.; Feld, M.S. Imaging human epithelial properties with polarized light- scattering spectroscopy. Nat. Med. 2001, 7, 1245–1248. [Google Scholar] [CrossRef]
  167. Backman, V.; Gurjar, R.; Badizadegan, K.; Itzkan, I.; Dasari, R.R.; Perelman, L.T.; Feld, M.S. Polarized light scattering spectroscopy for quantitative measurement of epithelial cellular structures in situ. IEEE J. Sel. Top. Quantum Electron. 1999, 5, 1019–1026. [Google Scholar] [CrossRef] [Green Version]
  168. Müller, M.G.; Valdez, T.A.; Georgakoudi, I.; Backman, V.; Fuentes, C.; Kabani, S.; Laver, N.; Wang, Z.; Boone, C.W.; Dasari, R.R.; et al. Spectroscopic detection and evaluation of morphologic and biochemical changes in early human oral carcinoma. Cancer 2003, 97, 1681–1692. [Google Scholar] [CrossRef]
  169. Nasdala, L.; Schmidt, C. Applications of Raman spectroscopy in mineralogy and geochemistry. Elem. Int. Mag. Mineral. Geochem. Petrol. 2020, 16, 99–104. [Google Scholar] [CrossRef]
  170. Schmidt, C.; Steele-MacInnis, M.; Watenphul, A.; Wilke, M. Calibration of zircon as a Raman spectroscopic pressure sensor to high temperatures and application to water-silicate melt systems. Am. Mineral. 2013, 98, 643–650. [Google Scholar] [CrossRef]
  171. Beyssac, O. New trends in Raman spectroscopy: From high-resolution geochemistry to planetary exploration. Elem. Int. Mag. Mineral. Geochem. Petrol. 2020, 16, 117–122. [Google Scholar] [CrossRef]
  172. Liu, Y.; Ling, Z.; Wu, P.; Wang, J.; Cao, H.; Chen, J. Mineralogy of Lunar Meteorite Northwest Africa 10480 by Raman Spectroscopic Studies. In Proceedings of the 52nd Lunar and Planetary Science Conference, Virtual Conference, 15–19 March 2021; p. 2003. [Google Scholar]
  173. Cao, H.; Chen, J.; Fu, X.; Ling, Z. Raman and infrared spectroscopic perspectives of lunar meteorite Northwest Africa 4884. J. Raman Spectrosc. 2020, 51, 1652–1666. [Google Scholar] [CrossRef]
  174. Polavaram, K.C.; Garg, N. High-fidelity and high-resolution phase mapping of granites via confocal Raman imaging. Sci. Rep. 2021, 11, 8022. [Google Scholar] [CrossRef]
  175. Batista, A.J.; Vianna, P.G.; Ribeiro, H.B.; de Matos, C.J.S.; Gomes, A.S.L. QR code micro-certified gemstones: Femtosecond writing and Raman characterization in Diamond, Ruby and Sapphire. Sci. Rep. 2019, 9, 8927. [Google Scholar] [CrossRef] [Green Version]
  176. Culka, A.; Jehlička, J. Identification of gemstones using portable sequentially shifted excitation Raman spectrometer and RRUFF online database: A proof of concept study. Eur. Phys. J. Plus 2019, 134, 130. [Google Scholar] [CrossRef]
  177. Committee, A.M. Raman spectroscopy in cultural heritage: Background paper. Anal. Methods 2015, 7, 4844–4847. [Google Scholar]
  178. Casadio, F.; Daher, C.; Bellot-Gurlet, L. Raman spectroscopy of cultural heritage materials: Overview of applications and new frontiers in instrumentation, sampling modalities, and data processing. In Analytical Chemistry for Cultural Heritage; Springer: Cham, Switerland, 2016; pp. 161–211. [Google Scholar]
  179. Prieto, A.; Avella, M.; Martínez, O.; Jiménez, J.; Alonso, J.; Sánchez, I.; Martín, R.; Barrera, M. Raman Spectroscopy Analysis of a Playing Card from the 18th Century. Spectrosc. Lett. 2012, 45, 114–117. [Google Scholar] [CrossRef]
  180. Alves, A.P.P.; de Oliveira, L.P.; Castro, A.A.; Neumann, R.; de Oliveira, L.F.; Edwards, H.G.; Sant’Ana, A.C. The structure of different cellulosic fibres characterized by Raman spectroscopy. Vib. Spectrosc. 2016, 86, 324–330. [Google Scholar] [CrossRef]
  181. Edwards, H.; Ellis, E.; Farwell, D.; Janaway, R. Preliminary study of the application of Fourier transform Raman spectroscopy to the analysis of degraded archaeological linen textiles. J. Raman Spectrosc. 1996, 27, 663–669. [Google Scholar] [CrossRef]
  182. Vandenabeele, P.; Wehling, B.; Moens, L.; Dekeyzer, B.; Cardon, B.; von Bohlen, A.; Klockenkämper, R. Pigment investigation of a late-medieval manuscript with total reflection X-ray fluorescence and micro-Raman spectroscopy. Analyst 1999, 124, 169–172. [Google Scholar] [CrossRef]
  183. Bicchieri, M.; Nardone, M.; Sodo, A. Application of micro-Raman spectroscopy to the study of an illuminated medieval manuscript. J. Cult. Herit. 2000, 1, S277–S279. [Google Scholar] [CrossRef]
  184. Gniadecka, M.; Edwards, H.; Hart Hansen, J.; Nielsen, O.F.; Christensen, D.; Guillen, S.; Wulf, H. Near-infrared Fourier transform Raman spectroscopy of the mummified skin of the Alpine iceman, Qilakitsoq Greenland mummies and Chiribaya mummies from Peru. J. Raman Spectrosc. 1999, 30, 147–153. [Google Scholar] [CrossRef]
  185. Petersen, S.; Nielsen, O.F.; Christensen, D.H.; Edwards, H.G.; Farwell, D.W.; David, R.; Lambert, P.; Gniadecka, M.; Wulf, H.C. Near-infrared Fourier transform Raman spectroscopy of skin samples from the ‘Tomb of the Two Brothers’, Khnum-Nakht and Nekht-Ankh, XIIth dynasty Egyptian mummies (ca 2000 BC). J. Raman Spectrosc. 2003, 34, 375–379. [Google Scholar] [CrossRef]
  186. Barone, G.; Mazzoleni, P.; Raneri, S.; Jehlička, J.; Vandenabeele, P.; Lottici, P.P.; Lamagna, G.; Manenti, A.M.; Bersani, D. Raman investigation of precious jewelry collections preserved in Paolo Orsi regional museum (Siracusa, Sicily) using portable equipment. Appl. Spectrosc. 2016, 70, 1420–1431. [Google Scholar] [CrossRef] [PubMed]
  187. Colomban, P.; Lu, T.-A.; Milande, V. Non-invasive on-site Raman study of blue-decorated early soft-paste porcelain: The use of arsenic-rich (European) cobalt ores–Comparison with huafalang Chinese porcelains. Ceram. Int. 2018, 44, 9018–9026. [Google Scholar] [CrossRef]
  188. Antunes, V.; Candeias, A.; Oliveira, M.J.; Longelin, S.; Serrão, V.; Seruya, A.I.; Coroado, J.; Dias, L.; Mirão, J.; Carvalho, M.L. Characterization of gypsum and anhydrite ground layers in 15th and 16th centuries Portuguese paintings by Raman Spectroscopy and other techniques. J. Raman Spectrosc. 2014, 45, 1026–1033. [Google Scholar] [CrossRef]
  189. Appolonia, L.; Vaudan, D.; Chatel, V.; Aceto, M.; Mirti, P. Combined use of FORS, XRF and Raman spectroscopy in the study of mural paintings in the Aosta Valley (Italy). Anal. Bioanal. Chem. 2009, 395, 2005–2013. [Google Scholar] [CrossRef]
  190. Martens, W.; Frost, R.L.; Kloprogge, J.T.; Williams, P.A. Raman spectroscopic study of the basic copper sulphates—Implications for copper corrosion and ‘bronze disease’. J. Raman Spectrosc. 2003, 34, 145–151. [Google Scholar] [CrossRef] [Green Version]
  191. Frost, R.L.; Martens, W.; Kloprogge, J.T.; Williams, P.A. Raman spectroscopy of the basic copper chloride minerals atacamite and paratacamite: Implications for the study of copper, brass and bronze objects of archaeological significance. J. Raman Spectrosc. 2002, 33, 801–806. [Google Scholar] [CrossRef] [Green Version]
  192. Larsen, P.A.; Patience, D.B.; Rawlings, J.B. Industrial crystallization process control. IEEE Control Syst. Mag. 2006, 26, 70–80. [Google Scholar]
  193. Roozeboom, F.; Robson, H.E.; Chan, S.S. Laser Raman study on the crystallization of zeolites A, X and Y. Zeolites 1983, 3, 321–328. [Google Scholar] [CrossRef]
  194. Strachan, C.J.; Rades, T.; Gordon, K.C.; Rantanen, J. Raman spectroscopy for quantitative analysis of pharmaceutical solids. J. Pharm. Pharmacol. 2007, 59, 179–192. [Google Scholar] [CrossRef] [PubMed]
  195. Hu, Y.; Wikström, H.; Byrn, S.R.; Taylor, L.S. Estimation of the transition temperature for an enantiotropic polymorphic system from the transformation kinetics monitored using Raman spectroscopy. J. Pharm. Biomed. Anal. 2007, 45, 546–551. [Google Scholar] [CrossRef]
  196. Wang, C.; Vickers, T.J.; Mann, C.K. Direct assay and shelf-life monitoring of aspirin tablets using Raman spectroscopy. J. Pharm. Biomed. Anal. 1997, 16, 87–94. [Google Scholar] [CrossRef]
  197. Ali, H.; Ullah, R.; Khan, S.; Bilal, M. Raman spectroscopy and hierarchical cluster analysis for the ingredients characterization in different formulations of paracetamol and counterfeit paracetamol. Vib. Spectrosc. 2019, 102, 112–115. [Google Scholar] [CrossRef]
  198. Craig, A.P.; Franca, A.S.; Irudayaraj, J. Surface-enhanced Raman spectroscopy applied to food safety. Annu. Rev. Food Sci. Technol. 2013, 4, 369–380. [Google Scholar] [CrossRef] [PubMed]
  199. Kneipp, K.; Wang, Y.; Kneipp, H.; Perelman, L.T.; Itzkan, I.; Dasari, R.R.; Feld, M.S. Single Molecule Detection Using Surface-Enhanced Raman Scattering (SERS). Phys. Rev. Lett. 1997, 78, 1667–1670. [Google Scholar] [CrossRef] [Green Version]
  200. Paxton, W.F.; Kleinman, S.L.; Basuray, A.N.; Stoddart, J.F.; Van Duyne, R.P. Surface-enhanced Raman spectroelectrochemistry of TTF-modified self-assembled monolayers. J. Phys. Chem. Lett. 2011, 2, 1145–1149. [Google Scholar] [CrossRef]
  201. Ando, J.; Fujita, K.; Smith, N.I.; Kawata, S. Dynamic SERS imaging of cellular transport pathways with endocytosed gold nanoparticles. Nano Lett. 2011, 11, 5344–5348. [Google Scholar] [CrossRef]
  202. Ivleva, N.P.; Wagner, M.; Szkola, A.; Horn, H.; Niessner, R.; Haisch, C. Label-free in situ SERS imaging of biofilms. J. Phys. Chem. B 2010, 114, 10184–10194. [Google Scholar] [CrossRef] [PubMed]
  203. Piorek, B.D.; Lee, S.J.; Santiago, J.G.; Moskovits, M.; Banerjee, S.; Meinhart, C.D. Free-surface microfluidic control of surface-enhanced Raman spectroscopy for the optimized detection of airborne molecules. Proc. Natl. Acad. Sci. USA 2007, 104, 18898–18901. [Google Scholar] [CrossRef] [PubMed] [Green Version]
  204. Stuart, D.A.; Biggs, K.B.; Van Duyne, R.P. Surface-enhanced Raman spectroscopy of half-mustard agent. Analyst 2006, 131, 568–572. [Google Scholar] [CrossRef]
  205. Sylvia, J.M.; Janni, J.A.; Klein, J.; Spencer, K.M. Surface-enhanced Raman detection of 2,4-dinitrotoluene impurity vapor as a marker to locate landmines. Anal. Chem. 2000, 72, 5834–5840. [Google Scholar] [CrossRef] [PubMed]
  206. Scaffidi, J.P.; Gregas, M.K.; Lauly, B.; Carter, J.C.; Angel, S.M.; Vo-Dinh, T. Trace molecular detection via surface-enhanced Raman scattering and surface-enhanced resonance Raman scattering at a distance of 15 m. Appl. Spectrosc. 2010, 64, 485–492. [Google Scholar] [CrossRef]
  207. Alvarez-Puebla, R.; Liz-Marzan, L. Environmental applications of plasmon assisted Raman scattering. Energy Environ. Sci. 2010, 3, 1011–1017. [Google Scholar] [CrossRef]
  208. Stoddart, P.; White, D. Optical fibre SERS sensors. Anal. Bioanal. Chem. 2009, 394, 1761–1774. [Google Scholar] [CrossRef]
  209. Sengupta, A.; Mujacic, M.; Davis, E.J. Detection of bacteria by surface-enhanced Raman spectroscopy. Anal. Bioanal. Chem. 2006, 386, 1379–1386. [Google Scholar] [CrossRef]
  210. Golightly, R.S.; Doering, W.E.; Natan, M.J. Surface-enhanced Raman spectroscopy and homeland security: A perfect match? ACS Nano 2009, 3, 2859–2869. [Google Scholar] [CrossRef]
  211. Wang, Y.; Serrano, S.; Santiago-Avilés, J.J. Raman characterization of carbon nanofibers prepared using electrospinning. Synth. Met. 2003, 138, 423–427. [Google Scholar] [CrossRef]
  212. Li, X.; Hayashi, J.-I.; Li, C.-Z. FT-Raman spectroscopic study of the evolution of char structure during the pyrolysis of a Victorian brown coal. Fuel 2006, 85, 1700–1707. [Google Scholar] [CrossRef]
  213. Pawlyta, M.; Rouzaud, J.-N.; Duber, S. Raman microspectroscopy characterization of carbon blacks: Spectral analysis and structural information. Carbon 2015, 84, 479–490. [Google Scholar] [CrossRef]
  214. Dippel, B.; Heintzenberg, J. Soot characterization in atmospheric particles from different sources by NIR FT Raman spectroscopy. J. Aerosol Sci. 1999, 30, S907–S908. [Google Scholar] [CrossRef]
  215. Jawhari, T.; Roid, A.; Casado, J. Raman spectroscopic characterization of some commercially available carbon black materials. Carbon 1995, 33, 1561–1565. [Google Scholar] [CrossRef]
  216. He, S.; Zhang, W.; Liu, L.; Huang, Y.; He, J.; Xie, W.; Wu, P.; Du, C. Baseline correction for Raman spectra using an improved asymmetric least squares method. Anal. Methods 2014, 6, 4402–4407. [Google Scholar] [CrossRef]
  217. Liu, H.; Zhang, Z.; Liu, S.; Yan, L.; Liu, T.; Zhang, T. Joint baseline-correction and denoising for Raman spectra. Appl. Spectrosc. 2015, 69, 1013–1022. [Google Scholar] [CrossRef]
  218. He, S.; Fang, S.; Liu, X.; Zhang, W.; Xie, W.; Zhang, H.; Wei, D.; Fu, W.; Pei, D. Investigation of a genetic algorithm based cubic spline smoothing for baseline correction of Raman spectra. Chemom. Intell. Lab. Syst. 2016, 152, 1–9. [Google Scholar] [CrossRef]
  219. Guo, S.; Bocklitz, T.; Popp, J. Optimization of Raman-spectrum baseline correction in biological application. Analyst 2016, 141, 2396–2404. [Google Scholar] [CrossRef] [PubMed] [Green Version]
  220. De Beer, T.; Vergote, G.; Baeyens, W.; Remon, J.P.; Vervaet, C.; Verpoort, F. Development and validation of a direct, non-destructive quantitative method for medroxyprogesterone acetate in a pharmaceutical suspension using FT-Raman spectroscopy. Eur. J. Pharm. Sci. 2004, 23, 355–362. [Google Scholar] [CrossRef] [PubMed]
  221. De Gelder, J.; De Gussem, K.; Vandenabeele, P.; Moens, L. Reference database of Raman spectra of biological molecules. J. Raman Spectrosc. 2007, 38, 1133–1147. [Google Scholar] [CrossRef]
  222. Wang, A.; Han, J.; Guo, L.; Yu, J.; Zeng, P. Database of standard Raman spectra of minerals and related inorganic crystals. Appl. Spectrosc. 1994, 48, 959–968. [Google Scholar] [CrossRef]
  223. Castro, K.; Pérez-Alonso, M.; Rodríguez-Laso, M.; Fernández, L.A.; Madariaga, J. On-line FT-Raman and dispersive Raman spectra database of artists’ materials (e-VISART database). Anal. Bioanal. Chem. 2005, 382, 248–258. [Google Scholar] [CrossRef] [PubMed]
  224. Vandenabeele, P.; Moens, L.; Edwards, H.G.; Dams, R. Raman spectroscopic database of azo pigments and application to modern art studies. J. Raman Spectrosc. 2000, 31, 509–517. [Google Scholar] [CrossRef]
Figure 2. Schematic diagram of the SERS process. Reprinted from Jeon et al. [25]. Reprinted from Ref. [25].
Chemosensors 09 00262 g002
Figure 3. Raman spectra of isolated SWCNTs collected using a laser source with a wavelength of 785 nm [77]. Bands marked with * are due to the substrate of Si/SiO2. Reprinted with permission from Ref. [77]. Copyright 2002 Elsevier.
Chemosensors 09 00262 g003
Figure 4. Raman spectra of single layer highly pure graphene as reported by Calizo et al. [94]. (Reprinted with permission from Ref. [94]. Copyright 2007 American Chemical Society).
Chemosensors 09 00262 g004
Figure 5. Raman spectra of graphite (black), disorderd pyrolytic carbon (blue), and diamond-like carbon (red), as reported by Tagliaferro et al. [118]. Reprinted from Ref. [118].
Chemosensors 09 00262 g005
Figure 6. Raman spectrum of S. aureus cells in a panel acquired by suing an excitation power on the sample of up to 2 mW and an acquisition time of up to 30 s, as reported by Li et al. [161]. (Reprinted with permission from Ref. [161]. Copyright 2019 American Chemical Society).
Chemosensors 09 00262 g006
Table 1. Overview of the data achievable for each of the main classes of materials analyzed though Raman spectroscopy.
MaterialsFeaturesInformations ProvidedLimitations
CNTs
D and G peaks
RBM
2D region
Order (ID/IG)
Chirality ( ω R B M )
Metallic or semicondutive behavior (G peak)
Number of layer (G peak shape)
MWCT signal fits could be arbitrary in the choice of lineshape
RBM detection in MWCNT is possible only for straight isolated CNTs on a SERS substrate
Graphene and graphene like materials
G peak
D peak (only for defective structures)
2D region
Defects (rise of D peak)
Order (ID/IG)
Number of graphene layers (D and G’ peaks)
Difficult discrimination between few-layer defected graphene and good quality graphite
Amorphous carbon
D and G peaks
2D region
Order (ID/IG), shape of region 2-D)
Analysis of reorganization based on production temperature
Fit of D and G peaks
Physical explanation of D and G components
Inorganic species
Several peaks at low Raman shifts (generally lower than 1000 cm−1)
Chemical species identification
Phase identification
Difficult spectra processability
Need of supporting informations for trustworthy reference databases (i.e., XRD)
Organic molecules
Several peaks based on the specie analyzed
Structural informations of macromolecule (molecular weight, ageing, and crystallinity)
Crystallization monitoring
Quantification even on molecular level (SERS)
A peak-by-peak assignment is very challenging for macromolecule
Very sensible to interferences of non- targeted organic species
Quantification through SERS techniques required and external validation (i.e., chromatography and quantitative spectroscopy)
Publisher’s Note: MDPI stays neutral with regard to jurisdictional claims in published maps and institutional affiliations.

