
Systemic Inflammatory Biomarkers Define Specific Clusters in Patients with Bronchiectasis: A Large-Cohort Study

 , , , , , and
Abstract
:1. Introduction
2. Methods
2.1. Study Design
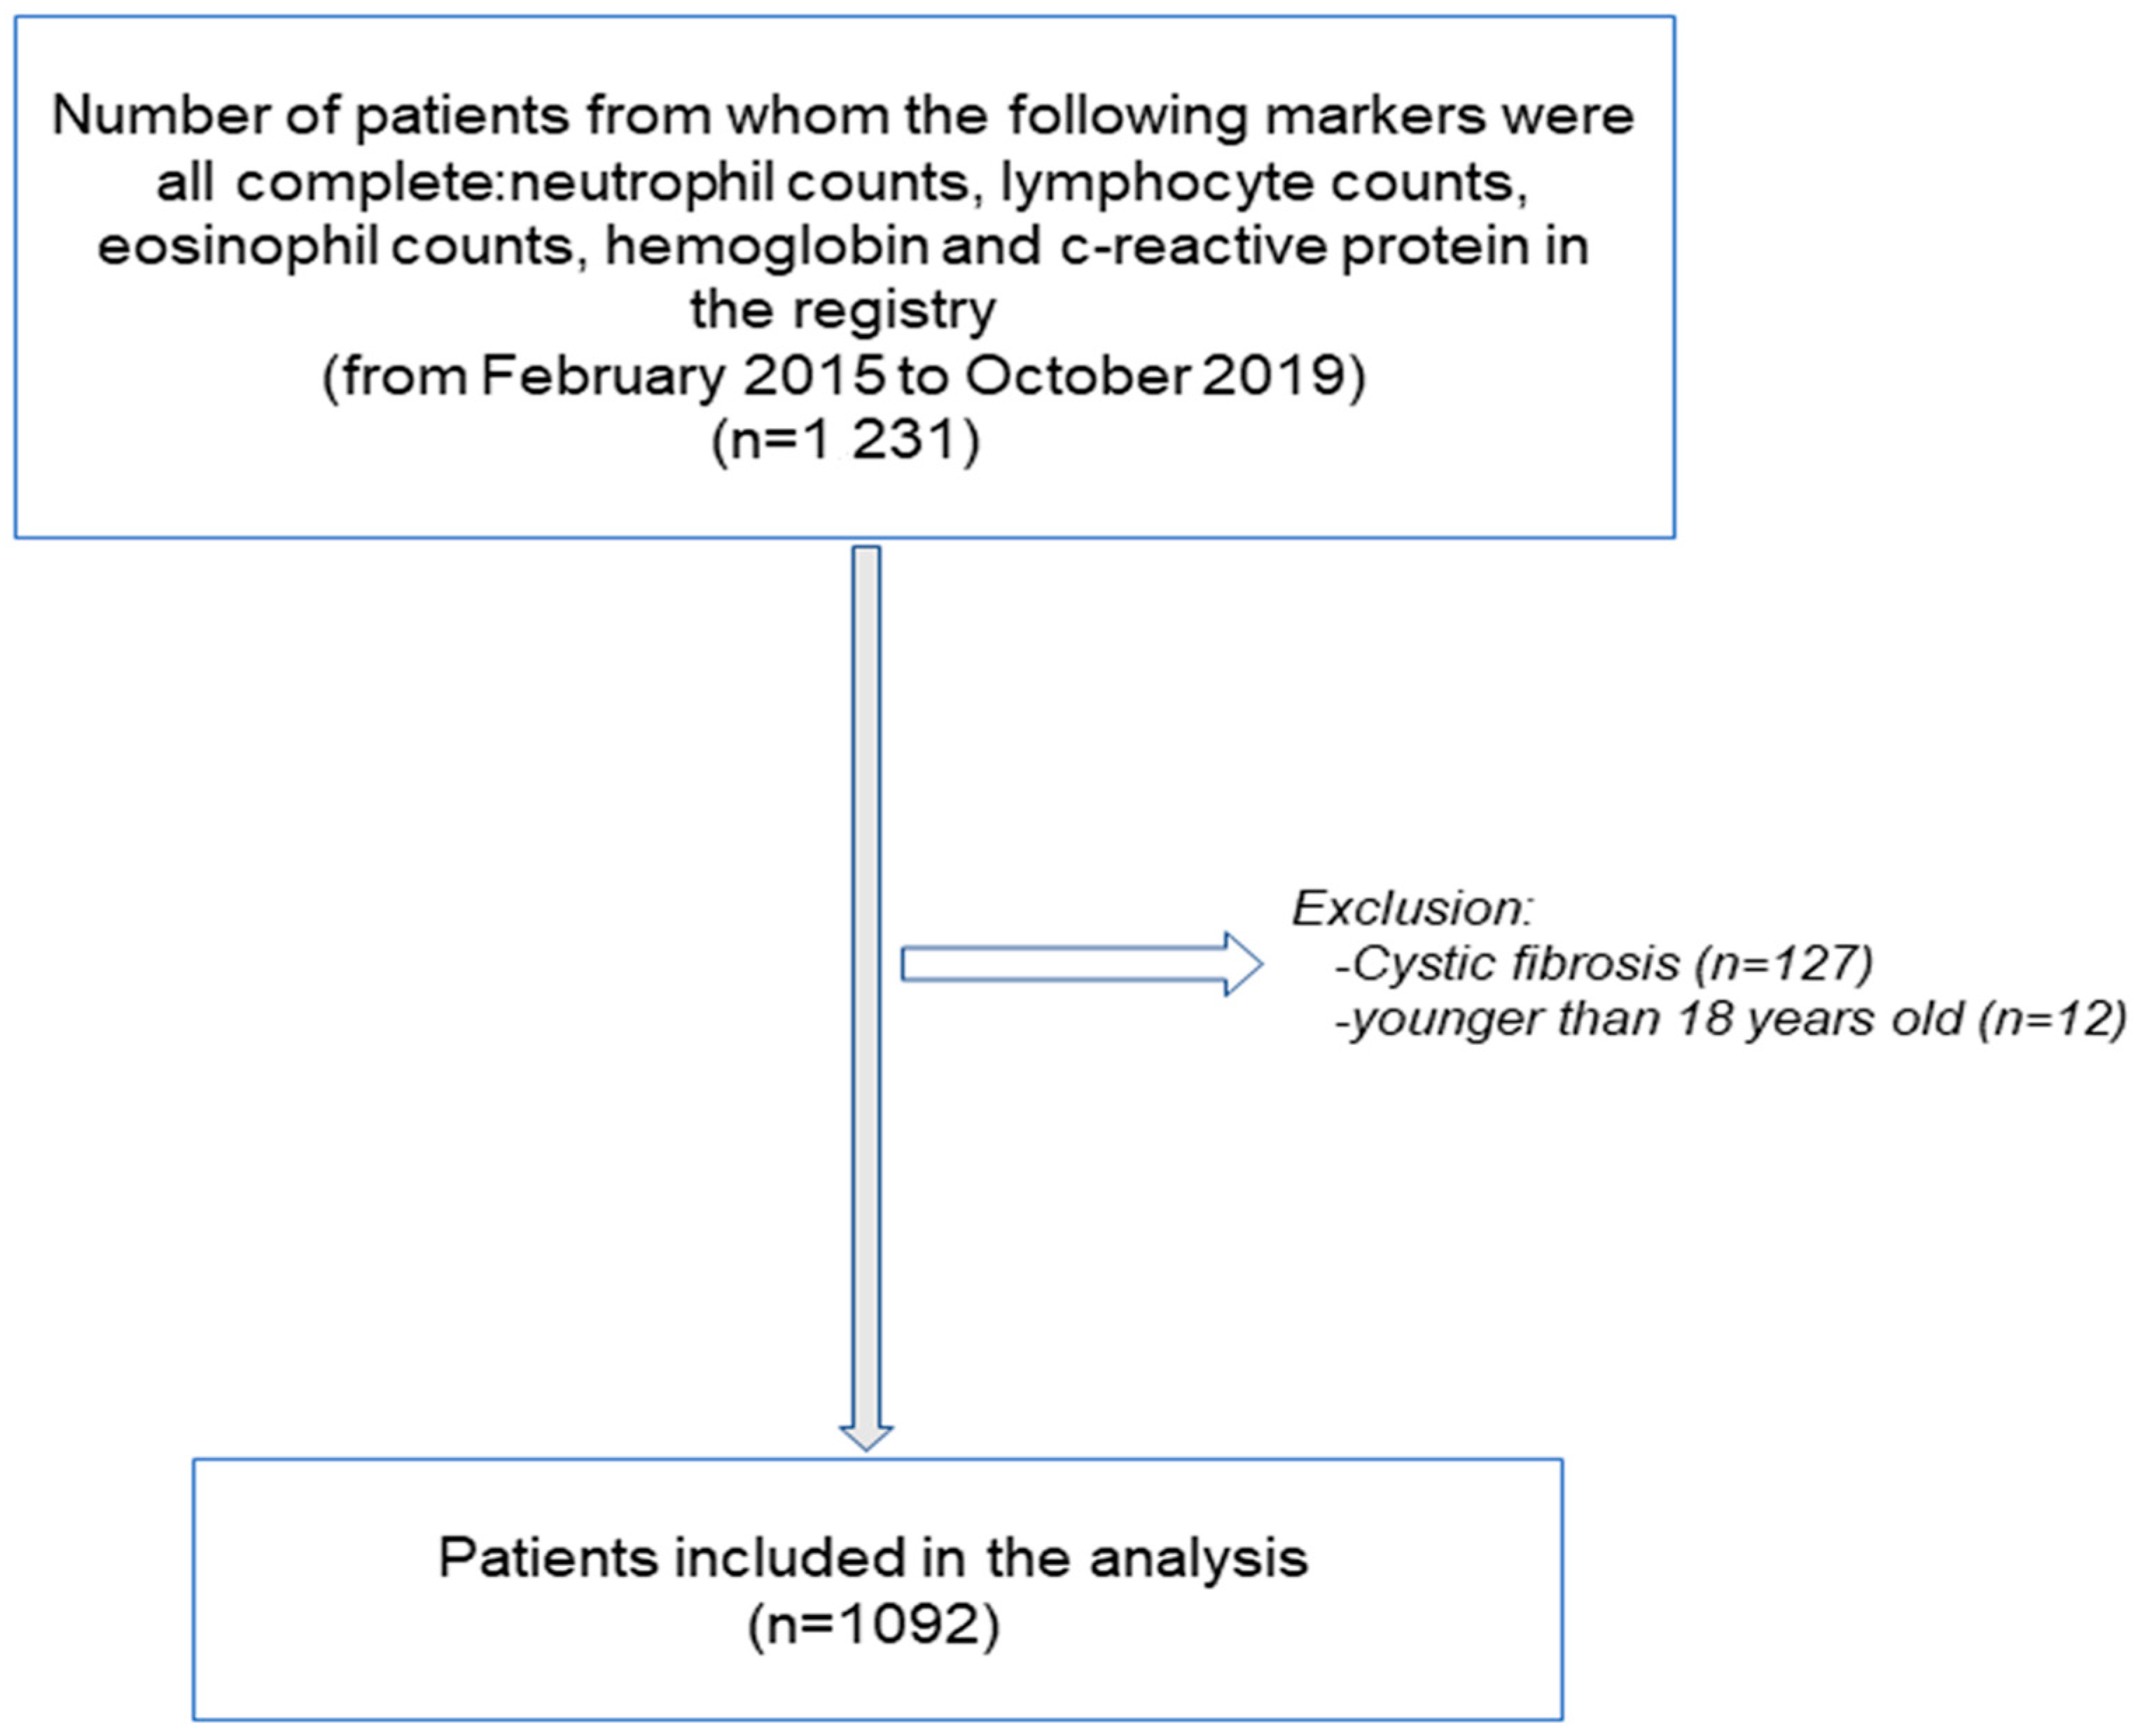
2.2. Study Population
2.3. Study Variables and Scores
2.4. Patient Clustering
2.5. Statistical Analysis
3. Results
3.1. General Clinical Characteristics of the Three Patient Clusters
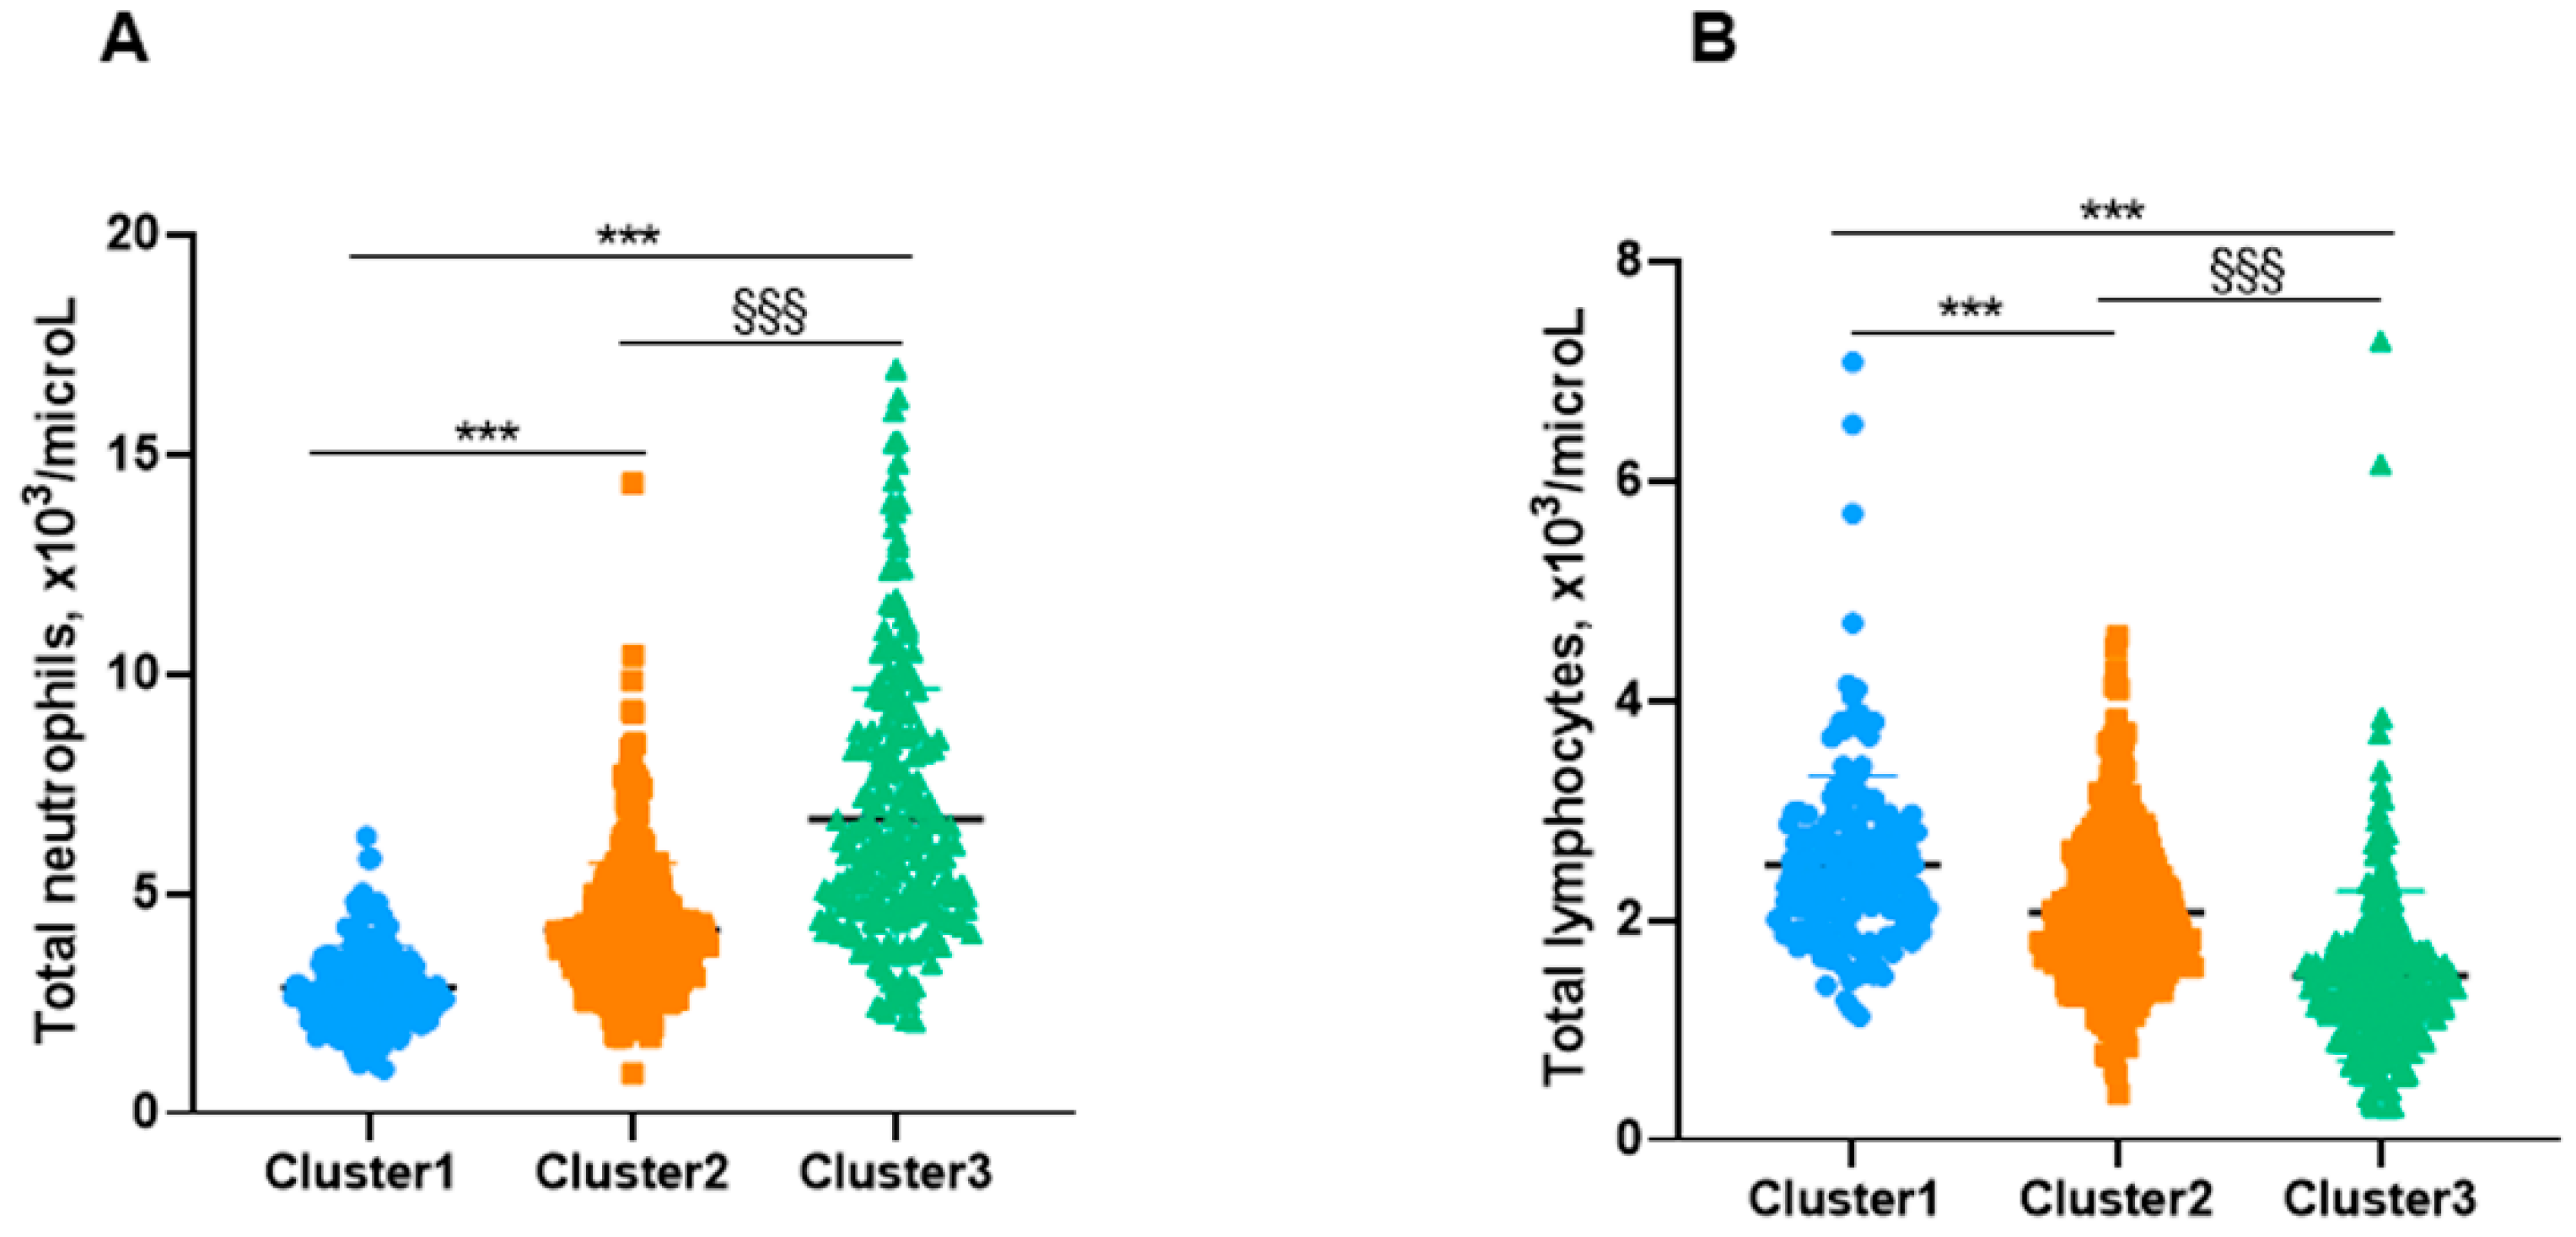
3.2. Systemic Inflammatory and Nutritional Parameters in the Three Cluster Patients
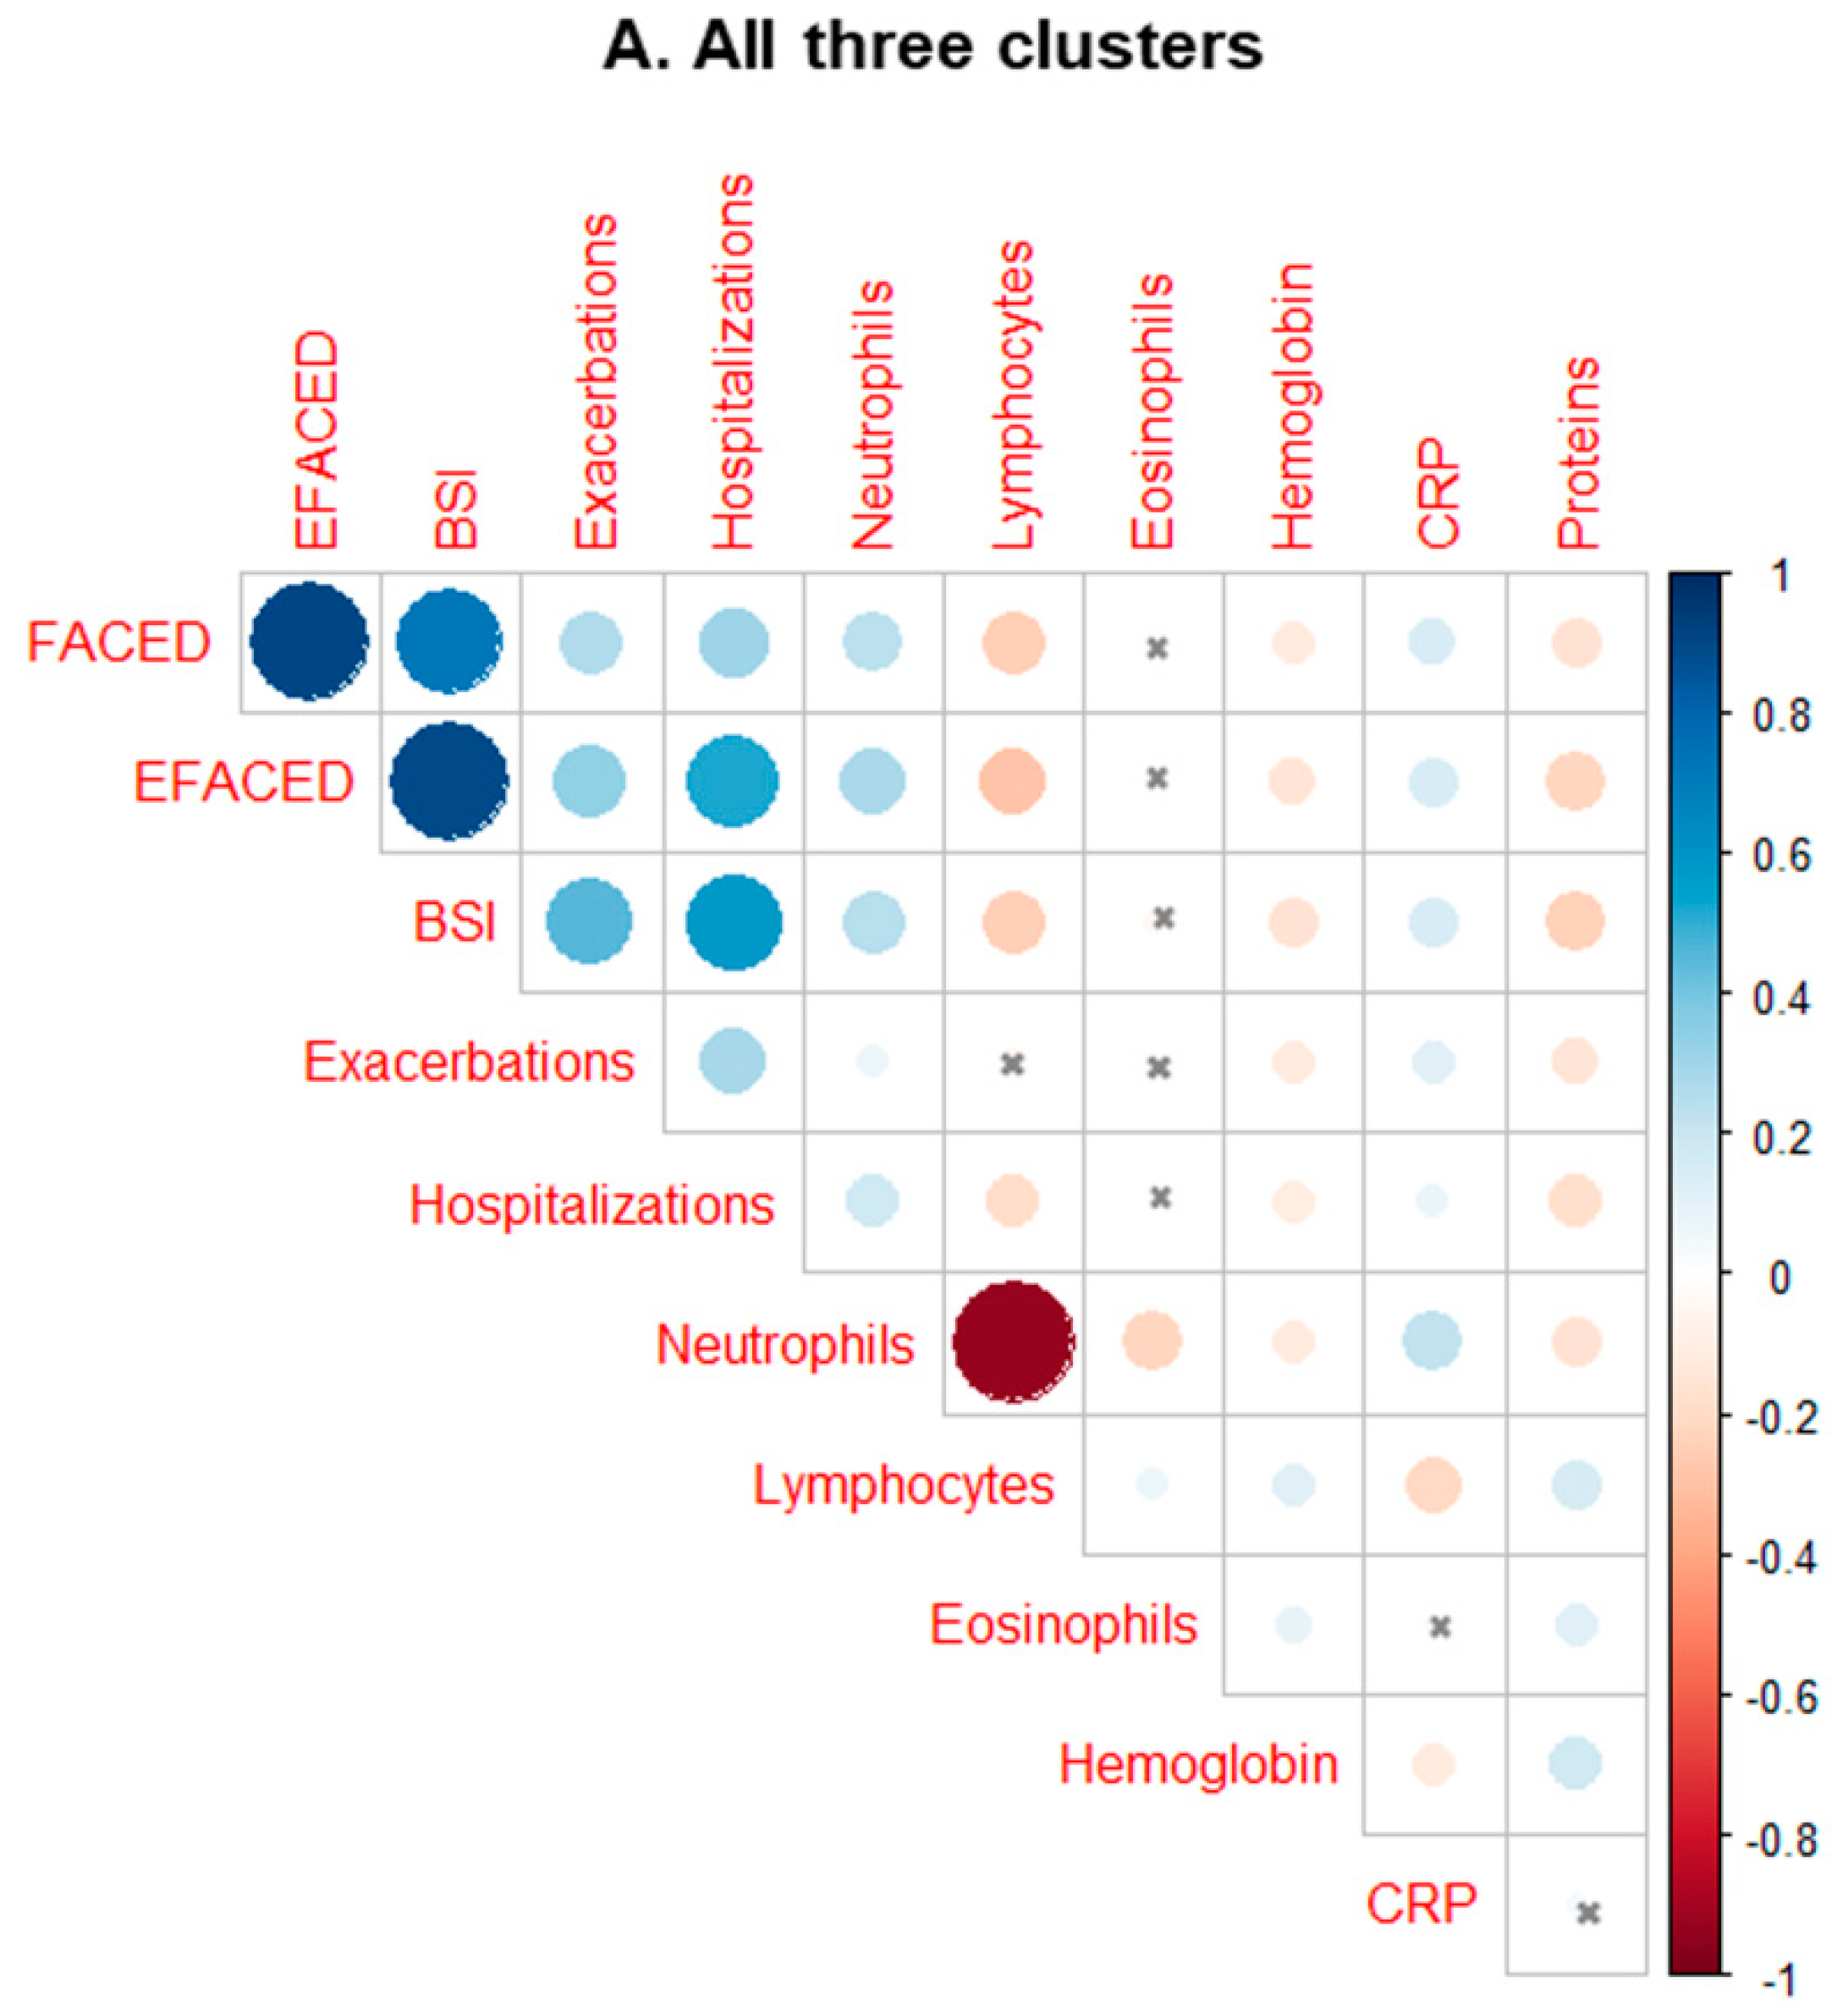
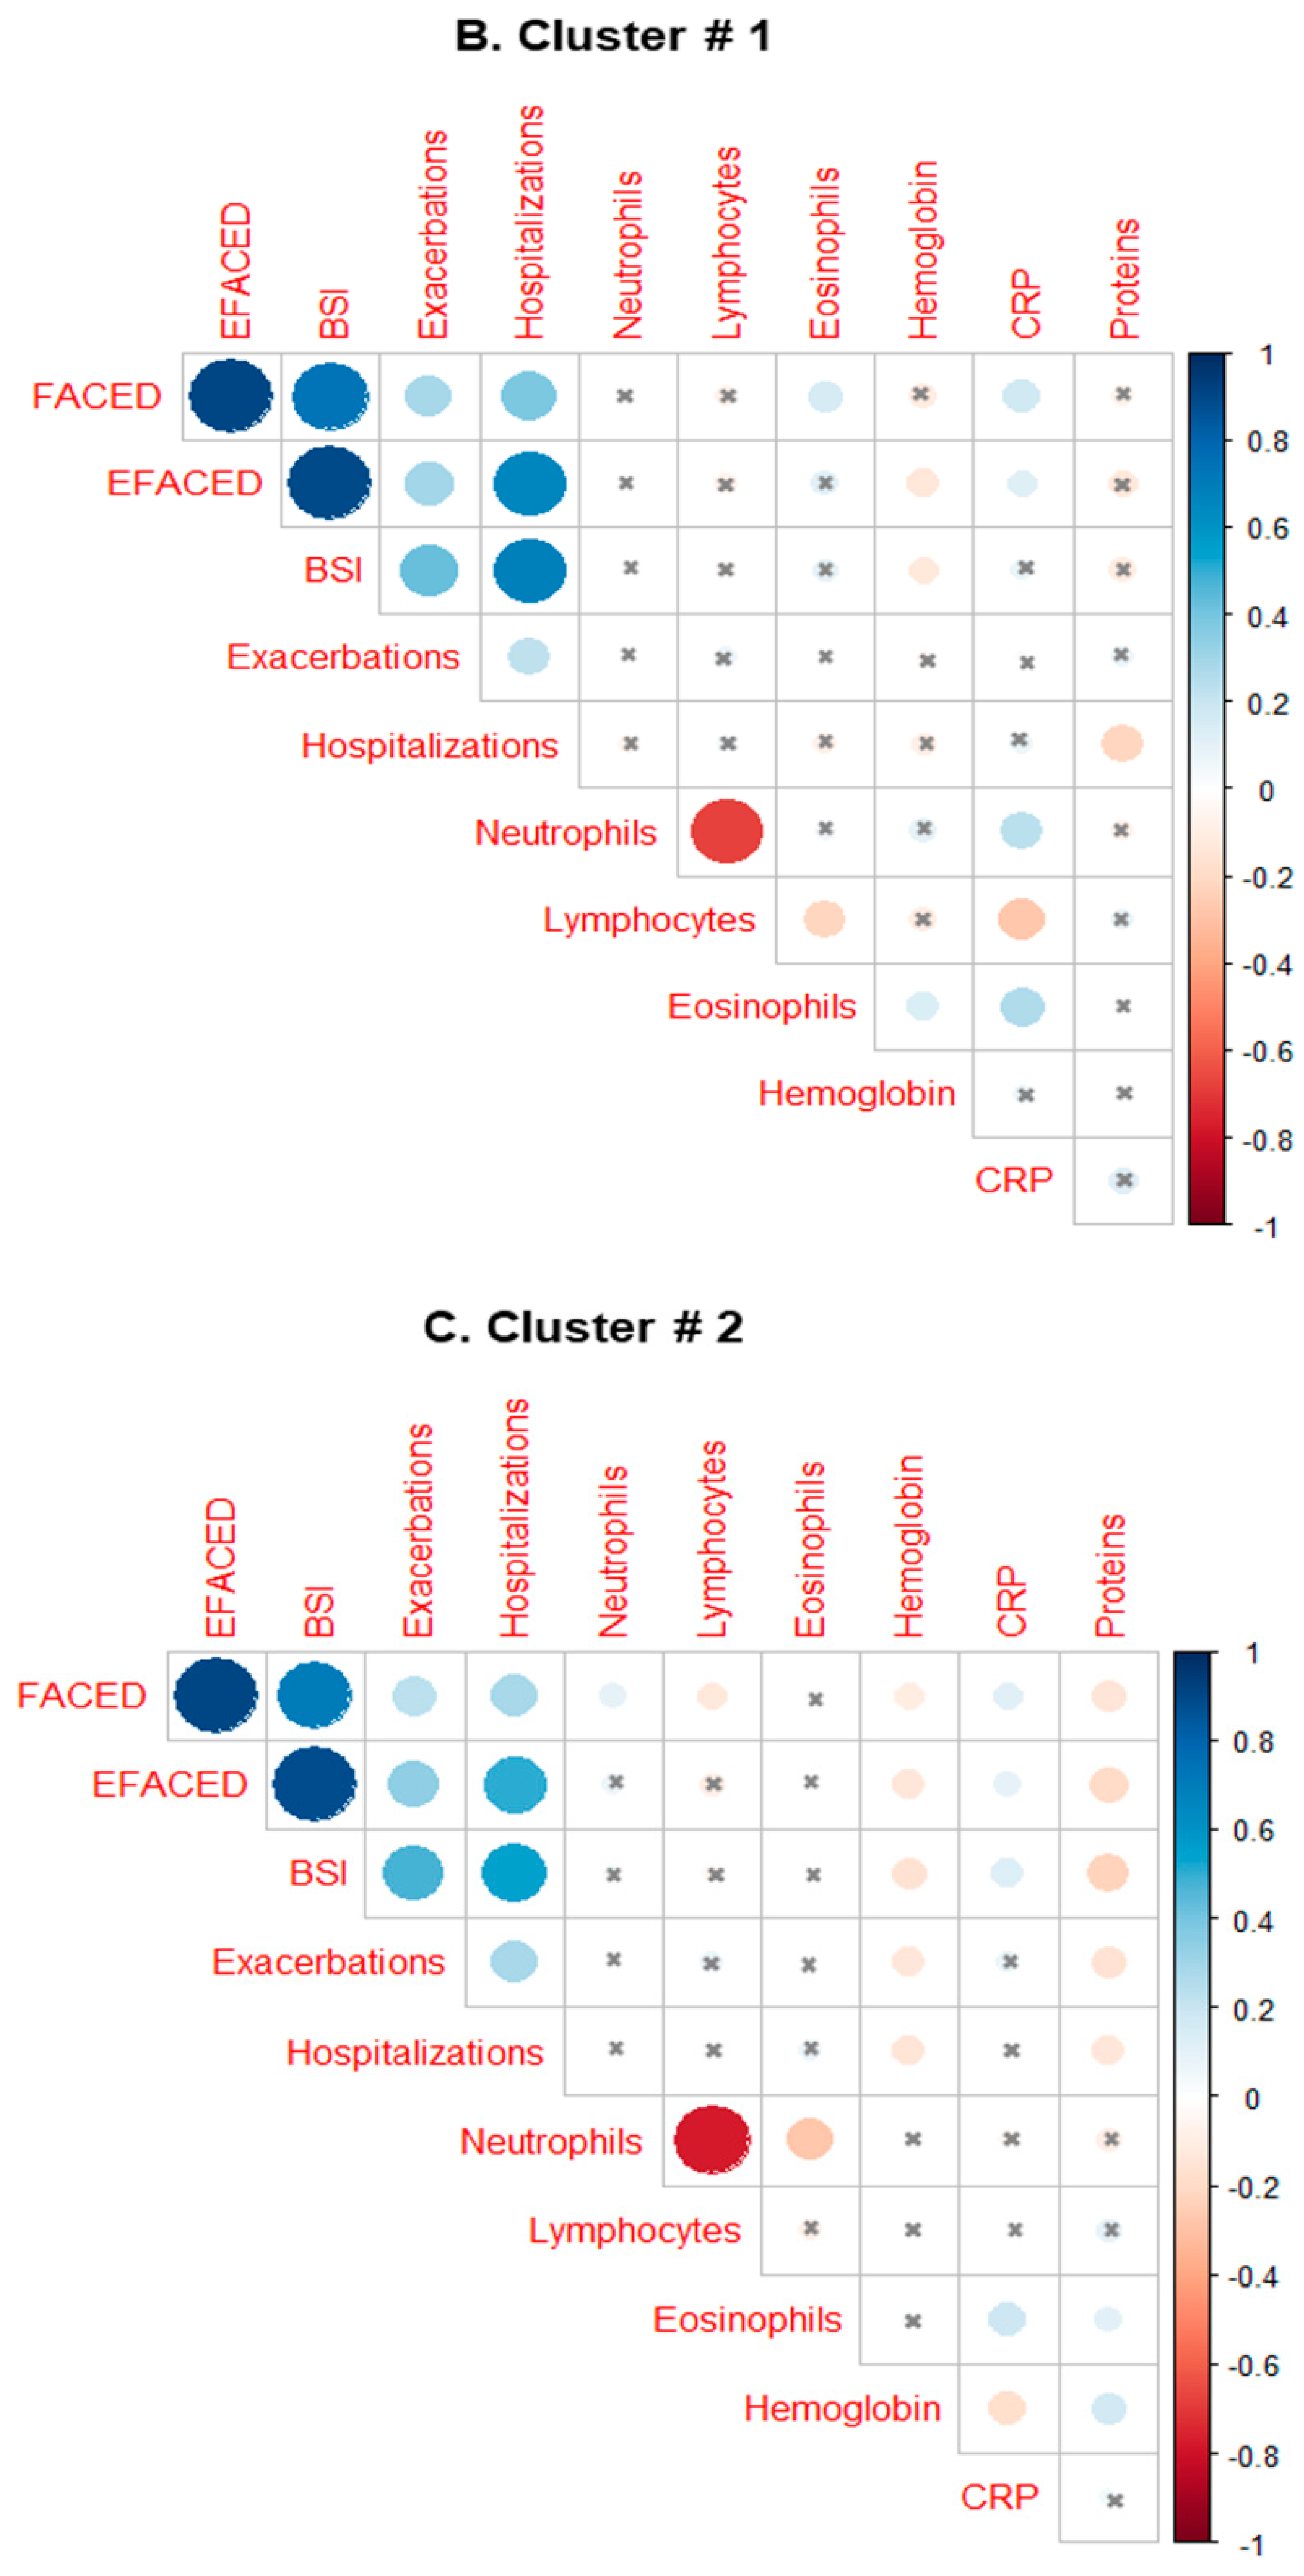
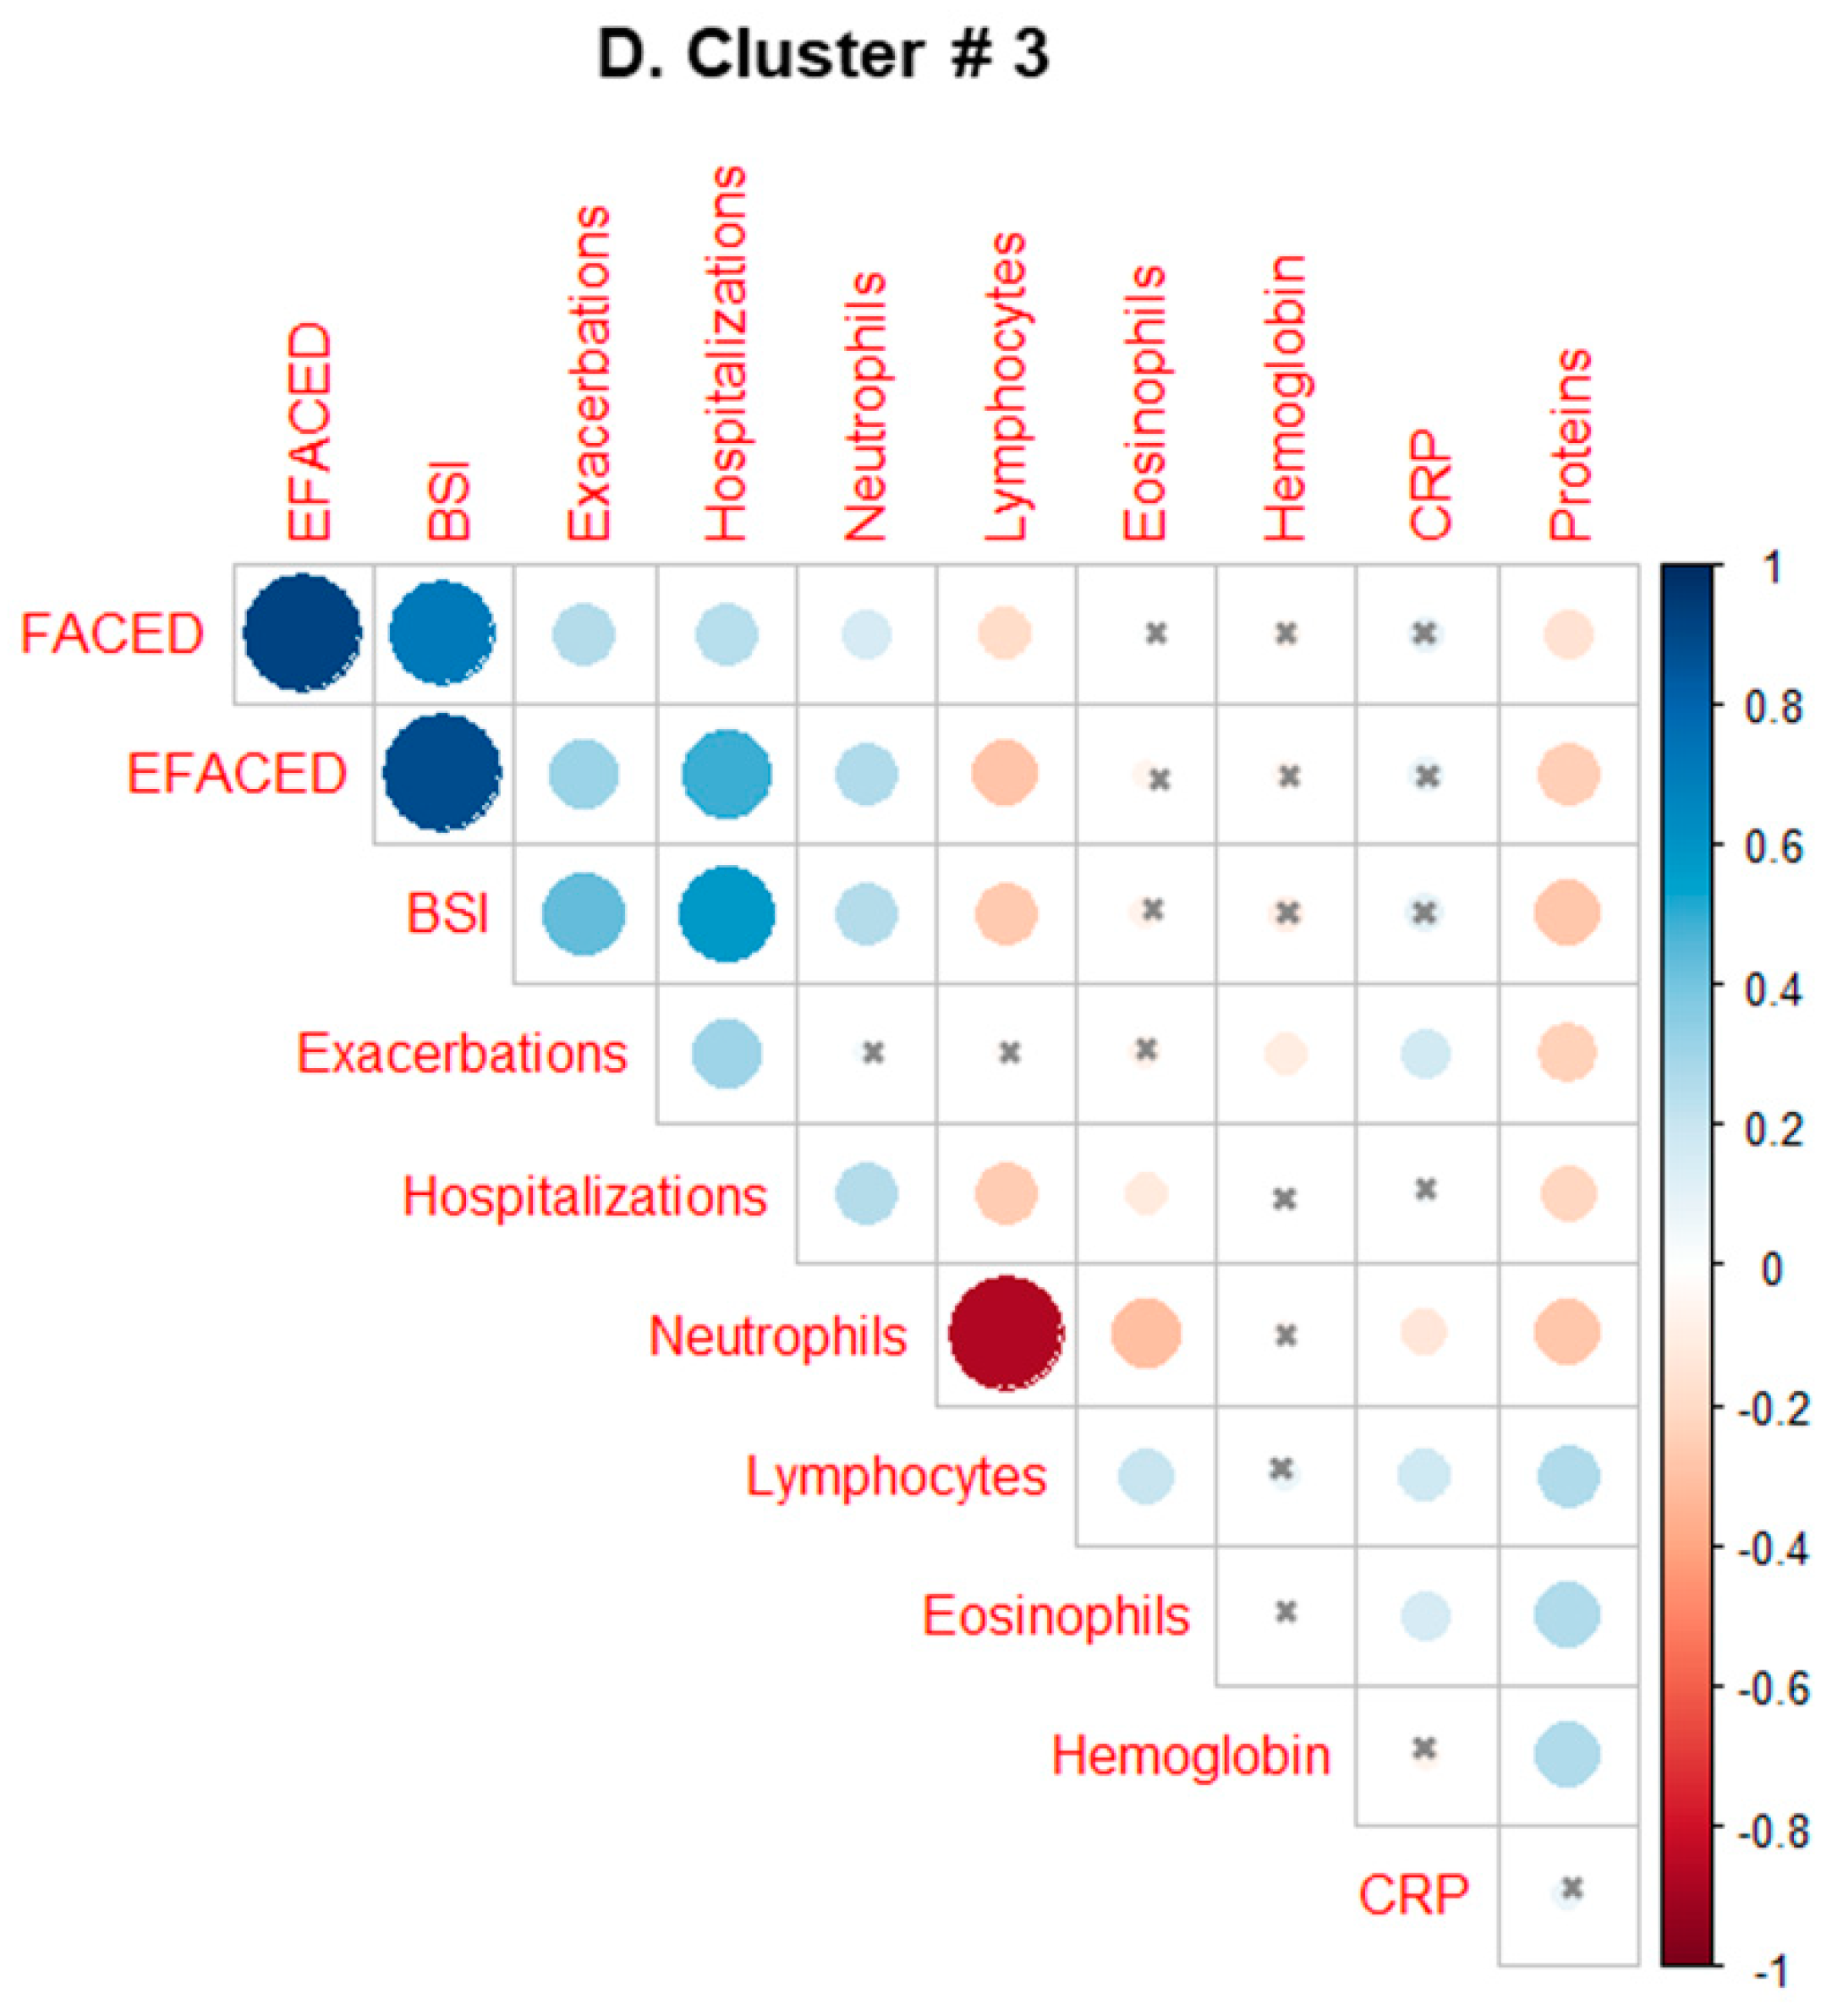
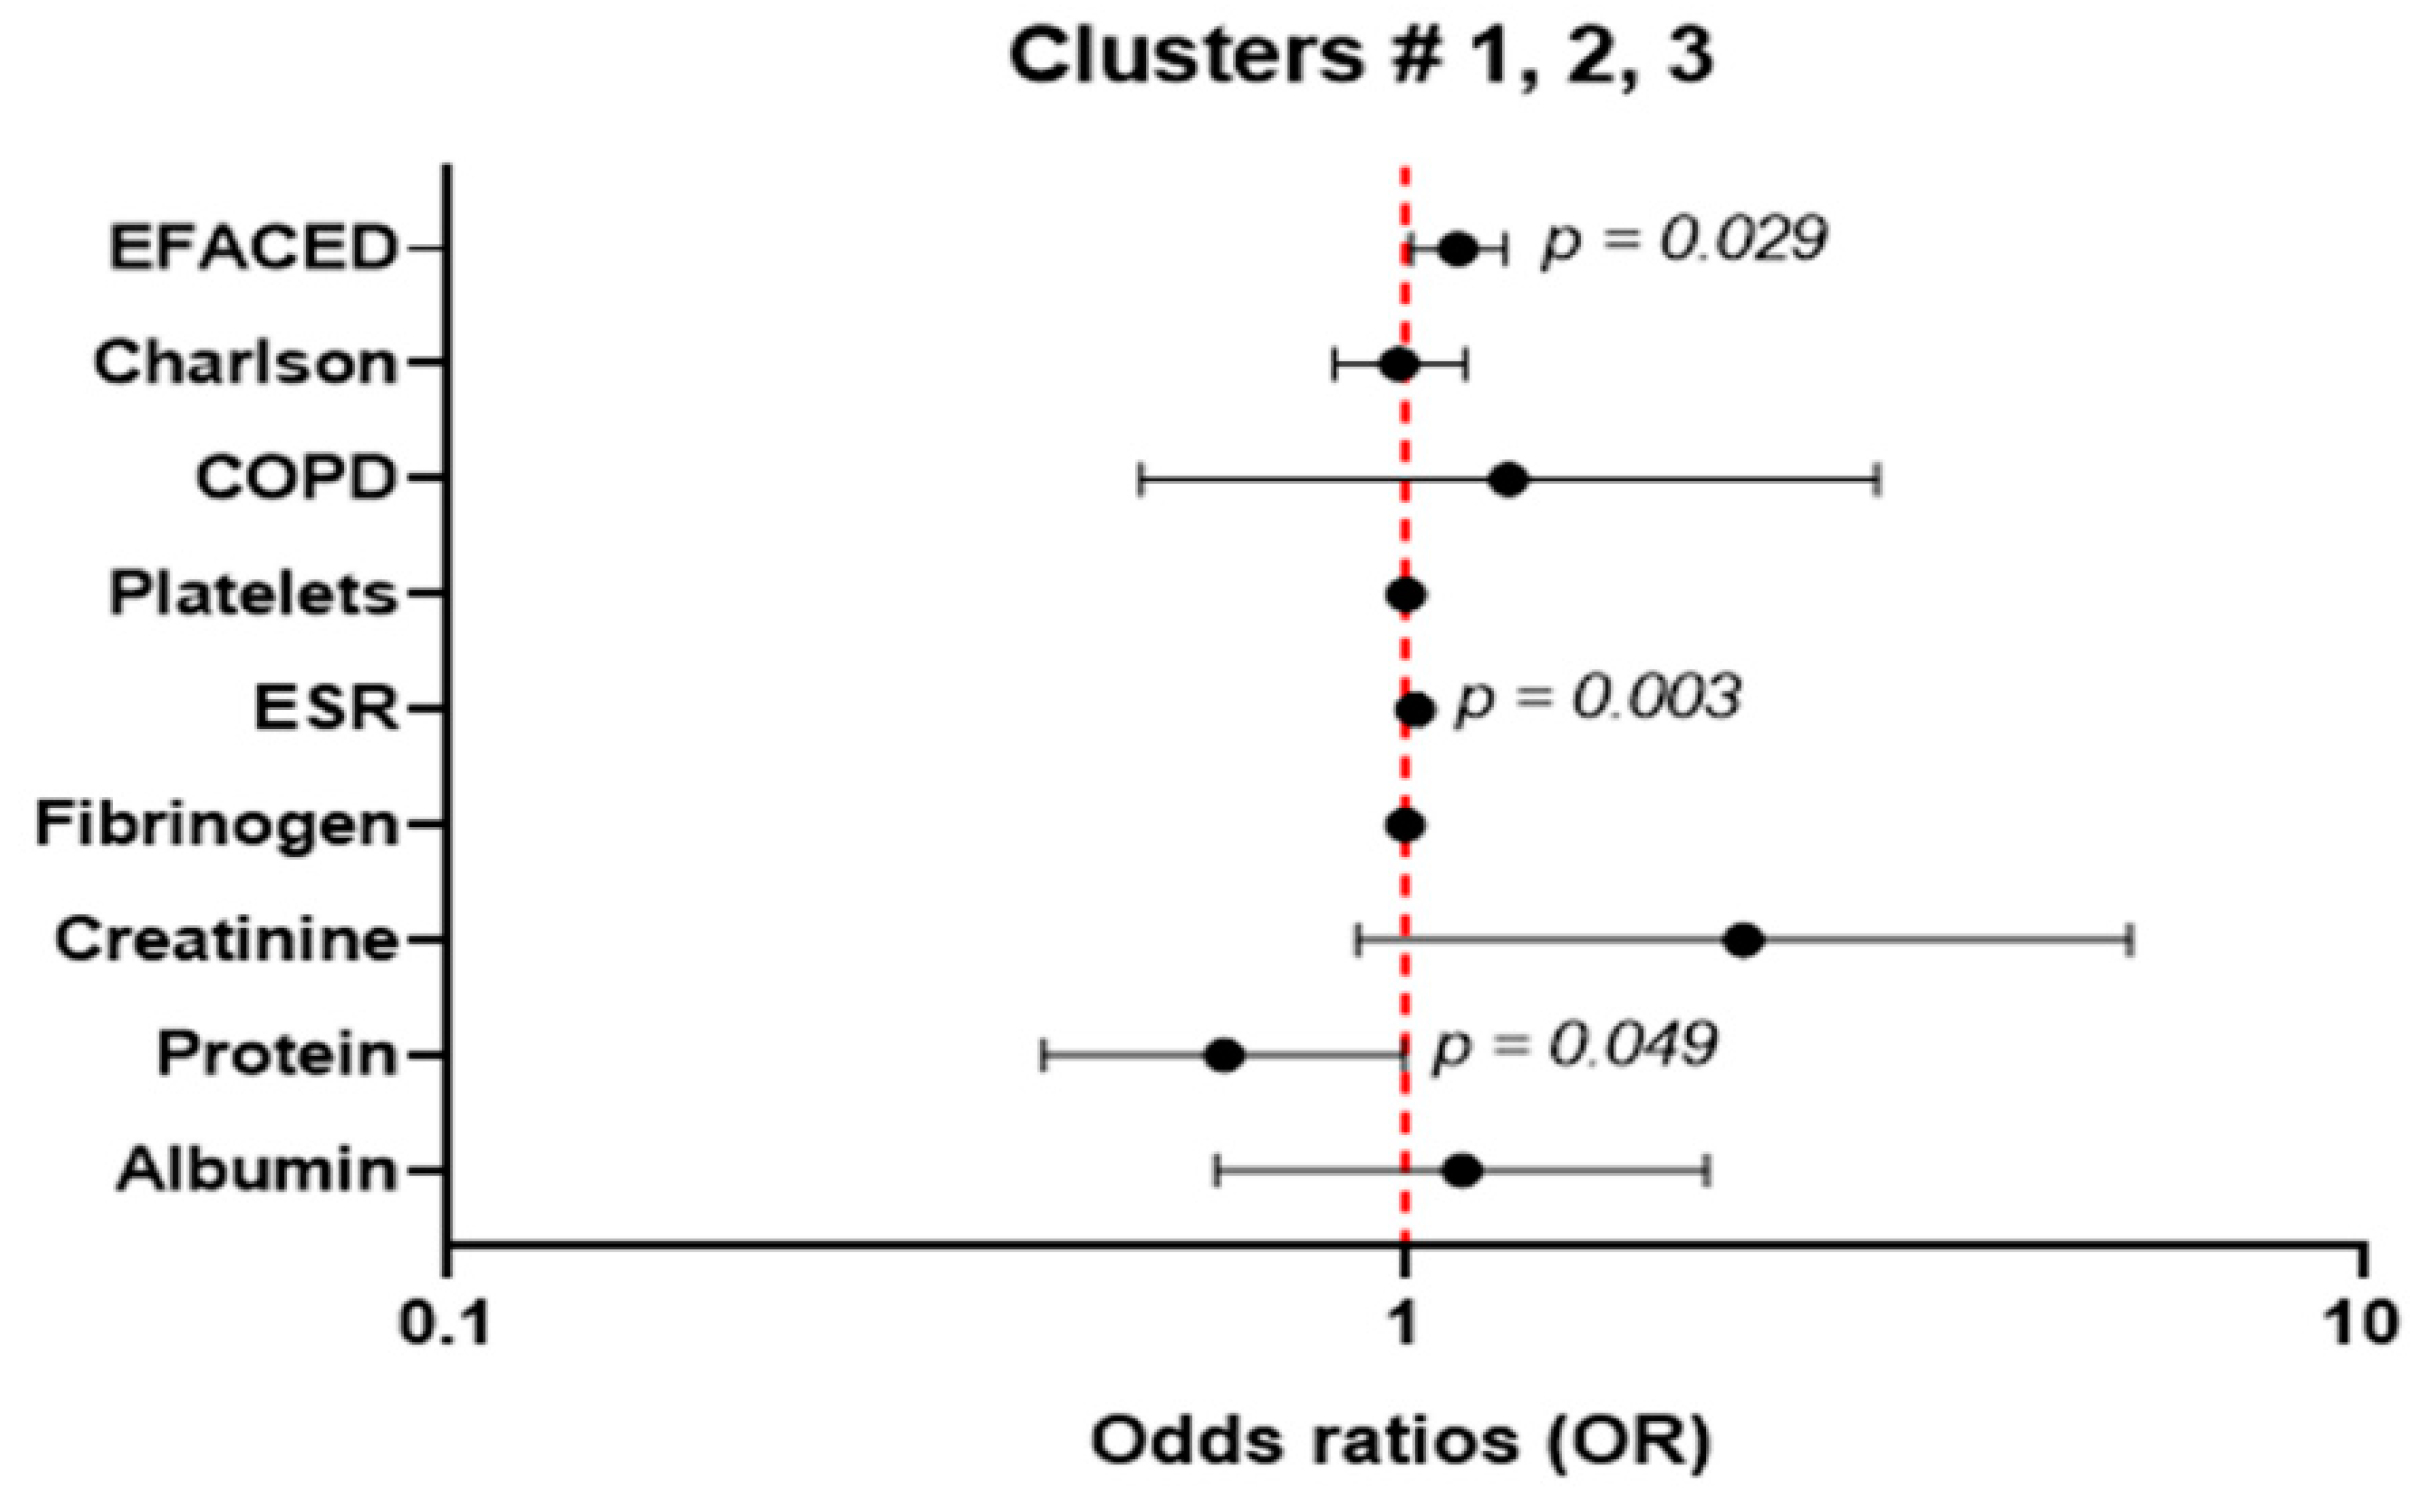
3.3. Multivariate Analysis
4. Discussion
Study Critique
5. Conclusions
Author Contributions
Funding
Institutional Review Board Statement
Informed Consent Statement
Data Availability Statement
Conflicts of Interest
References
- Martinez-Garcia, M.A.; Agustí, A. Heterogeneidad y complejidad del síndrome bronquiectasias: Un reto pendiente. Arch. Bronconeumol. 2019, 55, 187–188. [Google Scholar] [CrossRef]
- Martinez-Garcia, M.A.; de la Rosa, D.; Cantón, R.; Olveira, C.; Máiz-Carro, L.; Girón, R.; Prados, C.; Blanco, M. Bronquiectasias: Cuando la evidencia científica publicada no resulta suficiente. Arch. Bronconeumol. 2019, 55, 283–285. [Google Scholar] [CrossRef] [PubMed]
- Martínez-García, M.A.; Olveira, C.; Máiz, L.; Girón, R.M.; Prados, C.; de la Rosa, D.; Blanco, M.; Agustí, A. Bronchiectasis: A Complex, Heterogeneous Disease. Arch. Bronconeumol. 2019, 55, 427–433. [Google Scholar] [CrossRef]
- Chalmers, J.D.; Aliberti, S.; Filonenko, A.; Shteinberg, M.; Goeminne, P.C.; Hill, A.T.; Fardon, T.C.; Obradovic, D.; Gerlinger, C.; Sotgiu, G.; et al. Characterization of the “frequent exacerbator phenotype” in bronchiectasis. Am. J. Respir. Crit. Care Med. 2018, 197, 1410–1420. [Google Scholar] [CrossRef] [PubMed]
- Menéndez, R.; Méndez, R.; Amara-Elori, I.; Reyes, S.; Montull, B.; Feced, L.; Alonso, R.; Amaro, R.; Alcaraz, V.; Fernandez-Barat, L.; et al. Systemic Inflammation during and after Bronchiectasis Exacerbations: Impact of Pseudomonas aeruginosa. J. Clin. Med. 2020, 9, 2631. [Google Scholar] [CrossRef]
- Wilson, C.B.; Jones, P.W.; O’Leary, C.J.; Hansell, D.M.; Dowling, R.B.; Cole, P.J.; Wilson, R. Systemic markers of inflammation in stable bronchiectasis. Eur. Respir. J. 1998, 12, 820–824. [Google Scholar] [CrossRef] [PubMed] [Green Version]
- Rademacher, J.; Konwert, S.; Fuge, J.; Dettmer, S.; Welte, T.; Ringshausen, F.C. Anti-IL5 and anti-IL5Rα therapy for clinically significant bronchiectasis with eosinophilic endotype: A case series. Eur. Respir. J. 2020, 55, 1901333. [Google Scholar] [CrossRef]
- Carpagnano, G.E.; Scioscia, G.; Lacedonia, D.; Curradi, G.; Barbaro, M.P.F. Severe uncontrolled asthma with bronchiectasis: A pilot study of an emerging phenotype that responds to mepolizumab. J. Asthma Allergy 2019, 12, 83–90. [Google Scholar] [CrossRef] [Green Version]
- Martinez-Garcia, M.A.; Posadas, T.; Sotgiu, G.; Blasi, F.; Saderi, L.; Aliberti, S. Repeteability of Circulating Eosinophil Measures and Inhaled Corticosteroids Effect in Bronchiectasis. A Post Hoc Analysis of a Randomized Clinical Trial. Arch. Bronconeumol. 2020, 56, 681–683. [Google Scholar] [CrossRef]
- Martínez-García, M.Á. Bronchiectasis and Eosinophils. Arch. Bronconeumol. 2021, 57, 671–672. [Google Scholar] [CrossRef]
- Aliberti, S.; Sotgiu, G.; Blasi, F.; Saderi, L.; Posadas, T.; Martinez Garcia, M.A. Blood eosinophils predict inhaled fluticasone response in bronchiectasis. Eur. Respir. J. 2020, 56, 2000453. [Google Scholar] [CrossRef]
- Martinez-Garcia, M.A.; Posadas, T.; Sotgiu, G.; Blasi, F.; Saderi, L.; Aliberti, S. Role of inhaled corticosteroids in reducing exacerbations in bronchiectasis patients with blood eosinophilia pooled post-hoc analysis of 2 randomized clinical trials. Respir. Med. 2020, 172, 106127. [Google Scholar] [CrossRef] [PubMed]
- Silva, J.R.; Jones, J.A.H.; Cole, P.J.; Poulter, L.W. The immunological component of the cellular inflammatory infiltrate in bronchiectasis. Thorax 1989, 44, 668–673. [Google Scholar] [CrossRef] [PubMed] [Green Version]
- Wang, X.; Villa, C.; Dobarganes, Y.; Olveira, C.; Girón, R.; García-Clemente, M.; Maíz, L.; Sibila, O.; Golpe, R.; Menéndez, R.; et al. Differences in Nutritional Status and Inflammatory Biomarkers between Female and Male Patients with Bronchiectasis: A Large-Cohort Study. Biomedicines 2021, 9, 905. [Google Scholar] [CrossRef]
- Barnes, P.J. Inflammatory mechanisms in patients with chronic obstructive pulmonary disease. J. Allergy Clin. Immunol. 2016, 138, 16–27. [Google Scholar] [CrossRef] [Green Version]
- Sun, Y.; Milne, S.; Jaw, J.E.; Yang, C.X.; Xu, F.; Li, X.; Obeidat, M.; Sin, D.D. BMI is associated with FEV1 decline in chronic obstructive pulmonary disease: A meta-analysis of clinical trials. Respir. Res. 2019, 20, 236. [Google Scholar] [CrossRef] [Green Version]
- Guo, Y.; Zhang, T.; Wang, Z.; Yu, F.; Xu, Q.; Guo, W.; Wu, C.; He, J. Body mass index and mortality in chronic obstructive pulmonary disease: A dose-response meta-analysis. Medicine 2016, 95, e4225. [Google Scholar] [CrossRef] [PubMed]
- He, M.; Zhu, M.; Wang, C.; Wu, Z.; Xiong, X.; Wu, H.; Cheng, D.; Ji, Y. Prognostic performance of the FACED score and bronchiectasis severity index in bronchiectasis: A systematic review and meta-analysis. Biosci. Rep. 2020, 40, BSR20194514. [Google Scholar] [CrossRef]
- Wang, X.; Villa, C.; Dobarganes, Y.; Olveira, C.; Girón, R.; García-Clemente, M.; Máiz, L.; Sibila, O.; Golpe, R.; Menéndez, R.; et al. Phenotypic Clustering in Non-Cystic Fibrosis Bronchiectasis Patients: The Role of Eosinophils in Disease Severity. Int. J. Environ. Res. Public Health 2021, 18, 8431. [Google Scholar] [CrossRef] [PubMed]
- King, P.T.; Hutchinson, P.; Holmes, P.W.; Freezer, N.J.; Bennett-Wood, V.; Robins-Browne, R.; Holdsworth, S.R. Assessing immune function in adult bronchiectasis. Clin. Exp. Immunol. 2006, 144, 440–446. [Google Scholar] [CrossRef]
- Martinez-García, M.A.; Villa, C.; Dobarganes, Y.; Girón, R.; Maíz, L.; García-Clemente, M.; Sibila, O.; Golpe, R.; Rodríguez, J.; Barreiro, E.; et al. RIBRON: The spanish Online Bronchiectasis Registry. Characterization of the First 1912 Patients. Arch. Bronconeumol. 2021, 57, 28–35. [Google Scholar] [CrossRef]
- Martinez-García, M.A.; Oscullo, G.; Posadas, T.; Zaldivar, E.; Villa, C.; Dobarganes, Y.; Girón, R.; Olveira, C.; Maíz, L.; García-Clemente, M.; et al. Pseudomonas aeruginosa and lung function decline in patients with bronchiectasis. Clin. Microbiol. Infect. 2021, 27, 428–434. [Google Scholar] [CrossRef]
- Posadas, T.; Oscullo, G.; Zaldivar, E.; Villa, C.; Dobarganes, Y.; Girón, R.; Olveira, C.; Maíz, L.; García-Clemente, M.; Sibila, O.; et al. C-Reactive Protein Concentration in Steady-State Bronchiectasis: Prognostic Value of Future Severe Exacerbations. Data From the Spanish Registry of Bronchiectasis (RIBRON). Arch. Bronconeumol. 2021, 57, 21–27. [Google Scholar] [CrossRef]
- Von Elm, E.; Altman, D.G.; Egger, M.; Pocock, S.J.; Gøtzsche, P.C.; Vandenbroucke, J.P. The Strengthening the Reporting of Observational Studies in Epidemiology (STROBE) statement: Guidelines for reporting observational studies. J. Clin. Epidemiol. 2008, 61, 344–349. [Google Scholar] [CrossRef] [Green Version]
- Chalmers, J.D.; Chang, A.B.; Chotirmall, S.H.; Dhar, R.; McShane, P.J. Bronchiectasis. Nat. Rev. Dis. Prim. 2018, 4, 45. [Google Scholar] [CrossRef] [PubMed]
- Martínez-García, M.Á.; Máiz, L.; Olveira, C.; Girón, R.M.; de la Rosa, D.; Blanco, M.; Cantón, R.; Vendrell, M.; Polverino, E.; de Gracia, J.; et al. Spanish Guidelines on the Evaluation and Diagnosis of Bronchiectasis in Adults. Arch. Bronconeumol. 2018, 54, 79–87. [Google Scholar] [CrossRef]
- Polverino, E.; Goeminne, P.C.; McDonnell, M.J.; Aliberti, S.; Marshall, S.E.; Loebinger, M.R.; Murris, M.; Cantón, R.; Torres, A.; Dimakou, K.; et al. European Respiratory Society guidelines for the management of adult bronchiectasis. Eur. Respir. J. 2017, 50, 1700629. [Google Scholar] [CrossRef] [PubMed]
- Aliberti, S.; Masefield, S.; Polverino, E.; De Soyza, A.; Loebinger, M.R.; Menendez, R.; Ringshausen, F.C.; Vendrell, M.; Powell, P.; Chalmers, J.D. Research priorities in bronchiectasis: A consensus statement from the EMBARC Clinical Research Collaboration. Eur. Respir. J. 2016, 48, 632–647. [Google Scholar] [CrossRef] [PubMed] [Green Version]
- Shrestha, B.; Dunn, L. The Declaration of Helsinki on Medical Research involving Human Subjects: A Review of Seventh Revision. J. Nepal Health Res. Counc. 2020, 17, 548–552. [Google Scholar] [CrossRef]
- Martinez-Garcia, M.A.; de Gracia, J.; Vendrell Relat, M.; Giron, R.-M.; Maiz Carro, L.; de la Rosa Carrillo, D.; Olveira, C. Multidimensional approach to non-cystic fibrosis bronchiectasis: The FACED score. Eur. Respir. J. 2014, 43, 1357–1367. [Google Scholar] [CrossRef]
- Martinez-Garcia, M.A.; Athanazio, R.A.; Girón, R.M.; Máiz-Carro, L.; de la Rosa, D.; Olveira, C.; de Gracia, J.; Vendrell, M.; Prados-Sánchez, C.; Gramblicka, G.; et al. Predicting high risk of exacerbations in bronchiectasis: The E-FACED score. Int. J. Chron. Obstruct. Pulmon. Dis. 2017, 12, 275–284. [Google Scholar] [CrossRef] [PubMed] [Green Version]
- Chalmers, J.D.; Goeminne, P.; Aliberti, S.; McDonnell, M.J.; Lonni, S.; Davidson, J.; Poppelwell, L.; Salih, W.; Pesci, A.; Dupont, L.J.; et al. The bronchiectasis severity index an international derivation and validation study. Am. J. Respir. Crit. Care Med. 2014, 189, 576–585. [Google Scholar] [CrossRef] [PubMed]
- Pedregosa, F.; Michel, V.; Grisel, O.; Blondel, M.; Prettenhofer, P.; Weiss, R.; Vanderplas, J.; Cournapeau, D.; Pedregosa, F.; Varoquaux, G.; et al. Scikit-learn: Machine Learning in Python. J. Mach. Learn. Res. 2011, 12, 2825–2830. [Google Scholar]
- McInnes, L.; Healy, J.; Melville, J. UMAP: Uniform Manifold Approximation and Projection for Dimension Reduction. arXiv 2018, arXiv:1802.03426. [Google Scholar]
- Angrill, J.; Agustí, C.; de Celis, R.; Filella, X.; Rañó, A.N.A.; Elena, M.; de La Bellacasa, J.P.; Xaubet, A.; Torres, A. Bronchial Inflammation and Colonization in Patients with Clinically Stable Bronchiectasis. Am. J. Respir. Crit. Care Med. 2001, 164, 1628–1632. [Google Scholar] [CrossRef]
- Monsó, E. Look at the wood and not at the tree: The Microbiome in Chronic Obstructive Lung Disease and Cystic Fibrosis. Arch. Bronconeumol. 2020, 56, 5–6. [Google Scholar] [CrossRef]
- Martínez-Garćia, M.A.; Vendrell, M.; Girón, R.; Máiz-Carro, L.; De La Rosa Carrillo, D.; De Gracia, J.; Olveira, C. The multiple faces of non-cystic fibrosis bronchiectasis a cluster analysis approach. Ann. Am. Thorac. Soc. 2016, 13, 1468–1475. [Google Scholar] [CrossRef]
- Perea, L.; Cantó, E.; Suarez-Cuartin, G.; Aliberti, S.; Chalmers, J.D.; Sibila, O.; Vidal, S. A Cluster Analysis of Bronchiectasis Patients Based on the Airway Immune Profile. Chest 2021, 159, 1758–1767. [Google Scholar] [CrossRef]
- De Camargo, A.A.; de Castro, R.A.S.; Vieira, R.P.; Oliveira-Júnior, M.C.; de Araujo, A.A.; De Angelis, K.; Rached, S.Z.; Athanazio, R.A.; Stelmach, R.; Corso, S.D.; et al. Systemic Inflammation and Oxidative Stress in Adults with Bronchiectasis: Association with Clinical and Functional Features. Clinics 2021, 76, e2474. [Google Scholar] [CrossRef]
- Martínez-García, M.Á.; Perpiñá-Tordera, M.; Román-Sánchez, P.; Soler-Cataluña, J.J.; Carratalá, A.; Yago, M.; José Pastor, M. Association Between Bronchiectasis, Systemic Inflammation, and Tumor Necrosis Factor α. Arch. Bronconeumol. 2008, 44, 8–14. [Google Scholar] [CrossRef] [PubMed]
- Qin, L.; Guitart, M.; Admetlló, M.; Esteban-Cucó, S.; Maiques, J.M.; Xia, Y.; Zha, J.; Carbullanca, S.; Duran, X.; Wang, X.; et al. Do Redox Balance and Inflammatory Events Take Place in Mild Bronchiectasis? A Hint to Clinical Implications. J. Clin. Med. 2021, 10, 4534. [Google Scholar] [CrossRef] [PubMed]


| Cluster | Size | Average EFACED | Disease Severity | Summary of the Size | |
|---|---|---|---|---|---|
| 1 | 367 | 2.60 | moderate | N = 242 | Cluster # 1: mild |
| 2 | 311 | 3.57 | severe | N = 515 | Cluster # 2: moderate |
| 3 | 24 | 3.67 | severe | N = 335 | Cluster # 3: severe |
| 4 | 148 | 2.88 | moderate | ||
| 5 | 242 | 2.13 | mild | ||
| Cluster | Cluster | Cluster | |
|---|---|---|---|
| Group # 1 | Group # 2 | Group # 3 | |
| N = 242 | N = 515 | N = 335 | |
| Anthropometric variables, (SD) | |||
| Age, years | 65.8 (14.9) | 66.8 (15.1) | 69.4 (14.7) *§ |
| BMI, kg/m2 | 25.1 (4.6) | 26.1 (5.0) * | 25.8 (5.3) |
| Female, N/male, N | 184/58 | 330/185 | 213/122 |
| Disease severity, (SD) | |||
| FACED score | 1.64 (1.44) | 2.05 (1.64) ** | 2.61 (1.82) ***§§§ |
| EFACED score | 2.13 (1.91) | 2.68 (2.08) ** | 3.58 (2.33) ***§§§ |
| BSI score | 6.48 (4.32) | 7.54 (4.54) * | 9.31 (4.94) ***§§§ |
| Exacerbations (mild/moderate) | 1.33 (1.62) | 1.57 (1.7) | 1.72 (1.64) * |
| Hospitalization for exacerbations | 0.37 (0.79) | 0.65 (1.53) * | 0.99 (1.44) ***§§ |
| Charlson Index | 1.58 (1.27) | 1.89 (1.63) * | 2.12 (1.69) ***§ |
| Chronic colonization by PA, N (%) | 46 (19) | 135 (26.2) * | 109 (32.5) *** |
| Radiological extension | 2.8 (1.4) | 2.9 (1.4) | 2.9 (1.5) |
| COPD | 18 (7.4%) | 54 (10.5%) | 49 (14.6%) ** |
| Asthma | 29 (12%) | 45 (8.7%) | 31 (9.3%) |
| Smoking history | |||
| Never smokers, N (%) | 149 (62) | 313 (61) | 193 (57.6) |
| Current smokers, N (%) | 19 (8) | 46 (9) | 26 (8) |
| Ex-smokers, N (%) | 74 (31) | 156 (30) | 116 (35) |
| Packs-year, (SD) | 10.4 (20.7) | 12.2 (22.3) | 15.1 (25.5) § |
| Lung function, (SD) | |||
| FEV1, % predicted | 81 (24) | 75 (24) ** | 67 (26) ***§§§ |
| FVC, % predicted | 88 (20) | 86 (21) | 81 (24) ***§§ |
| FEV1/FVC, % | 72 (12) | 68 (12) ** | 65 (14) ***§§§ |
| DLCO, % predicted | 85 (17) | 88 (25) | 69 (21) ***§§§ |
| KCO, % predicted | 79 (31) | 81 (40) | 68 (37) § |
| RV, % predicted | 139 (43) | 135 (49) | 144 (54) |
| TLC, % predicted | 105 (18) | 101 (19) | 99 (22) |
| RV/TLC, % | 50 (12) | 49 (11) | 53 (13) § |
| Cluster | Cluster | Cluster | |
|---|---|---|---|
| Group # 1 | Group # 2 | Group # 3 | |
| N = 224 | N = 461 | N = 286 | |
| Anthropometric variables, (SD) | |||
| Age, years | 64.9 (14.9) | 65.7 (15.3) | 68.1 (15) * |
| BMI, kg/m2 | 25.2 (4.7) | 25.9 (5.0) | 25.8 (5.4) |
| Female, N/male, N | 178/46 | 313/148 | 203/83 |
| Disease severity | |||
| FACED score | 1.54 (1.38) | 1.94 (1.58) ** | 2.38 (1.70) ***§§ |
| EFACED score | 2 (1.81) | 2.54 (1.99) ** | 3.24 (2.18) ***§§§ |
| BSI score | 6.17 (4.05) | 7.25 (4.45) ** | 8.58 (4.65) ***§§§ |
| Exacerbations (mild/moderate) | 1.3 (1.63) | 1.57 (1.72) | 1.61 (1.62) |
| Hospitalization for exacerbations | 0.32 (0.68) | 0.6 (1.49) * | 0.89 (1.47) ***§ |
| Charlson Index | 1.55 (1.26) | 1.81 (1.56) | 2.02 (1.69) ** |
| Chronic colonization by PA, N (%) | 42 (18.8) | 127 (27.5) * | 88 (30.8) ***§ |
| Radiological extension | 2.8 (1.4) | 2.9 (1.4) | 3 (1.5) |
| Smoking history | |||
| Never smokers, N (%) | 146 (65.2) | 309 (67) | 192 (67.1) |
| Current smokers, N (%) | 16 (7.1) | 36 (7.8) | 16 (5.6) |
| Ex-smokers, N (%) | 62 (27.7) | 116 (25.2) | 78 (27.3) |
| Packs-year, (SD) | 7.85 (16.27) | 8.13 (17.61) | 8.82 (17.34) |
| Lung function, (SD) | |||
| FEV1, % predicted | 86 (20) | 78 (21) ** | 73 (23) ***§§ |
| FVC, % predicted | 92 (38) | 88 (23) | 85 (31) ***§ |
| FEV1/FVC, % | 74 (30) | 71 (23) ** | 69 (27) ***§ |
| DLCO, % predicted | 90 (40) | 93 (30) | 77 (20) **§§§ |
| KCO, % predicted | 87 (1) | 87 (1) | 80 (1) |
| RV, % predicted | 143 (74) | 141 (41) | 153 (36) |
| TLC, % predicted | 108 (58) | 103 (48) | 101 (48) * |
| RV/TLC, % | 53 (31) | 50 (23) | 57 (29) § |
| Cluster | Cluster | Cluster | |
|---|---|---|---|
| Group # 1 | Group # 2 | Group # 3 | |
| N = 242 | N = 515 | N = 335 | |
| Female, N/male, N | 184/58 | 330/185 | 213/122 |
| Blood parameters, (SD) | |||
| Total leukocytes, ×103/μL | 6.2 (1.8) | 7.2 (2.1) *** | 9.2 (3.5) ***§§§ |
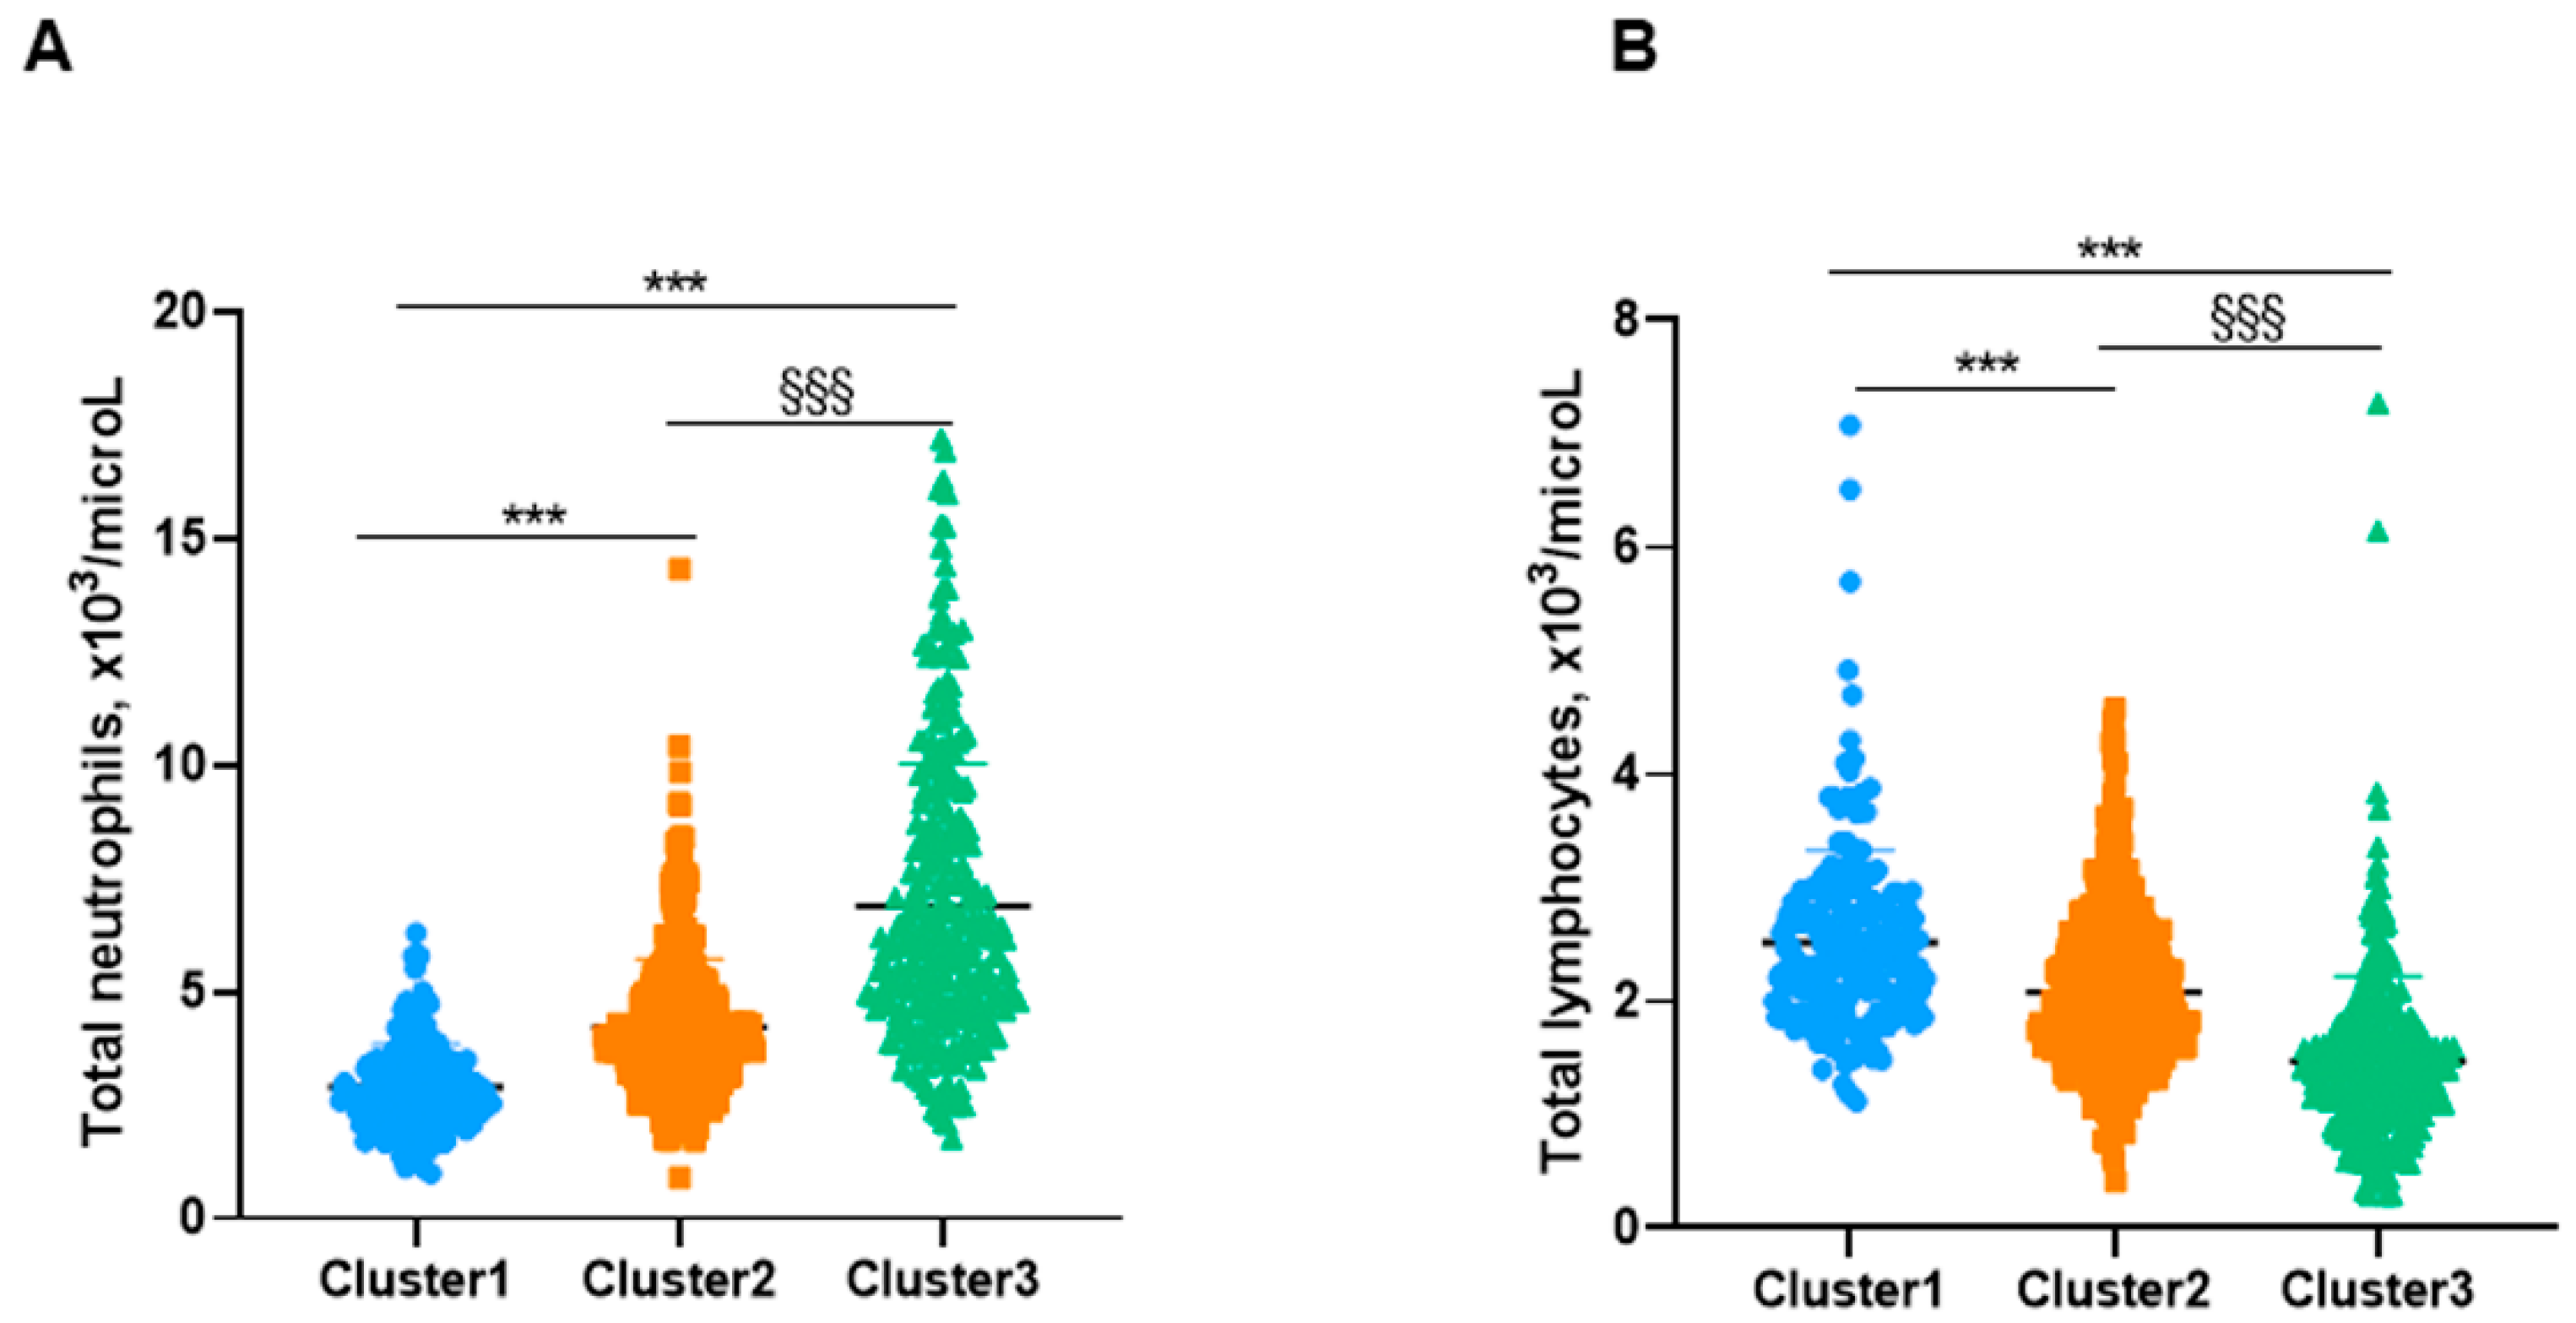
| Total neutrophils, ×103/μL | 2.9 (0.9) | 4.2 (1.5) *** | 6.9 (3.1) ***§§§ |
| Neutrophils, % | 46.6 (6.7) | 58 (6.4) *** | 73.3 (8.3) ***§§§ |
| Total lymphocytes, ×103/μL | 2.5 (0.8) | 2.1 (0.7) *** | 1.5 (0.8) ***§§§ |
| Lymphocytes, % | 41 (6.2) | 29.4 (5.8) *** | 16.9 (6.7) ***§§§ |
| Total eosinophils, ×103/μL | 0.2 (0.1) | 0.3 (0.2) *** | 0.1 (0.1) §§§ |
| Eosinophils, % | 2.6 (1.3) | 3.5 (2.9) *** | 1.6 (1.5) ***§§§ |
| Platelets, ×103/μL | 245.8 (68) | 250.7 (70.5) | 264.1 (86.7) *§ |
| CRP, mg/dL | 2 (4.2) | 1.8 (2.8) | 7.3 (11.4) ***§§§ |
| ESR, mm/h | 15.9 (13.5) | 15 (14.1) | 25.9 (22.2) ***§§§ |
| Fibrinogen, mg/dL | 388.1 (109.7) | 414 (125.3) | 482 (153.8) ***§§§ |
| Hemoglobin, g/dL | 13.7 (1.1) | 13.9 (1.6) | 13.2 (1.6) **§§§ |
| Hematocrit, % | 41.6 (3.2) | 42.3 (4.5) | 40.4 (4.7) **§§§ |
| Glucose, mg/dL | 94.2 (16) | 97.9 (27) | 110.8 (46.9) ***§§§ |
| Creatinine, mg/dL | 0.8 (0.5) | 0.8 (0.2) | 0.9 (0.6) § |
| Total proteins, g/dL | 7.13 (0.54) | 7.01 (0.62) | 6.96 (0.66) * |
| Albumin, g/dL | 4.27 (0.36) | 4.22 (0.43) | 4.11 (0.49) **§ |
| Cluster | Cluster | Cluster | |
|---|---|---|---|
| Group # 1 | Group # 2 | Group # 3 | |
| N = 224 | N = 461 | N = 286 | |
| Female, N/male, N | 178/46 | 313/148 | 203/83 |
| Blood parameters, (SD) | |||
| Total leukocytes, ×103/μL | 6.12 (1.73) | 7.09 (2.16) *** | 8.95 (3.34) ***§§§ |
| Total neutrophils, ×103/μL | 2.86 (0.93) | 4.17 (1.51) *** | 6.68 (2.99) ***§§§ |
| Neutrophils, % | 46.5 (6.7) | 57.84 (6.45) *** | 72.9 (8.1) ***§§§ |
| Total lymphocytes, ×103/μL | 2.5 (0.81) | 2.07 (0.66) *** | 1.49 (0.77 )***§§§ |
| Lymphocytes, % | 41.14 (6.17) | 29.5 (5.84) *** | 17.34 (6.64) ***§§§ |
| Total eosinophils, ×103/μL | 0.16 (0.08) | 0.26 (0.23) | 0.13 (0.12) |
| Eosinophils, % | 2.62 (1.35) | 3.56 (2.92) *** | 1.65 (1.47) ***§§§ |
| Platelets, ×103/μL | 246 (68) | 252 (70) | 267 (88) **§ |
| CRP, mg/dL | 1.89 (3.95) | 1.78 (2.75) | 7.09 (10.91) ***§§§ |
| ESR, mm/h | 15.82 (13.68) | 15.31 (13.75) | 25.8 (22.39) ***§§§ |
| Fibrinogen, mg/dL | 388 (112) | 412 (127) | 474 (154) ***§§§ |
| Hemoglobin, g/dL | 13.67 (1.04) | 13.82 (1.55) | 13.14 (1.54) ***§§§ |
| Hematocrit, % | 41.54 (3.1) | 42.08 (4.32) | 40.17 (4.48) **§§§ |
| Glucose, mg/dL | 95 (16) | 97 (26) | 108 (46) ***§§§ |
| Creatinine, mg/dL | 0.79 (0.56) | 0.8 (0.22) | 0.89 (0.61)§ |
| Total proteins, g/dL | 7.13 (0.54) | 7.03 (0.61) | 7.03 (0.6) |
| Albumin, g/dL | 4.27 (0.37) | 4.24 (0.42) | 4.17 (0.44) |
Publisher’s Note: MDPI stays neutral with regard to jurisdictional claims in published maps and institutional affiliations. |
© 2022 by the authors. Licensee MDPI, Basel, Switzerland. This article is an open access article distributed under the terms and conditions of the Creative Commons Attribution (CC BY) license (https://creativecommons.org/licenses/by/4.0/).
Share and Cite
Wang, X.; Villa, C.; Dobarganes, Y.; Olveira, C.; Girón, R.; García-Clemente, M.; Máiz, L.; Sibila, O.; Golpe, R.; Menéndez, R.; et al. Systemic Inflammatory Biomarkers Define Specific Clusters in Patients with Bronchiectasis: A Large-Cohort Study. Biomedicines 2022, 10, 225. https://0-doi-org.brum.beds.ac.uk/10.3390/biomedicines10020225
Wang X, Villa C, Dobarganes Y, Olveira C, Girón R, García-Clemente M, Máiz L, Sibila O, Golpe R, Menéndez R, et al. Systemic Inflammatory Biomarkers Define Specific Clusters in Patients with Bronchiectasis: A Large-Cohort Study. Biomedicines. 2022; 10(2):225. https://0-doi-org.brum.beds.ac.uk/10.3390/biomedicines10020225
Chicago/Turabian StyleWang, Xuejie, Carmen Villa, Yadira Dobarganes, Casilda Olveira, Rosa Girón, Marta García-Clemente, Luis Máiz, Oriol Sibila, Rafael Golpe, Rosario Menéndez, and et al. 2022. "Systemic Inflammatory Biomarkers Define Specific Clusters in Patients with Bronchiectasis: A Large-Cohort Study" Biomedicines 10, no. 2: 225. https://0-doi-org.brum.beds.ac.uk/10.3390/biomedicines10020225