
SERS Liquid Biopsy Profiling of Serum for the Diagnosis of Kidney Cancer

 , , ,
, , ,
Abstract
:1. Introduction
2. Materials and Methods
2.1. Patients
2.2. Sample Collection
2.3. SERS Profiling
2.4. Statistical Analysis
3. Results
4. Discussion
5. Conclusion
Supplementary Materials
Author Contributions
Funding
Institutional Review Board Statement
Informed Consent Statement
Data Availability Statement
Acknowledgments
Conflicts of Interest
References
- Ferlay, J.; Colombet, M.; Soerjomataram, I.; Dyba, T.; Randi, G.; Bettio, M.; Gavin, A.; Visser, O.; Bray, F. Cancer incidence and mortality patterns in Europe: Estimates for 40 countries and 25 major cancers in 2018. Eur. J. Cancer 2018, 103, 356–387. [Google Scholar] [CrossRef] [PubMed]
- Capitanio, U.; Bensalah, K.; Bex, A.; Boorjian, S.A.; Bray, F.; Coleman, J.; Gore, J.L.; Sun, M.; Wood, C.; Russo, P. Epidemiology of Renal Cell Carcinoma. Eur. Urol. 2019, 75, 74–84. [Google Scholar] [CrossRef] [PubMed]
- Capitanio, U.; Montorsi, F. Renal cancer. Lancet 2016, 387, 894–906. [Google Scholar] [CrossRef]
- Choueiri, T.K.; Motzer, R.J. Systemic Therapy for Metastatic Renal-Cell Carcinoma. N. Engl. J. Med. 2017, 376, 152–162. [Google Scholar] [CrossRef] [PubMed]
- Rossi, S.H.; Klatte, T.; Usher-Smith, J.; Stewart, G.D. Epidemiology and screening for renal cancer. World J. Urol. 2018, 36, 1341. [Google Scholar] [CrossRef] [PubMed] [Green Version]
- Vasudev, N.S.; Wilson, M.; Stewart, G.D.; Adeyoju, A.; Cartledge, J.; Kimuli, M.; Datta, S.; Hanbury, D.; Hrouda, D.; Oades, G.; et al. Challenges of early renal cancer detection: Symptom patterns and incidental diagnosis rate in a multicentre prospective UK cohort of patients presenting with suspected renal cancer. BMJ Open 2020, 10, e035938. [Google Scholar] [CrossRef]
- Beinfeld, M.T.; Wittenberg, E.; Gazelle, G.S. Cost-effectiveness of Whole-Body CT Screening. Radiology 2005, 234, 415–422. [Google Scholar] [CrossRef]
- Jamis-Dow, C.A.; Choyke, P.L.; Jennings, S.B.; Linehan, W.M.; Thakore, K.N.; Walther, M.M. Small (<or = 3-cm) renal masses: Detection with CT versus US and pathologic correlation. Radiology 1996, 198, 785–788. [Google Scholar] [PubMed]
- Ljungberg, B.; Albiges, L.; Abu-Ghanem, Y.; Bensalah, K.; Dabestani, S.; Fernandez-Pello, S.; Giles, R.H.; Hofmann, F.; Hora, M.; Kuczyk, M.A.; et al. European Association of Urology Guidelines on Renal Cell Carcinoma: The 2019 Update. Eur. Urol. 2019, 75, 799–810. [Google Scholar] [CrossRef] [PubMed]
- Pastore, A.L.; Palleschi, G.; Silvestri, L.; Moschese, D.; Ricci, S.; Petrozza, V.; Carbone, A.; Di Carlo, A. Serum and Urine Biomarkers for Human Renal Cell Carcinoma. Dis. Markers 2015, 2015, 251403. [Google Scholar] [CrossRef] [Green Version]
- Sequeira, J.P.; Constâncio, V.; Lobo, J.; Henrique, R.; Jerónimo, C. Unveiling the World of Circulating and Exosomal microRNAs in Renal Cell Carcinoma. Cancers 2021, 13, 5252. [Google Scholar] [CrossRef]
- Bell, S.E.J.; Charron, G.; Cortés, E.; Kneipp, J.; De La Chapelle, M.L.; Langer, J.; Procházka, M.; Tran, V.; Schlücker, S. Towards Reliable and Quantitative Surface-Enhanced Raman Scattering (SERS): From Key Parameters to Good Analytical Practice. Angew. Chem. Int. Ed. Engl. 2020, 59, 5454–5462. [Google Scholar] [CrossRef] [Green Version]
- Opilik, L.; Schmid, T.; Zenobi, R. Modern Raman Imaging: Vibrational Spectroscopy on the Micrometer and Nanometer Scales. Annu. Rev. Anal. Chem. 2013, 6, 379–398. [Google Scholar] [CrossRef]
- Avram, L.; Iancu, S.D.; Stefancu, A.; Moisoiu, V.; Colnita, A.; Marconi, D.; Donca, V.; Buzdugan, E.; Craciun, R.; Leopold, N.; et al. SERS-Based Liquid Biopsy of Gastrointestinal Tumors Using a Portable Raman Device Operating in a Clinical Environment. J. Clin. Med. 2020, 9, 212. [Google Scholar] [CrossRef] [PubMed] [Green Version]
- Moisoiu, V.; Stefancu, A.; Gulei, D.; Boitor, R.; Magdo, L.; Raduly, L.; Pasca, S.; Kubelac, P.; Mehterov, N.; Chis, V.; et al. SERS-based differential diagnosis between multiple solid malignancies: Breast, colorectal, lung, ovarian and oral cancer. Int. J. Nanomed. 2019, 14, 6165–6178. [Google Scholar] [CrossRef] [PubMed] [Green Version]
- Stefancu, A.; Moisoiu, V.; Couti, R.; Andras, I.; Rahota, R.; Crisan, D.; Pavel, I.E.; Socaciu, C.; Leopold, N.; Crisan, N. Combining SERS analysis of serum with PSA levels for improving the detection of prostate cancer. Nanomedicine 2018, 13, 2455–2467. [Google Scholar] [CrossRef] [PubMed] [Green Version]
- Moisoiu, V.; Stefancu, A.; Iancu, S.D.; Moisoiu, T.; Loga, L.; Dican, L.; Alecsa, C.D.; Boros, I.; Jurj, A.; Dima, D.; et al. SERS assessment of the cancer-specific methylation pattern of genomic DNA: Towards the detection of acute myeloid leukemia in patients undergoing hematopoietic stem cell transplantation. Anal. Bioanal. Chem. 2019, 411, 7907–7913. [Google Scholar] [CrossRef]
- Edge, S.B.; Compton, C.C. The American Joint Committee on Cancer: The 7th Edition of the AJCC Cancer Staging Manual and the Future of TNM. Ann. Surg. Oncol. 2010, 17, 1471–1474. [Google Scholar] [CrossRef] [PubMed]
- Leopold, N.; Lendl, B. A New Method for Fast Preparation of Highly Surface-Enhanced Raman Scattering (SERS) Active Silver Colloids at Room Temperature by Reduction of Silver Nitrate with Hydroxylamine Hydrochloride. J. Phys. Chem. B 2003, 107, 5723–5727. [Google Scholar] [CrossRef]
- Toplak, M.; Read, S.; Borondics; Levandoski, J.E.; Solheim, J.; Oroue. Quasars/orange-spectroscopy: Release 0.6.0 (0.6.0). 2021. [Google Scholar] [CrossRef]
- Bonifacio, A.; Dalla Marta, S.; Spizzo, R.; Cervo, S.; Steffan, A.; Colombatti, A.; Sergo, V. Surface-enhanced Raman spectroscopy of blood plasma and serum using Ag and Au nanoparticles: A systematic study. Anal. Bioanal. Chem. 2014, 406, 2355–2365. [Google Scholar] [CrossRef]
- Westley, C.; Xu, Y.; Thilaganathan, B.; Carnell, A.J.; Turner, N.J.; Goodacre, R. Absolute Quantification of Uric Acid in Human Urine Using Surface Enhanced Raman Scattering with the Standard Addition Method. Anal. Chem. 2017, 89, 2472–2477. [Google Scholar] [CrossRef] [Green Version]
- Iancu, S.D.; Stefancu, A.; Moisoiu, V.; Leopold, L.F.; Leopold, N. The role of Ag+, Ca2+, Pb2+ and Al3+ adions in the SERS turn-on effect of anionic analytes. Beilstein J. Nanotechnol. 2019, 10, 2338–2345. [Google Scholar] [CrossRef] [Green Version]
- Gurian, E.; Giraudi, P.; Rosso, N.; Tiribelli, C.; Bonazza, D.; Zanconati, F.; Giuricin, M.; Palmisano, S.; de Manzini, N.; Sergo, V.; et al. Differentiation between stages of non-alcoholic fatty liver diseases using surface-enhanced Raman spectroscopy. Anal. Chim. Acta 2020, 1110, 190–198. [Google Scholar] [CrossRef]
- Phyo, J.B.; Woo, A.; Yu, H.J.; Lim, K.; Cho, B.H.; Jung, H.S.; Lee, M.Y. Label-Free SERS Analysis of Urine Using a 3D-Stacked AgNW-Glass Fiber Filter Sensor for the Diagnosis of Pancreatic Cancer and Prostate Cancer. Anal. Chem. 2021, 93, 3778–3785. [Google Scholar] [CrossRef] [PubMed]
- Fini, M.A.; Elias, A.; Johnson, R.J.; Wright, R.M. Contribution of uric acid to cancer risk, recurrence, and mortality. Clin. Transl. Med. 2012, 1, 16. [Google Scholar] [CrossRef] [PubMed] [Green Version]
- Dai, X.Y.; He, Q.S.; Jing, Z.; Yuan, J.Q. Serum uric acid levels and risk of kidney cancer incidence and mortality: A prospective cohort study. Cancer Med. 2020, 9, 5655–5661. [Google Scholar] [CrossRef] [PubMed]
- Monteiro, M.S.; Barros, A.S.; Pinto, J.; Carvalho, M.; Pires-Luís, A.S.; Henrique, R.; Jeronimo, C.; Bastos, M.D.L.; Gil, A.M.; de Pinho, P.G. Nuclear Magnetic Resonance metabolomics reveals an excretory metabolic signature of renal cell carcinoma. Sci. Rep. 2016, 6, 37275. [Google Scholar] [CrossRef] [Green Version]
- Battelli, M.G.; Polito, L.; Bortolotti, M.; Bolognesi, A. Xanthine oxidoreductase in cancer: More than a differentiation marker. Cancer Med. 2016, 5, 546–557. [Google Scholar] [CrossRef]
- Johnson, E.J. The Role of Carotenoids in Human Health. Nutr. Clin. Care 2002, 5, 56–65. [Google Scholar] [CrossRef] [PubMed]
- Aune, D.; Keum, N.N.; Giovannucci, E.; Fadnes, L.T.; Boffetta, P.; Greenwood, D.C.; Tonstad, S.; Vatten, L.J.; Riboli, E.; Norat, T. Dietary intake and blood concentrations of antioxidants and the risk of cardiovascular disease, total cancer, and all-cause mortality: A systematic review and dose-response meta-analysis of prospective studies. Am. J. Clin. Nutr. 2018, 108, 1069–1091. [Google Scholar] [CrossRef]
- Lee, J.E.; Männistö, S.; Spiegelman, D.; Hunter, D.J.; Bernstein, L.; Brandt, P.A.V.D.; Buring, J.E.; Cho, E.; English, D.R.; Flood, A.; et al. Intakes of Fruit, Vegetables, and Carotenoids and Renal Cell Cancer Risk: A Pooled Analysis of 13 Prospective Studies. Cancer Epidemiol. Biomark. Prev. 2009, 18, 1730–1739. [Google Scholar] [CrossRef] [PubMed] [Green Version]
- Jin, H.; He, X.; Zhou, H.; Zhang, M.; Tang, Q.; Lin, L.; Hao, J.; Zeng, R. Efficacy of raman spectroscopy in the diagnosis of kidney cancer: A systematic review and meta-analysis. Medicine 2020, 99, e20933. [Google Scholar] [CrossRef] [PubMed]
- Scelo, G.; Muller, D.C.; Riboli, E.; Johansson, M.; Cross, A.J.; Vineis, P.; Tsilidis, K.K.; Brennan, P.; Boeing, H.; Peeters, P.H.; et al. KIM-1 as a Blood-Based Marker for Early Detection of Kidney Cancer: A Prospective Nested Case–Control Study. Clin. Cancer Res. 2018, 24, 5594–5601. [Google Scholar] [CrossRef] [PubMed] [Green Version]
- Altman, D.G.; McShane, L.M.; Sauerbrei, W.; Taube, S.E. Reporting Recommendations for Tumor Marker Prognostic Studies (REMARK): Explanation and Elaboration. PLOS Med. 2012, 9, e1001216. [Google Scholar] [CrossRef] [Green Version]
- Schwarze, V.; Rübenthaler, J.; Čečatka, S.; Marschner, C.; Froelich, M.F.; Sabel, B.O.; Staehler, M.; Knösel, T.; Geyer, T.; Clevert, D.A. Contrast-Enhanced Ultrasound (CEUS) for the Evaluation of Bosniak III Complex Renal Cystic Lesions—A 10-Year Specialized European Single-Center Experience with Histopathological Validation. Medicina 2020, 56, 692. [Google Scholar] [CrossRef]


| Metabolite | SERS Band Assignment (cm−1) |
|---|---|
| Uric acid | 534, 590, 638, 811, 890, 1130, 1204, 1260, 1357, 1560, 1684 |
| Hypoxanthine | 725, 1450, 1684 |
| Xanthine | 1357, 1684 |
| Carotenoids | 1155, 1520 |
| Methanol | 1015 |
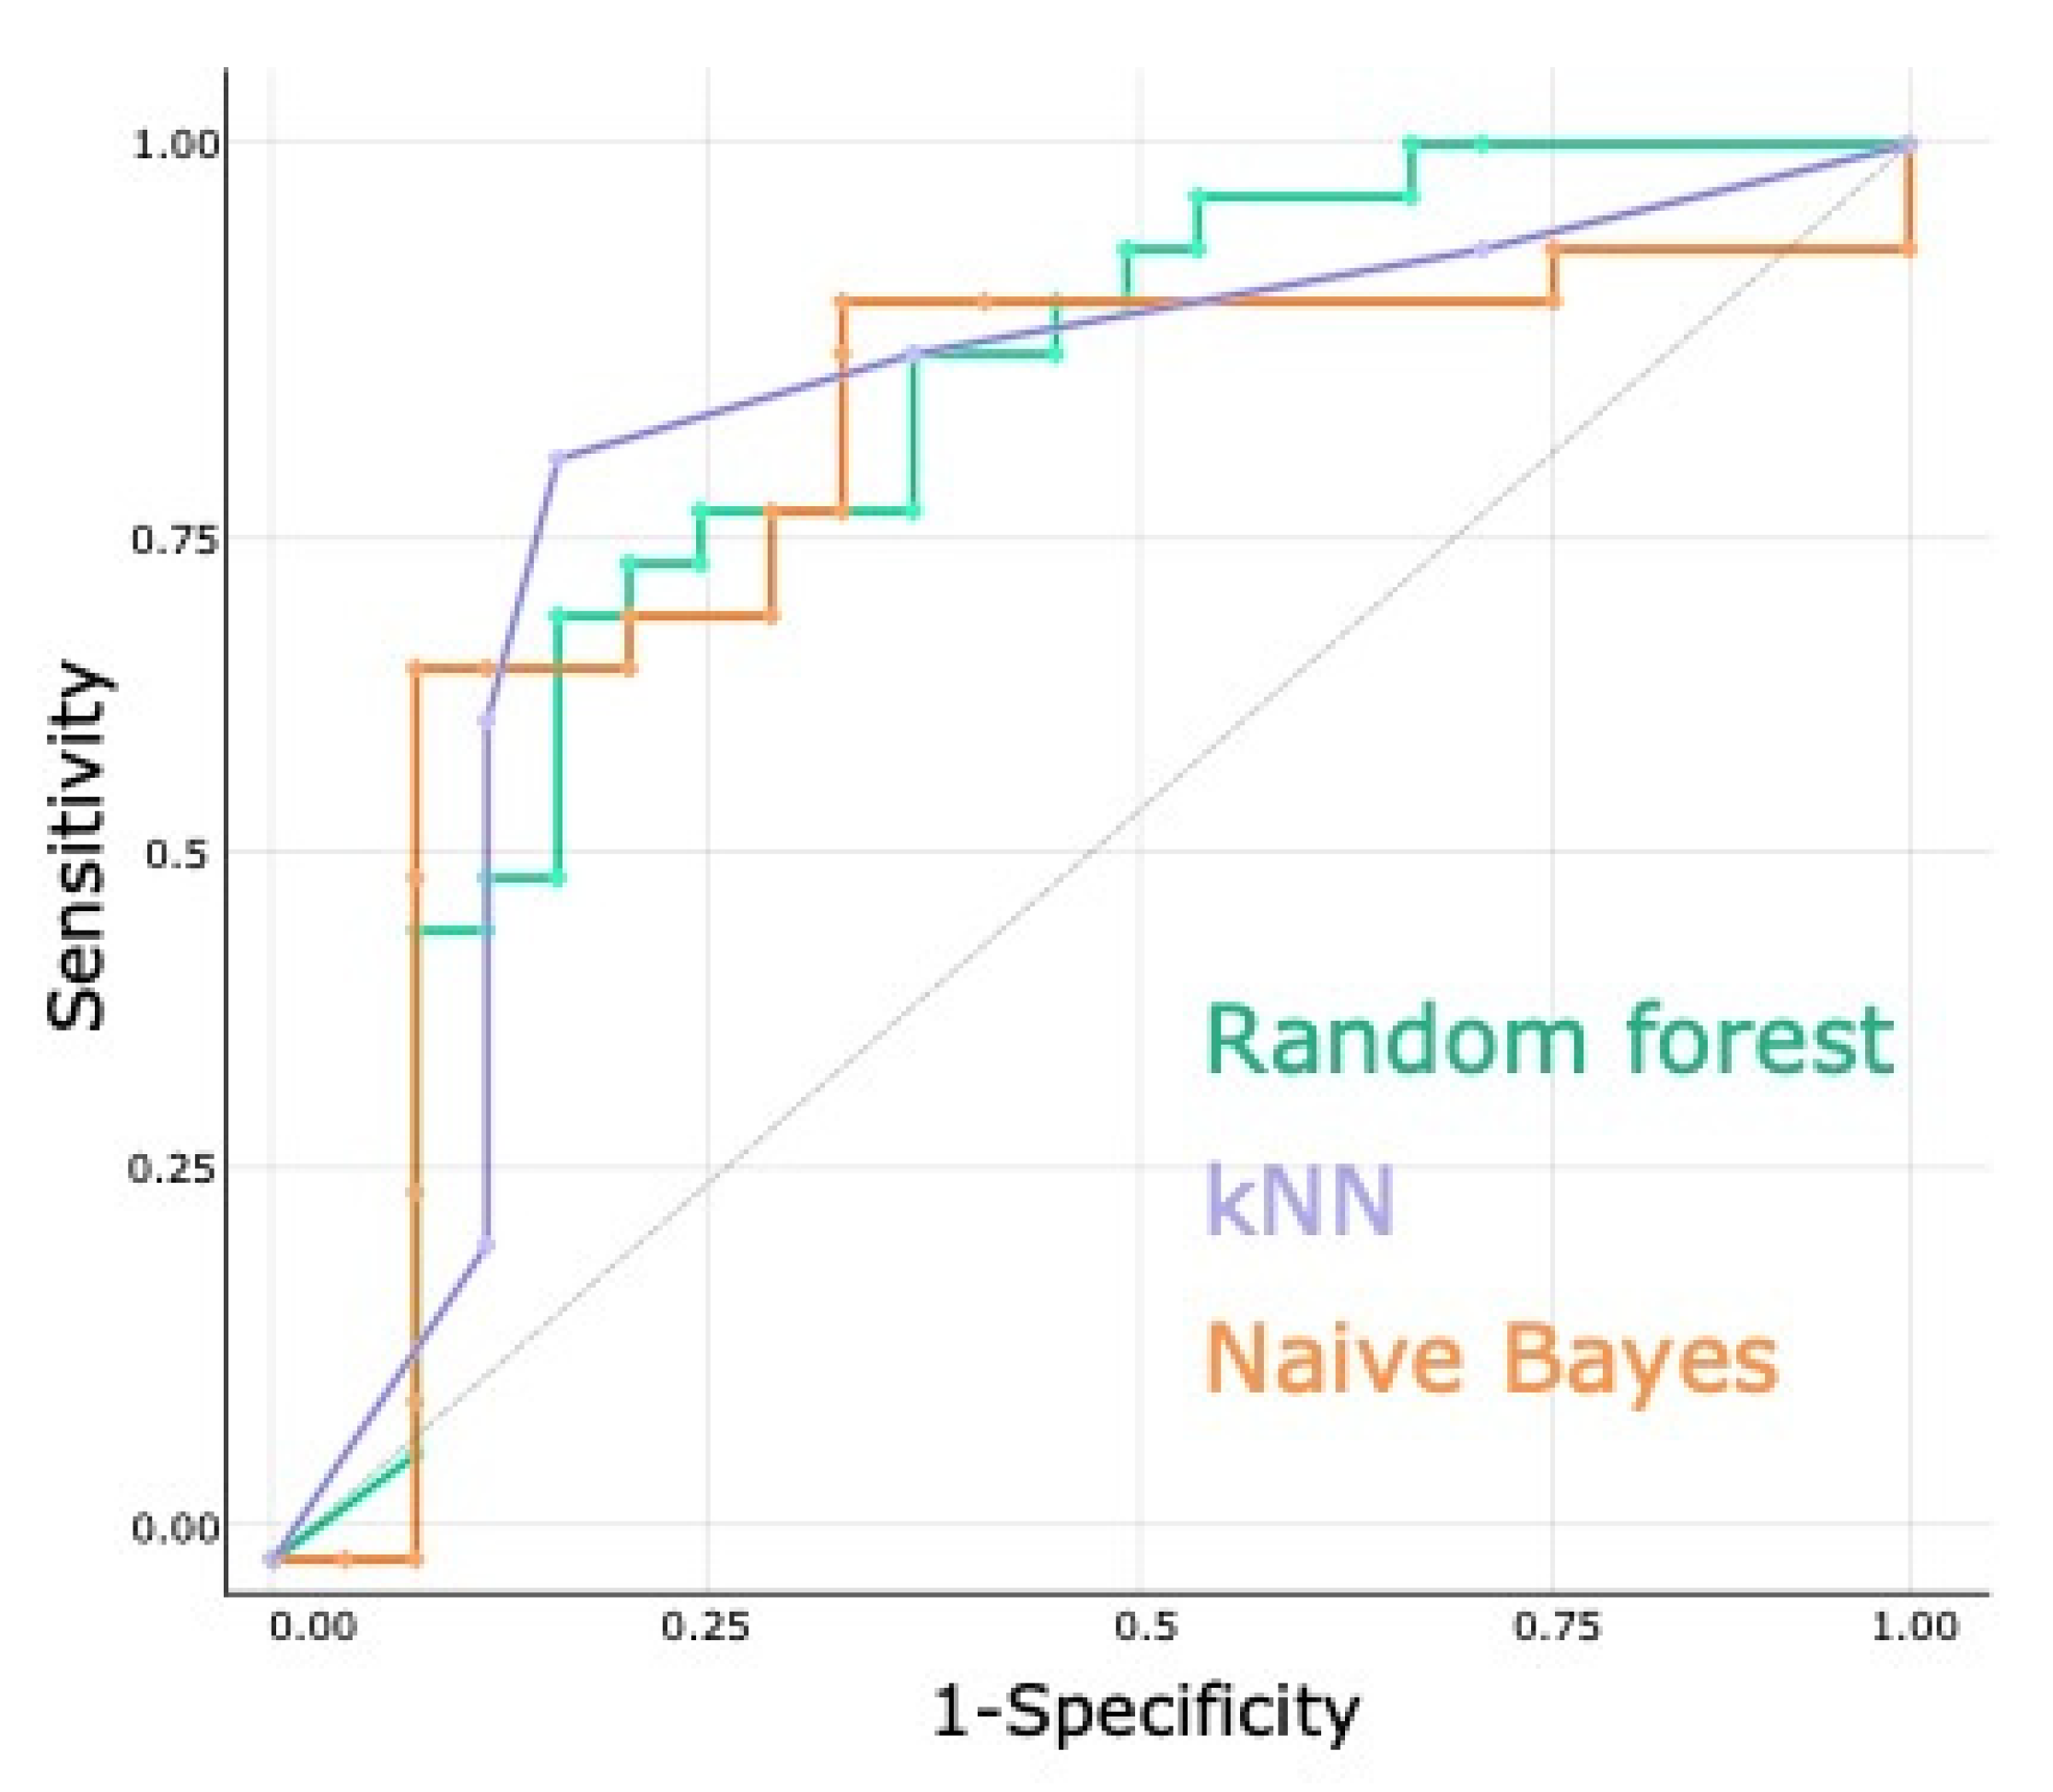
| Machine Learning Model | AUC | CA | F1 | Precision | Recall |
|---|---|---|---|---|---|
| Random forest | 0.78 | 0.72 | 0.71 | 0.72 | 0.72 |
| kNN | 0.78 | 0.80 | 0.80 | 0.80 | 0.80 |
| Naïve Bayes | 0.76 | 0.70 | 0.69 | 0.69 | 0.70 |
Publisher’s Note: MDPI stays neutral with regard to jurisdictional claims in published maps and institutional affiliations. |
© 2022 by the authors. Licensee MDPI, Basel, Switzerland. This article is an open access article distributed under the terms and conditions of the Creative Commons Attribution (CC BY) license (https://creativecommons.org/licenses/by/4.0/).
Share and Cite
Moisoiu, T.; Iancu, S.D.; Burghelea, D.; Dragomir, M.P.; Iacob, G.; Stefancu, A.; Cozan, R.G.; Antal, O.; Bálint, Z.; Muntean, V.; et al. SERS Liquid Biopsy Profiling of Serum for the Diagnosis of Kidney Cancer. Biomedicines 2022, 10, 233. https://0-doi-org.brum.beds.ac.uk/10.3390/biomedicines10020233
Moisoiu T, Iancu SD, Burghelea D, Dragomir MP, Iacob G, Stefancu A, Cozan RG, Antal O, Bálint Z, Muntean V, et al. SERS Liquid Biopsy Profiling of Serum for the Diagnosis of Kidney Cancer. Biomedicines. 2022; 10(2):233. https://0-doi-org.brum.beds.ac.uk/10.3390/biomedicines10020233
Chicago/Turabian StyleMoisoiu, Tudor, Stefania D. Iancu, Dan Burghelea, Mihnea P. Dragomir, Gheorghita Iacob, Andrei Stefancu, Ramona G. Cozan, Oana Antal, Zoltán Bálint, Valentin Muntean, and et al. 2022. "SERS Liquid Biopsy Profiling of Serum for the Diagnosis of Kidney Cancer" Biomedicines 10, no. 2: 233. https://0-doi-org.brum.beds.ac.uk/10.3390/biomedicines10020233