Article

Quantitative Proteomics of Polarised Macrophages Derived from Induced Pluripotent Stem Cells

1
Division of Cell Signalling and Immunology, School of Life Sciences, University of Dundee, Dundee DD1 5EH, UK
2
Human Pluripotent Stem Cell Facility, School of Life Sciences, University of Dundee, Dow Street, Dundee DD1 5EH, UK
3
Division of Cancer Immunology and Immune Modulation, Boehringer Ingelheim Pharma GmbH & Co. KG, 88397 Biberach an der Riss, Germany
*
Author to whom correspondence should be addressed.
Submission received: 29 November 2021 / Revised: 19 January 2022 / Accepted: 20 January 2022 / Published: 23 January 2022

Abstract

:
Macrophages (MΦ) are highly heterogenous and versatile innate immune cells involved in homeostatic and immune responses. Activated MΦ can exist in two extreme phenotypes: pro-inflammatory (M1) MΦ and anti-inflammatory (M2) MΦ. These phenotypes can be recapitulated in vitro by using ligands of toll-like receptors (TLRs) and cytokines such as IFNγ and IL-4. In recent years, human induced pluripotent stem cells (iPSC)-derived MΦ have gained major attention, as they are functionally similar to human monocyte-derived MΦ and are receptive to genome editing. In this study, we polarised iPSC-derived MΦ to M1 or M2 and analysed their proteome and secretome profiles using quantitative proteomics. These comprehensive proteomic data sets provide new insights into functions of polarised MΦ.

1. Introduction

Macrophages (MΦ) are innate immune cells that have gained increasing attention in basic and biopharmaceutical research. They play crucial roles not only in homeostasis, immune regulation, and pathogen defence, but also in the pathogenesis of an increasing number of diseases. MΦ display remarkable plasticity and can exist in a broad spectrum of activation states in response to a plethora of internal and external stimuli. At the extreme ends of the spectrum are the ‘classically activated’ or proinflammatory (M1) MΦ and the ‘alternatively activated’ or anti-inflammatory (M2) MΦ, as described in the literature [1].
For human MΦ research, peripheral blood monocyte-derived MΦ (MDM) and monocytic cell lines are commonly used. However, there are limitations to the use of MDM due to donor-to-donor variability and restricted availability of donors. Also, MΦ derived from transformed monocytic cell lines are not able to completely recapitulate all aspects of MΦ physiology, as they exhibit limited plasticity and often carry unknown mutations [2,3]. More recently, iPSC-derived MΦ (iPSDM) have emerged as a valuable platform for the generation of unlimited numbers of MΦ that are functionally similar to MDM [4]. In addition, the genetic manipulation of iPSCs to knock out genes of interest has paved the way for a better understanding of MΦ biology and has provided a platform for testing drug concepts that interfere with MΦ function [5,6].
There are extensive transcriptomic data available that have provided valuable insights on the expression profiles of polarised MΦ and of specific cell surface markers. However, mRNA levels do not always correlate with protein abundance due to post-transcriptional processing, mRNA stability, and post-translational modifications. In addition, the MΦ secretome cannot be fully described by transcriptomics. Comprehensive proteomics is a powerful approach to gain important functional insights into the MΦ immune response to different stimuli [7]. Therefore, we determined changes in both cellular (proteome) and extracellular (secretome) responses of differentially polarised iPSDM using label-free quantitative proteomics. The resting MΦ (M0) that were polarised using toll-like receptor (TLR) ligand, lipopolysaccharide (LPS), and interferon gamma (IFNγ) are referred to as M1, while MΦ polarised using interleukin-4 (IL-4) are referred to as M2, for simplification [8]. We demonstrate that ~5% of proteins are expressed differentially between M1 and M2 and show that, by principal component analysis, M1 are more distinct from M0 than M2 are from M0. In addition, novel cell surface proteins preferentially expressed on polarized iPSDM were identified that had not previously been associated with MΦ polarisation. In order to investigate their potential as polarisation markers, their expression was validated by FACS using iPSDM and donor-derived MDM. Furthermore, our secretome analyses identified a large number of proteins released from differentially polarised iPSDM.

2. Materials and Methods

2.1. Antibodies and Reagents

RPMI medium, DPBS without Ca2+ and Mg2+, penicillin-streptomycin, Glutamax, microplate BCA protein assay, trypsin-EDTA, and TEAB were from Thermo Scientific, Waltham, MA, USA; trypsin protease-MS grade, sodium dodecyl sulphate, acetonitrile, HPLC-grade ethanol, and water were from Sigma, Dorset, UK; human Fc block and Alexa Fluor® anti-human CD300A Cat# 566342 were from BD Bioscience, Berkshire, UK; PE anti-human CD68 Cat# 130-118-486 was from Miltenyi Biotec, Surrey, UK; PE anti-human CD109 Cat# 323305, APC anti-human LILRB2 Cat# 338707, APC anti-human Siglec-10 Cat# 347606, APC anti-human CD206 Cat# 321109, APC anti-human CD80 Cat# 305219, APC anti-human CD86 Cat# 374208, PE/Cy7 anti-human CD14 Cat# 367112, and recombinant human M-CSF were from Biolegend, San Diego, CA, USA. X-VIVO15 Serum free medium Cat# BE02-060Q was from Lonza, Basel, Switzerland. Recombinant human BMP4 (Cat# 120-05), SCF (Cat# 300-07), VEGF (Cat# 100-20) and IL-3 (Cat# 200-03) were from Peprotech, London, UK. EmbryoMax® 0.1% Gelatin solution was from Millipore, London, UK. Y-27632 (Cat# 1254/10) was from Bio-Techne, Abingdon, UK.

2.2. Differentiation of iPSC Cells to MΦ

Wibj2 is an iPSC line established from fibroblasts of a 55-years old female [9]. These cells were provided by the HipSci consortium (www.hipsci.org, accessed on 27 November 2021) and maintained and quality controlled by the Human Pluripotent Stem Cell Facility (University of Dundee). The monocytic lineage differentiation protocol was adapted from Wilgenburg et al. [10] and Lopez-Yrigoyen et al. [11]. Briefly, Wibj2 iPSC cells were cultured in mTESR medium. At day 0, embryoid bodies (EBs) were generated by seeding 1 × 10⁴ cells per well in a 96-well Ultralow attachment V-bottomed wells in mTESR medium supplemented with SCF (20 ng/mL), VEGF (50 ng/mL), BMP4 (50 ng/mL), and Y-27632 (10 µM). The plate was centrifuged at 300× g for 5 min at room temperature. On day 4, EBs were harvested and seeded at 10 to 15 EBs per well in 0.1% gelatin-coated 6-well plates. EBs were cultured in X-VIVO15 medium supplemented with IL-3 (25 ng/mL) and M-CSF (100 ng/mL). The medium was changed every 3 to 4 days. After 21 days, monocyte-like suspension cells were harvested from the supernatant every 3 to 4 days. The monocytes were differentiated to MΦ in X-VIVO15 supplemented with M-CSF (100 ng/mL) for 7 days in non-TC treated plates.

2.3. Peripheral Blood Monocyte-Derived MΦ

Human buffy coats were from the Scottish Blood Transfusion Service, Edinburgh, UK. Isolation of peripheral blood mononuclear cells (PBMCs) from buffy coats was performed using density gradient centrifugation according to the manufacturer’s protocol (Lymphoprep, STEMCELL Technologies, Cambridge, UK). For each donor, 50 × 106 PBMCs were used to isolate CD14+ monocytes using the EasySepTM human monocyte isolation kit (STEMCELL Technologies, Cambridge, UK; Cat# 19359) according to the manufacturer’s instructions. Monocytes were differentiated using X-VIVO15 medium containing 100 U/mL Penicillin-Streptomycin and 1X GlutaMAX supplemented with M-CSF (100 ng/mL).

2.4. Phagocytosis Assay

iPSDM (1 × 10⁶ cells per well) were washed twice with PBS and RPMI medium without serum was added. Fluorescein (FITC)-conjugated Zymosan A particles (Cat# Z2841, ThermoScientific) (5 particles per cell) were added and phagocytosis was allowed to occur at 37 °C for 1 h. Cells were then washed with PBS followed by trypan blue (250 µg/mL) containing PBS to neutralise all the cell-bound Zymosan particles. Cells were then detached using PBS containing 2 mM EDTA and were analysed by flow cytometry.

2.5. Flow Cytometry

iPSC-derived MΦ and peripheral blood monocyte-derived MΦ were harvested using PBS containing 2 mM EDTA. Monocytes and MΦ were stained for viability using DAPI or Zombie Aqua viability dye (Biolegend) for 30 min at 4 °C. Cells were then Fc receptor blocked for 20 min at 4 °C using the human BD Fc block and stained with fluorophore-conjugated antibodies for 30 min at 4 °C. Following staining, cells were washed in FACS buffer (2% BSA in PBS) and analysed by using BD FACSCanto II flow cytometer and FlowJo (Version 10.7.1, FlowJo LLC, Ashland, OR, USA).

2.6. Processing of Proteome and Secretome Samples

Proteomic samples were processed by using the SP3 protocol [12]. Briefly, 1 × 10⁶ iPSDM per well were stimulated with IFNγ (50 ng/mL) + LPS (10 ng/mL) (M1 MΦ) or IL-4 (20 ng/mL) (M2 MΦ) for 48 h. Cells were washed twice with PBS and lysed in buffer containing 4% SDS, 10 mM TCEP and 50 mM TEAB.
For secretome analysis, iPSDM (1 × 10⁶ per well) were polarised to M1 and M2 for 24 h. Cells were then washed twice with PBS, media were changed to RPMI without phenol red and FBS (Cat# 32404014, Thermo Scientific, Waltham, UK) was supplemented with 100 ng/mL M-CSF and incubated at 37 °C. After 14 h, culture supernatants were harvested, passed through 0.45 µm filters to remove any cell debris, and concentrated 10 times using Amicon centrifugal filters (Cat# UFC801024, Millipore, London, UK).
Cell lysates/culture supernatants were boiled for 5 min and sonicated (15 cycles, 30 s on/30 s off). Protein concentrations were determined using a MicroBCA assay kit and equal amounts of lysates were taken for further processing. The samples were alkylated using iodoacetamide (20 mM) and incubated at room temperature in the dark for 1 h. To the alkylated lysates, SP3 beads were added to a final concentration of 0.5 µg/µL of processing volume, followed by an equal volume of ethanol (1:1 ethanol: cell lysate). The mixture was incubated at 24 °C for 5 min at 1000 rpm and the tubes were placed on the magnetic rack until the beads settled onto the tube wall. The unbound supernatant was discarded and the beads were rinsed thrice in 80% ethanol while on the magnetic rack. After removing all the residual ethanol, the beads were air-dried and resuspended in a digestion solution (100 mM ammonium bicarbonate) containing LysC and trypsin (at 1:25 wt/wt of protein: proteases) and sonicated in a water bath. The bead mixture was incubated at 37 °C at 1000 rpm overnight. After the protease digestion was complete, the bead mixture was centrifuged at 20,000× g for 1 min. The tubes were placed on the magnetic rack and the supernatants were transferred to fresh tubes. The supernatants were then dried and suspended in 50 µL of 1% formic acid prior to analysis with LC-MS.

2.7. LC-MS/MS Analysis

LC-MS analysis was performed by the FingerPrints Proteomics Facility (University of Dundee). Analysis of peptide readout was performed on a Q Exactive plus, Mass Spectrometer (Thermo Scientific) coupled to a Dionex Ultimate 3000 RS (Thermo Scientific). LC buffers used were the following: buffer A (0.1% formic acid in Milli-Q water (v/v)) and buffer B (80% acetonitrile and 0.1% formic acid in Milli-Q water (v/v). An equivalent of 0.75 µg of each sample were loaded at 10 μL/min onto a trapping column (100 μm × 2 cm, PepMap nanoViper C18 column, 5 μm, 100 Å, Thermo Scientific) equilibrated in 0.1% TFA. The trap column was washed for 3 min at the same flow rate with 0.1% TFA and then switched in-line with a Thermo Scientific, resolving C18 column (75 μm × 50 cm, PepMap RSLC C18 column, 2 μm, 100 Å). The peptides were eluted from the column at a constant flow rate of 300 μL/min with a linear gradient from 2% buffer B to 5% buffer B in 5 min, then from 5% buffer B to 35% buffer B in 125 min, and then to 98% buffer B within 2 min. The column was then washed with 98% buffer B for 20 min and equilibrated for 17 min with 2% Buffer B The column was kept at a constant temperature of 50 °C. Q-exactive plus was operated in data dependent positive ionization mode. The source voltage was set to 2.7 Kv and the capillary temperature was 250 °C.
A scan cycle comprised MS1 scan (m/z range from 350–1600, ion injection time of 20 ms, resolution 70,000 and automatic gain control (AGC) 1 × 10⁶) acquired in profile mode, followed by 15 sequential dependent MS2 scans (resolution 17500) of the most intense ions fulfilling predefined selection criteria (AGC 2 × 10⁵, maximum ion injection time 100 ms, isolation window of 1.4 m/z, fixed first mass of 100 m/z, spectrum data type: centroid, intensity threshold 2 × 10⁴, exclusion of unassigned, singly and >7 charged precursors, peptide match preferred, exclude isotopes on, dynamic exclusion time 45 s). The HCD collision energy was set to 27% of the normalized collision energy. Mass accuracy was checked before the start of samples analysis.

2.8. Quantification of Proteome and Secretome Data

The raw mass spectrometric data were analysed using MaxQuant software (version 1.5.5.1) [13] and the Andromeda search engine [14]. The false discovery rate (FDR) was set to 1% for both peptides and proteins. MaxQuant scored peptide identifications based on a search with a permissible mass tolerance of 7 ppm for precursor ions and 0.5 Da for fragment ions. The enzyme specificity was set to LysC/Trypsin. Other parameters used were the following: fixed modifications, cysteine carbamidomethylation; variable modifications, deamidation, protein N-acetylation and methionine oxidation; missed cleavages, 2; and minimum peptide length was set to 7. The Andromeda search engine was used to match MS/MS data against the human Uniprot database. The ‘match between runs’ feature was activated to transfer identification information to other LC-MS/MS runs based on ion masses and retention times. Minimum peptide ratio count was set to 2 and the relative quantitation between the peptides identified across different conditions was based on LFQ and iBAQ intensities. The normalised peptides intensities across samples were downloaded as an output file ’proteingroups.txt’.

2.9. Analysis of Proteomic Data

Perseus software version 1.6.7.0 was used for statistical analyses of the proteomic data. All the potential contaminants, reverse peptides, and peptides ‘only identified by site’ were removed from the data and the absolute copy number per cell and concentration were estimated by using a Proteomic ruler [15]. Proteins (reproducible in all biological replicates) with log intensities of copy number per cell and concentrations greater than 2–fold and p-value greater than 0.05 were considered differentially regulated across polarised MΦ.
Gene Ontology (GO) over representation enrichment analysis was done by using the WEB-based GEne SeT AnaLysis Toolkit [16]. Heat maps of estimated protein concentrations were generated using Broad Institute software Morpheus (https://software.broadinstitute.org/morpheus, accessed on 27 November 2021).

2.10. Graphs and Statistics

All the graphs (mean ± SEM) were plotted using GraphPad Prism version 9. Statistical analyses were determined using ANOVA followed by Tukey’s post hoc HSD test for pairwise comparison; p-values <0.05 were considered significant.

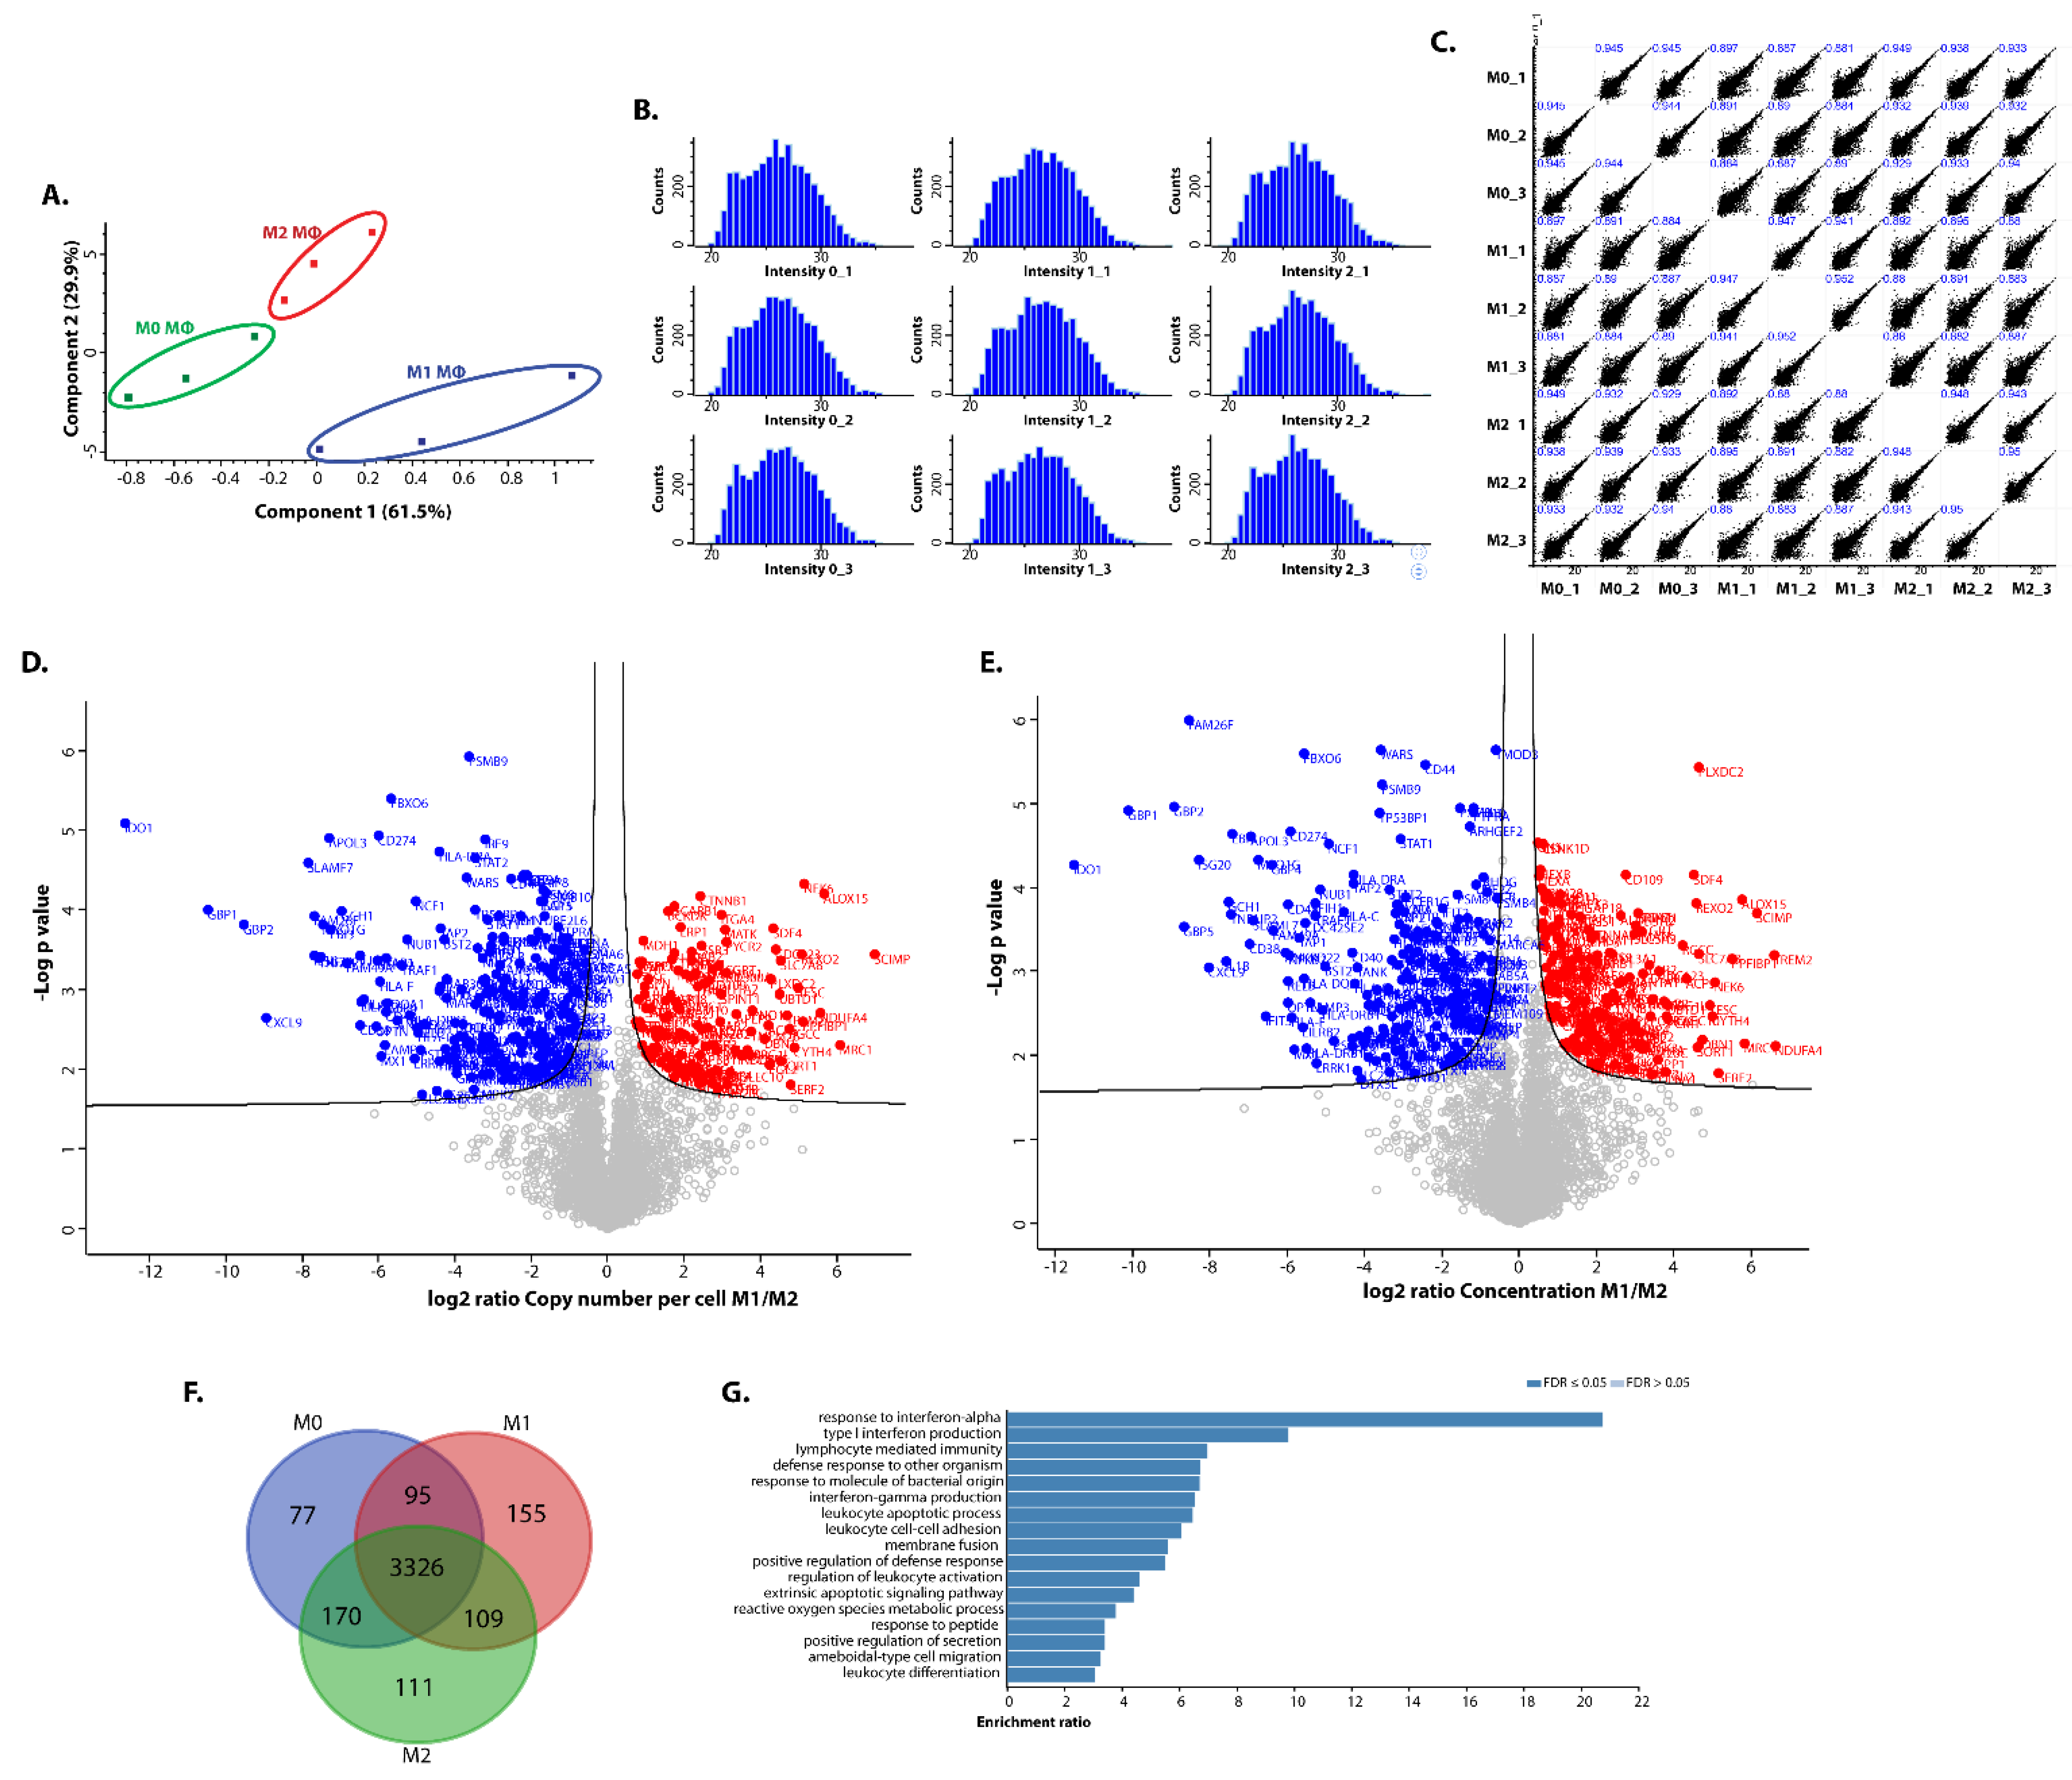
3. Results and Discussion

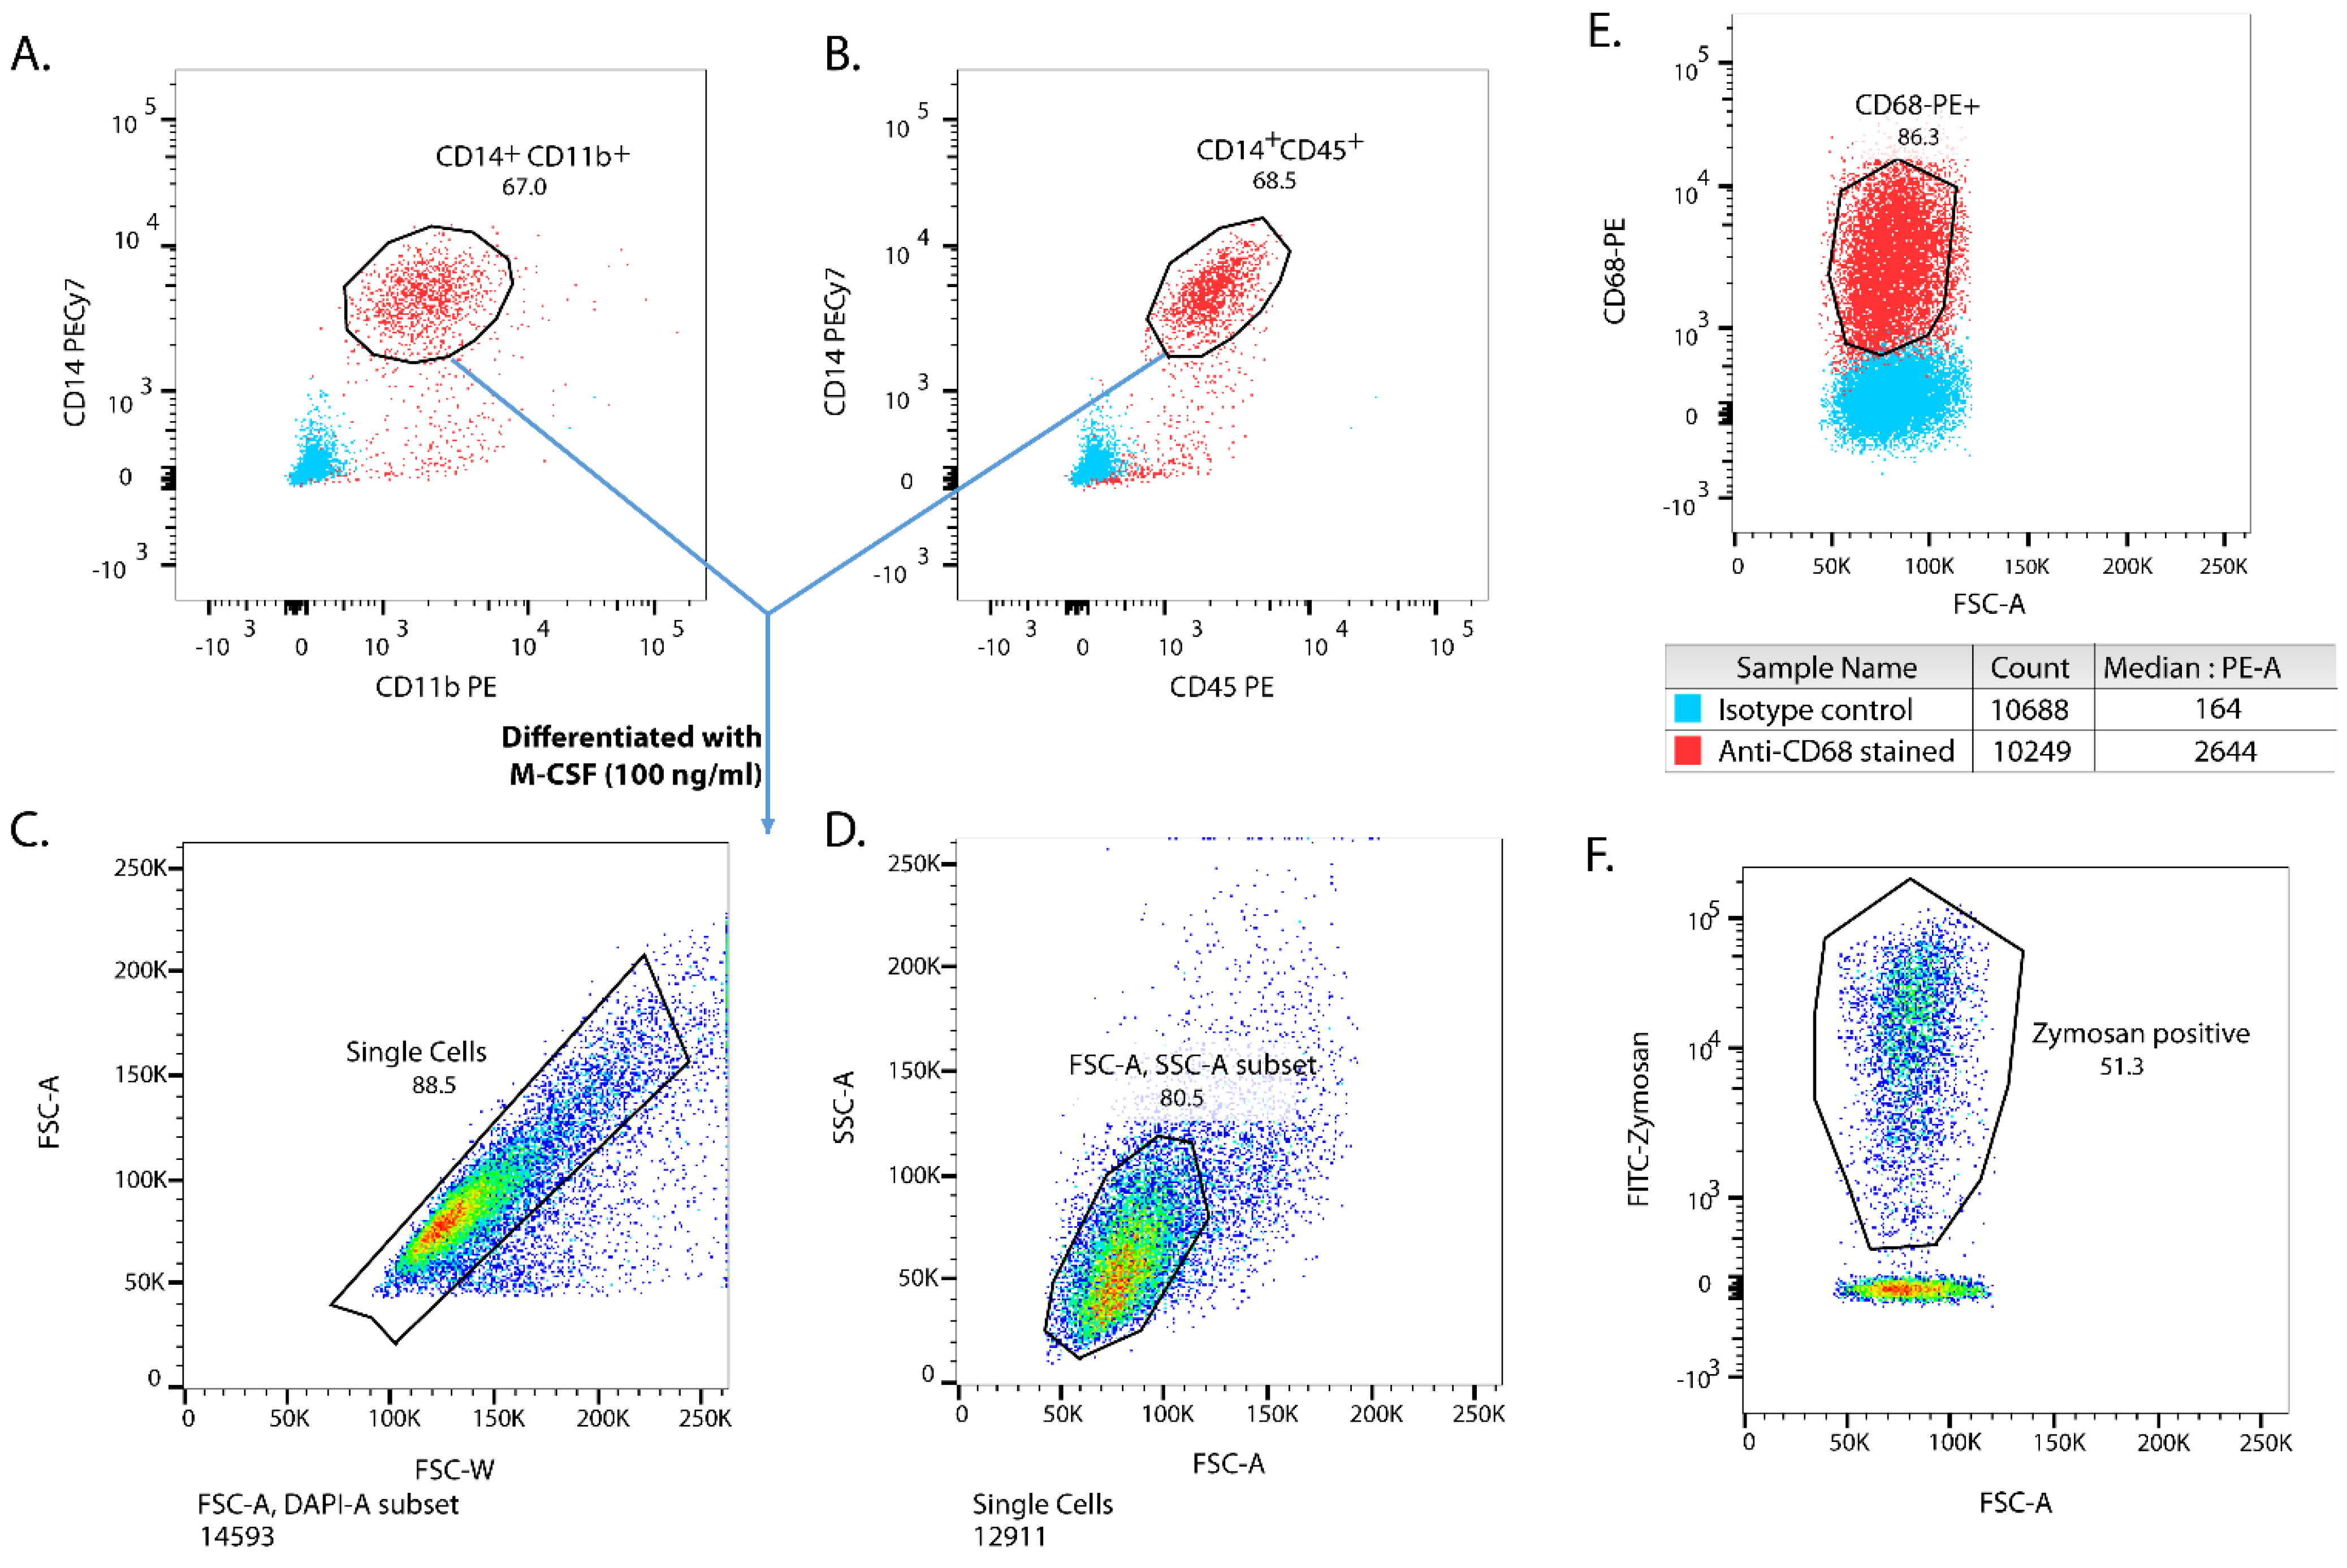
3.1. Characterisation of iPSC-Derived MΦ

Wibj2 iPSCs were differentiated to monocytes using a protocol adapted from Wilgenburg et al. [10] and Lopez-Yrigoyen et al. [11] as described in the Materials and Methods section. The monocyte yield was assessed by using monocyte markers, such as CD14 and CD11b (Figure 1A), and a pan-leukocyte marker, CD45 (Figure 1B). Monocyte yield was around 65 to 80% (Figure 1A,B) which is in line with Lopez-Yrigoyen et al. [11]. The monocytes were further differentiated into MΦ using X-VIVO15 medium supplemented with M-CSF for 7 days in non-TC treated plates, with media change at day 4 to remove other contaminating cells (Figure 1C,D). The adherent M0 iPSDM were CD68-positive (Figure 1E). Since phagocytosis of pathogens or cell debris is one of the hallmark functions of MΦ, we investigated the phagocytic activity of M0 iPSDM. After incubation of cells with FITC-Zymosan particles for 30 min, ~50% of iPSDM were Zymosan-positive (Figure 1F), confirming functional similarity with MDM [17].
To address whether plasticity of iPSDM is similar to human MDM, we polarised M0 iPSDM to M1- or M2-phenotypes using IFNγ plus LPS or IL-4, respectively. These samples were processed and analysed by one shot quantitative label-free mass spectrometry (MS). More than 4000 proteins were identified and copy number per cell was estimated using the ‘proteomic ruler’ method [15]. Principal component analysis (PCA) of the proteins identified by MS showed that M0 and M2 iPSDM are more closely related to each other compared to M1 iPSDM (Figure 2A). These findings are in line with published transcriptomics and nCounter gene expression analyses of polarised MDM [18,19]. In addition, it has been shown previously [20] that M-CSF alone polarises MΦ more to a M2-like phenotype. Histograms of the log-transformed intensities follow normal distributions, which suggests that the data are of good quality (Figure 2B). Moreover, variability within the replicates was from 0.89 to 0.96, indicating good reproducibility of MS runs (Figure 2C). Volcano plots were generated by plotting the p-value against the M1:M2 ratio of log-transformed copy numbers per cell (Figure 2D) and several established marker proteins for polarized MΦ, such as IDO1, CXCL9, ALOX15, and CD206, became immediately apparent. To normalise for the effect of polarisation on cell size, another volcano plot was generated using the log-transformed values of concentration (in nanomolar) (Figure 2E). When considering ‘differentially regulated’ proteins with a fold change of ≥2 and p-value ≤ 0.05 in the volcano plots, many proteins were found to be shared between resting and polarised iPSDM, while only ~5% of proteins were differentially regulated (Figure 2F and Table S1). As reflected in the Venn diagram, fewer proteins (220) were differentially regulated in M2 vs. M0 iPSDM as compared to the number of proteins (264) differentially expressed in M1 vs. M0 iPSDM, corroborating results from transcriptomics analyses of MDM (Figure 2F) [18]. In line with our expectation, GO analysis of the protein IDs upregulated in M1 iPSDM were found to be enriched in interferon and immune signalling (Figure 2G).

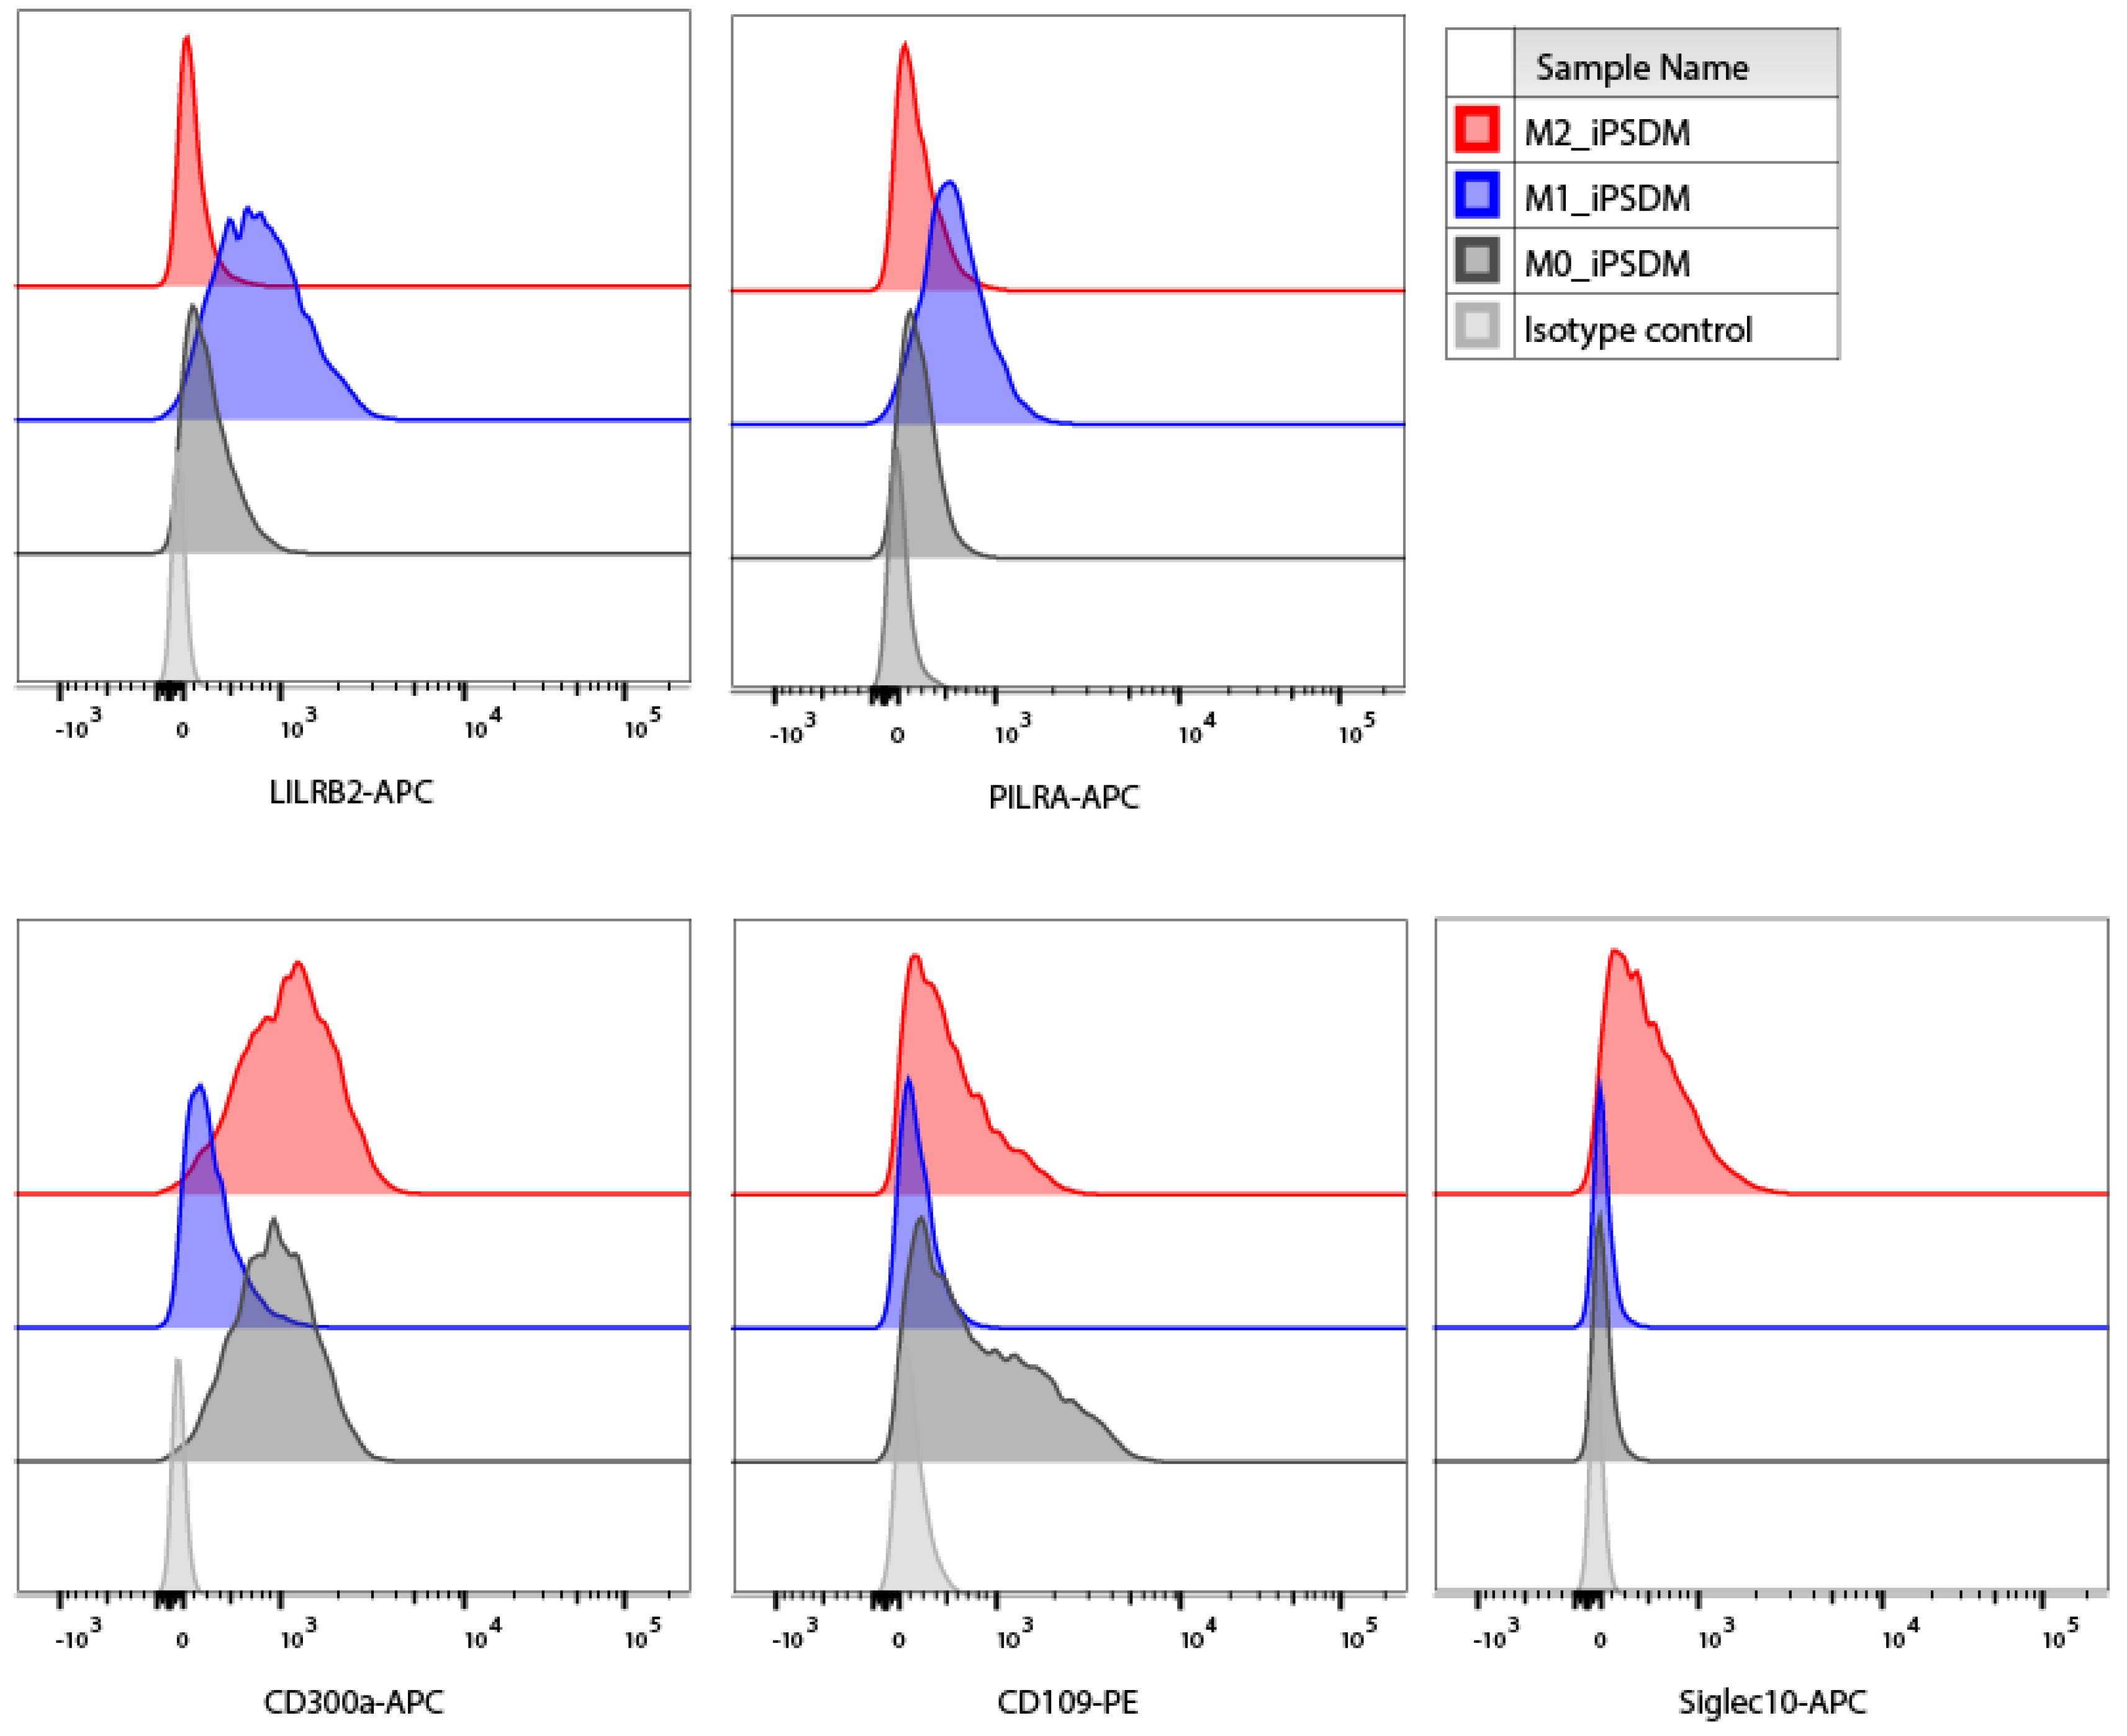
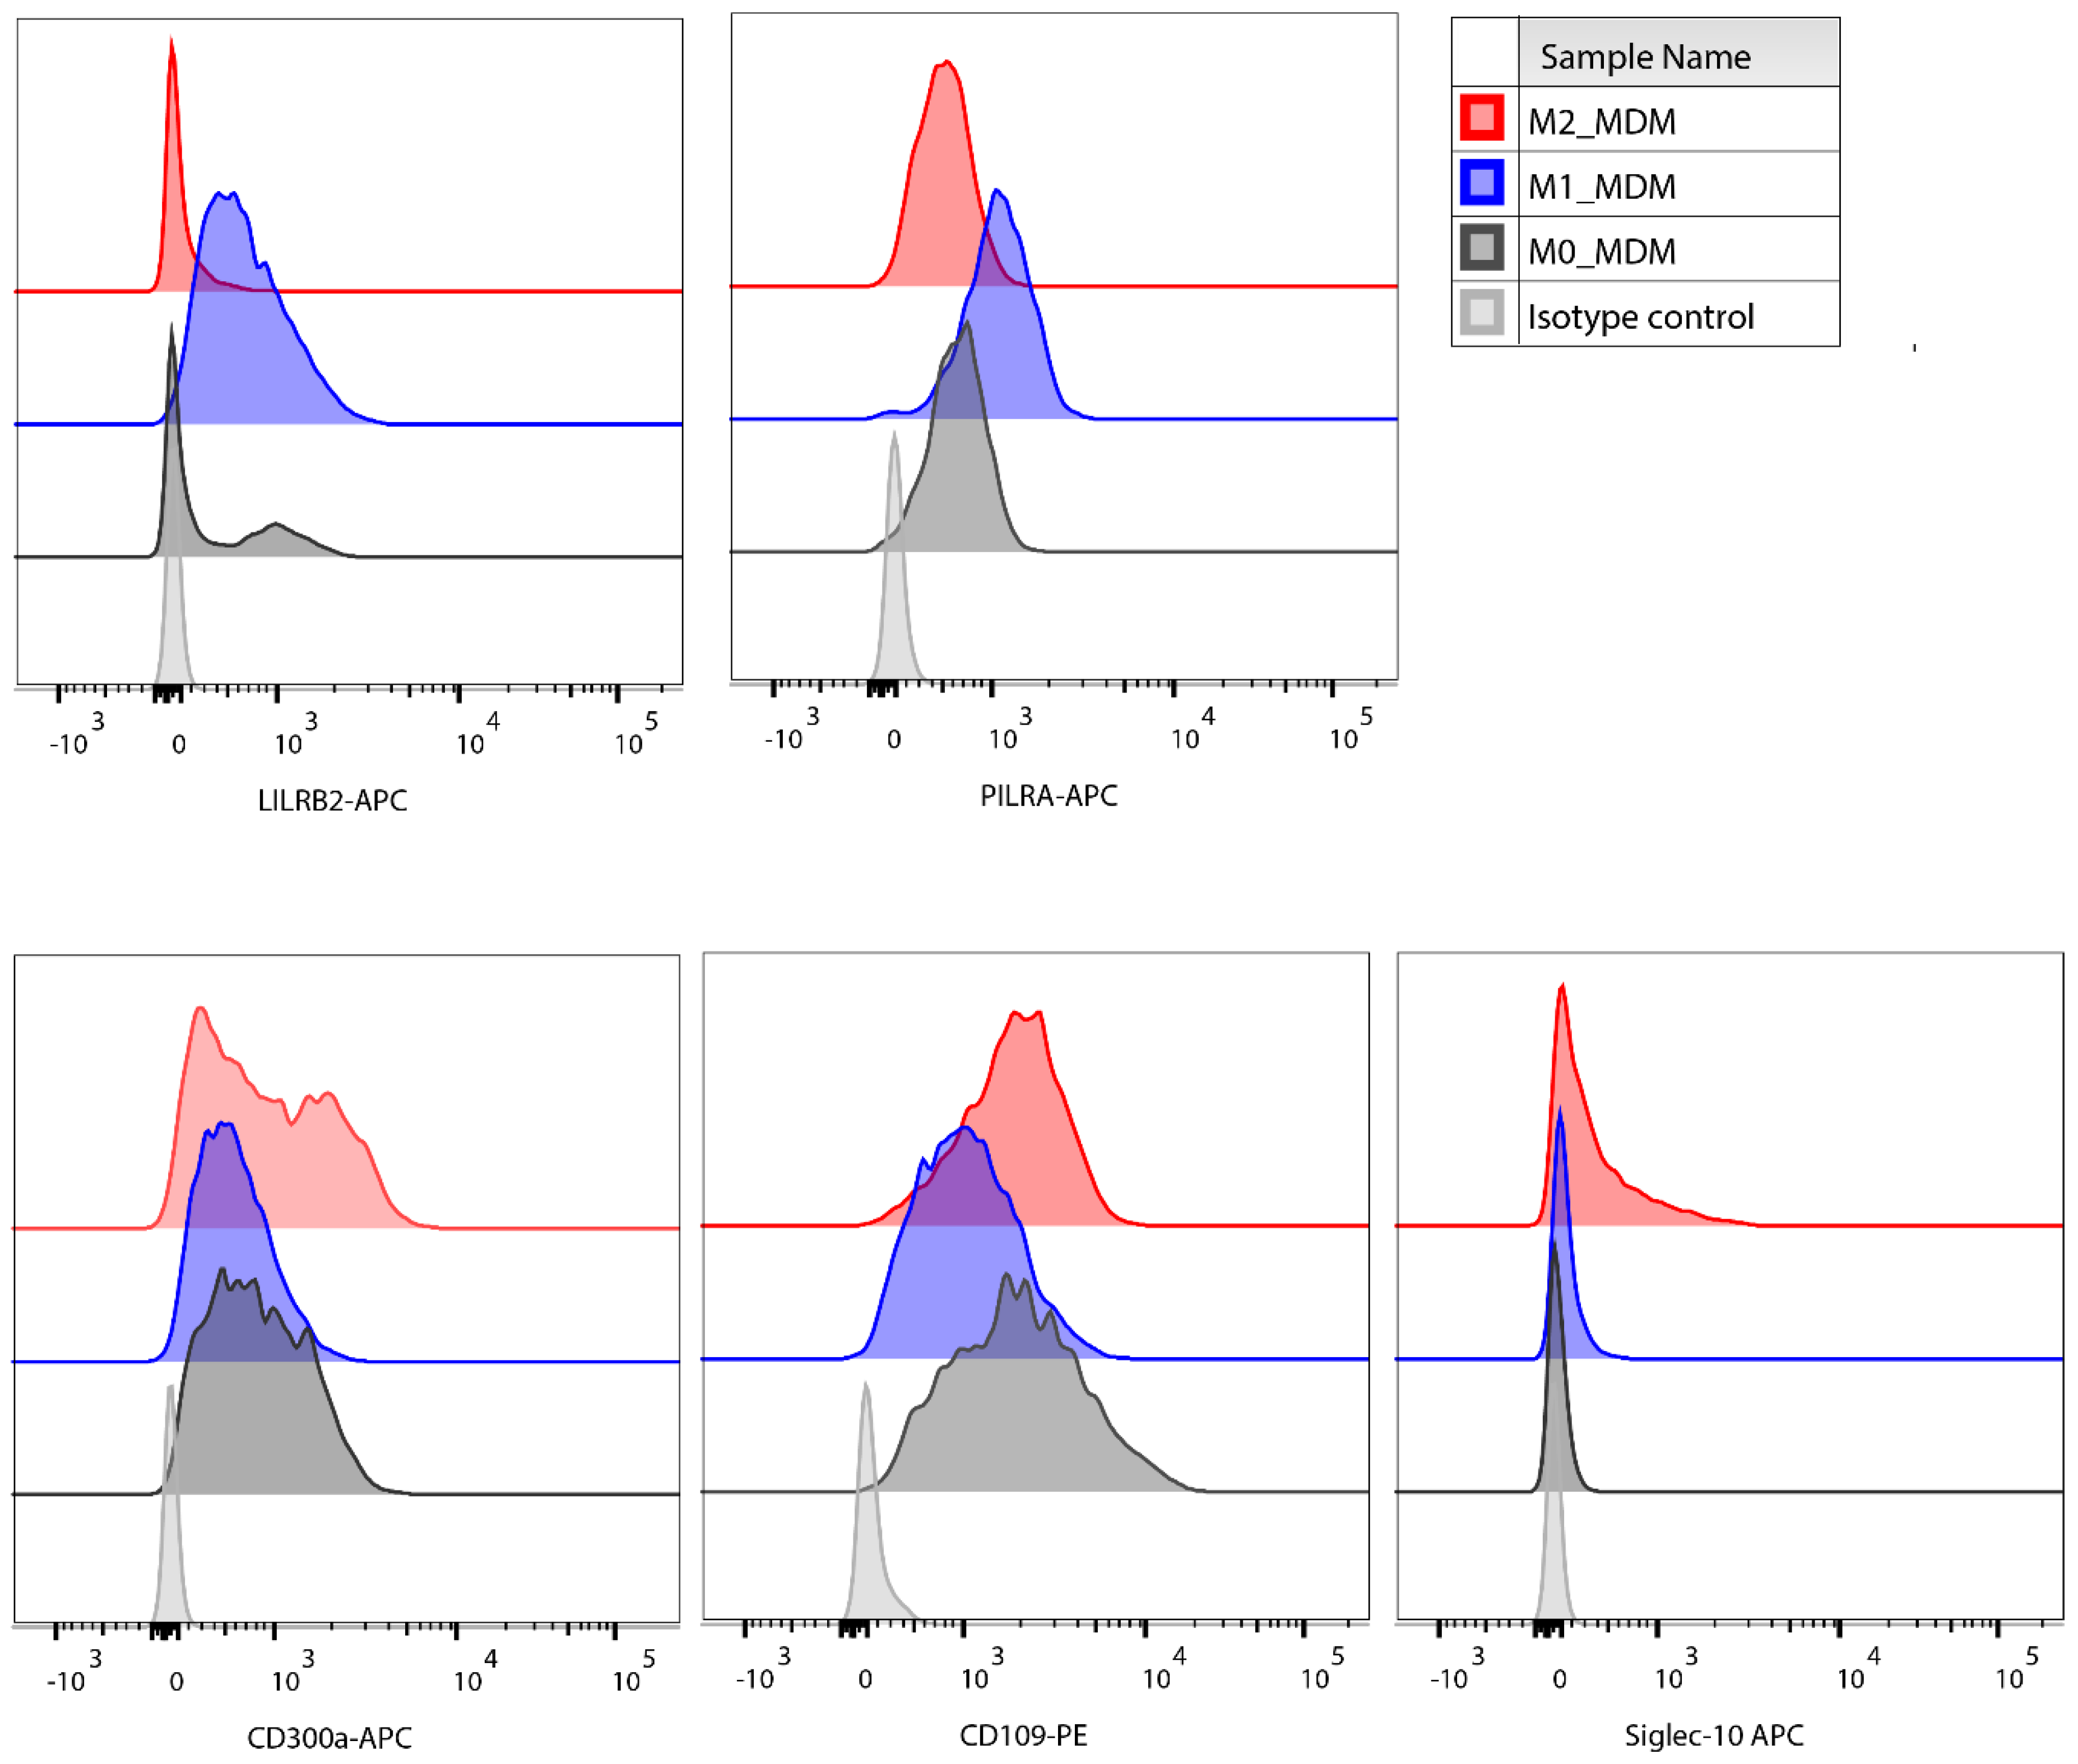
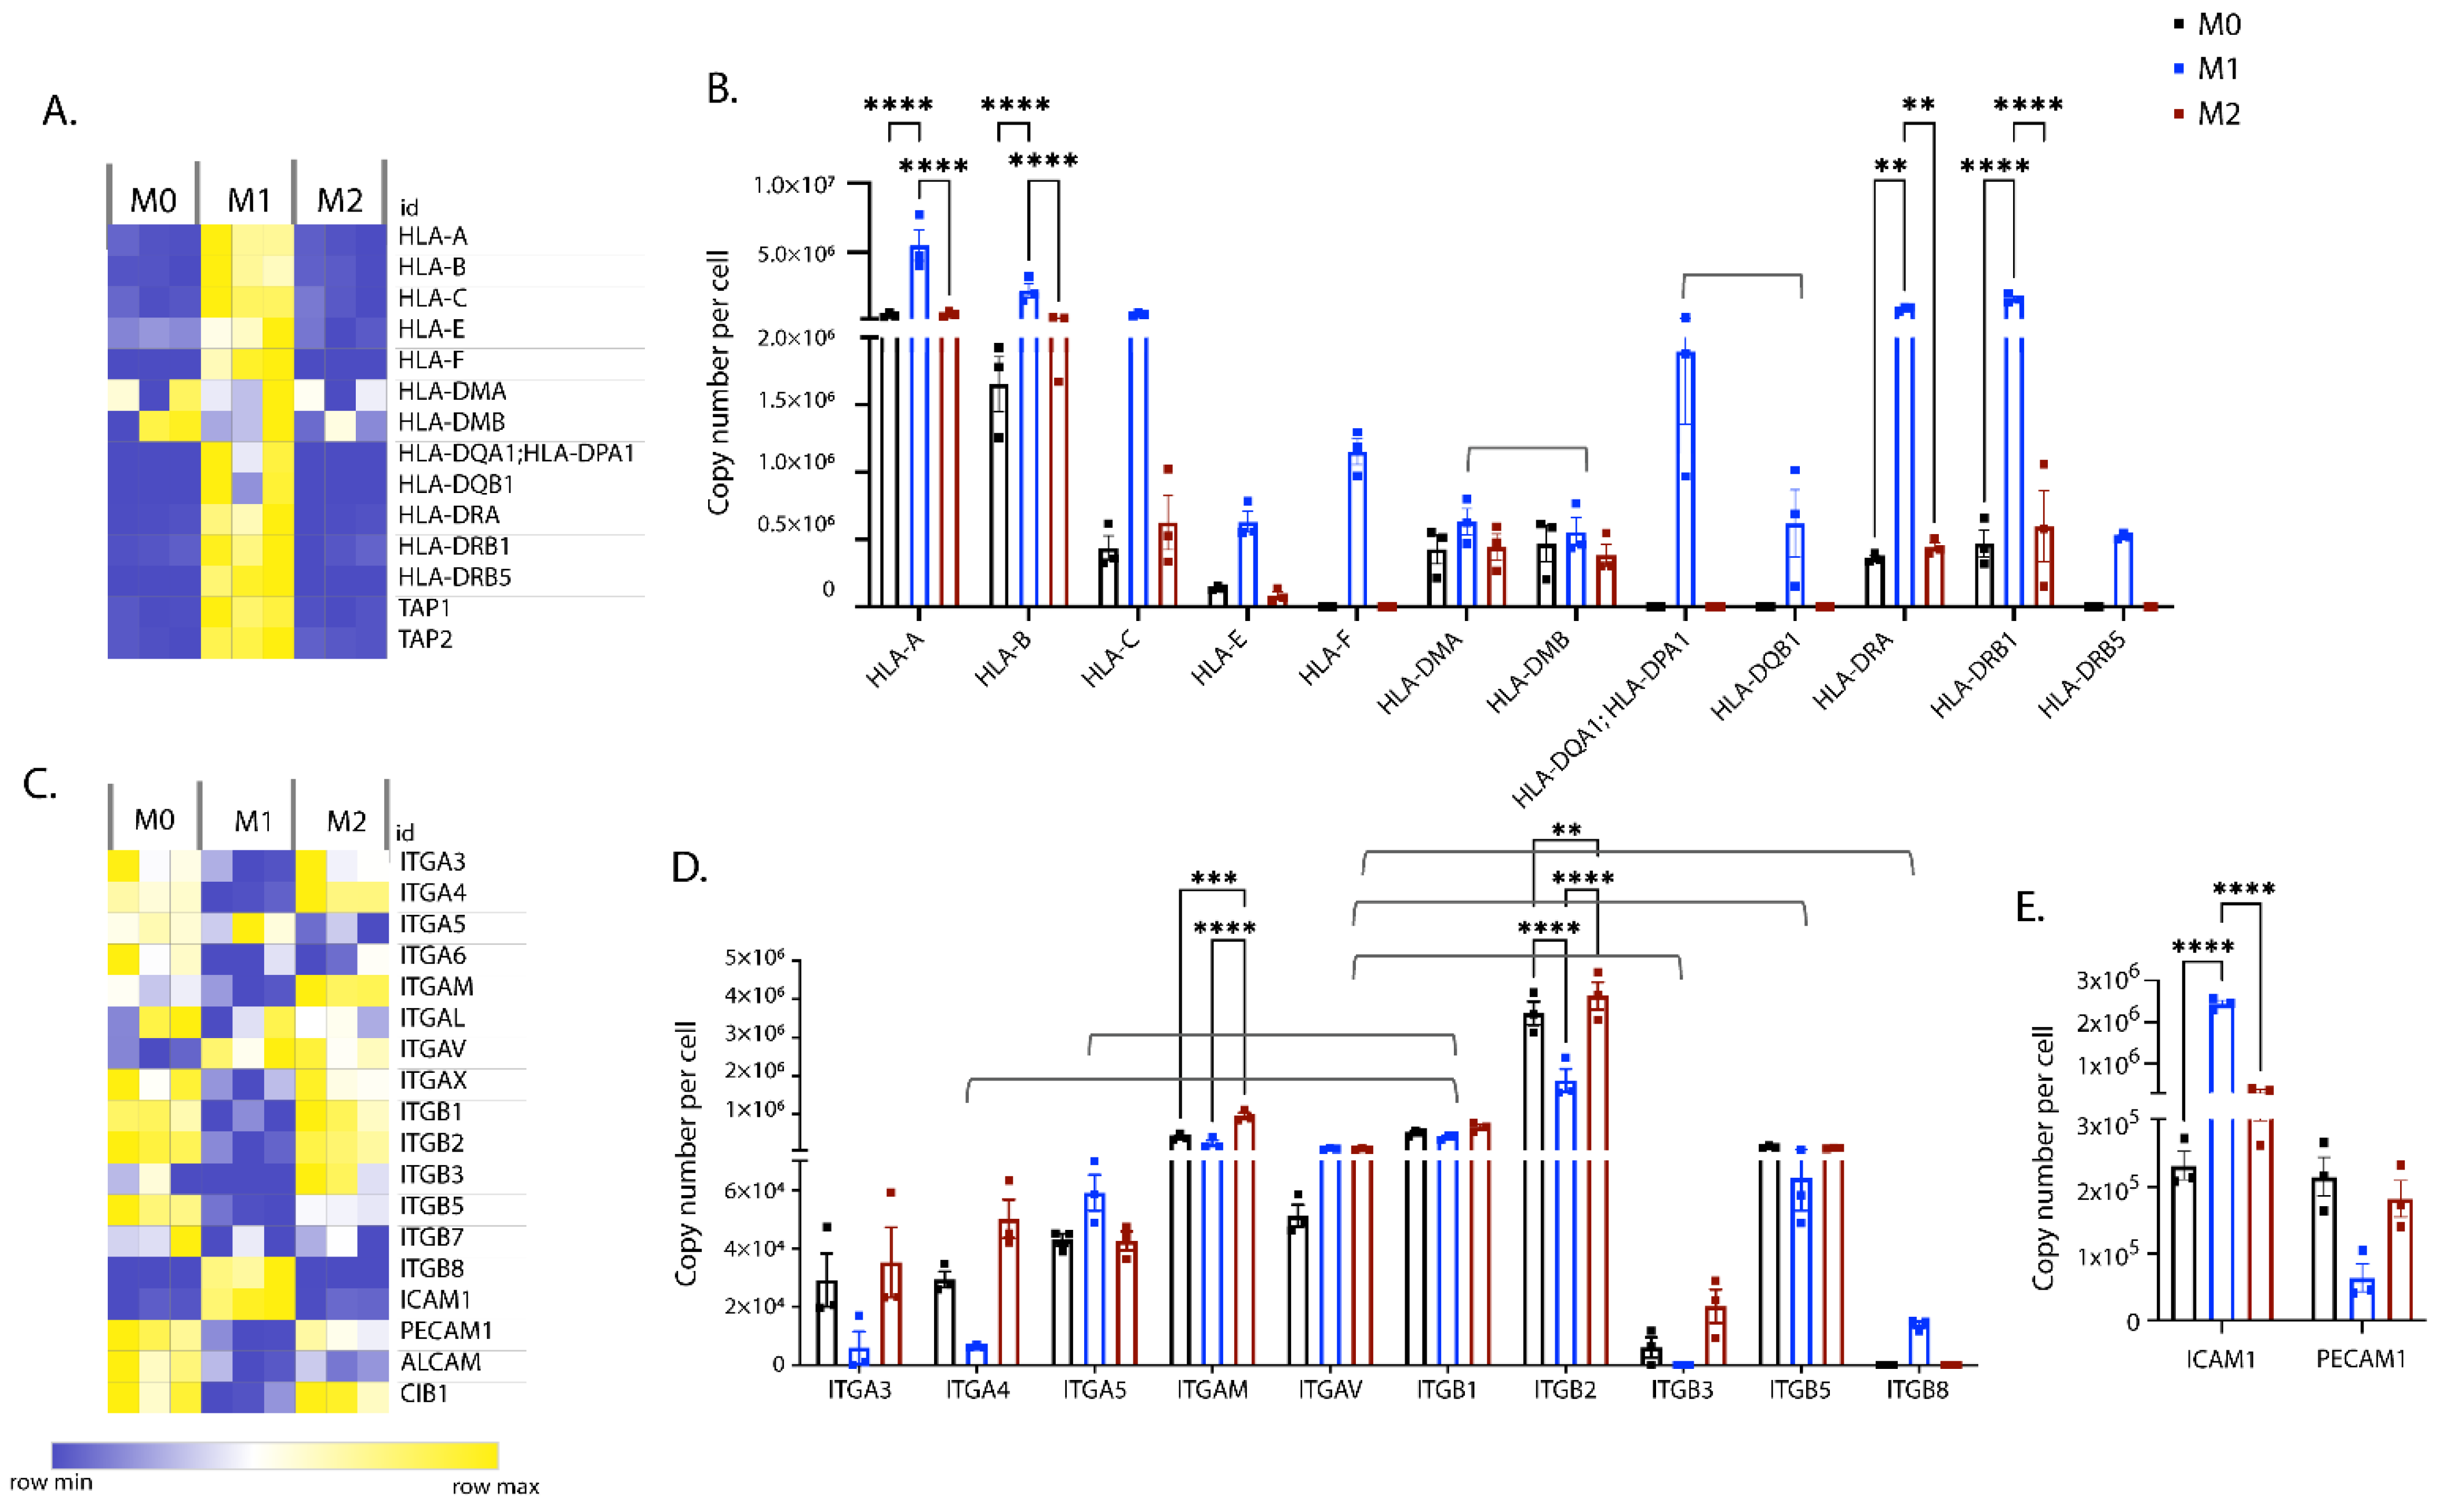
3.2. Polarisation-Induced Changes in the Expression of Membrane Proteins

Proteomic data showed that many membrane proteins were differentially expressed in polarised iPSDM. We observed a good correlation between the changes in concentrations and copy numbers per cell (Figure 3A–D).
As expected, well-characterised markers such as CD48, CD80, and CD86 were highly expressed in M1 iPSDM (Figure 3A,B and Figure S1). These membrane proteins function as costimulatory molecules for T cell activation and effector function [21,22].
TNF receptor superfamily members such as CD40 and FAS were upregulated in M1 iPSDM (Figure 3A,B). Ligation of these receptors has been reported to induce secretion of pro-inflammatory cytokines and trigger apoptosis [23,24].
CD38 is a multifunctional exoenzyme that has been shown to promote secretion of pro-inflammatory cytokines in MΦ [25]. As shown previously [26], IFNγ and LPS strongly induced expression of CD38 in iPSDM (Figure 3A,B).
Proteomic analysis identified substantial downregulation of CD109 expression in M1 iPSDM (Figure 3A,B). FACS staining of M1 iPSDM and MDM confirmed low expression of CD109, a molecule that was initially identified as a coreceptor for TGFβ and has a role in inhibiting intracellular TGFβ signalling [27] (Figure 4 and Figure 5).
PD1/PD-L1 (CD274) is an immune checkpoint that dampens immune response mediated by MΦ [28]. As shown previously [29,30,31], stimulation with IFNγ and LPS increased expression of CD274 in iPSDM (Figure 3A,B), which could be a mechanism of feedback inhibition of inflammation in MΦ.
Phagocytosis of pathogens and apoptotic cells is mediated by several receptors such as CD14, CD36, CD44, FCGR1 (CD64), MSR1, CD206, and CD163, all of which were highly expressed in M0 iPSDM (Figure 3A,C and Figure S1). We observed a significant increase in the expression of CD14, FCGR1, and CD44 in M1 iPSDM (Figure 3A,C). As shown previously for MDM [32], the well-characterised marker CD206 was upregulated in iPSDM on stimulation with IL-4 (Figure 3A,C).
CD300a is an inhibitor of phagocytosis of apoptotic cells in MΦ [33]. Stimulation with IFNγ and LPS markedly reduced expression of CD300a in M1 iPSDM (Figure 3A,C) and this was validated by flow cytometry (Figure 4). We also observed similar changes in CD300a expression in polarized MDM, suggesting that this represents a physiologically important response (Figure 5 and Figure S3). To the best of our knowledge, this is the first demonstration that CD300a is regulated on polarized MF and may have important implications for its phagocytic functions.
Furthermore, in the M1 proteome, we observed enrichment of immune-inhibitory receptors, such as PILRA and LILRB2 (Figure 3A,D). This is in line with the previous reports demonstrating upregulation in mRNA levels of LILRB2 and PILRA on stimulation with LPS [34,35]. Most Siglecs (sialic acid binding Ig-like lectins) have an immunoinhibitory function. Our analysis showed that IL-4 induced Siglec-10 expression in iPSDM (Figure 3A,D), consistent with previous studies [36,37]. However, polarisation had little or no impact on the expression of Siglecs-3 and -9. The differential expression of these proteins in polarised human MΦ was confirmed by FACS staining of both MDM and iPSDM (Figure 4, Figure 5 and Figure S3). Of note, the expression of LILRB2 and PILRA was highly restricted to M1 MΦ by quantitative proteomics and FACS analyses, suggesting that these receptors are suitable markers for classically activated MΦ. However, we observed donor-to-donor variations in the expression levels of these novel markers in polarised MDMs (Figure S3).
Further proteomic analysis identified high expression of growth factor receptors such as CSF1R, PDGFR and TGFBR in M0 MΦ. However, polarisation of iPSDM with IFNγ and LPS downregulated the expression of these receptors (Figure 3A,D). As shown previously [38], stimulation with IFNγ significantly reduced the expression of its counter receptor IFNGR1 and this could be a feedback mechanism to dampen the inflammatory response in MΦ.
Another key function of MΦ is the processing and presentation of antigens to other immune cells, via MHC molecules. MHC molecules are heterodimeric cell surface glycoproteins and are classified into two groups (MHC-I and -II), depending on the expression pattern and the type of peptides presented. Consistent with previous studies, the expression of MHC-I (HLA-A, -B, -C, -E and -F) and MHC-II (HLA-DR -DM, -DP and -DQ) were upregulated in M1 iPSDM (Figure 6A,B).
Integrins are a large family of heterodimeric transmembrane receptors that mediate phagocytosis, adhesion, and extravasation of MΦ to the sites of inflammation. We observed an increase in expression of leukocyte integrins, such as CD11b (ITGAM α chain, ITGB2 β chain), and VLA4 (ITGA4 α chain, ITGB1 β chain), in M2 iPSDM (Figure 6C,D). While the majority of α and β-chains were downregulated in M1 iPSDM, we observed enrichment of ITGA5 (α5-chain), which pairs with ITGB1 (β1-chain), and ITGB8 (β8-chain), which pairs with ITGAV (αV-chain) (Figure 6C,D).
We next analysed the expression of adhesion molecules. As shown previously [39,40], ICAM was found to be enriched in the M1 proteome. In contrast, stimulation with IFNγ and LPS downregulated PECAM expression in iPSDM (Figure 6C,E). PECAM has been reported to negatively regulate LPS/TLR4 signalling, possibly through interaction with its ligand CD38 [41].

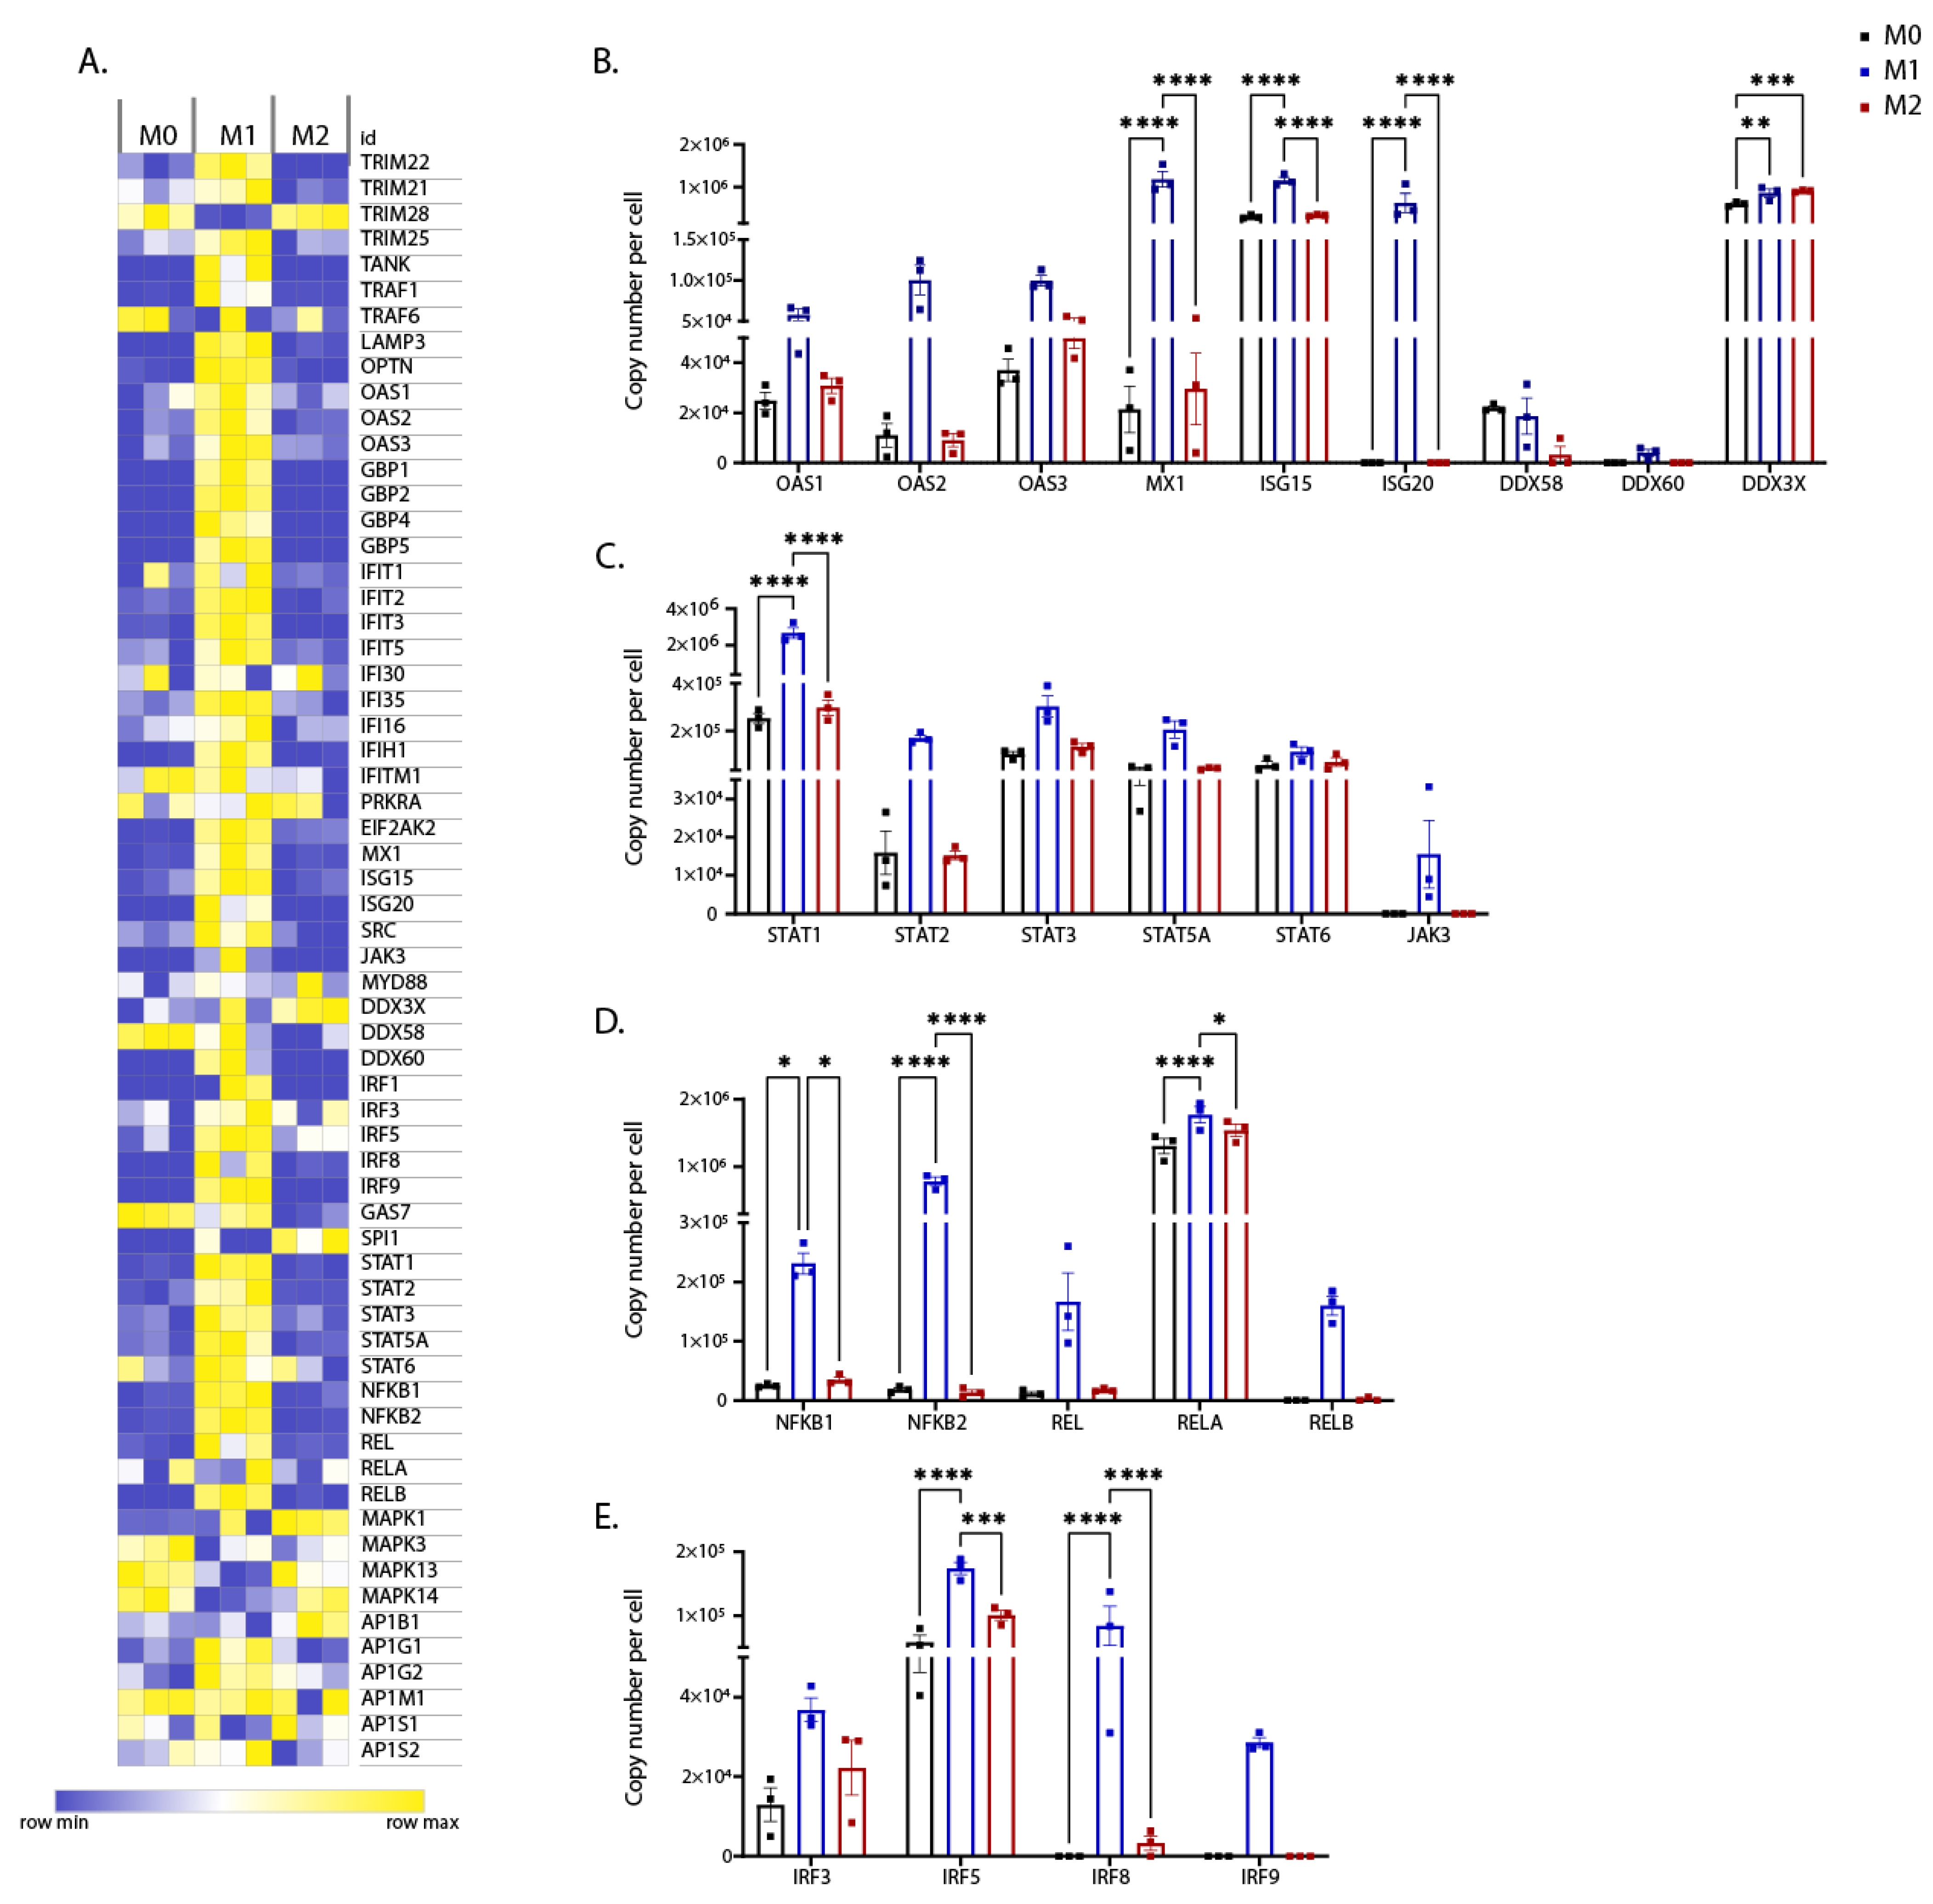
3.3. Expression of Interferon-Regulated Genes

IFNγ and IL-4 bind their cognate receptors and signal through kinases, such as JAKs, resulting in subsequent activation of transcription factors, such as STATs. Our proteomic analyses showed that JAK3, STAT1-4, and STAT5A were enriched in M1 proteome (Figure 7A,C). However, polarisation had little impact on STAT6 expression (Figure 7A,C). Phosphorylated STATs translocate to the nucleus, wherein they bind interferon regulatory factors (IRF) and induce transcription of IFN-regulated genes (IRGs). Interestingly, IRF3, 5, 8, and 9 were highly expressed in M1 iPSDM (Figure 7A,E). Furthermore, we observed enrichment of IRGs, such as ISG15, ISG20 IFIT1, IFIT2, IFIT2, IFIT5, IFITM, IFIH1, MX1, EIF2AK2, DDX60, OAS1, OAS2, OAS3, TRIM22, and TRIM25, in the M1 proteome (Figure 7A,B). Similarly, IFN-induced GTPases, such as GBP1, 2, 4, and 5, were highly expressed in M1 iPSDM (Figure 7A).
Next, we assessed the expression of the components of LPS/TLR4 signalling. NFĸB is the key transcription factor that mediates expression of inflammatory cytokines such as TNFα, IL12, and IL1B [42]. The NFĸB family of transcription factors includes RelA/p65, RelB, c-Rel, NFĸB1/p50, and NFĸB2/p52. Interestingly, all the NFĸB subunits were upregulated in M1 iPSDM (Figure 7A,D). However, there was no impact of polarisation on the expression levels of other downstream effectors of TLR4 signalling, such as MyD88, MAPK, TRAF6, and AP1 (Figure 7A).
Furthermore, we observed that the transcription factor SPI1 was enriched in M2 (IL-4) iPSDM (Figure 7A). SPI1 has been reported to be a crucial regulator of M2 polarisation in MΦ [43].
Consistent with previous transcriptomic studies [44], the proteins involved in vesicle trafficking such as OPTN (optineurin) and LAMP3 were upregulated in M1 iPSDM (Figure 7A).
Taken together, our analyses suggest that the mediators of IFNγ and NFkB signalling are enriched in M1 MΦ.

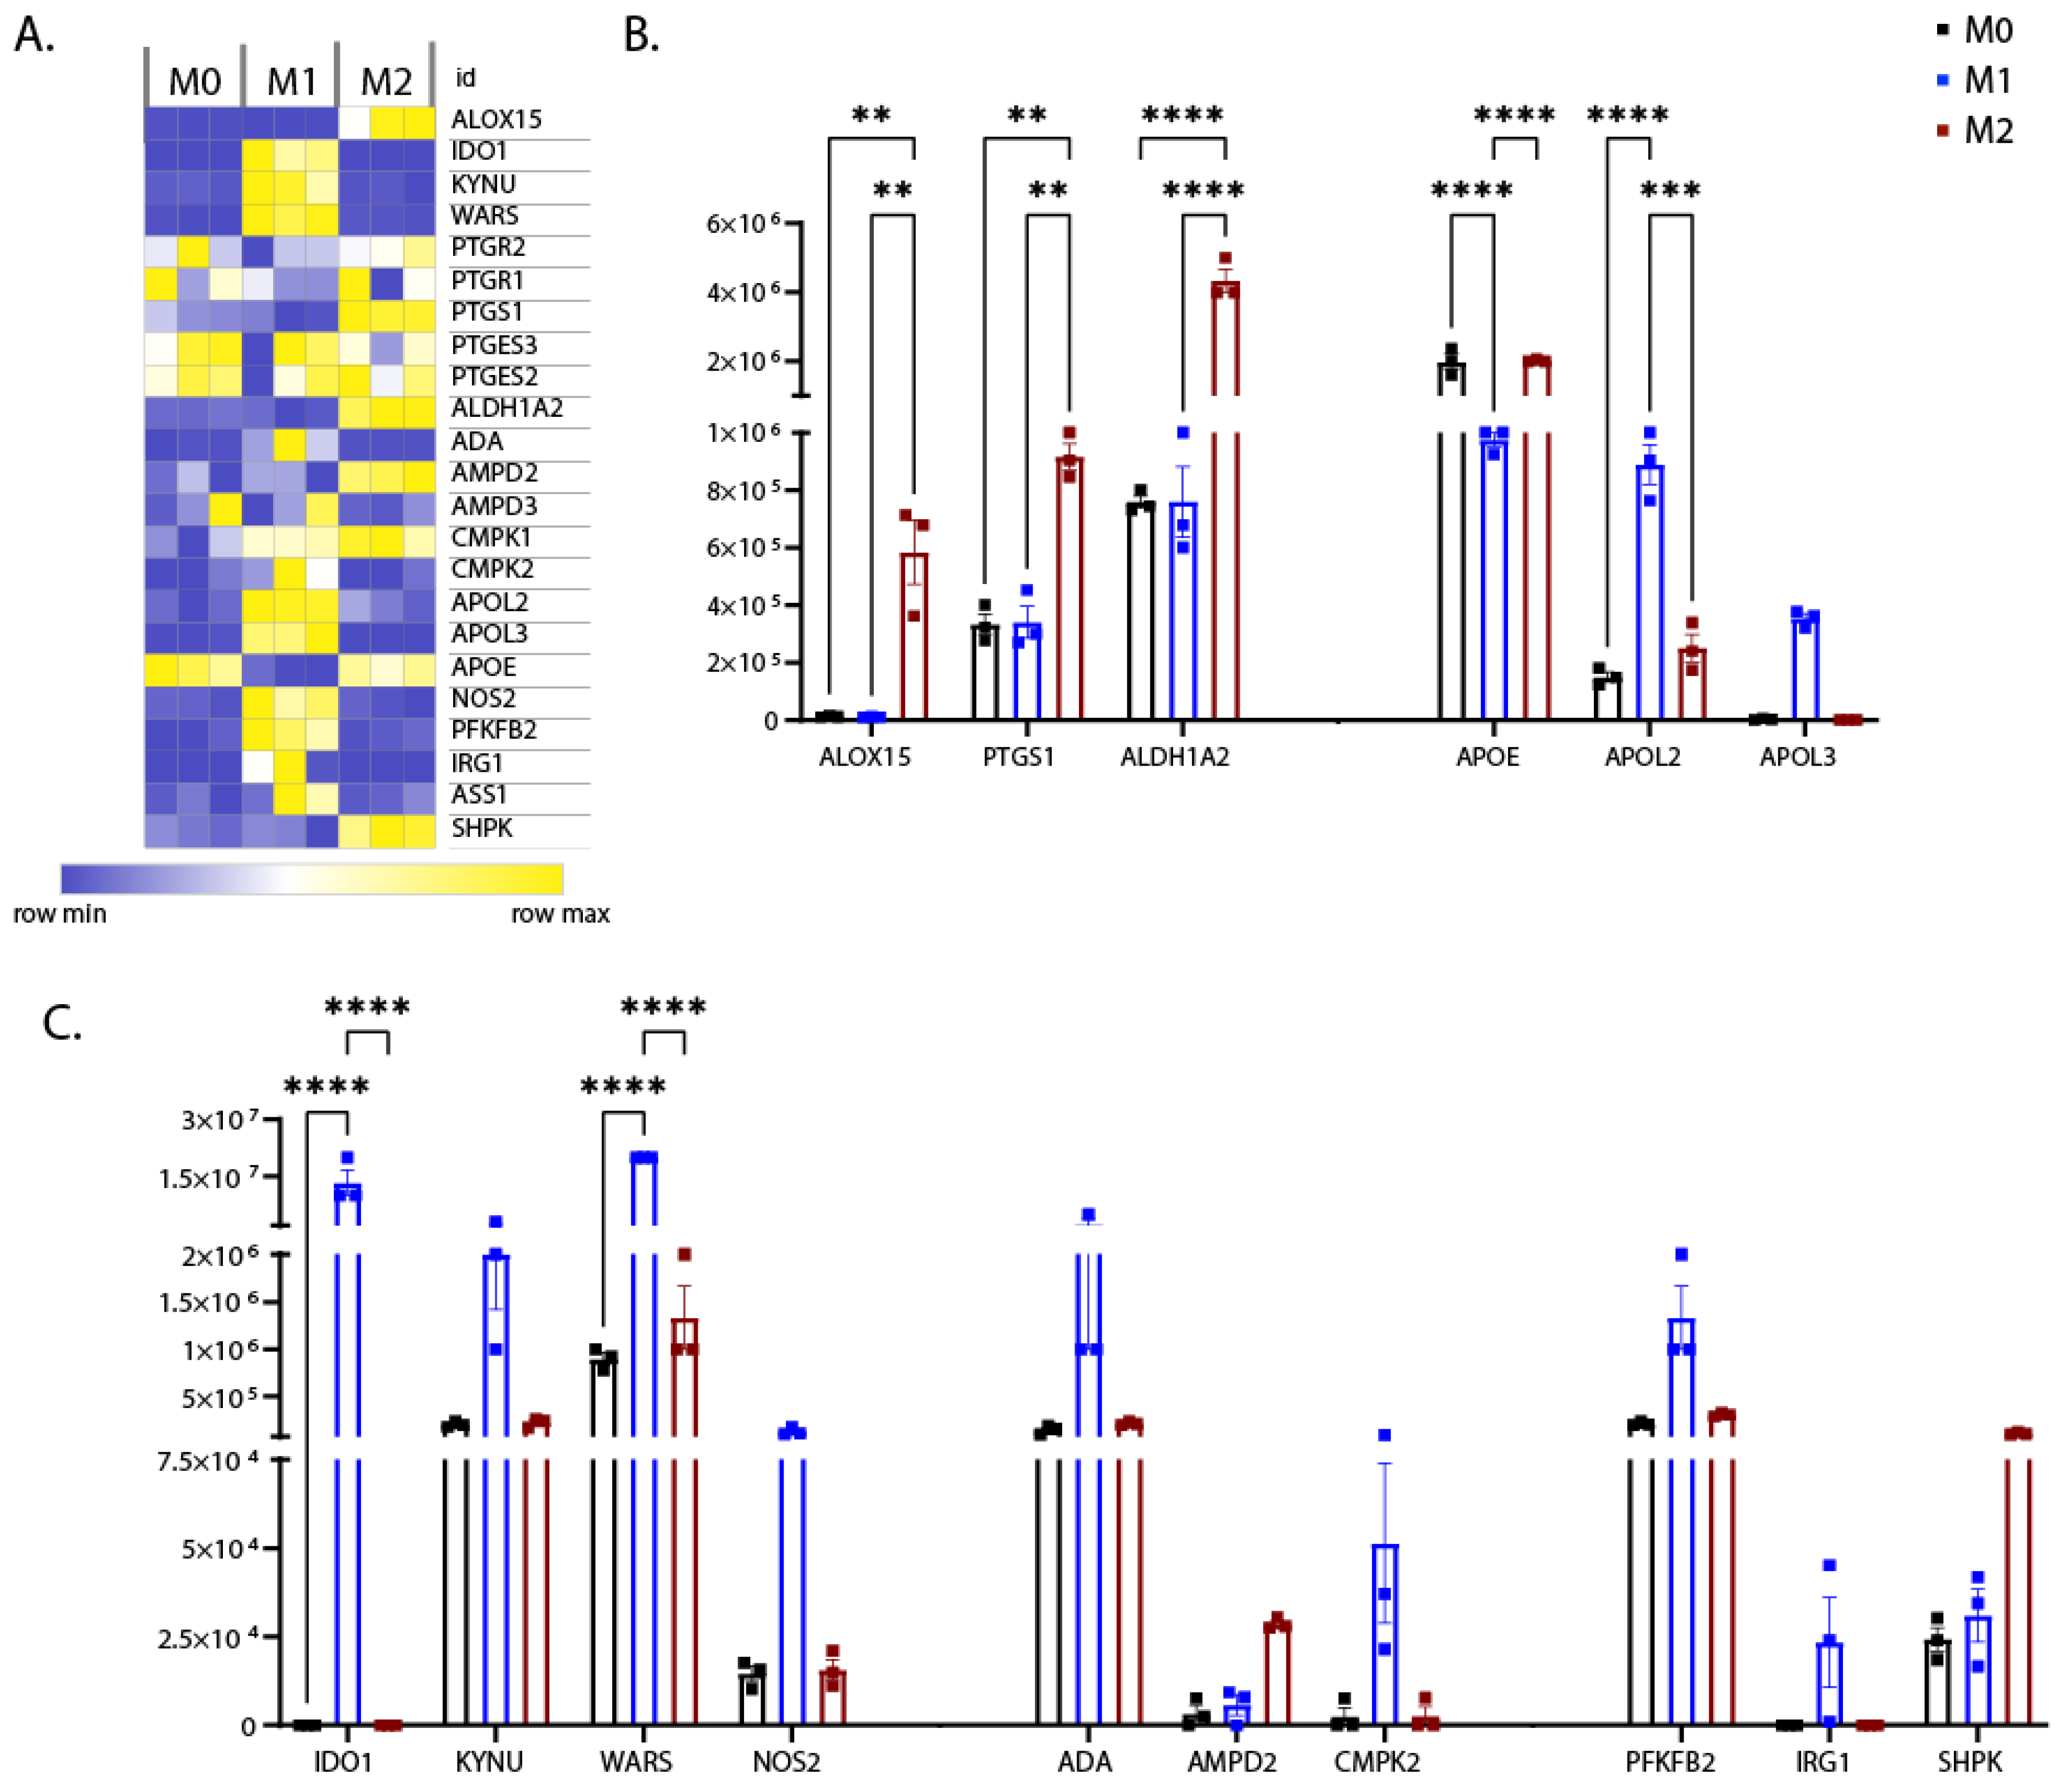
3.4. Differential Expression of Proteins Involved in Metabolism

Important mediators of inflammation resolution are derived from metabolism of prostaglandin, arachidonic acid, and retinoic acid (RA). Proteins implicated in metabolism of prostaglandin, such as PTGS1 [45] and arachidonic acid such as ALOX15 [46], were found to be enriched in the M2 proteome (Figure 8A,B). In addition, retinol dehydrogenase (ALDH1A2), the rate-limiting enzyme for RA biosynthesis [47,48], was also highly expressed in M2 iPSDM (Figure 8A,B).
Apolipoproteins are involved in the regulation of cholesterol levels and also function as effectors of the immune response to pathogens [49]. In the M1 proteome, we found enrichment of APOL2 and APOL3 (Figure 8A,B), in line with previous studies [50]. Furthermore, APOE, which has immunomodulatory function [51,52], was downregulated in M1 iPSDM (Figure 8A,B).
Tryptophan (Trp) metabolism is a major mechanism of immunomodulation and depletion of extracellular Trp has been shown to induce apoptosis of T cells [53]. Interestingly, the proteins involved in catabolism of Trp through the kynurenine metabolic pathway, such as IDO1 and KYNU, were enriched in M1 iPSDM (Figure 8A,C). In contrast, M1 polarisation-mediated Trp depletion also induced expression of tryptophanyl-tRNA synthetase WARS (Figure 8A,C), as shown previously [53].
Nucleotides are extracellular messengers actively secreted during cell stress and have immunomodulatory functions [54]. Our analyses showed that the enzymes involved in nucleotide metabolism, such as ADA, AMPD2, and CMPK, were differentially expressed in polarised iPSDM (Figure 8A,C). CMPK is a mitochondrial nucleoside kinase highly expressed in M1 MΦ and has a role in inducing ROS production and inflammasome activation [55]. Interestingly, AMPD2 was found to be enriched in M2 iPSDM (Figure 8A,C). AMPD2 is an anti-inflammatory mediator that catalyses formation of IMP from AMP [56].
Furthermore, NOS2 is an enzyme that converts arginine to nitric oxide (NO) and citrulline and was found to be upregulated in M1 iPSDM (Figure 8A,C), as shown previously [57]. Interestingly, Ass1, an enzyme that recycles Arg from citrulline, was also highly expressed in M1 iPSDM (Figure 8A,C).
We observed that the rate-limiting enzyme in glycolysis, PFKFB2, was upregulated in M1 iPSDM (Figure 8A,C). In addition, we also observed enhanced expression of IRG1 on stimulation with IFNγ and LPS (Figure 8A,C), as shown previously [58]. IRG1 converts cis-aconitate (TCA cycle intermediate) to itaconic acid, which has been proposed to have an antimicrobial effect [58]. Interestingly, SHPK, a seduheptulose kinase was found to be upregulated in M2 iPSDM (Figure 8A,C). SHPK links glycolysis and the non-oxidative phase of the pentose phosphate pathway (PPP) and its overexpression has been shown to inhibit inflammatory cytokine production in M1 MΦ [59].
Our findings suggest that there is a shift towards aerobic glycolysis and Trp metabolism in M1 MΦ, while M2 MΦ rely on fatty acid oxidation for their survival and resolution of inflammation.

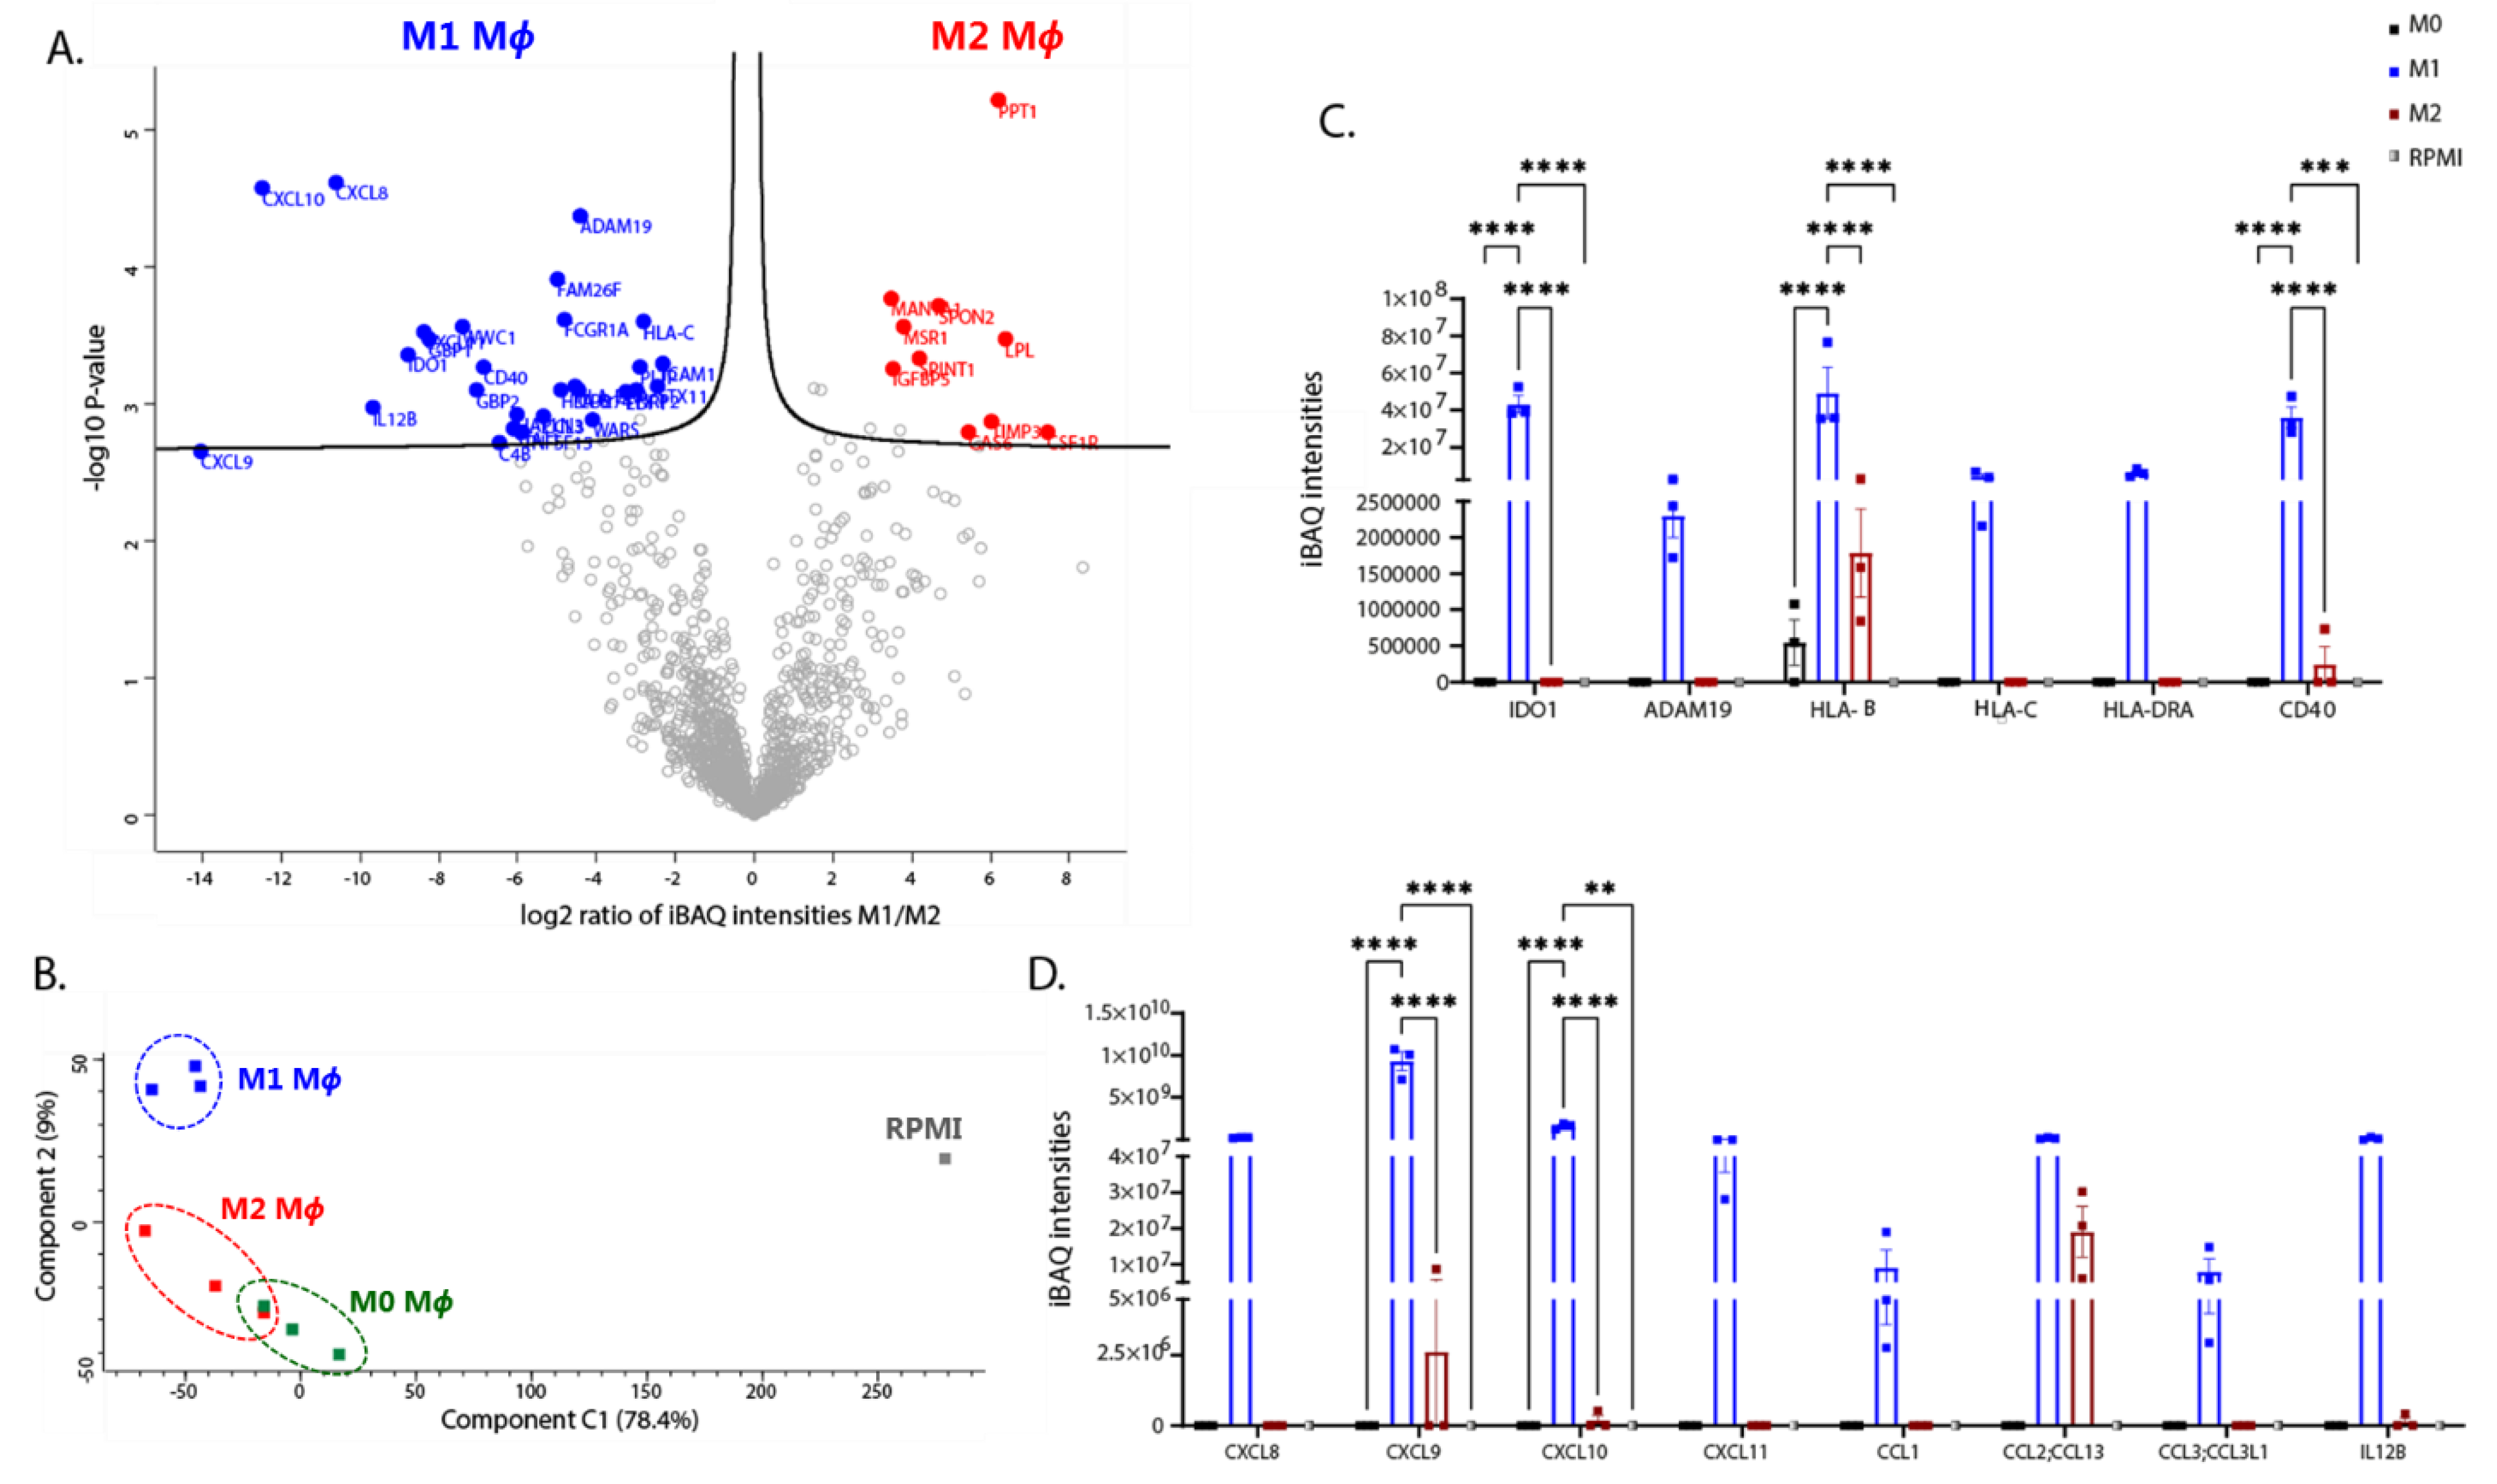
3.5. Differential Expression of Extracellular Mediators in Polarised iPSDM

Polarisation induces release of soluble proteins such as cytokines and chemokines from MΦ, which orchestrate the immune response. Therefore, we characterised the secretion profile of polarised iPSDM. For this, a later time point (24 h post-polarisation) was chosen to allow sufficient time for polarisation-induced protein synthesis and secretion. The culture supernatants were concentrated, processed, and analysed by using LC-MS/MS. More than 1300 protein hits were identified that were reproducibly released from the polarised iPSDM. iBAQ intensities were used for analysing secretome data, as that normalises the MS intensity of each protein by the corresponding number of peptides detected. A volcano plot was generated by using the iBAQ intensities of M1 and M2 polarised iPSDM and the differentially secreted proteins were highlighted (Figure 9A and Table S2). PCA analyses of the secretome showed that the secretory profile of M0 and M2 iPSDM are more similar compared to the M1 iPSDM (Figure 9B), reminiscent of the cell-associated proteome profile. Furthermore, our proteome analyses (harvested 48 h post-stimulation) also revealed differential expression of cytokines, chemokines, and ECM proteins in polarised iPSDM (Figure S4).
Both proteome and secretome analyses detected C-X-C subfamily chemokines, such as CXCL8, CXCL9, CXCL10, and CXCL11 in M1 iPSDMs (Figure 9D and Figure S4), which is in line with previous studies [24,60]. Moreover, C-C motif chemokines, such as CCL1, CCL2, and CCL3, were also released specifically from M1 iPSDM (Figure 9D). As shown previously [24], polarisation of iPSDM with IFNγ and LPS increased secretion or expression of proinflammatory cytokines, such as IL12 (β-subunit) (Figure 9D) and IL1β (Figure S4).
Transmembrane glycoproteins, such as CD40, FCGR1, ICAM1, and HLA molecules were also found to be enriched in the secretome of M1 iPSDM (Figure 9C). Interestingly, CSF1R, the receptor for cytokines such as M-CSF and IL-34, was found to be released from M2 iPSDM (Figure 9A). IL-4 stimulation also induced secretion of the scavenger receptor, MSR1, from iPSDM (Figure 9A). These membrane proteins could perhaps be released by proteolytic cleavage or membrane shedding [61,62,63].
ADAMs are a family of metalloproteinases involved in ectodomain shedding of cell surface receptors, adhesion molecules, and cytokines. ADAM19 was specifically released from M1 iPSDM (Figure 9C). In addition, our proteome analyses showed that the expression of ADAM9 and ADAM10 was downregulated in M1 iPSDM (Figure S4). Interestingly, TIMP3, an inhibitor of metalloproteinases, was found to be enriched in M2 secretome (Figure 9A).
Consistent with our proteome analysis, metabolic enzymes such as IDO1 and WARS were released from M1 iPSDM (Figure 9A,C). In contrast, M2 polarisation induced secretion of enzymes involved in lipid metabolism, such as LPL and PPT1 (Figure 9A).
Interestingly, GAS6 was found to be released at high levels from M2 iPSDM (Figure 9A). GAS6 is a ligand for TAM receptors and has an important role in mediating efferocytosis by MΦ [64].
In addition to the extracellular mediators reported in the literature, our secretome analyses identified a number of proteins released differentially from polarised MΦ.

4. Conclusions

This study used unbiased profiling of proteome and secretome changes in differentially polarised iPSC-derived MΦ to obtain a better understanding of MΦ functions in terms of cell surface phenotype, intracellular signalling, immune functions, and metabolic signatures. This study demonstrates that iPSC MΦ are promising tools for understanding MΦ biology, as they exhibit similar polarisation profiles and functions as monocyte-derived MΦ. We believe our comprehensive proteome and secretome data set will be a useful resource in the MΦ field.
In addition to the established surface markers, our study identified novel markers in differentially polarised MΦ. The alterations in expression of cell surface proteins likely influence the functions of MΦ in the way they respond to the microenvironment. Our analyses confirm that M1 MΦ are specialised in pathogen defence by presenting antigens and priming T cells for activation, while M2 MΦ are efficient at migrating to the sites of wound healing and mitigate inflammatory response by mediating efferocytosis of apoptotic cells. We also detected polarisation-induced changes in intracellular signalling, expression of transcription factors, and secretion of cytokines and chemokines. These phenotypic and functional changes in MΦ were also accompanied by dramatic shifts in expression of enzymes and other proteins associated with cell metabolism. M1 MΦ utilise aerobic glycolysis and breaks in Kreb’s cycle to produce microbicidal products, such as itaconate. Fatty acid oxidation is pronounced in M2 MΦ, resulting in production of mediators that resolve inflammation and promote wound healing, while upregulating the non-oxidative branch of PPP. Overall, this study provides new insights into how polarisation stimuli differentially regulate MΦ immune function.

Supplementary Materials

The following supporting information can be downloaded at: https://0-www-mdpi-com.brum.beds.ac.uk/article/10.3390/biomedicines10020239/s1, Tables S1 and S2: Showing copy numbers per cell data for differentially regulated proteome and secretome protein hits, respectively. Figure S1: Demonstrating expression of previously characterised surface markers CD80, CD86, MHC-II, and CD206 in polarised iPSDM. Figure S2: Showing expression of previously characterised surface markers CD80 and CD206 in polarised MDM. Figure S3: Expression of previously characterised (CD80, CD206) and potential novel surface markers (LILRB2, PILRA, CD109, and CD300a) in polarised MDM from two independent donors. Figure S4: Proteome analyses of cytokines, chemokines, and other secreted factors.

Author Contributions

Conceptualization, G.M., P.R.C. and B.W.; methodology, G.M., L.D. and L.J.; Software, G.M.; validation, G.M. and L.J.; formal analysis, G.M.; writing—review and editing, G.M., P.R.C. and B.W.; visualization, G.M.; supervision, P.R.C. and B.W.; project administration, P.R.C. and B.W.; funding acquisition, P.R.C. All authors have read and agreed to the published version of the manuscript.

Funding

This research was funded by a grant from Boehringer Ingelheim (G.M.).

Institutional Review Board Statement

The study was conducted in accordance with the guidelines and regulations of Scottish or German legislation and the experimental protocol was approved by the Ethical Committee of the Landesaerztekammer Baden-Wuerttemberg/Germany.

Informed Consent Statement

Buffy coats from healthy donors were obtained from Scottish National Blood Transfusion Services (SNBTS), Edinburgh or Deutsches Rotes Kreuz (DRK) Kreisverband, Postfach 1564, 89005 Ulm/Germany. Anonymised blood samples were obtained from healthy volunteers who provided written informed consent.

Data Availability Statement

Mass spectrometry proteomics data are deposited with the ProteomeXchange consortium via the PRIDE repository. “Proteomic analysis of macrophages derived from induced pluripotent stem cells”, accession number PXD029776. “Secretome analysis of polarised macrophages derived from induced pluripotent stem cells”, accession number PXD029831.

Acknowledgments

We would like to thank Jeffrey Pollard and his group (University of Edinburgh) for their help with the iPSC differentiation protocol. We would like to thank Ignacio Moraga’s group for their help with obtaining buffy coats and isolating PBMCs. We would like to thank Abdelmadjid Atrih and others in the University of Dundee Proteomics facility for their assistance. We would like to thank the staff in the Flow Cytometry and Cell Sorting Facility at the University of Dundee for assistance.

Conflicts of Interest

The authors declare no conflict of interest.

References

  1. Martinez, F.O.; Gordon, S. The M1 and M2 paradigm of macrophage activation: Time for reassessment. F1000Prime Rep. 2014, 6, 13. [Google Scholar] [CrossRef] [PubMed] [Green Version]
  2. Schildberger, A.; Rossmanith, E.; Eichhorn, T.; Strassl, K.; Weber, V. Monocytes, peripheral blood mononuclear cells, and THP-1 cells exhibit different cytokine expression patterns following stimulation with lipopolysaccharide. Mediat. Inflamm. 2013, 2013, 697972. [Google Scholar] [CrossRef] [PubMed] [Green Version]
  3. Tsuchiya, S.; Yamabe, M.; Yamaguchi, Y.; Kobayashi, Y.; Konno, T.; Tada, K. Establishment and characterization of a human acute monocytic leukemia cell line (THP-1). Int. J. Cancer 1980, 26, 171–176. [Google Scholar] [CrossRef] [PubMed]
  4. Alasoo, K.; Martinez, F.O.; Hale, C.; Gordon, S.; Powrie, F.; Dougan, G.; Mukhopadhyay, S.; Gaffney, D.J. Transcriptional profiling of macrophages derived from monocytes and iPS cells identifies a conserved response to LPS and novel alternative transcription. Sci. Rep. 2015, 5, 12524. [Google Scholar] [CrossRef] [PubMed] [Green Version]
  5. Cui, D.; Franz, A.; Fillon, S.A.; Jannetti, L.; Isambert, T.; Fundel-Clemens, K.; Huber, H.J.; Viollet, C.; Ghanem, A.; Niwa, A.; et al. High-yield human induced pluripotent stem cell-derived monocytes and macrophages are functionally comparable with primary cells. Front. Cell Dev. Biol. 2021, 9, 656867. [Google Scholar] [CrossRef] [PubMed]
  6. Gutbier, S.; Wanke, F.; Dahm, N.; Rummelin, A.; Zimmermann, S.; Christensen, K.; Kochl, F.; Rautanen, A.; Hatje, K.; Geering, B.; et al. Large-scale production of human iPSC-derived macrophages for drug screening. Int. J. Mol. Sci. 2020, 21, 4808. [Google Scholar] [CrossRef] [PubMed]
  7. Nagala, M.; Crocker, P.R. Towards understanding the cell surface phenotype, metabolic properties and immune functions of resident macrophages of the peritoneal cavity and splenic red pulp using high resolution quantitative proteomics. Wellcome Open Res. 2020, 5, 165. [Google Scholar] [CrossRef]
  8. Murray, P.J.; Allen, J.E.; Biswas, S.K.; Fisher, E.A.; Gilroy, D.W.; Goerdt, S.; Gordon, S.; Hamilton, J.A.; Ivashkiv, L.B.; Lawrence, T.; et al. Macrophage activation and polarization: Nomenclature and experimental guidelines. Immunity 2014, 41, 14–20. [Google Scholar] [CrossRef] [Green Version]
  9. Kilpinen, H.; Goncalves, A.; Leha, A.; Afzal, V.; Alasoo, K.; Ashford, S.; Bala, S.; Bensaddek, D.; Casale, F.P.; Culley, O.J.; et al. Common genetic variation drives molecular heterogeneity in human iPSCs. Nature 2017, 546, 370–375. [Google Scholar] [CrossRef] [Green Version]
  10. Van Wilgenburg, B.; Browne, C.; Vowles, J.; Cowley, S.A. Efficient, long term production of monocyte-derived macrophages from human pluripotent stem cells under partly-defined and fully-defined conditions. PLoS ONE 2013, 8, e71098. [Google Scholar] [CrossRef]
  11. Lopez-Yrigoyen, M.; Fidanza, A.; Cassetta, L.; Axton, R.A.; Taylor, A.H.; Meseguer-Ripolles, J.; Tsakiridis, A.; Wilson, V.; Hay, D.C.; Pollard, J.W.; et al. A human iPSC line capable of differentiating into functional macrophages expressing ZsGreen: A tool for the study and in vivo tracking of therapeutic cells. Philos. Trans. R Soc. Lond. B Biol. Sci. 2018, 373, 20170219. [Google Scholar] [CrossRef] [PubMed] [Green Version]
  12. Hughes, C.S.; Moggridge, S.; Müller, T.; Sorensen, P.H.; Morin, G.B.; Krijgsveld, J. Single-pot, solid-phase-enhanced sample preparation for proteomics experiments. Nat. Protoc. 2019, 14, 68–85. [Google Scholar] [CrossRef] [PubMed]
  13. Cox, J.; Mann, M. MaxQuant enables high peptide identification rates, individualized p.p.b.-range mass accuracies and proteome-wide protein quantification. Nat. Biotechnol. 2008, 26, 1367–1372. [Google Scholar] [CrossRef] [PubMed]
  14. Cox, J.; Neuhauser, N.; Michalski, A.; Scheltema, R.A.; Olsen, J.V.; Mann, M. Andromeda: A peptide search engine integrated into the MaxQuant environment. J. Proteome Res. 2011, 10, 1794–1805. [Google Scholar] [CrossRef] [PubMed]
  15. Wisniewski, J.R.; Hein, M.Y.; Cox, J.; Mann, M. A “proteomic ruler” for protein copy number and concentration estimation without spike-in standards. Mol. Cell Proteomics 2014, 13, 3497–3506. [Google Scholar] [CrossRef] [PubMed] [Green Version]
  16. Wang, J.; Vasaikar, S.; Shi, Z.; Greer, M.; Zhang, B. WebGestalt 2017: A more comprehensive, powerful, flexible and interactive gene set enrichment analysis toolkit. Nucleic Acids Res. 2017, 45, W130–W137. [Google Scholar] [CrossRef]
  17. Municio, C.; Alvarez, Y.; Montero, O.; Hugo, E.; Rodriguez, M.; Domingo, E.; Alonso, S.; Fernandez, N.; Crespo, M.S. The response of human macrophages to beta-glucans depends on the inflammatory milieu. PLoS ONE 2013, 8, e62016. [Google Scholar] [CrossRef] [Green Version]
  18. Martinez, F.O.; Gordon, S.; Locati, M.; Mantovani, A. Transcriptional profiling of the human monocyte-to-macrophage differentiation and polarization: New molecules and patterns of gene expression. J. Immunol. 2006, 177, 7303–7311. [Google Scholar] [CrossRef] [Green Version]
  19. Anders, C.B.; Lawton, T.M.W.; Smith, H.L.; Garret, J.; Doucette, M.M.; Ammons, M.C.B. Use of integrated metabolomics, transcriptomics, and signal protein profile to characterize the effector function and associated metabotype of polarized macrophage phenotypes. J. Leukoc. Biol. 2021. [Google Scholar] [CrossRef]
  20. Jaguin, M.; Houlbert, N.; Fardel, O.; Lecureur, V. Polarization profiles of human M-CSF-generated macrophages and comparison of M1-markers in classically activated macrophages from GM-CSF and M-CSF origin. Cell. Immunol. 2013, 281, 51–61. [Google Scholar] [CrossRef]
  21. Latchman, Y.; McKay, P.F.; Reiser, H. Cutting edge: Identification of the 2B4 molecule as a counter-receptor for CD48. J. Immunol. 1998, 161, 5809–5812. [Google Scholar]
  22. Petro, T.M.; Chen, S.S.; Panther, R.B. Effect of CD80 and CD86 on T cell cytokine production. Immunol. Investig. 1995, 24, 965–976. [Google Scholar] [CrossRef] [PubMed]
  23. Vogel, D.Y.; Glim, J.E.; Stavenuiter, A.W.; Breur, M.; Heijnen, P.; Amor, S.; Dijkstra, C.D.; Beelen, R.H. Human macrophage polarization in vitro: Maturation and activation methods compared. Immunobiology 2014, 219, 695–703. [Google Scholar] [CrossRef] [PubMed]
  24. Orecchioni, M.; Ghosheh, Y.; Pramod, A.B.; Ley, K. Macrophage polarization: Different gene signatures in M1(LPS+) vs. classically and M2(LPS-) vs. alternatively activated macrophages. Front. Immunol. 2019, 10, 1084. [Google Scholar] [CrossRef] [PubMed]
  25. Amici, S.A.; Young, N.A.; Narvaez-Miranda, J.; Jablonski, K.A.; Arcos, J.; Rosas, L.; Papenfuss, T.L.; Torrelles, J.B.; Jarjour, W.N.; Guerau-de-Arellano, M. CD38 is robustly induced in human macrophages and monocytes in inflammatory conditions. Front. Immunol. 2018, 9, 1593. [Google Scholar] [CrossRef] [Green Version]
  26. Jablonski, K.A.; Amici, S.A.; Webb, L.M.; Ruiz-Rosado, J.d.D.; Popovich, P.G.; Partida-Sanchez, S.; Guerau-de-Arellano, M. Novel markers to delineate murine M1 and M2 macrophages. PLoS ONE 2015, 10, e0145342. [Google Scholar] [CrossRef] [Green Version]
  27. Bizet, A.A.; Liu, K.; Tran-Khanh, N.; Saksena, A.; Vorstenbosch, J.; Finnson, K.W.; Buschmann, M.D.; Philip, A. The TGF-β co-receptor, CD109, promotes internalization and degradation of TGF-β receptors. Biochim. Biophys. Acta Mol. Cell Res. 2011, 1813, 742–753. [Google Scholar] [CrossRef] [Green Version]
  28. Gordon, S.R.; Maute, R.L.; Dulken, B.W.; Hutter, G.; George, B.M.; McCracken, M.N.; Gupta, R.; Tsai, J.M.; Sinha, R.; Corey, D.; et al. PD-1 expression by tumour-associated macrophages inhibits phagocytosis and tumour immunity. Nature 2017, 545, 495–499. [Google Scholar] [CrossRef]
  29. Zhang, X.; Zeng, Y.; Qu, Q.; Zhu, J.; Liu, Z.; Ning, W.; Zeng, H.; Zhang, N.; Du, W.; Chen, C.; et al. PD-L1 induced by IFN-gamma from tumor-associated macrophages via the JAK/STAT3 and PI3K/AKT signaling pathways promoted progression of lung cancer. Int. J. Clin. Oncol. 2017, 22, 1026–1033. [Google Scholar] [CrossRef]
  30. Brem-Exner, B.G.; Sattler, C.; Hutchinson, J.A.; Koehl, G.E.; Kronenberg, K.; Farkas, S.; Inoue, S.; Blank, C.; Knechtle, S.J.; Schlitt, H.J.; et al. Macrophages driven to a novel state of activation have anti-inflammatory properties in mice. J. Immunol. 2008, 180, 335–349. [Google Scholar] [CrossRef] [Green Version]
  31. Ou, J.N.; Wiedeman, A.E.; Stevens, A.M. TNF-alpha and TGF-beta counter-regulate PD-L1 expression on monocytes in systemic lupus erythematosus. Sci. Rep. 2012, 2, 295. [Google Scholar] [CrossRef] [PubMed] [Green Version]
  32. Smith, T.D.; Tse, M.J.; Read, E.L.; Liu, W.F. Regulation of macrophage polarization and plasticity by complex activation signals. Integr. Biol. 2016, 8, 946–955. [Google Scholar] [CrossRef]
  33. Simhadri, V.R.; Andersen, J.F.; Calvo, E.; Choi, S.C.; Coligan, J.E.; Borrego, F. Human CD300a binds to phosphatidylethanolamine and phosphatidylserine, and modulates the phagocytosis of dead cells. Blood 2012, 119, 2799–2809. [Google Scholar] [CrossRef]
  34. Venet, F.; Schilling, J.; Cazalis, M.-A.; Demaret, J.; Poujol, F.; Girardot, T.; Rouget, C.; Pachot, A.; Lepape, A.; Friggeri, A.; et al. Modulation of LILRB2 protein and mRNA expressions in septic shock patients and after ex vivo lipopolysaccharide stimulation. Hum. Immunol. 2017, 78, 441–450. [Google Scholar] [CrossRef]
  35. Bagheri, M.; Dong, Y.; Ono, M. Molecular diversity of macrophages in allergic reaction: Comparison between the allergenic modes; Th1- and -Th2-derived immune conditions. Iran J. Allergy Asthma Immunol. 2015, 14, 261–272. [Google Scholar] [PubMed]
  36. Barkal, A.A.; Brewer, R.E.; Markovic, M.; Kowarsky, M.; Barkal, S.A.; Zaro, B.; Krishnan, V.; Hatakeyama, J.; Dorigo, O.; Barkal, L.J.; et al. CD24 signalling through macrophage Siglec-10 is a target for cancer immunotherapy. Nature 2019, 572, 392–396. [Google Scholar] [CrossRef]
  37. Higuchi, H.; Shoji, T.; Iijima, S.; Nishijima, K. Constitutively expressed Siglec-9 inhibits LPS-induced CCR7, but enhances IL-4-induced CD200R expression in human macrophages. Biosci. Biotechnol. Biochem. 2016, 80, 1141–1148. [Google Scholar] [CrossRef] [PubMed] [Green Version]
  38. Crisler, W.J.; Eshleman, E.M.; Lenz, L.L. Ligand-induced IFNGR1 down-regulation calibrates myeloid cell IFNgamma responsiveness. Life Sci. Alliance 2019, 2. [Google Scholar] [CrossRef]
  39. Wiesolek, H.L.; Bui, T.M.; Lee, J.J.; Dalal, P.; Finkielsztein, A.; Batra, A.; Thorp, E.B.; Sumagin, R. Intercellular adhesion molecule 1 functions as an efferocytosis receptor in inflammatory macrophages. Am. J. Pathol. 2020, 190, 874–885. [Google Scholar] [CrossRef]
  40. Goebeler, M.; Roth, J.; Kunz, M.; Sorg, C. Expression of intercellular-adhesion molecule-1 by murine macrophage is up-regulated during differentiation and inflammatory activation. Immunobiology 1993, 188, 159–171. [Google Scholar] [CrossRef]
  41. Rui, Y.; Liu, X.; Li, N.; Jiang, Y.; Chen, G.; Cao, X.; Wang, J. PECAM-1 ligation negatively regulates TLR4 signaling in macrophages. J. Immunol. 2007, 179, 7344–7351. [Google Scholar] [CrossRef] [Green Version]
  42. Wang, N.; Liang, H.; Zen, K. Molecular mechanisms that influence the macrophage M1-M2 polarization balance. Front. Immunol. 2014, 5, 614. [Google Scholar] [CrossRef] [PubMed] [Green Version]
  43. Qian, F.; Deng, J.; Lee, Y.G.; Zhu, J.; Karpurapu, M.; Chung, S.; Zheng, J.-N.; Xiao, L.; Park, G.Y.; Christman, J.W. The transcription factor PU.1 promotes alternative macrophage polarization and asthmatic airway inflammation. J. Mol. Cell Biol. 2015, 7, 557–567. [Google Scholar] [CrossRef] [Green Version]
  44. Becker, M.; De Bastiani, M.A.; Parisi, M.M.; Guma, F.T.; Markoski, M.M.; Castro, M.A.; Kaplan, M.H.; Barbe-Tuana, F.M.; Klamt, F. Integrated transcriptomics establish macrophage polarization signatures and have potential applications for clinical health and disease. Sci. Rep. 2015, 5, 13351. [Google Scholar] [CrossRef] [PubMed] [Green Version]
  45. Martinez, F.O.; Helming, L.; Milde, R.; Varin, A.; Melgert, B.N.; Draijer, C.; Thomas, B.; Fabbri, M.; Crawshaw, A.; Ho, L.P.; et al. Genetic programs expressed in resting and IL-4 alternatively activated mouse and human macrophages: Similarities and differences. Blood 2013, 121, e57–e69. [Google Scholar] [CrossRef] [PubMed]
  46. Snodgrass, R.G.; Benatzy, Y.; Schmid, T.; Namgaladze, D.; Mainka, M.; Schebb, N.H.; Lutjohann, D.; Brune, B. Efferocytosis potentiates the expression of arachidonate 15-lipoxygenase (ALOX15) in alternatively activated human macrophages through LXR activation. Cell Death Differ. 2021, 28, 1301–1316. [Google Scholar] [CrossRef]
  47. Kang, B.Y.; Chung, S.W.; Kim, S.H.; Kang, S.N.; Choe, Y.K.; Kim, T.S. Retinoid-mediated inhibition of interleukin-12 production in mouse macrophages suppresses Th1 cytokine profile in CD4+ T cells. Br. J. Pharmacol. 2000, 130, 581–586. [Google Scholar] [CrossRef] [Green Version]
  48. Rhodes, J.; Oliver, S. Retinoids as regulators of macrophage function. Immunology 1980, 40, 467–472. [Google Scholar]
  49. Georgila, K.; Vyrla, D.; Drakos, E. Apolipoprotein A-I (ApoA-I), immunity, inflammation and cancer. Cancers 2019, 11, 1097. [Google Scholar] [CrossRef] [Green Version]
  50. Hartman, S.E.; Bertone, P.; Nath, A.K.; Royce, T.E.; Gerstein, M.; Weissman, S.; Snyder, M. Global changes in STAT target selection and transcription regulation upon interferon treatments. Genes Dev. 2005, 19, 2953–2968. [Google Scholar] [CrossRef] [Green Version]
  51. Baitsch, D.; Bock, H.H.; Engel, T.; Telgmann, R.; Müller-Tidow, C.; Varga, G.; Bot, M.; Herz, J.; Robenek, H.; von Eckardstein, A.; et al. Apolipoprotein E induces antiinflammatory phenotype in macrophages. Arter. Thromb. Vasc. Biol. 2011, 31, 1160–1168. [Google Scholar] [CrossRef] [PubMed] [Green Version]
  52. Grainger, D.J.; Reckless, J.; McKilligin, E. Apolipoprotein E modulates clearance of apoptotic bodies in vitro and in vivo, resulting in a systemic proinflammatory state in apolipoprotein E-deficient mice. J. Immunol. 2004, 173, 6366–6375. [Google Scholar] [CrossRef] [PubMed] [Green Version]
  53. Adam, I.; Dewi, D.L.; Mooiweer, J.; Sadik, A.; Mohapatra, S.R.; Berdel, B.; Keil, M.; Sonner, J.K.; Thedieck, K.; Rose, A.J.; et al. Upregulation of tryptophanyl-tRNA synthethase adapts human cancer cells to nutritional stress caused by tryptophan degradation. Oncoimmunology 2018, 7, e1486353. [Google Scholar] [CrossRef] [Green Version]
  54. Hasko, G.; Linden, J.; Cronstein, B.; Pacher, P. Adenosine receptors: Therapeutic aspects for inflammatory and immune diseases. Nat. Rev. Drug Discov. 2008, 7, 759–770. [Google Scholar] [CrossRef] [PubMed]
  55. Xu, Y.; Johansson, M.; Karlsson, A. Human UMP-CMP kinase 2, a novel nucleoside monophosphate kinase localized in mitochondria. J. Biol. Chem. 2008, 283, 1563–1571. [Google Scholar] [CrossRef] [PubMed] [Green Version]
  56. Ehlers, L.; Kuppe, A.; Damerau, A.; Wilantri, S.; Kirchner, M.; Mertins, P.; Strehl, C.; Buttgereit, F.; Gaber, T. Surface AMP deaminase 2 as a novel regulator modifying extracellular adenine nucleotide metabolism. FASEB J. 2021, 35, e21684. [Google Scholar] [CrossRef] [PubMed]
  57. Lorsbach, R.B.; Murphy, W.J.; Lowenstein, C.J.; Snyder, S.H.; Russell, S.W. Expression of the nitric oxide synthase gene in mouse macrophages activated for tumor cell killing. Molecular basis for the synergy between interferon-gamma and lipopolysaccharide. J. Biol. Chem. 1993, 268, 1908–1913. [Google Scholar] [CrossRef]
  58. Michelucci, A.; Cordes, T.; Ghelfi, J.; Pailot, A.; Reiling, N.; Goldmann, O.; Binz, T.; Wegner, A.; Tallam, A.; Rausell, A.; et al. Immune-responsive gene 1 protein links metabolism to immunity by catalyzing itaconic acid production. Proc. Natl. Acad. Sci. USA 2013, 110, 7820–7825. [Google Scholar] [CrossRef] [Green Version]
  59. Haschemi, A.; Kosma, P.; Gille, L.; Evans, C.R.; Burant, C.F.; Starkl, P.; Knapp, B.; Haas, R.; Schmid, J.A.; Jandl, C.; et al. The sedoheptulose kinase CARKL directs macrophage polarization through control of glucose metabolism. Cell Metab. 2012, 15, 813–826. [Google Scholar] [CrossRef] [Green Version]
  60. Mantovani, A.; Sica, A.; Sozzani, S.; Allavena, P.; Vecchi, A.; Locati, M. The chemokine system in diverse forms of macrophage activation and polarization. Trends Immunol. 2004, 25, 677–686. [Google Scholar] [CrossRef]
  61. Contin, C.; Pitard, V.; Itai, T.; Nagata, S.; Moreau, J.F.; Dechanet-Merville, J. Membrane-anchored CD40 is processed by the tumor necrosis factor-alpha-converting enzyme. Implications for CD40 signaling. J. Biol. Chem. 2003, 278, 32801–32809. [Google Scholar] [CrossRef] [PubMed] [Green Version]
  62. Marchesi, M.; Andersson, E.; Villabona, L.; Seliger, B.; Lundqvist, A.; Kiessling, R.; Masucci, G.V. HLA-dependent tumour development: A role for tumour associate macrophages? J. Transl. Med. 2013, 11, 247. [Google Scholar] [CrossRef] [PubMed] [Green Version]
  63. Mendez, M.P.; Morris, S.B.; Wilcoxen, S.; Greeson, E.; Moore, B.; Paine, R., 3rd. Shedding of soluble ICAM-1 into the alveolar space in murine models of acute lung injury. Am. J. Physiol. Lung Cell. Mol. Physiol. 2006, 290, 962–970. [Google Scholar] [CrossRef] [PubMed] [Green Version]
  64. Nepal, S.; Tiruppathi, C.; Tsukasaki, Y.; Farahany, J.; Mittal, M.; Rehman, J.; Prockop, D.J.; Malik, A.B. STAT6 induces expression of Gas6 in macrophages to clear apoptotic neutrophils and resolve inflammation. Proc. Natl. Acad. Sci. USA 2019, 116, 16513–16518. [Google Scholar] [CrossRef] [PubMed] [Green Version]
Figure 1. Induced pluripotent stem cell (iPSC)-derived monocytes and macrophages (MΦ). iPSC-derived monocytes were tested for the expression of monocyte markers, such as CD14, CD11b (A), and CD45 (B). iPSC derived monocytes were differentiated into macrophages in X-VIVO15 medium supplemented with M-CSF (100 ng/mL) for 7 days. Gating strategy for iPSC derived-MΦ (iPSDM) is shown (C,D). iPSDM were stained for the macrophage marker CD68 (E) and tested for their phagocytic activity using fluorescein conjugated Zymosan particles (F).
Biomedicines 10 00239 g001
Figure 2. Proteomic analyses of differentially polarised iPSDM. (A) Principal component analysis scores plot showing clustering of iPSDM according to their polarisation. (B) Histograms displaying the distribution of log2-transformed intensities of samples. (C) Scatter plots of protein copy numbers per cell show high correlation of biological replicates (Pearson’s coefficient close to 1). (D) Volcano plot showing fold changes in proteins using copy number vs. log p-values from mass spectrometry of M1 and M2 macrophages. (E) Volcano plot showing changes in concentrations vs. log p-values. (F) Venn diagram showing the number of proteins differentially expressed by polarised iPSDM. (G) Gene ontology analysis of the protein hits enriched in M1 iPSDM.
Biomedicines 10 00239 g002
Figure 3. Expression levels of CD markers and other membrane proteins. (A) Heat map showing concentrations (in nM) of membrane proteins across biological replicates (n = 3) of differentially polarised iPSDM. (BD) Graphs show the estimated copy numbers per cell using the proteomic ruler approach. p values: * 0.05, ** 0.01, **** 0.0001.
Biomedicines 10 00239 g003
Figure 4. Expression of novel polarisation markers in iPSDM. iPSC-derived monocytes were differentiated to MΦ for 7 days and polarised with IFNγ + LPS or IL-4 for 48 h. Polarised iPSDM were Fc blocked, stained for LILRB2, PILRA, CD300a, CD109, and Siglec-10 and analysed by FACS Canto. Representative of four independent experiments.
Biomedicines 10 00239 g004
Figure 5. Validation of expression of novel polarisation markers in monocyte-derived macrophages (MDM). Peripheral blood monocyte-derived monocytes were differentiated to MΦ for 7 days and polarised with IFNγ + LPS or IL-4 for 48 h. Polarised MDM were stained for LILRB2, PILRA, CD300a, CD109, and Siglec-10 and analysed by FACS Canto. Representative of four independent donors.
Biomedicines 10 00239 g005
Figure 6. Expression levels of MHC and cell adhesion molecules. Heat map showing concentrations (in nM) of HLAs (A) and adhesion molecules (C) across biological replicates of differentially polarised iPSDM. Graphs show the estimated copy numbers per cell of HLAs (B), integrins (D) and cell adhesion molecules (CAMs) (E) using a Proteomic ruler. p values: ** 0.01, *** 0.001, **** 0.0001.
Biomedicines 10 00239 g006
Figure 7. Differential expression levels of proteins involved in interferon (IFN) signalling. (A) Heat map showing differential expression of IFN regulated genes (concentrations in nM) across biological replicates of differentially polarised iPSDM. (BE) Graphs show the estimated copy numbers per cell using the proteomic ruler method. p values: * 0.05, ** 0.01, *** 0.001, **** 0.0001.
Biomedicines 10 00239 g007
Figure 8. Expression levels of metabolic pathway proteins. (A) Heat map showing differential expression of proteins involved in metabolic pathways across biological replicates of differentially polarised iPSDM. (B,C) Graph shows the estimated copy numbers per cell using the proteomic ruler approach. p values: ** 0.01, *** 0.001, **** 0.0001.
Biomedicines 10 00239 g008
Figure 9. Secretome analysis of polarised iPSDM. (A) Volcano plot showing fold change changes in secreted proteins using log-transformed iBAQ intensities vs. log-transformed p values. (B) Principal component analysis plot showing clustering of the iPSDM secretome according to polarisation. (C,D) Histograms showing iBAQ intensities of cytokines/chemokines and other immune modulators. p values: ** 0.01, *** 0.001, **** 0.0001.
Biomedicines 10 00239 g009
Publisher’s Note: MDPI stays neutral with regard to jurisdictional claims in published maps and institutional affiliations.

