
Lung Inflammation Predictors in Combined Immune Checkpoint-Inhibitor and Radiation Therapy—Proof-of-Concept Animal Study


Abstract
:1. Introduction
2. Materials and Methods
3. Results
4. Discussion
5. Conclusions
Supplementary Materials
Author Contributions
Funding
Institutional Review Board Statement
Informed Consent Statement
Data Availability Statement
Conflicts of Interest
References
- Baas, P.; Scherpereel, A.; Nowak, A.K.; Fujimoto, N.; Peters, S.; Tsao, A.S.; Mansfield, A.S.; Popat, S.; Jahan, T.; Antonia, S.; et al. First-line nivolumab plus ipilimumab in unresectable malignant pleural mesothelioma (CheckMate 743): A multicentre, randomised, open-label, phase 3 trial. Lancet 2021, 397, 375–386. [Google Scholar] [CrossRef]
- Borghaei, H.; Paz-Ares, L.; Horn, L.; Spigel, D.R.; Steins, M.; Ready, N.E.; Chow, L.Q.; Vokes, E.E.; Felip, E.; Holgado, E.; et al. Nivolumab versus Docetaxel in Advanced Nonsquamous Non-Small-Cell Lung Cancer. N. Engl. J. Med. 2015, 373, 1627–1639. [Google Scholar] [CrossRef] [PubMed]
- Brahmer, J.; Reckamp, K.L.; Baas, P.; Crino, L.; Eberhardt, W.E.; Poddubskaya, E.; Antonia, S.; Pluzanski, A.; Vokes, E.E.; Holgado, E.; et al. Nivolumab versus Docetaxel in Advanced Squamous-Cell Non-Small-Cell Lung Cancer. N. Engl. J. Med. 2015, 373, 123–135. [Google Scholar] [CrossRef] [Green Version]
- Forde, P.M.; Chaft, J.E.; Smith, K.N.; Anagnostou, V.; Cottrell, T.R.; Hellmann, M.D.; Zahurak, M.; Yang, S.C.; Jones, D.R.; Broderick, S.; et al. Neoadjuvant PD-1 Blockade in Resectable Lung Cancer. N. Engl. J. Med. 2018, 378, 1976–1986. [Google Scholar] [CrossRef] [PubMed]
- Frederickson, A.M.; Arndorfer, S.; Zhang, I.; Lorenzi, M.; Insinga, R.; Arunachalam, A.; Burke, T.A.; Simon, G.R. Pembrolizumab plus chemotherapy for first-line treatment of metastatic nonsquamous non-small-cell lung cancer: A network meta-analysis. Immunotherapy 2019, 11, 407–428. [Google Scholar] [CrossRef] [PubMed] [Green Version]
- Gandhi, L.; Rodriguez-Abreu, D.; Gadgeel, S.; Esteban, E.; Felip, E.; De Angelis, F.; Domine, M.; Clingan, P.; Hochmair, M.J.; Powell, S.F.; et al. Pembrolizumab plus Chemotherapy in Metastatic Non-Small-Cell Lung Cancer. N. Engl. J. Med. 2018, 378, 2078–2092. [Google Scholar] [CrossRef]
- Hellmann, M.D.; Paz-Ares, L.; Bernabe Caro, R.; Zurawski, B.; Kim, S.W.; Carcereny Costa, E.; Park, K.; Alexandru, A.; Lupinacci, L.; de la Mora Jimenez, E.; et al. Nivolumab plus Ipilimumab in Advanced Non-Small-Cell Lung Cancer. N. Engl. J. Med. 2019, 381, 2020–2031. [Google Scholar] [CrossRef]
- Horn, L.; Spigel, D.R.; Vokes, E.E.; Holgado, E.; Ready, N.; Steins, M.; Poddubskaya, E.; Borghaei, H.; Felip, E.; Paz-Ares, L.; et al. Nivolumab Versus Docetaxel in Previously Treated Patients With Advanced Non-Small-Cell Lung Cancer: Two-Year Outcomes From Two Randomized, Open-Label, Phase III Trials (CheckMate 017 and CheckMate 057). J. Clin. Oncol. 2017, 35, 3924–3933. [Google Scholar] [CrossRef]
- Paz-Ares, L.; Ciuleanu, T.E.; Cobo, M.; Schenker, M.; Zurawski, B.; Menezes, J.; Richardet, E.; Bennouna, J.; Felip, E.; Juan-Vidal, O.; et al. First-line nivolumab plus ipilimumab combined with two cycles of chemotherapy in patients with non-small-cell lung cancer (CheckMate 9LA): An international, randomised, open-label, phase 3 trial. Lancet Oncol. 2021, 22, 198–211. [Google Scholar] [CrossRef]
- Ready, N.; Hellmann, M.D.; Awad, M.M.; Otterson, G.A.; Gutierrez, M.; Gainor, J.F.; Borghaei, H.; Jolivet, J.; Horn, L.; Mates, M.; et al. First-Line Nivolumab Plus Ipilimumab in Advanced Non-Small-Cell Lung Cancer (CheckMate 568): Outcomes by Programmed Death Ligand 1 and Tumor Mutational Burden as Biomarkers. J. Clin. Oncol. 2019, 37, 992–1000. [Google Scholar] [CrossRef]
- Reck, M.; Rodriguez-Abreu, D.; Robinson, A.G.; Hui, R.; Csoszi, T.; Fulop, A.; Gottfried, M.; Peled, N.; Tafreshi, A.; Cuffe, S.; et al. Pembrolizumab versus Chemotherapy for PD-L1-Positive Non-Small-Cell Lung Cancer. N. Engl. J. Med. 2016, 375, 1823–1833. [Google Scholar] [CrossRef] [PubMed] [Green Version]
- Reck, M.; Schenker, M.; Lee, K.H.; Provencio, M.; Nishio, M.; Lesniewski-Kmak, K.; Sangha, R.; Ahmed, S.; Raimbourg, J.; Feeney, K.; et al. Nivolumab plus ipilimumab versus chemotherapy as first-line treatment in advanced non-small-cell lung cancer with high tumour mutational burden: Patient-reported outcomes results from the randomised, open-label, phase III CheckMate 227 trial. Eur. J. Cancer 2019, 116, 137–147. [Google Scholar] [CrossRef] [PubMed]
- Rittmeyer, A.; Barlesi, F.; Waterkamp, D.; Park, K.; Ciardiello, F.; von Pawel, J.; Gadgeel, S.M.; Hida, T.; Kowalski, D.M.; Dols, M.C.; et al. Atezolizumab versus docetaxel in patients with previously treated non-small-cell lung cancer (OAK): A phase 3, open-label, multicentre randomised controlled trial. Lancet 2017, 389, 255–265. [Google Scholar] [CrossRef]
- Champiat, S.; Dercle, L.; Ammari, S.; Massard, C.; Hollebecque, A.; Postel-Vinay, S.; Chaput, N.; Eggermont, A.; Marabelle, A.; Soria, J.C.; et al. Hyperprogressive Disease Is a New Pattern of Progression in Cancer Patients Treated by Anti-PD-1/PD-L1. Clin. Cancer Res. Off. J. Am. Assoc. Cancer Res. 2017, 23, 1920–1928. [Google Scholar] [CrossRef] [Green Version]
- Chen, D.S.; Mellman, I. Elements of cancer immunity and the cancer-immune set point. Nature 2017, 541, 321–330. [Google Scholar] [CrossRef]
- Demaria, S.; Golden, E.B.; Formenti, S.C. Role of Local Radiation Therapy in Cancer Immunotherapy. JAMA Oncol. 2015, 1, 1325–1332. [Google Scholar] [CrossRef]
- Marciscano, A.E.; Haimovitz-Friedman, A.; Lee, P.; Tran, P.T.; Tome, W.A.; Guha, C.; Spring Kong, F.M.; Sahgal, A.; El Naqa, I.; Rimner, A.; et al. Immunomodulatory Effects of Stereotactic Body Radiation Therapy: Preclinical Insights and Clinical Opportunities. Int. J. Radiat. Oncol. Biol. Phys. 2019, 110, 35–52. [Google Scholar] [CrossRef]
- Thompson, J.A.; Schneider, B.J.; Brahmer, J.; Andrews, S.; Armand, P.; Bhatia, S.; Budde, L.E.; Costa, L.; Davies, M.; Dunnington, D.; et al. NCCN Guidelines Insights: Management of Immunotherapy-Related Toxicities, Version 1.2020. J. Natl. Compr. Cancer Netw. 2020, 18, 230–241. [Google Scholar] [CrossRef] [Green Version]
- Naidoo, J.; Wang, X.; Woo, K.M.; Iyriboz, T.; Halpenny, D.; Cunningham, J.; Chaft, J.E.; Segal, N.H.; Callahan, M.K.; Lesokhin, A.M.; et al. Pneumonitis in Patients Treated With Anti-Programmed Death-1/Programmed Death Ligand 1 Therapy. J. Clin. Oncol. 2017, 35, 709–717. [Google Scholar] [CrossRef] [Green Version]
- Nishino, M.; Giobbie-Hurder, A.; Hatabu, H.; Ramaiya, N.H.; Hodi, F.S. Incidence of Programmed Cell Death 1 Inhibitor-Related Pneumonitis in Patients With Advanced Cancer: A Systematic Review and Meta-analysis. JAMA Oncol. 2016, 2, 1607–1616. [Google Scholar] [CrossRef] [Green Version]
- Mihaylov, I.B.; Montoya, C.; Spieler, B. Expanding Clinical Utilization of Checkpoint Inhibitors for Cancer Treatments Necessitates the Development of Predictive Models for Immunotherapy-Induced Pneumonitis. Biomed. J. Sci. Techn. Res. 2021, 36, 5827. [Google Scholar] [CrossRef]
- Theelen, W.; Peulen, H.M.U.; Lalezari, F.; van der Noort, V.; de Vries, J.F.; Aerts, J.; Dumoulin, D.W.; Bahce, I.; Niemeijer, A.N.; de Langen, A.J.; et al. Effect of Pembrolizumab After Stereotactic Body Radiotherapy vs Pembrolizumab Alone on Tumor Response in Patients With Advanced Non-Small Cell Lung Cancer: Results of the PEMBRO-RT Phase 2 Randomized Clinical Trial. JAMA Oncol. 2019, 5, 1276–1282. [Google Scholar] [CrossRef]
- Formenti, S.C.; Demaria, S. Combining radiotherapy and cancer immunotherapy: A paradigm shift. J. Natl. Cancer Inst. 2013, 105, 256–265. [Google Scholar] [CrossRef] [PubMed] [Green Version]
- Reynders, K.; Illidge, T.; Siva, S.; Chang, J.Y.; De Ruysscher, D. The abscopal effect of local radiotherapy: Using immunotherapy to make a rare event clinically relevant. Cancer Treat Rev. 2015, 41, 503–510. [Google Scholar] [CrossRef] [PubMed] [Green Version]
- Khan, S.; Gerber, D.E. Autoimmunity, checkpoint inhibitor therapy and immune-related adverse events: A review. Semin Cancer Biol. 2020, 64, 93–101. [Google Scholar] [CrossRef]
- Ahmad, A.; Totiger, T.M.; Benaduce, A.P.; Marples, B.; Mihaylov, I.B. Establishing Correlations between Breast Tumor Response to Radio-Immunotherapy and Radiomics from Multi-Parametric Imaging: An Animal Study. Appl. Sci. 2020, 10, 6493. [Google Scholar] [CrossRef]
- Gillies, R.J.; Kinahan, P.E.; Hricak, H. Radiomics: Images Are More than Pictures, They Are Data. Radiology 2016, 278, 563–577. [Google Scholar] [CrossRef] [Green Version]
- Lambin, P.; Rios-Velazquez, E.; Leijenaar, R.; Carvalho, S.; van Stiphout, R.G.P.M.; Granton, P.; Zegers, C.M.L.; Gillies, R.; Boellard, R.; Dekker, A.; et al. Radiomics: Extracting more information from medical images using advanced feature analysis. Eur. J. Cancer 2012, 48, 441–446. [Google Scholar] [CrossRef] [Green Version]
- Leijenaar, R.T.; Carvalho, S.; Velazquez, E.R.; van Elmpt, W.J.; Parmar, C.; Hoekstra, O.S.; Hoekstra, C.J.; Boellaard, R.; Dekker, A.L.; Gillies, R.J.; et al. Stability of FDG-PET Radiomics features: An integrated analysis of test-retest and inter-observer variability. Acta Oncol. 2013, 52, 1391–1397. [Google Scholar] [CrossRef] [Green Version]
- Nuovo, G.J.; Hagood, J.S.; Magro, C.M.; Chin, N.; Kapil, R.; Davis, L.; Marsh, C.B.; Folcik, V.A. The distribution of immunomodulatory cells in the lungs of patients with idiopathic pulmonary fibrosis. Mod. Pathol. 2012, 25, 416–433. [Google Scholar] [CrossRef] [Green Version]
- Engeroff, P.; Belbezier, A.; Monsel, A.; Klatzmann, D. Anakinra reduces lung inflammation in experimental acute lung injury. Immun. Inflamm. Dis. 2022, 10, 123–129. [Google Scholar] [CrossRef] [PubMed]
- De Vito, R.; Alisi, A.; Masotti, A.; Ceccarelli, S.; Panera, N.; Citti, A.; Salata, M.; Valenti, L.; Feldstein, A.E.; Nobili, V. Markers of activated inflammatory cells correlate with severity of liver damage in children with nonalcoholic fatty liver disease. Int. J. Mol. Med. 2012, 30, 49–56. [Google Scholar] [CrossRef] [PubMed]
- Keeley, E.C.; Mehrad, B.; Strieter, R.M. The role of circulating mesenchymal progenitor cells (fibrocytes) in the pathogenesis of fibrotic disorders. Thromb. Haemost. 2009, 101, 613–618. [Google Scholar] [CrossRef]
- Mihaylov, I.B.; Totiger, T.M.; Giret, T.M.; Wang, D.Z.; Spieler, B.; Welford, S. Toward prediction of abscopal effect in radioimmunotherapy: Pre-clinical investigation. PLoS ONE 2021, 16, e0255923. [Google Scholar] [CrossRef]
- Vanpouille-Box, C.; Alard, A.; Aryankalayil, M.J.; Sarfraz, Y.; Diamond, J.M.; Schneider, R.J.; Inghirami, G.; Coleman, C.N.; Formenti, S.C.; Demaria, S. DNA exonuclease Trex1 regulates radiotherapy-induced tumour immunogenicity. Nat. Commun. 2017, 8, 15618. [Google Scholar] [CrossRef] [PubMed]
- Bauckhage, C. NumPy/SciPy Recipes for Image Processing: Intensity Normalization and Histogram Equalization. Available online: https://www.researchgate.net/publication/281118372_NumPy_SciPy_Recipes_for_Image_Processing_Intensity_Normalization_and_Histogram_Equalization?channel=doi&linkId=55d73a6508aec156b9aa0758&showFulltext=true (accessed on 13 April 2022).
- Do, Q.N.; Lewis, M.A.; Madhuranthakam, A.J.; Xi, Y.; Bailey, A.A.; Lenkinski, R.E.; Twickler, D.M. Texture analysis of magnetic resonance images of the human placenta throughout gestation: A feasibility study. PLoS ONE 2019, 14, e0211060. [Google Scholar] [CrossRef] [PubMed] [Green Version]
- Loizou, C.P.; Pantziaris, M.; Pattichis, C.S.; Seimenis, I. Brain MR image normalization in texture analysis of multiple sclerosis. J. Biomed. Graph. Comput. 2012, 3, 929. [Google Scholar] [CrossRef]
- Spieler, B.; Azzam, G.; Asher, D.; Lopes, G.; Saravia, D.; Kwon, D.; Yechieli, R.; Dal Pra, A.; Diwanji, T.; Mihaylov, I.B. Overall Survival of Patients with Advanced NSCLC Treated with Nivolumab Correlates with Texture Features on Pre-Immunotherapy CT Imaging and Radiotherapy History. Int. J. Radiat. Oncol. 2019, 105, E531–E532. [Google Scholar] [CrossRef] [Green Version]
- Spieler, B.O.; Saravia, D.; Lopes, G.; Azzam, G.; Kwon, D.; Dal Pra, A.; Yechieli, R.; Diwanji, T.; Mihaylov, I. Can texture analysis of pre-immunotherapy CT imaging predict clinical outcomes for patients with advanced NSCLC treated with Nivolumab? J. Clin. Oncol. 2019, 37, e20720. [Google Scholar] [CrossRef]
- Colen, R.R.; Fujii, T.; Bilen, M.A.; Kotrotsou, A.; Abrol, S.; Hess, K.R.; Hajjar, J.; Suarez-Almazor, M.E.; Alshawa, A.; Hong, D.S.; et al. Radiomics to predict immunotherapy-induced pneumonitis: Proof of concept. Investig. New Drugs 2017, 36, 601–607. [Google Scholar] [CrossRef]
- Montoya, C.; Spieler, B.; Dal Pra, A.; Diwanji, T.; Yechieli, R.; Lopes, G.; Mihaylov, I.B. Can radiomics combined with clinical data predict checkpoint inhibitor pneumonitis? J. Clin. Oncol. 2021, 39, e14555. [Google Scholar] [CrossRef]
- Spieler, B.; Azzam, G.; Kwon, D.; Saravia, D.; Lopes, G.; Dal Pra, A.; Diwanji, T.; Yechieli, R.; Freedman, L.M.; Mihaylov, I.B. Checkpoint Inhibitor Pneumonitis in Patients with Advanced NSCLC on Nivolumab Monotherapy is Underreported and Associated with Prior Radiotherapy History. Int. J. Radiat. Oncol. 2020, 108, E89–E90. [Google Scholar] [CrossRef]
- Spieler, B.O.; Lopes, G.; Dal Pra, A.; Diwanji, T.; Yechieli, R.; Freedman, L.M.; Mihaylov, I. Is checkpoint inhibitor pneumonitis underreported in patients with advanced non-small cell lung cancer (NSCLC) on PD-1 inhibitor monotherapy? J. Clin. Oncol. 2020, 38, 9579. [Google Scholar] [CrossRef]
- Mandrekar, J.N. Receiver operating characteristic curve in diagnostic test assessment. J. Thorac. Oncol. Off. Publ. Int. Assoc. Study Lung Cancer 2010, 5, 1315–1316. [Google Scholar] [CrossRef] [Green Version]
- Catacchio, I.; Scattone, A.; Silvestris, N.; Mangia, A. Immune Prophets of Lung Cancer: The Prognostic and Predictive Landscape of Cellular and Molecular Immune Markers. Transl. Oncol. 2018, 11, 825–835. [Google Scholar] [CrossRef]
- Cupp, M.A.; Cariolou, M.; Tzoulaki, I.; Aune, D.; Evangelou, E.; Berlanga-Taylor, A.J. Neutrophil to lymphocyte ratio and cancer prognosis: An umbrella review of systematic reviews and meta-analyses of observational studies. BMC Med. 2020, 18, 360. [Google Scholar] [CrossRef]
- Ethier, J.L.; Desautels, D.; Templeton, A.; Shah, P.S.; Amir, E. Prognostic role of neutrophil-to-lymphocyte ratio in breast cancer: A systematic review and meta-analysis. Breast Cancer Res. 2017, 19, 2. [Google Scholar] [CrossRef] [Green Version]
- Gustafson, M.P.; Bornschlegl, S.; Park, S.S.; Gastineau, D.A.; Roberts, L.R.; Dietz, A.B.; Hallemeier, C.L. Comprehensive assessment of circulating immune cell populations in response to stereotactic body radiation therapy in patients with liver cancer. Adv. Radiat. Oncol. 2017, 2, 540–547. [Google Scholar] [CrossRef] [Green Version]


| Group | Number Mice | Min | Max | Average | Median | Standard Deviation |
|---|---|---|---|---|---|---|
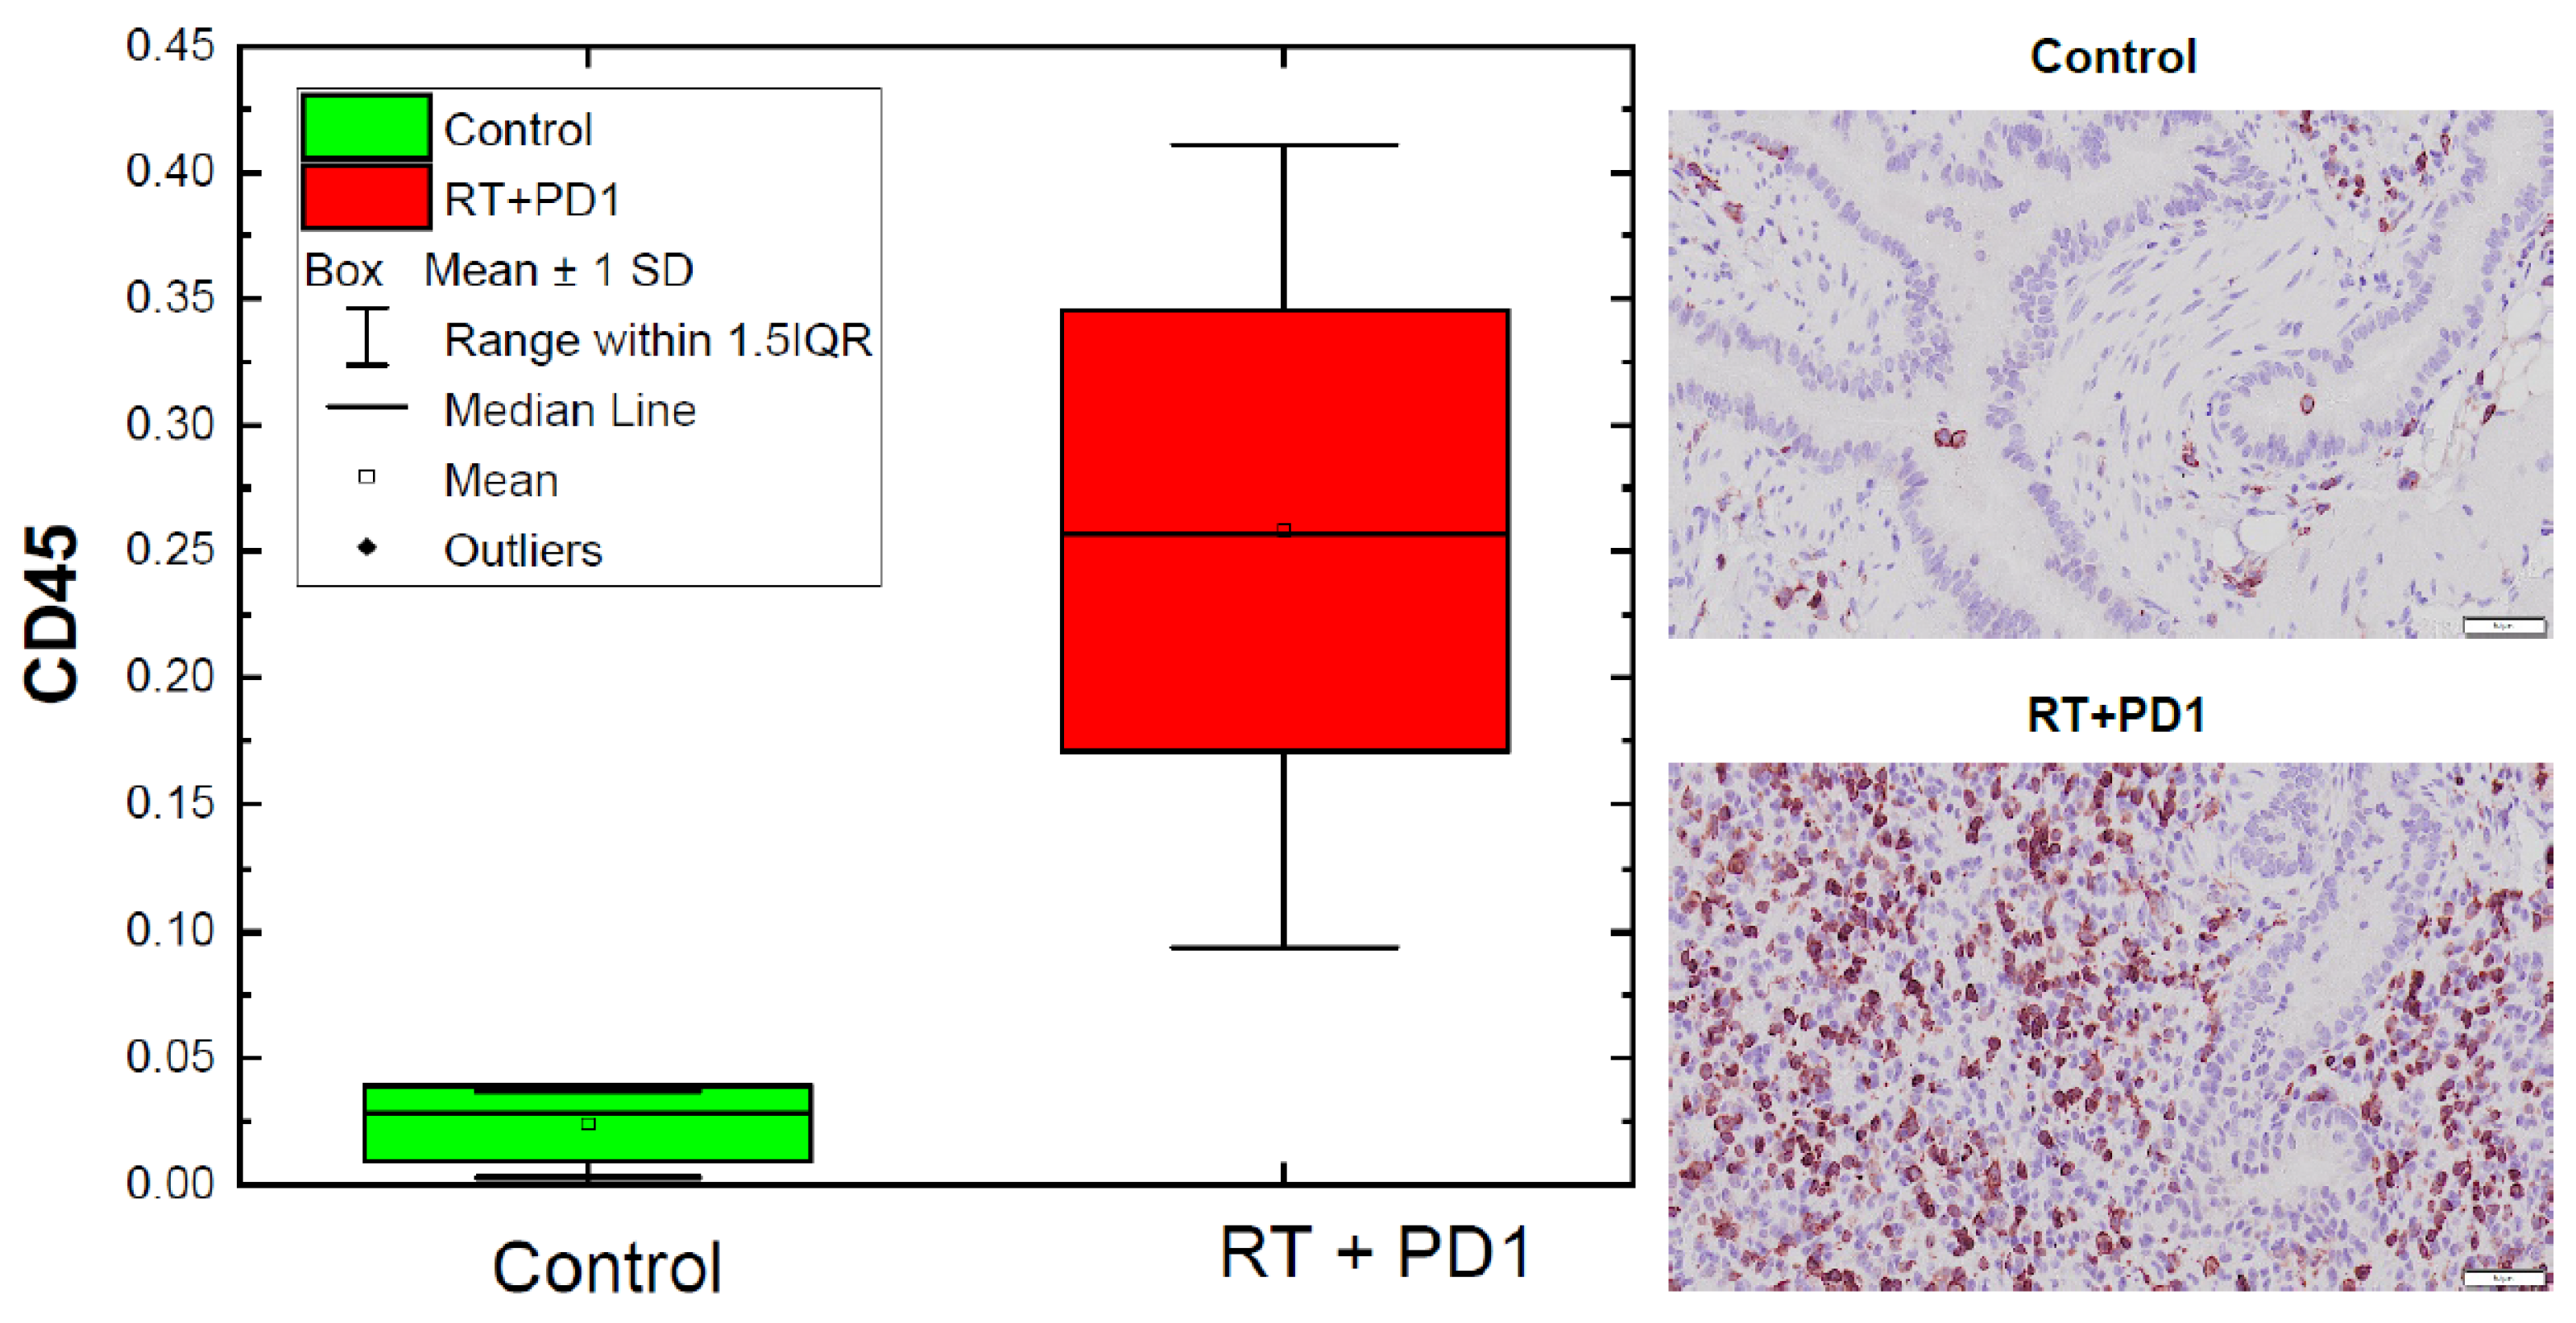
| Control | 4 | 0.003 | 0.037 | 0.024 | 0.028 | 0.015 |
| All treated | 15 | 0.094 | 0.411 | 0.258 | 0.257 | 0.087 |
| Low inflammation | 7 | 0.094 | 0.217 | 0.176 | 0.195 | 0.041 |
| High inflammation | 8 | 0.263 | 0.411 | 0.324 | 0.327 | 0.055 |
| CBC Type | Min | Max | Average | Median |
|---|---|---|---|---|
| WBC (103/µL) | 0.98 | 7.95 | 5.246 | 5.38 |
| Neu # (103/µL) | 0.37 | 3.09 | 1.823 | 1.82 |
| Lym # (103/µL) | 0.53 | 4.43 | 2.994 | 3.07 |
| Mon # (103/µL) | 0.05 | 0.42 | 0.249 | 0.26 |
| Eos # (103/µL) | 0.02 | 0.28 | 0.115 | 0.11 |
| Bas # (103/µL) | 0.01 | 0.12 | 0.064 | 0.06 |
| Neu% (%) | 26.4 | 42.2 | 34.493 | 33.8 |
| Lym% (%) | 48.1 | 65.5 | 56.86 | 57 |
| Mon% (%) | 2.2 | 8 | 4.94 | 5.1 |
| Eos% (%) | 0.8 | 5.7 | 2.4 | 2.2 |
| Bas% (%) | 0.5 | 1.8 | 1.3 | 1.4 |
| RBC (106/µL) | 1.79 | 8.43 | 6.762 | 7.18 |
| HGB (g/dL) | 4 | 13.4 | 10.9 | 11.7 |
| HCT (%) | 8.8 | 42.4 | 34.07 | 36 |
| MCV (fL) | 48.5 | 52.7 | 50.38 | 50.2 |
| MCH (pg) | 15.6 | 22.6 | 16.43 | 15.9 |
| MCHC (g/dL) | 29.9 | 45.5 | 32.62 | 31.7 |
| RDW-CV (%) | 12.9 | 23.3 | 18.473 | 18.3 |
| PLT (103/µL) | 184 | 1137 | 769.466 | 856 |
| MPV (fL) | 5.1 | 5.9 | 5.5133 | 5.6 |
| NLR | 0.404 | 0.873 | 0.618 | 0.641 |
| Cytokine | Min | Max | Average | Median |
|---|---|---|---|---|
| KC (A5) | 33.345 | 380.18 | 138.93 | 95.16 |
| TNF-α (A6) | 3.77 | 29.59 | 12.75719 | 11.465 |
| MCP-1 (A7) | 232.235 | 2362.09 | 1190.526 | 1211.983 |
| RANTES (A10) | 41.355 | 41.355 | 41.355 | 41.355 |
| IL-1β (B2) | 4.87 | 29.22 | 10.61281 | 9.4725 |
| IP-10 (B3) | 82.44 | 512.41 | 320.8675 | 331.5525 |
| GM-CSF (B4) | 8.54 | 15.54 | 10.69313 | 9.905 |
| Feature | Min | Max | Average | Median | Standard Deviation | p-Value |
|---|---|---|---|---|---|---|
| NLR low/high | 0.5/0.4 | 0.9/0.7 | 0.7/0.6 | 0.6/0.5 | 0.1/0.1 | 0.035 |
| GM-CSF low/high | 8.5/8.5 | 10.1/14.5 | 8.8/11.7 | 8.5/11.6 | 0.6/2.2 | 0.005 |
| CT average gray low/high | 265.1/255.9 | 291.2/309.9 | 278.4/289.9 | 277.4/292.2 | 9.0/15.3 | 0.104 |
| CT histogram kurtosis low/high | 1.9/2.2 | 3.0/6.6 | 2.6/3.8 | 2.7/3.3 | 0.4/1.7 | 0.093 |
| CT co-occurrence matrix entropy low/high | 11.9/12.2 | 12.3/12.5 | 12.1/12.3 | 12.2/12.3 | 0.1/0.1 | 0.012 |
| MR histogram kurtosis low/high | 1.8/2.1 | 10.4/6.8 | 6.1/3.7 | 7.4/3.3 | 3.3/1.6 | 0.091 |
Publisher’s Note: MDPI stays neutral with regard to jurisdictional claims in published maps and institutional affiliations. |
© 2022 by the authors. Licensee MDPI, Basel, Switzerland. This article is an open access article distributed under the terms and conditions of the Creative Commons Attribution (CC BY) license (https://creativecommons.org/licenses/by/4.0/).
Share and Cite
Spieler, B.; Giret, T.M.; Welford, S.; Totiger, T.M.; Mihaylov, I.B. Lung Inflammation Predictors in Combined Immune Checkpoint-Inhibitor and Radiation Therapy—Proof-of-Concept Animal Study. Biomedicines 2022, 10, 1173. https://0-doi-org.brum.beds.ac.uk/10.3390/biomedicines10051173
Spieler B, Giret TM, Welford S, Totiger TM, Mihaylov IB. Lung Inflammation Predictors in Combined Immune Checkpoint-Inhibitor and Radiation Therapy—Proof-of-Concept Animal Study. Biomedicines. 2022; 10(5):1173. https://0-doi-org.brum.beds.ac.uk/10.3390/biomedicines10051173
Chicago/Turabian StyleSpieler, Benjamin, Teresa M. Giret, Scott Welford, Tulasigeri M. Totiger, and Ivaylo B. Mihaylov. 2022. "Lung Inflammation Predictors in Combined Immune Checkpoint-Inhibitor and Radiation Therapy—Proof-of-Concept Animal Study" Biomedicines 10, no. 5: 1173. https://0-doi-org.brum.beds.ac.uk/10.3390/biomedicines10051173