Article

Investigation of the lncRNA THOR in Mice Highlights the Importance of Noncoding RNAs in Mammalian Male Reproduction

1
Key Lab for Zoonoses Research, Ministry of Education, College of Animal Sciences, Jilin University, Changchun 130062, China
2
Chongqing Research Institute, Jilin University, Chongqing 401123, China
*
Authors to whom correspondence should be addressed.
These authors contributed equally to this work.
Submission received: 31 May 2021 / Revised: 4 July 2021 / Accepted: 14 July 2021 / Published: 22 July 2021
(This article belongs to the Topic Animal Model in Biomedical Research)

Abstract

:
THOR is a highly conserved testis-specific long noncoding RNA (lncRNA). The interaction between THOR and the development of the male reproductive system remains unclear. Herein, CRISPR/Cas9 technology was used to establish a stable THOR-deficient mouse model, and the relationship between THOR and the fertility of adult male mice was investigated. The male mice in which THOR was deleted were smaller than the WT male mice. Moreover, their survival rate was reduced by 60%, their fertility was reduced by 50%, their testicular size and sperm motility were reduced by 50%, their testicular cell apoptosis was increased by 7-fold, and their ratio of female-to-male offspring was imbalanced (approximately 1:3). Furthermore, to elucidate the mechanisms of male reproductive system development, the mRNA levels of THOR targets were measured by qRT-PCR. Compared with WT mice, the THOR-deficient mice exhibited significantly decreased mRNA levels of IGF2BP1, c-MYC, IGF1, and IGF2. MEK-ERK signaling pathway expression was downregulated as determined by Western blot. We found that THOR targeted the MER-ERK signaling pathway downstream of IGF2 by binding to IGF2BP1 and affected testicular and sperm development in male mice. These results may also provide perspectives for exploring the roles of lncRNAs in human reproductive development and the pathogenesis and potential therapeutic targets of infertility.
Keywords:
THOR; testis; sperm; MEK-ERK; mice

1. Introduction

Approximately 75% of the genes in mammalian genomes can be transcribed, but less than 2% have the ability to encode proteins [1,2]. Most transcripts that do not encode proteins are called noncoding RNAs and include short and long noncoding RNAs (lncRNAs) [3,4]. RNAs with more than 200 nt account for most noncoding RNAs and have the most complex functions [5]. LncRNAs were previously described as “junk” genes that do not participate in the mechanisms of individual regulatory networks [6,7]. Recent studies have confirmed that lncRNAs can act as molecular signals, scaffolds, or enhancers/inhibitors to regulate important cell behaviors, including survival, growth, proliferation, and apoptosis resistance [8,9]. The molecular mechanisms of cancer/testis lncRNAs in cancer metastasis are largely unknown and need to be fully elucidated [10].
The lncRNA testis-associated highly conserved oncogenic long non-coding RNA (THOR) was the first cancer/testicular lncRNA to be identified and was further shown to have a conserved interaction with insulin-like growth factor 2 mRNA binding protein 1 (IGF2BP1) and to contribute to the mRNA stabilization activity of IGF2BP1. THOR deficiency caused fertilization defects in zebrafish and conferred resistance to melanoma onset [11]. The THOR represents a novel class of functionally important cancer/testis lncRNAs that have undergone positive evolutionary selection for structure and function [11]. These previous studies have indicated that the THOR plays an important role in male reproductive system development.
RNA binding proteins (RBPs) regulate genes via a variety of mechanisms [12]. IGF2BP1 is a member of the conserved single-stranded RBP family, which plays important roles in gene expression regulation [13,14]. The structural characteristics of IGF2BP1 enable it to bind to a variety of target mRNAs, including c-MYC, IGF2, and IGF1, in the context of THOR expression regulation [15].
Insulin-like growth factor 2 (IGF2) is the first endogenous imprinted gene identified that specifically expresses paternal alleles in most human tissues, while maternal alleles are imprinted [16]. During early embryonic development and sperm development, the IGF2 expression product IGF is an embryonic growth factor and mitotic peptide that plays an important role in the normal growth and development of embryos [17,18], and IGF2 is an important growth factor during spermatogenesis [19,20].
In the nonclassical regulatory androgen network, the MEK and ERK kinases participate in the MAP kinase phosphorylation cascade [21,22]. MEK can activate ERK kinase and affect the existence and development of normal sperm in the testis [23], and the MEK-ERK signaling pathway is downstream of IGF2 [24]. Numerous studies have shown that THOR stabilizes the expression of its downstream mRNA targets by binding IGF2BP1 [25,26], and THOR expression was positively correlated with the mRNA expression of IGF2BP1 [27]. However, the relationship of THOR with IGF2BP1 during testis and sperm development is unclear.
We successfully constructed THOR-deficient mice using CRISPR/Cas9 technology and found that the expression levels of THOR and IGF2BP1 were decreased in testicular tissues, that testicular development was defective, and that sperm maturation was decreased significantly. In addition, THOR regulated the downstream IGF2BP1-IGF2-MEK-ERK signaling pathway together with IGF2BP1, which affected testicular and sperm development. Our findings further elucidate the relationship between lncRNAs and reproductive system development and provide ideas for the treatment of male infertility.

2. Materials and Methods

2.1. Animals and Ethical Statement

All mouse experiments in this study were approved by the animal protection and research ethics committee of Jilin University, and all procedures were strictly in accordance with the guidelines for the care and use of laboratory animals. Specific pathogen-free C57/BL6 mice were purchased from Liaoning Changsheng Biotechnology Co., Ltd. (Benxi, China) and raised at the experimental animal center of Jilin University. All animal operations were performed under anesthesia, and every effort was made to minimize pain.

2.2. CRISPR/Cas9 sgRNA Preparation, Embryo Microinjection, and Embryo Transfer

The CRISPR/Cas9 sgRNA was designed (http://crispr.mit.edu/ accessed on 1 July 2021) and assembled as previously described [28]. The annealed sgRNA oligos were cloned into the BbsI sites of the pUC57-T7-sgRNA cloning vector (Addgene ID 51306) as previously described [29]. The pUC57-T7-sgRNA vector was PCR amplified using T7 primers (T7-F: 5′-GAAATTAATACGACTCACTATA-3′ and T7-R: 5′-AAAAAAAGCACCGACTCGGTGCCAC-3′), and the PCR products were transcribed in vitro with the MAXIscript T7 Kit (Ambion, Austin, TX, USA) and purified with the miRNeasy Mini Kit (Qiagen, Dusseldorf, Germany) in accordance with the manufacturers’ instructions. The 3xFLAG-NLS-SpCas9-NLS vector (Addgene ID 48137) was linearized with NotI (NEB, Beijing, China) and transcribed in vitro using the mMessage mMachine SP6 Kit (Ambion, Austin, TX, USA) and the RNeasy Mini Kit (Qiagen, Dusseldorf, Germany) in accordance with the manufacturers’ instructions. The microinjection and embryo transfer procedures were performed essentially as we previously described [30].

2.3. Detection of THOR Deletion in Mouse Pups by PCR and Sequencing

Genomic DNA was extracted from small pieces of tail tissues from THOR-deficient and WT mice using the TIANamp Genomic DNA Kit (Tiangen, Beijing, China) in accordance with the manufacturer’s instructions. The sgRNA target sites were amplified by PCR using primers shown in Table S3. The PCR product was gel purified and cloned into the pGM-T vector (Tiangen, Beijing, China), and DNAman was then used for sequencing and analysis.

2.4. T7E1 Cleavage Assay

The T7E1 cleavage assay was performed as described previously [31]. Briefly, the PCR products were purified, denatured, and then reannealed in NEBuffer 2 (NEB, Beijing, China) using a thermocycler. Hybridized PCR products were digested with T7 endonuclease 1 (NEB, Beijing, China, M0302L) for 30 min at 37 °C and subjected to 2% agarose gel electrophoresis.

2.5. Off-Target Analysis

The top off-target sites were predicted using the online CRISPR Design tool developed by the Zhang group at the Massachusetts Institute of Technology (http://crispr.mit.edu/ accessed on 1 July 2021). The PCR products of these potential off-target sites obtained using the primers listed in Table S1 were subjected to the T7E1 assay and Sanger sequencing.

2.6. RNA Isolation and qRT-PCR

Total RNA was isolated from the testes of WT and THOR-deficient mice using TRIzol-A+ reagent (Tiangen, Beijing, China) and treated with DNase I (Fermentas, Burlington, Ontario, Canada, EN0525). First-strand complementary DNA (cDNA) was synthesized using a cDNA first-strand synthesis kit (Tiangen, Beijing, China) and then subjected to qRT-PCR to examine the expression of THOR. The primers used for qRT-PCR are shown in Table S3. qRT-PCR was performed using the BioEasy SYBR Green I Real Time PCR Kit (Bioer Technology, Hangzhou, China), and relative gene expression levels were determined by the 2-ΔΔCT method formula. GAPDH was used as the reference gene. All experiments were repeated three times, and the data were expressed as the mean ± SD.

2.7. Body Weight, Food Intake, Survival, and Statistical Analyses

The body weights and food intake of age- and sex-matched WT and THOR-deficient mice were measured weekly. All data were expressed as the mean ± SD., and a minimum of three individual animals of each genotype was used in all experiments. The data were analyzed by Student’s t-test using GraphPad Prism 8.0 software. A probability of p < 0.05 was considered statistically significant.

2.8. Hormone Level Analysis

In total, 200 µL of blood was harvested from the tail tip of 8-week-old THOR-deficient and WT mice and centrifuged at 1000 rpm/min at 4 °C for 10 min to collect the serum (at least 3 mice per group). The T and LH hormone levels in the serum samples were determined using ELISA kits (NJJCBIO, Nanjing, China). A probability of p < 0.05 was considered statistically significant.

2.9. Histological Analysis

Various tissues, including testicular, epididymal, vas deferens, seminal vesicle, and bladder tissues, were collected from THOR-deficient and WT mice (euthanized at 8 weeks of age). The tissues were fixed in 4% paraformaldehyde at 4 °C, dehydrated in increasing concentrations of ethanol (70% for 6 h, 80% for 1 h, 96% for 1 h, and 100% for 3 h), cleared in xylene, and embedded in paraffin for histological examination. The 5-μm-thick sections were cut for H&E and TUNEL staining as previously described. The stained sections were imaged with a Nikon TS100 microscope.

2.10. Morphological Analysis of Testes

H&E-stained cross-sections of testes from 8-week-old THOR-deficient and WT mice were analyzed for seminiferous tube size. A minimum of three different regions were analyzed per section. The seminiferous tube size and cross-sectional area were calculated using ImagePro Plus 6.0 software (Media Cybernetics, Silver Spring, MD, USA). Apoptosis analysis was performed on TUNEL-stained testicular cross-sections from 8-week-old THOR-deficient and WT mice. A minimum of three different regions were analyzed per section. The number of apoptotic seminiferous cells was calculated using ImagePro Plus 6.0 software (Media Cybernetics, Silver Spring, MD, USA).

2.11. Detection and Analysis of Offspring Fertility

Pairs of THOR-deficient and WT mice (THOR-deficient and THOR-deficient; THOR-deficient and WT; 1:1 female-to-male ratio; three pairs of repeats in each group) were housed together in cages for approximately 6 months. The fertility and female-to-male ratios of the mice were compared. After the THOR-deficient and WT mice were divided into cages, the embryos of female mice with vaginal plugs were collected, and the fetuses were cultured in vitro to develop blastocysts. At least three pairs were analyzed in each group.

2.12. Embryonic Development and Statistical Analyses

WT fertilized eggs were cytoplasmically injected to delete THOR, and embryonic development in the THOR-deficient mice was examined. The experiments were repeated three times, and each group had approximately 100 fertilized eggs. The statistical results were analyzed with GraphPad Prism 8.0. A probability of p < 0.05 was considered statistically significant.

2.13. Sperm Motility and Morphological Analysis

Sperm were taken from the epididymal tails of 8-week-old male THOR-deficient and WT mice and suspended in HTF medium (Sigma, St. Louis, MO, USA). The sperm were counted on a blood cell counting plate under a Nikon TS100 microscope. The sperm suspension was used to make a sperm smear, and eosin-nigrosin staining was performed to observe deformity under a microscope.

2.14. In Vitro Fertilization (IVF)

Superovulation was induced in C57BL/6 female mice (4 weeks old) via intraperitoneal injections of pregnant mare serum gonadotrophin (PMSG) on day 1 and human chorionic gonadotropin (hCG) on day 3. On day 4, male mice were sacrificed, and the cauda epididymis was quickly removed, allowing the sperm capacitates to be incubated for 1 h prior to insemination. During this period, the superovulated female mouse was sacrificed, and the ampullae were quickly removed and placed in a fertilization dish (FERTIUP PM 0.5 ML-CARD MEDIUM set, KYD-005-EX) to collect the cumulus-oocyte complexes (COCs). The sperm were added to the fertilization dish including the COCs or cumulus-free oocytes using a pipette, and dish was incubated for approximately 3 h at 37 °C. The embryos were then removed from the fertilization dish and washed 3 times with HTF. The KSOM drops covered with paraffin oil were incubated overnight at 37 °C, and the number of embryos in the two-cell stage was determined on day 5.

2.15. Protein Isolation and Western Blotting

Total protein was extracted from tissues using radioimmunoprecipitation assay (RIPA) lysis buffer supplemented with phenylmethanesulfonyl fluoride (PMSF, Roche Applied Science, Basel, Switzerland) and phosphatase inhibitor (PI, Thermo Scientific, Waltham, MA, USA). The protein concentration was measured using an enhanced BCA protein assay kit (Beyotime, P0010, Shanghai, China). Total protein extracts were separated on 10% gels via SDS-PAGE and then transferred to 0.22 nm polyvinylidene fluoride membranes (Millipore, Burlington, MA, USA). The proteins were probed with specific antibodies after the blot was blocked with 5% non-fat milk (Boster, AR0104, Wuhan, China). The antibodies used in this study are listed in Supplemental Table S4.

2.16. Statistical Analysis

Significant differences were determined via a two-tailed unpaired Student’s t-test or analysis of variance using GraphPad Prism 8.0. The data were expressed as the mean ± SD. * p < 0.05, ** p < 0.01, *** p < 0.001 and **** p < 0.0001 denoted the significance thresholds; ns denoted not significant.

3. Results

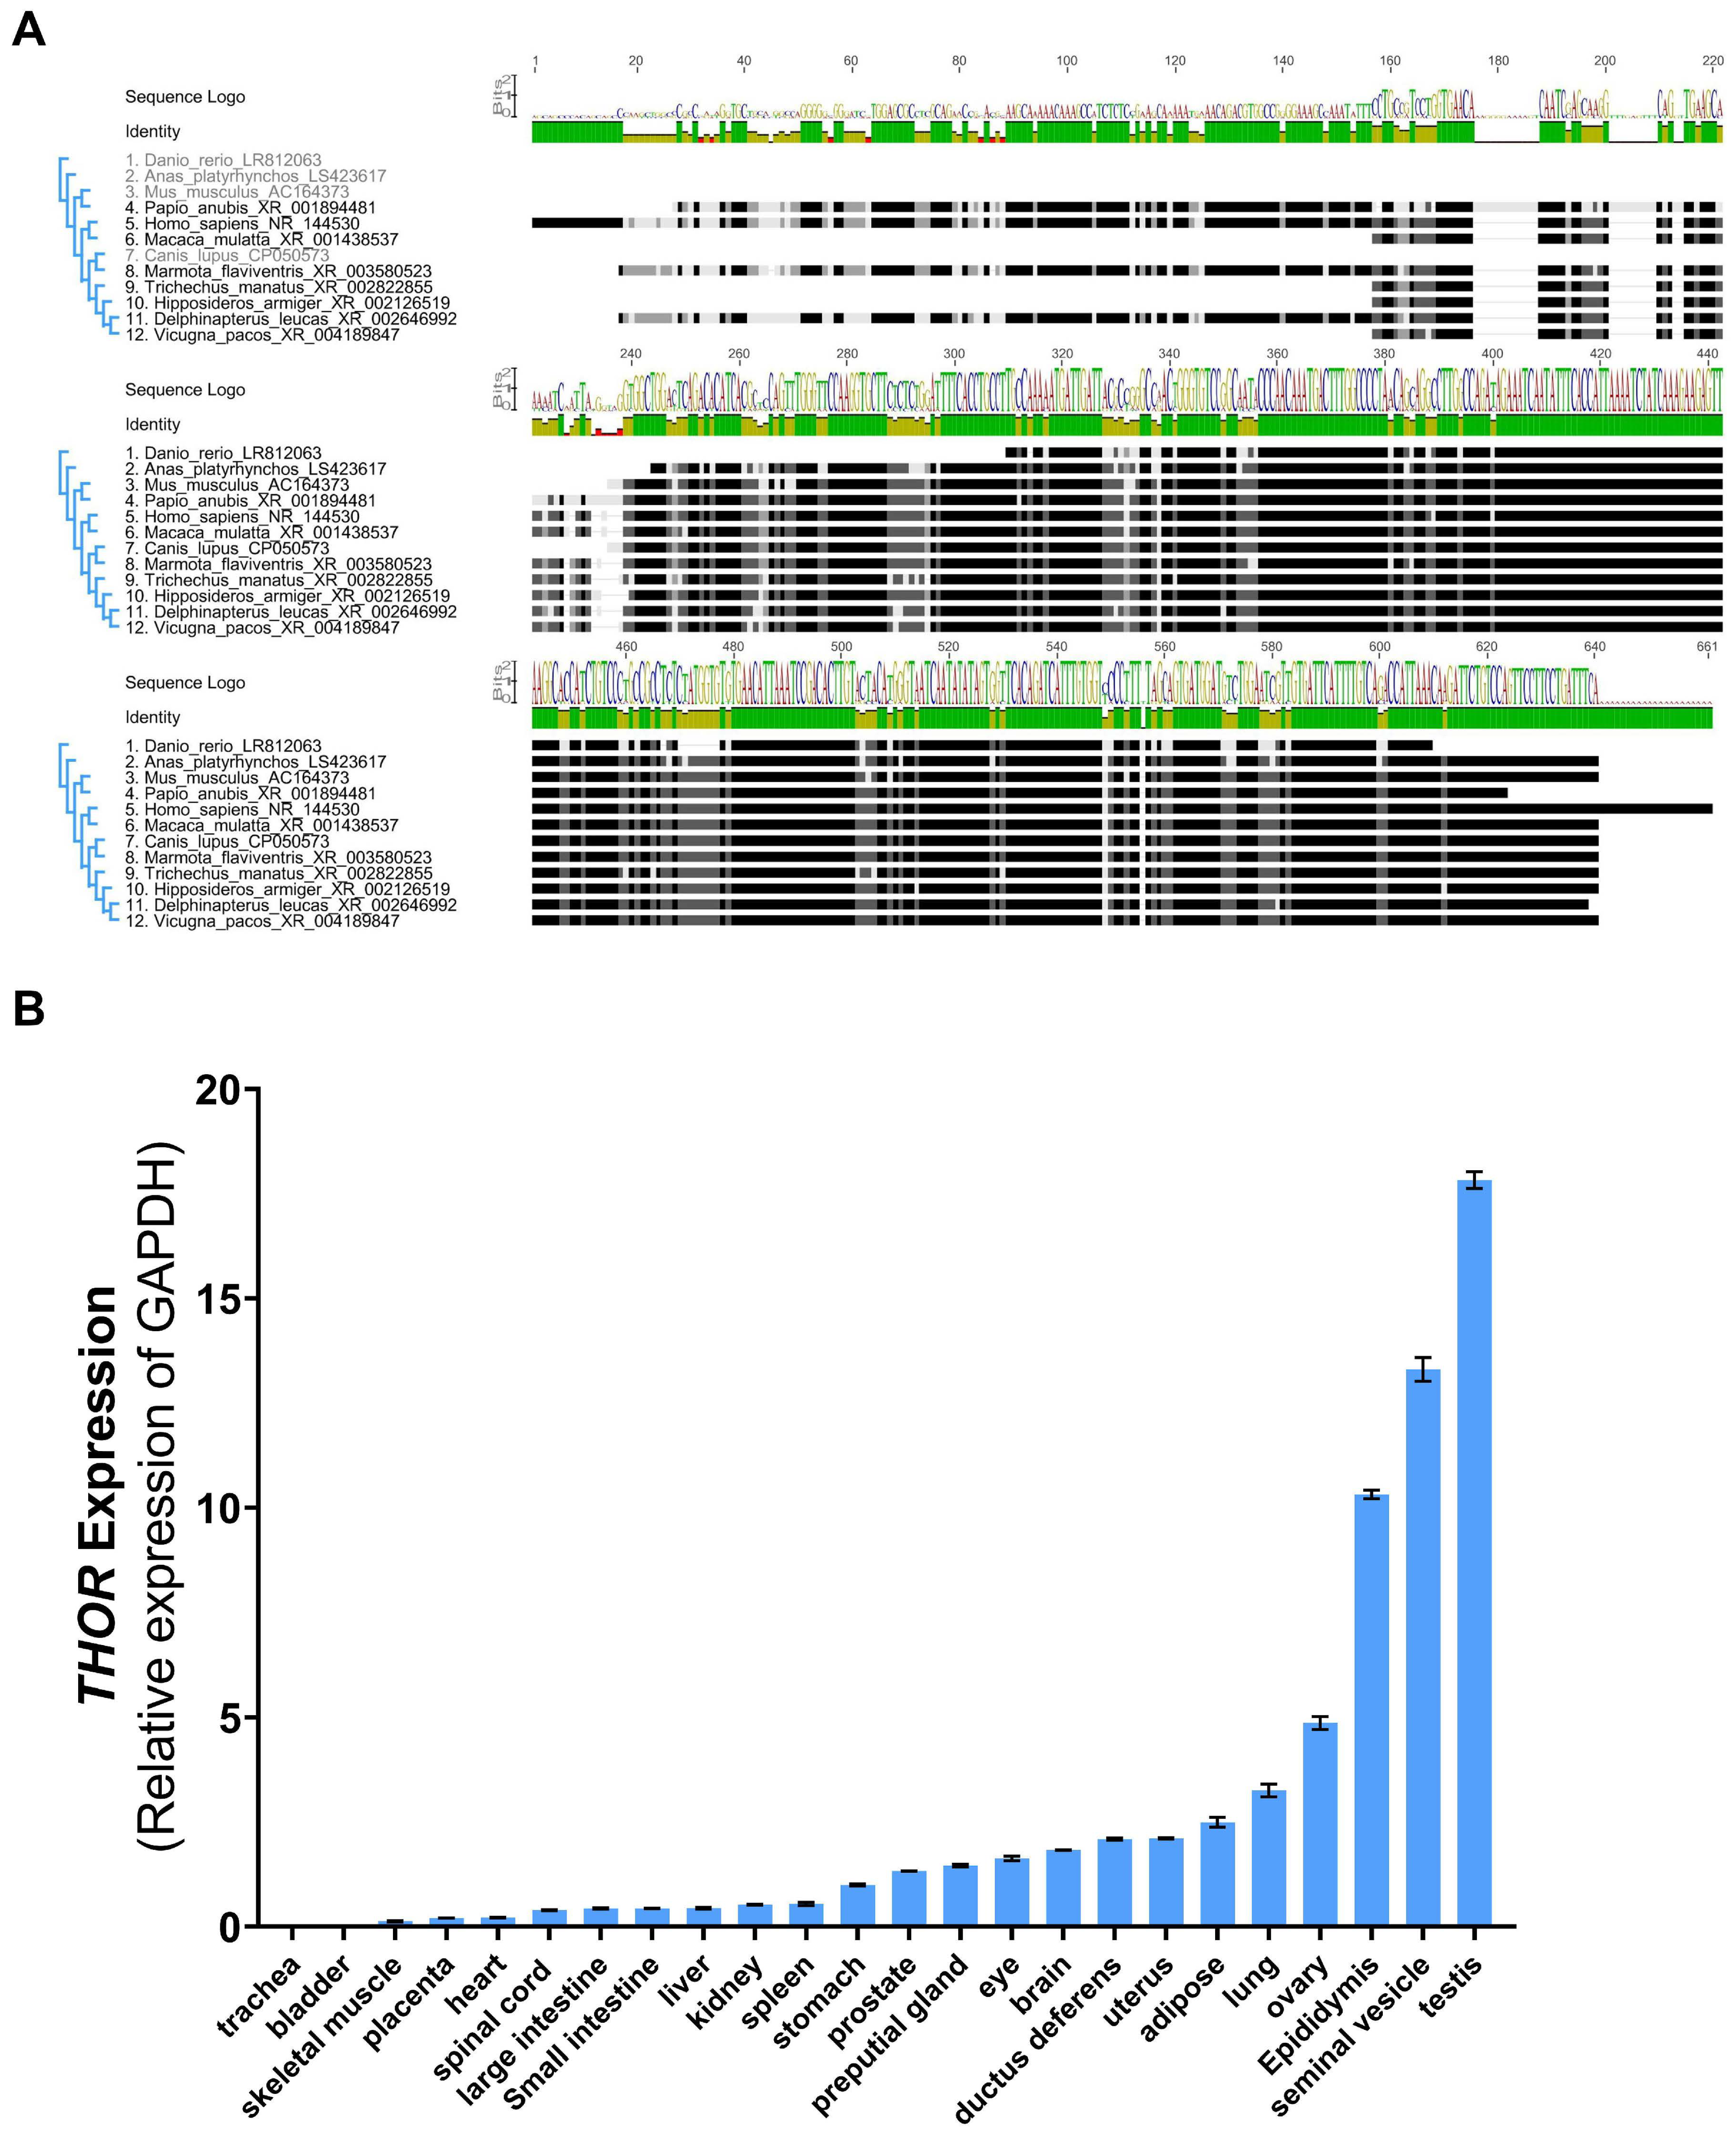
3.1. Evolutionary Relationship and Tissue Conservation of THOR in Vertebrates

We aligned the human THOR sequence with 11 representative orthologous sequences using BLAST and revealed high conversation in vertebrates. The neighbor-joining tree further showed that THOR first originated in fish and that mouse THOR was most closely related to primate species (humans, macaques, baboons) (Figure 1A). Next, we predicted regions that are homologous to the human THOR in the genomes of 4 commonly used experimental animals (mice, pigs, rabbits, and zebrafish) and identified 2 exon homologues. We thus showed that THOR is highly conserved in various species (Figure S1). Quantitative real-time PCR (qRT-PCR) was used to detect THOR expression in 24 tissues and organs of adult mice, further revealing that THOR has high testicular specificity. The expression trends were consistent with those reported in a previous study (Figure 1B). In vertebrates, the testicular expression of THOR was highly conserved and had a substantial impact on male reproduction.

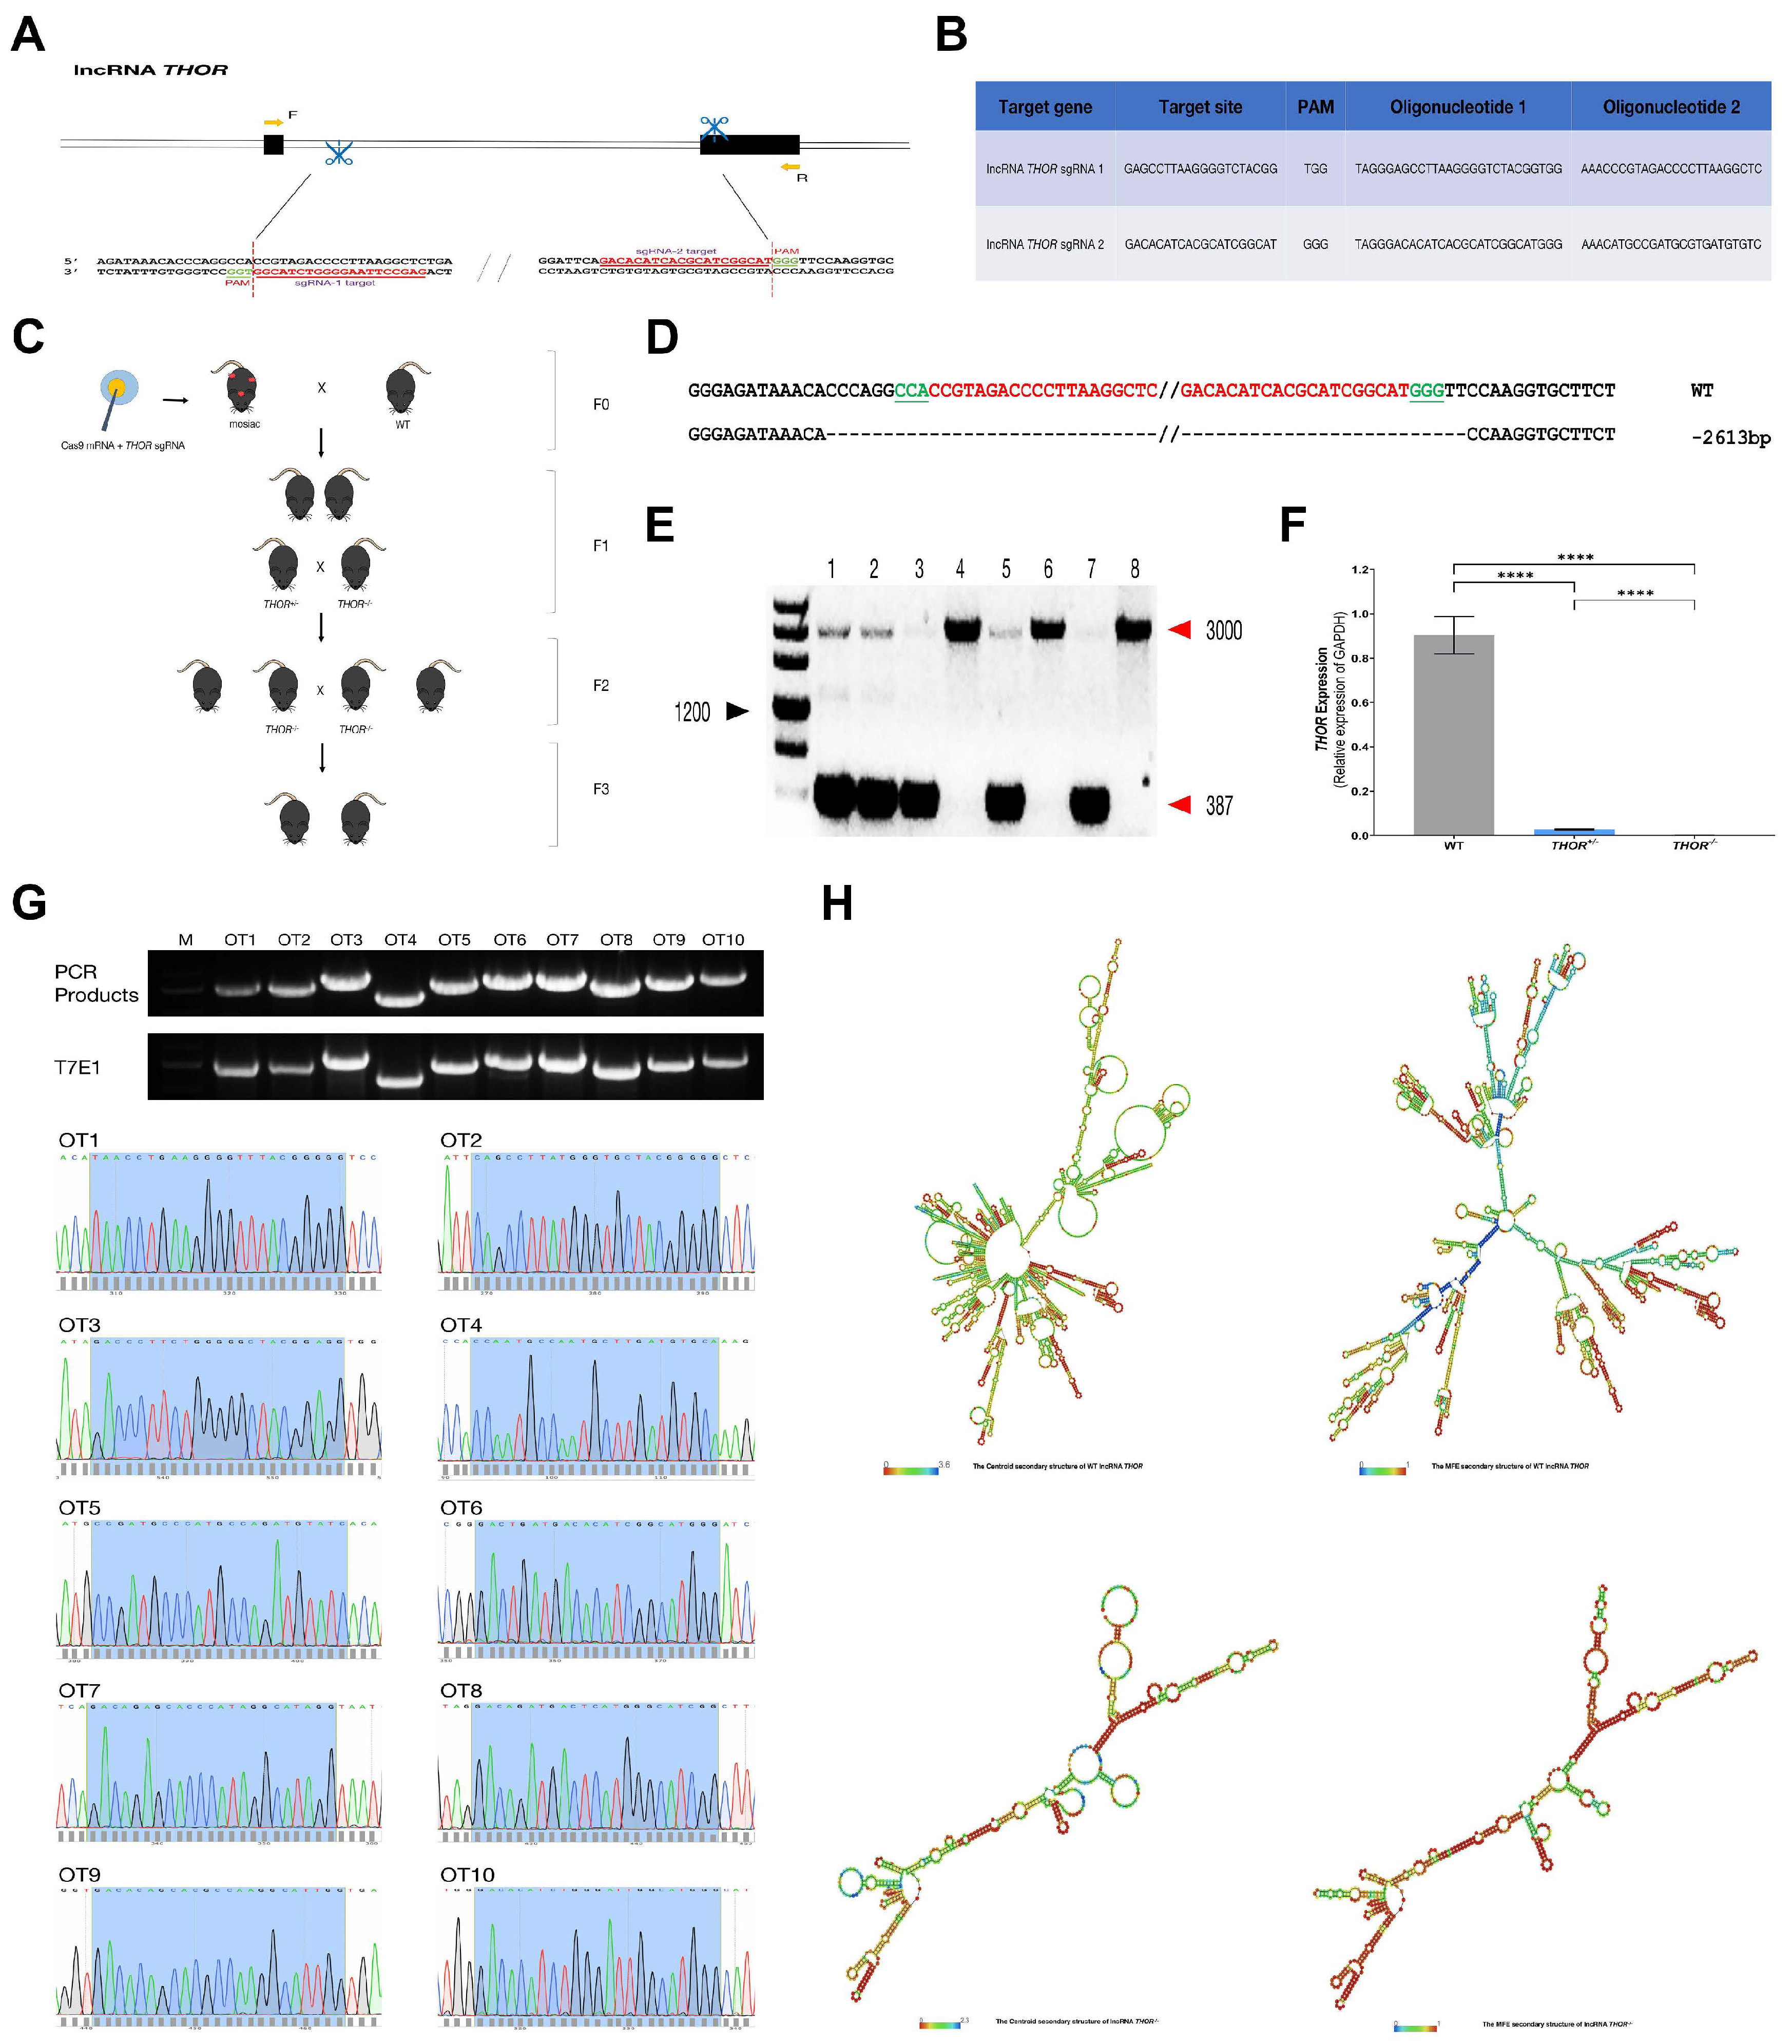
3.2. Generation of THOR-Deficient Mice

The CRISPR/Cas9 platform was used to edit the THOR mouse gene (Figure 2C) Because THOR has two exons, cannot be translated into a protein, and has non-defined introns [11], to assess the involvement of the gene regulatory network, sgRNAs were designed to delete large fragments of THOR that included both exonic and intronic regions (Figure 2A,B). This method was equivalent to the complete destruction of the gene THOR structure. We injected the in vitro-transcribed Cas9 mRNA and sgRNA mixture into the fertilized egg by cytoplasmic injection and then transplanted the embryo into a pregnant mouse to obtain an F0 generation mouse, and the identities of positive mouse genomes were verified (Figure 2D,E). Breeding of the offspring obtained THOR-deficient mice (Figure 2C), which was further verified (Figure 2F). We also used qRT-PCR primers located outside the gene deletion region to detect the decreased expression of THOR (Figure S2). It shows that after the large fragment of THOR deficient, the gene recombines to form a new truncated THOR. Off-target effects are a major problem limiting the practical applications of CRISPR/Cas9 technology. To assess potential off-target effects in THOR-deficient mice, 10 pairs of PCR primers were designed based on potential off-target sites (Table S1). PCR sequencing and the T7E1 cleavage assay for the detection of mutations revealed no off-target effects in the samples (Figure 2G). We further analyzed and compared the secondary structures of the mouse THOR gene and found that the secondary structure of THOR was completely changed after THOR gene deletion (Figure 2H, http://rna.tbi.univie.ac.at/cgi-bin/RNAWebSuite/SCA.cgi accessed on 1 July 2021) and that IGF2BP1 and downstream signaling regulatory pathways together had a substantial impact.

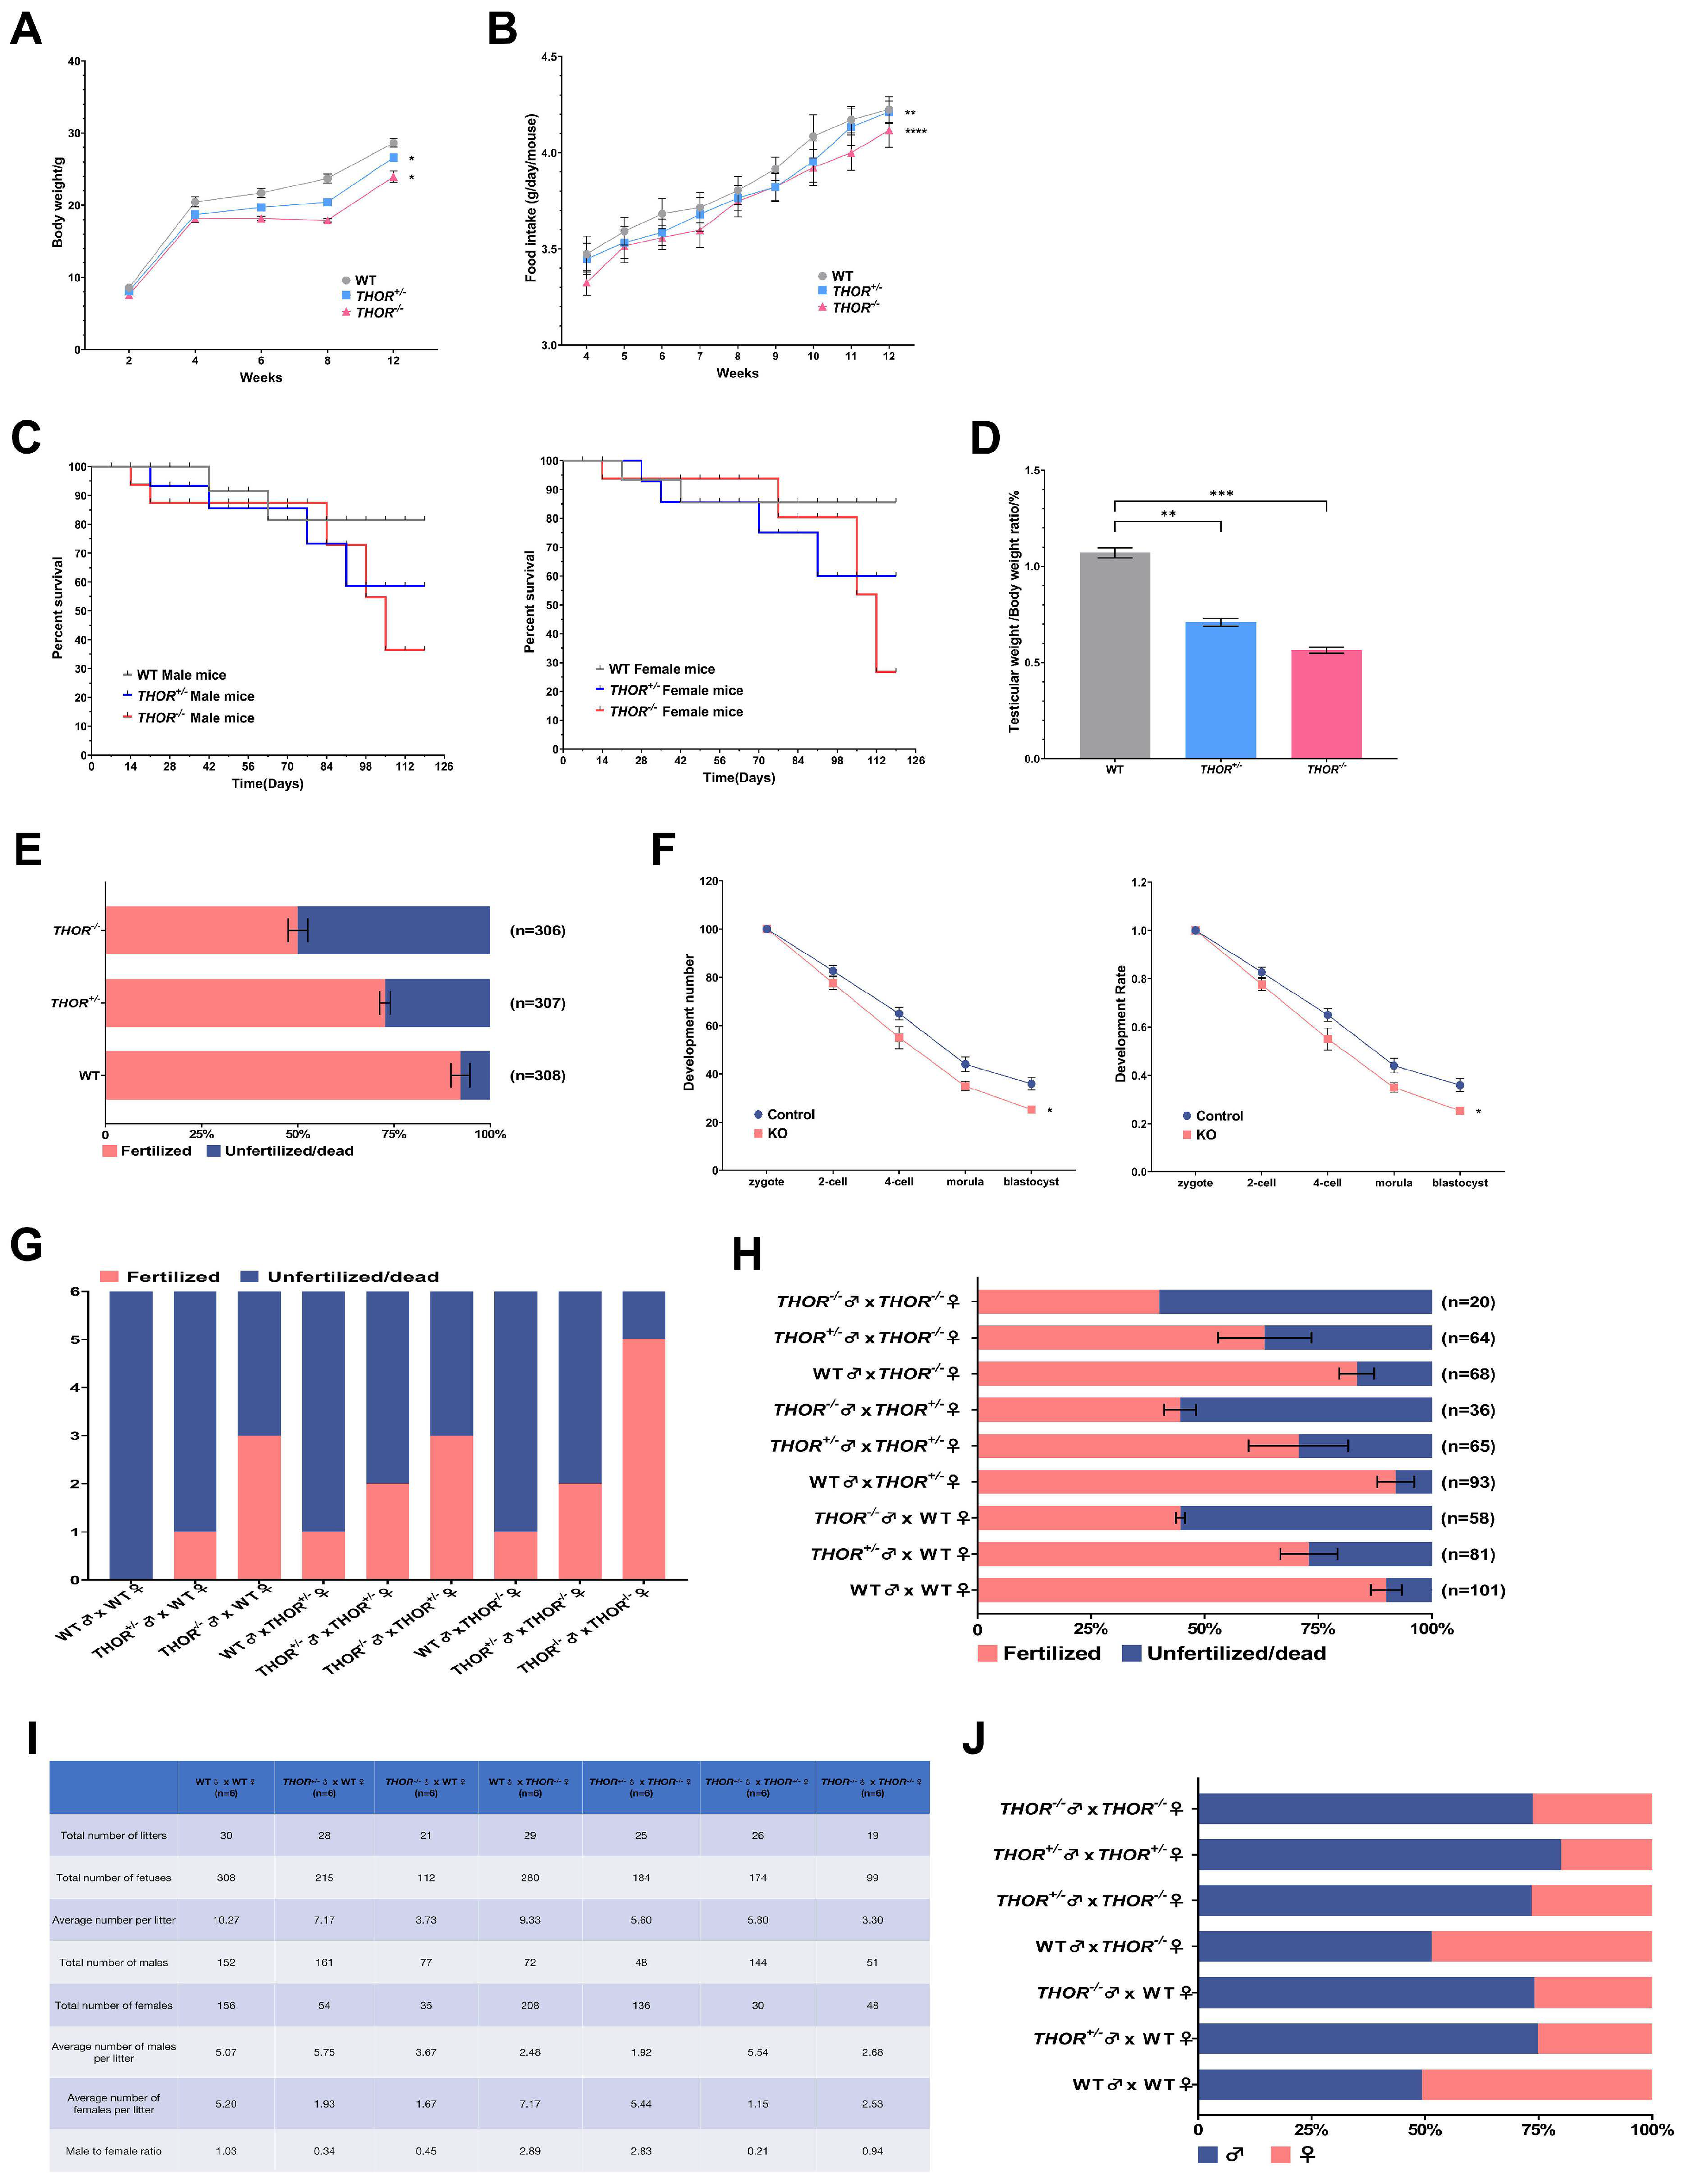
3.3. THOR-Deficient Mice Exhibit Decreased Fertility and a Female-to-Male Imbalance

THOR-deficient mice were housed in the same cages as WT mice during the breeding process, and the THOR+/− and THOR−/− and WT mice were weighed regularly. THOR was shown to regulate the body weights of both groups of mice, and THOR−/− mice weighed less than THOR+/− mice (Figure 3A). To determine whether this differential result was due to the influence of THOR on mouse food intake, we statistically analyzed the food intake of THOR on WT and THOR-deficient mice. No significant difference in food intake was observed between WT and THOR-deficient mice (Figure 3B); thus, the effect of THOR on mouse body weight was presumably caused by genetic factors. To determine whether THOR affects mouse survival, we assessed the survival of WT, THOR+/−, and THOR−/− mice for 126 days (Figure 3C) and found that the survival rate of THOR-deficient mice was lower than that of WT mice and that the THOR-deficient mice were more likely to die.
THOR is specifically and highly expressed in the testes. To explore the effects of THOR on the mouse reproductive system, we compared the testicular weights and testicular mass indices of THOR-deficient and WT mice (Figure 3D). The testes of THOR-deficient mice were smaller and lighter than those of WT mice, the testes of THOR−/− mice were smaller than those of THOR+/− mice, and the testes mass indices of THOR−/− mice were lower than those of WT mice. Therefore, we proved that THOR affects testicular development in mice.
To determine which aspects of THOR affect testicular development in male mice, we assessed the fertility of the mice. In vitro fertilization (IVF) experiments were performed using WT and THOR+/− and THOR−/− mouse sperm and WT oospheres, with an average of 100 oospheres in each group. The experiments were repeated 3 times at 37 °C in a 5% CO2 incubator for 12 h, and embryonic development was observed. The 2-cell stage served as the marker for oosphere detection (Figure 3E). We found that the fertilization rate of WT mouse sperm was above 90%, while that of THOR+/− mouse sperm was approximately 72%, and that of THOR−/− mouse sperm was approximately 50%. Therefore, we hypothesize that THOR is involved in sperm development and maturation.
We microinjected 100 oospheres and deleted the mouse THOR gene using CRISPR/Cas9 technology. After microinjection, the oospheres were developed to the blastocyst stage in vitro to observe embryonic development (Figure 3F). Deletion of THOR by microinjection lowered the embryo development rate in vitro compared to that in the control group, and the blastocyst development rate decreased from an average of 36% to approximately 25%. Thus, THOR affects the growth and development of embryos.
We next assessed the effect of THOR on mouse fertility. We mated female and male 8-week-old mice at a 1:1 ratio during the estrus period, with 6 pairs of mice in each group. The vaginas of the female mice were checked at 8 a.m. the next morning. One hundred percent of the female and male WT mice successfully mated, while THOR had a slight impact on the fertility of the female mice, and the genotypes of the THOR+/− and THOR−/− female mice were not obviously different. The fertility of THOR-deficient male mice was reduced by 50% (Figure 3G). Therefore, we believe that THOR, as a highly conserved testis-specific lncRNA, plays an important role in the regulatory network of the reproductive system in male mice. After evaluating the vaginal suppositories, we observed female mice implanted with embryos, and the 2-cell embryo stage on the second day indicated fertilization. We found that THOR affected not only the mating conditions of the male mice, but also the combination of sperm and egg cells (Figure 3H). The embryo fertilization rate was relatively low, and the THOR−/− males were more seriously impacted than the THOR+/− males. Therefore, we hypothesize that THOR affects testicular and sperm development and that decreased male fertility is due to the absence of THOR.
We next assessed whether THOR affects mouse fertility from the perspective of individual mouse reproduction. We mated 6-week-old female and male mice of different genotypes at a 1:1 ratio to assess the reproduction of the offspring within 6 months (Figure 3I, Table S2). The deletion of THOR in male and female mice decreased the number of litters produced, which affected the offspring ratio of female- to-male (Figure 3J). Under natural circumstances, the female-to-male ratio of WT mouse offspring is approximately 1:1. Deletion of the THOR gene in female mice had little effect on the number of female offspring. However, deletion of THOR in male mice substantially increased the number of male offspring, and the female-to-male ratio was approximately 1:3. Therefore, we hypothesized that THOR deficiency impacted the fertilization ability of X and Y sperms, thereby resulting in more male offspring.

3.4. THOR Deficiency Affects Testicular Development in Male Mice

To determine the effect of THOR on testicular development in male mice, we compared photos of adult male mice at 8 weeks of age (Figure 4A). The reproductive systems of WT mice developed normally, while the THOR+/− and THOR−/− mice exhibited substantially fewer sperm in the seminal vesicles than the WT mice and low numbers of mature sperm (Figure 4B). In addition, the testes were not fully developed and differed in size. The testes of THOR+/− and THOR−/− mice were smaller than those of WT mice, and the testes of THOR−/− mice were smaller than those of THOR+/− mice (Figure 4C).
We paraffin-embedded mouse testes sections and performed hematoxylin and eosin (H&E) (Figure 4D) and TUNEL (Figure 4E) staining. In the testes of THOR-deficient mice, the diameters of seminiferous tubules were decreased and sparsely arranged and Sertoli and germ cells were arranged abnormally (Figure 4F). TUNEL staining revealed significantly increased apoptosis levels in THOR+/− and THOR−/− mice (Figure 4G). Statistical analysis revealed that the apoptosis index was increased in the absence of THOR.
Therefore, we conclude that the highly conserved THOR gene, which is specifically expressed in the testis, not only participates in the growth and proliferation of numerous tumor and cancer cells but also plays an important role in the regulation of the male reproductive system; however, the specific mechanism is currently unknown.

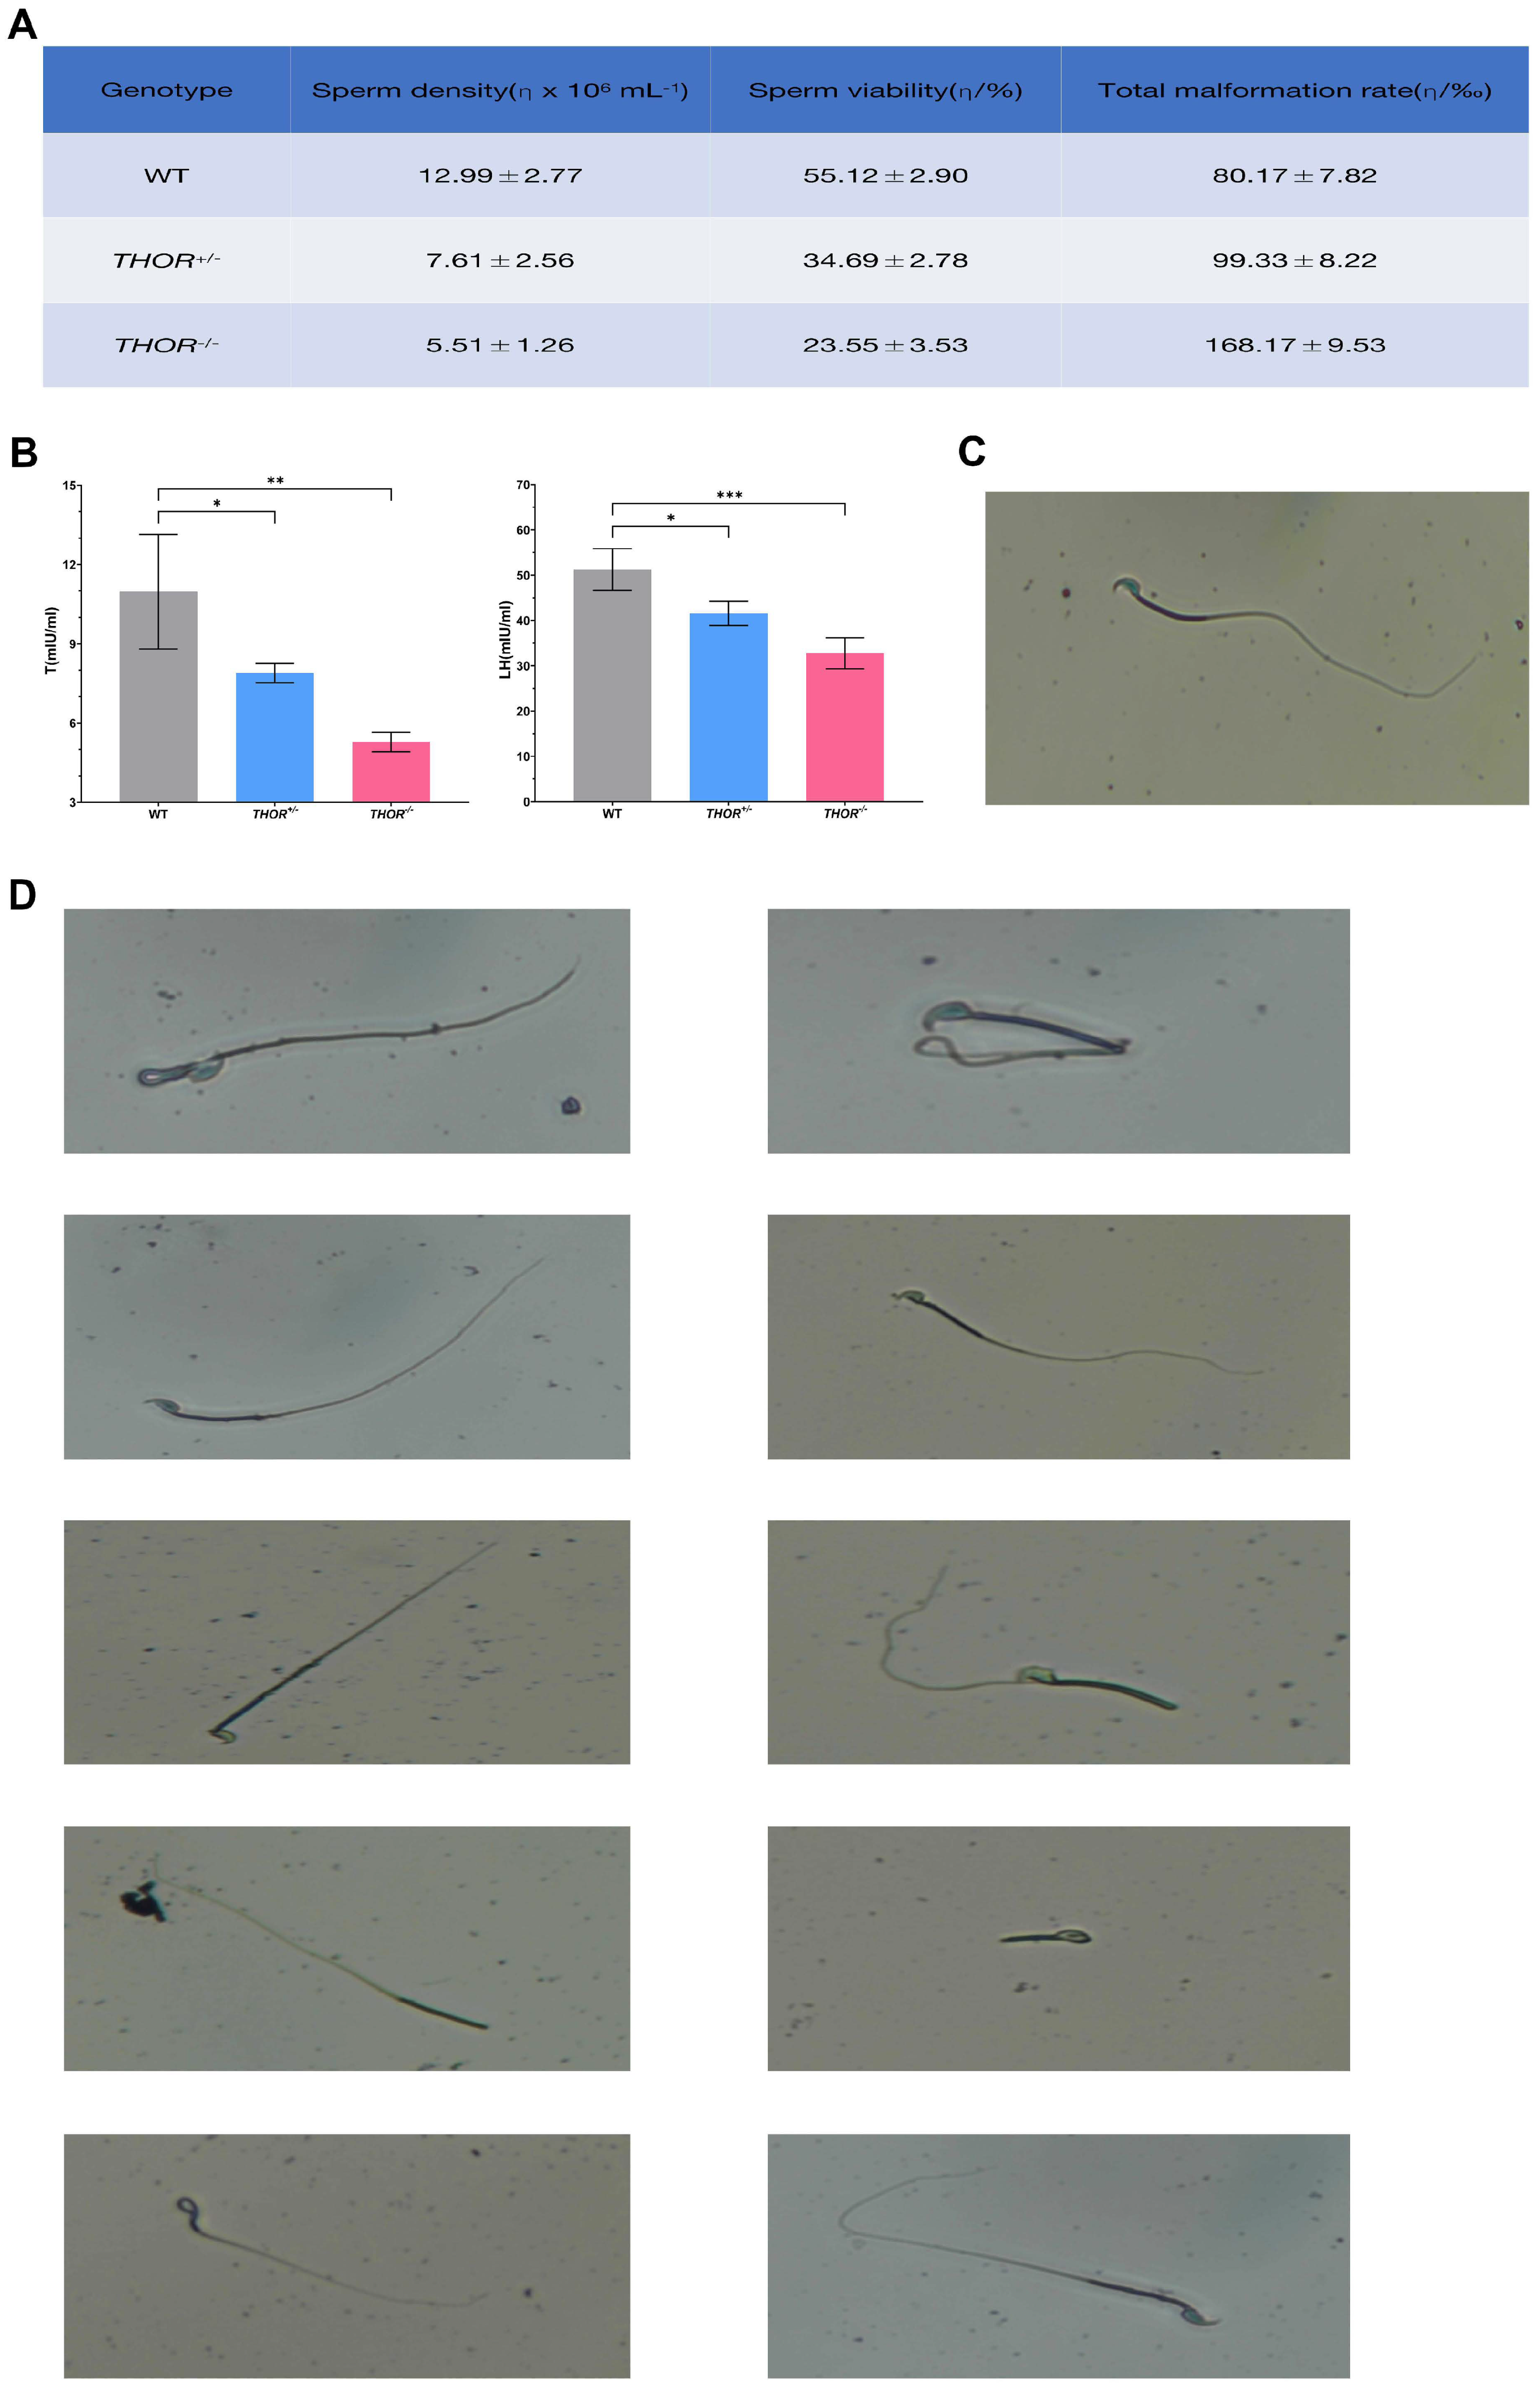
3.5. THOR Deficiency Affects Sperm Development

To determine whether THOR affects sperm development in male mice, we counted the sperm of male WT, THOR+/−, and THOR−/− mice (3 male mice of each genotype were analyzed). The epididymal tails on both sides of each sperm were digested in 1 mL of HTF culture medium. After the sperm swam out, the sperm density, motility, and deformity rate were determined. Deletion of THOR reduced the sperm density and motility in male mice; the sperm density and motility of THOR−/− mice were lower than those of THOR+/− mice, while the deformity rate was higher for THOR−/− mice (Figure 5A). These data suggest that THOR affects the development and maturation of sperm in male mice.
Previous studies have shown that hormones are regulated within the developmental receptors of male sperm. While THOR clearly affected testicular and sperm development, its effects on bodily hormone levels were unknown. Therefore, we assessed the serum testosterone (T) and luteinizing hormone (LH) levels in 8-week-old male WT, THOR+/−, and THOR−/− mice (6 mice in each group). The serum T and LH levels of THOR-deficient mice were 50% lower than those of WT mice. The T and LH levels in THOR−/− mice were lower than those in THOR+/− mice (Figure 5B). Therefore, we believe that THOR effects the expression of sex hormones in male mice and helps to regulate testicular and sperm development.
Sperm were morphologically assessed by eosin-nigrosin staining (Figure 5C). THOR-deficient mice exhibited sperm with ten different features: large head, small head, no head, irregular head, no hook, neck curvature, double body, body curl, curly tail, and short tail (Figure 5D). The deformity rate of THOR-deficient sperm was higher than that of WT sperm. Therefore, we conclude that THOR participates in a certain regulatory mechanism that affects the development and maturation of sperm.

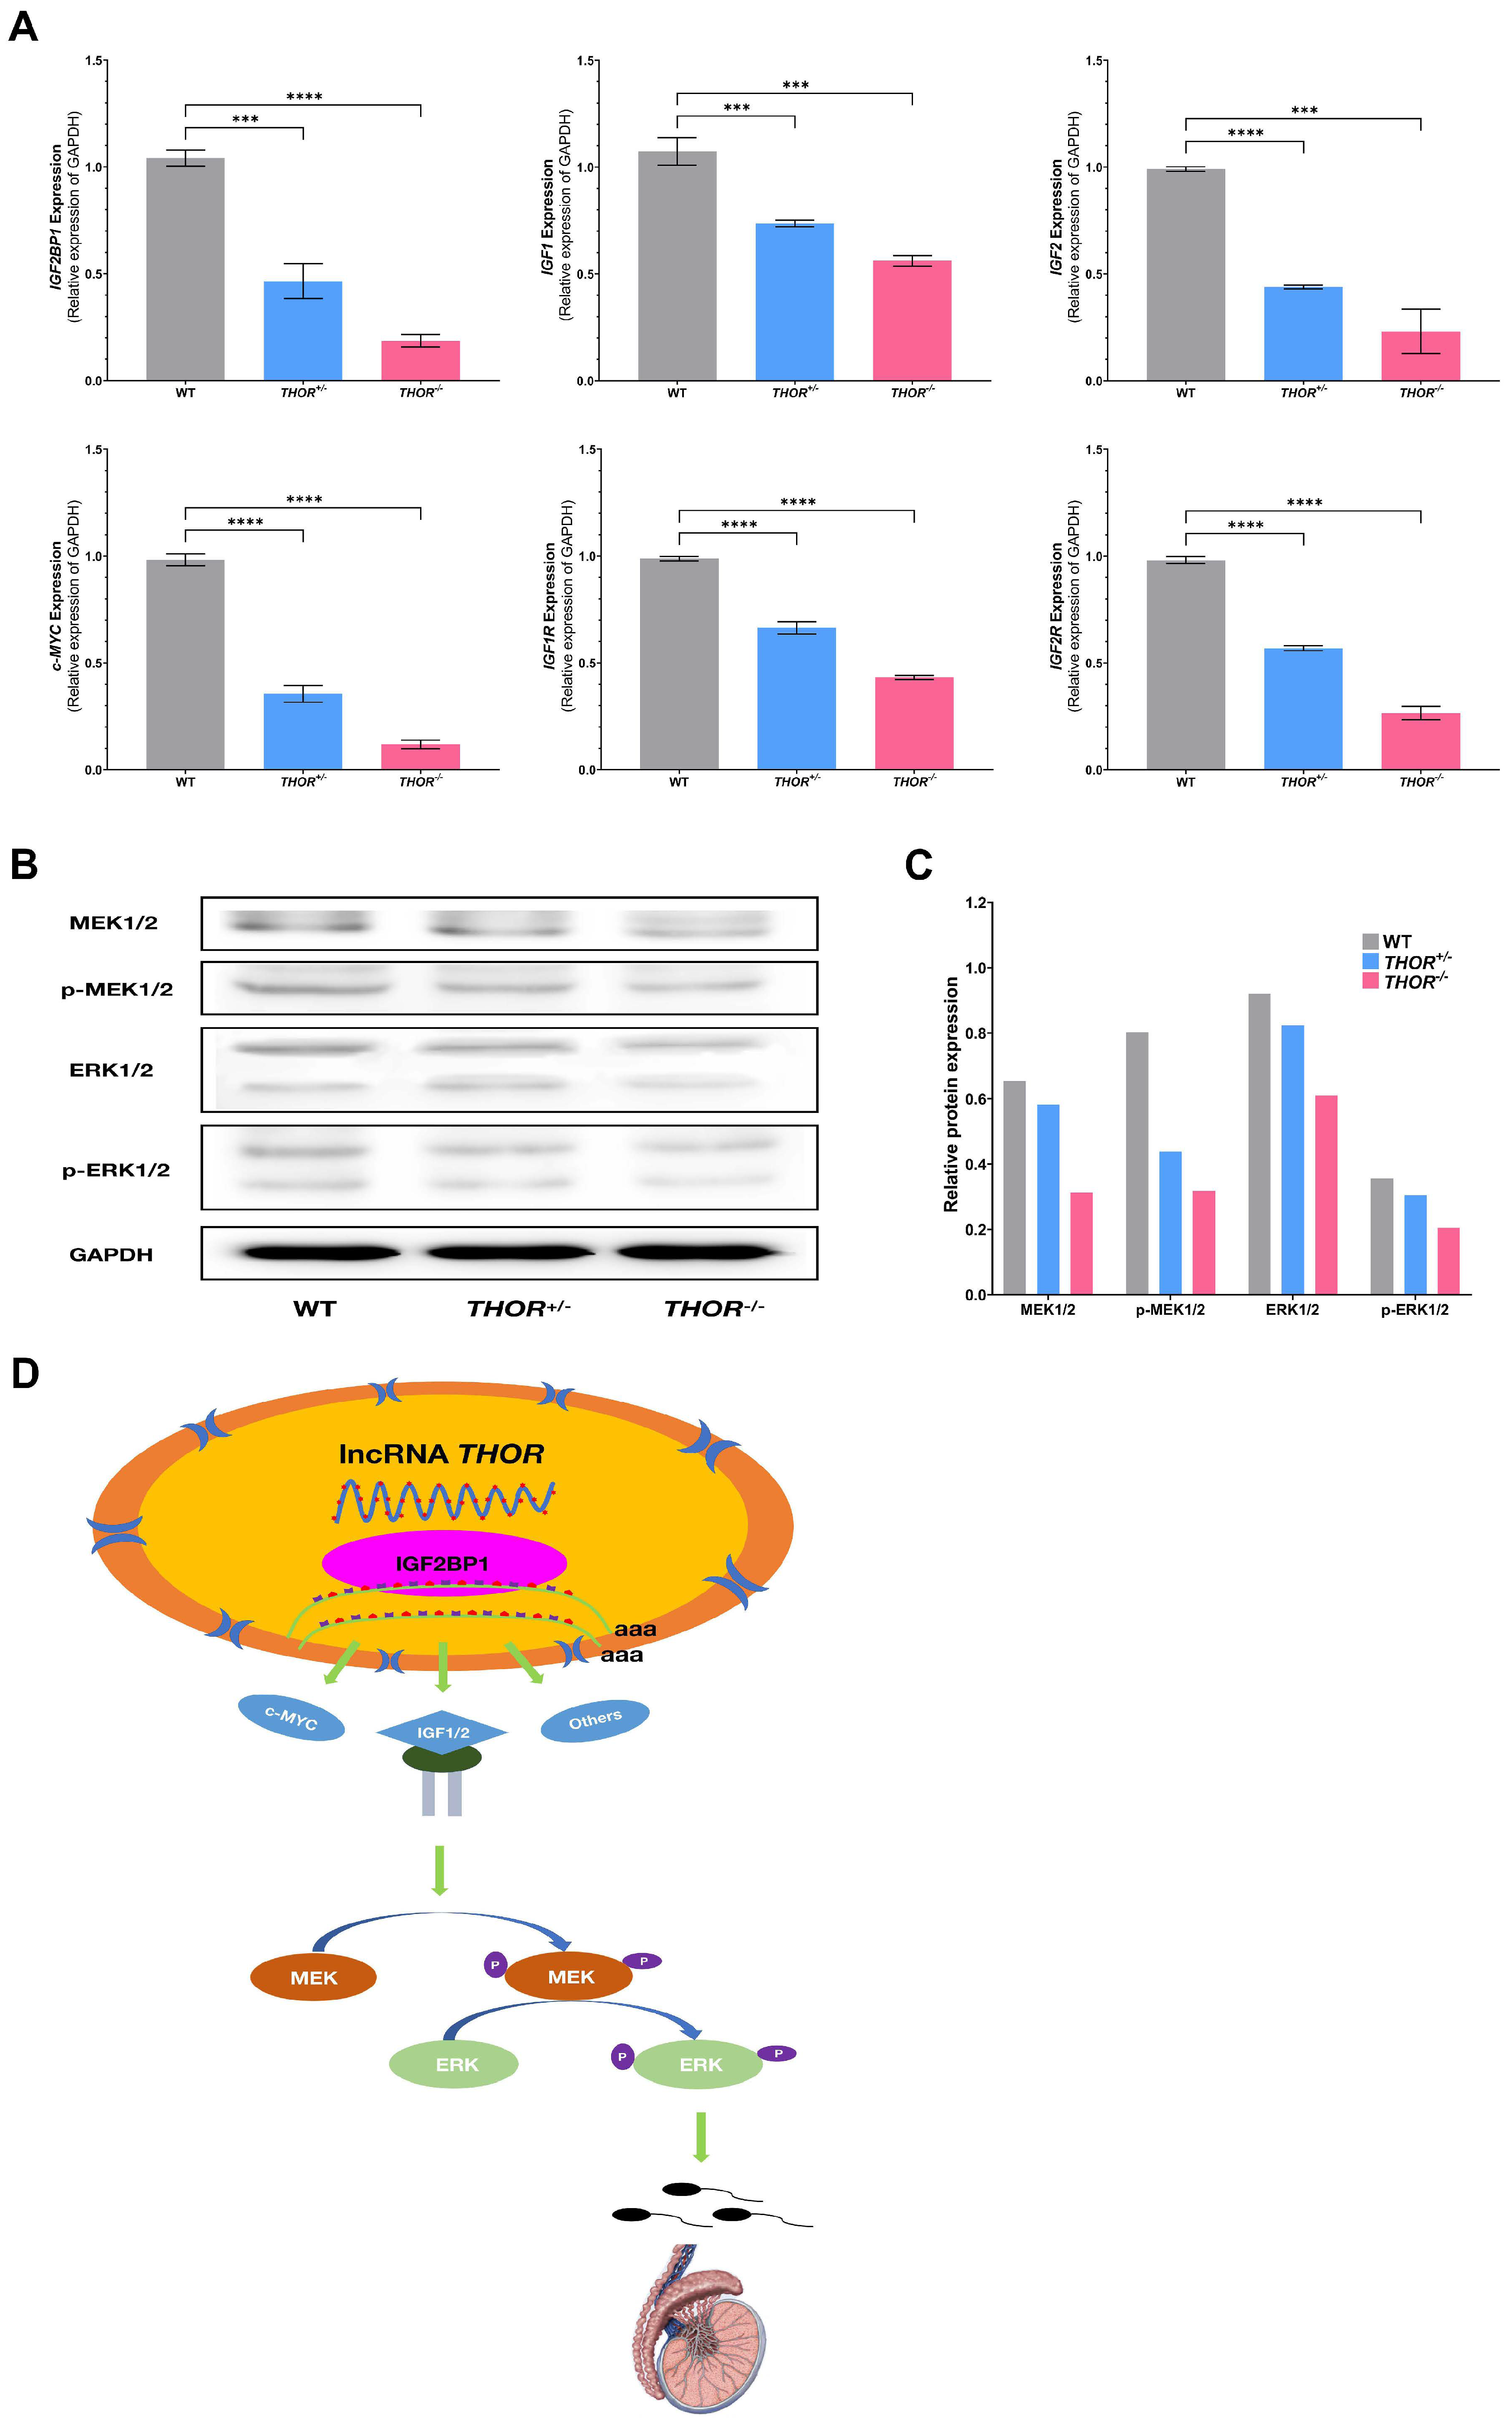
3.6. THOR Affects Sperm Development through the MEK Pathway

IGF2BP1 is an RBP that mediates RNA stability and promotes the translation of numerous well-defined mRNA targets by binding to RNA and other RBPs [32,33]. Many previous studies have shown that THOR specifically binds to IGF2BP1 in the nucleus and regulates the stability of mRNAs, such as IGF1, IGF2, and c-MYC [34]. Moreover, IGF2 has been shown to effect testicular development and spermatogenesis [35]. Therefore, we speculate that THOR and IGF2BP1 together effect testicular and sperm development in males by regulating the downstream IGF2 signaling pathway. To further confirm the above hypothesis, we assessed the IGF2BP1-IGF2-MEK-ERK signaling pathway in the testicular tissues of WT and THOR-deficient mice by qRT-PCR (Figure 6A) and verified the results by Western blot (Figure 6B). The Western blot protein bands were semiquantitatively analyzed by ImageJ, revealing that the deletion of the THOR affected the regulation of the MEK-ERK pathway (Figure 6C). Overall, these data indicate that THOR mediates the stabilization of IGF2BP1 and participates in the IGF2BP1 and IGF2 coregulation of the MEK signaling pathway and in testicular and sperm development (Figure 6D).

4. Discussion

RNAs with a fragment length of more than 200 nt and noncoding ability are called lncRNAs, which have complex physiological functions [36,37]. The lncRNA THOR was the first cancer/testicular lncRNA to be discovered and was further shown to conservatively interact with IGF2BP1 and to contribute to its mRNA stabilization activity [11]. THOR regulates the proliferation and development of cancer cells by affecting the expression of the IGF2BP1 downstream signaling pathway and has been shown to play a carcinogenic role in liver cancer, gastric cancer, renal cell carcinoma, osteosarcoma, nasopharyngeal carcinoma, tongue squamous cell carcinoma, colorectal cancer, melanoma, triple negative breast cancer, and non-small cell lung adenocarcinoma [38,39]. Notably, transgenic THOR knockout produced fertilization defects in zebrafish and conferred resistance to melanoma onset [11]. While these results indicate that THOR plays an important role in male reproductive system development, little is known about its role in mammalian testis and sperm development.
Xue and Zhong et al. confirmed that the interaction between THOR and IGF2BP1 is conserved among many vertebrate species [38]. We explored whether similar effects occur in mammals and used CRISPR/Cas9 technology to construct a mouse model of THOR gene deletion (2613 bp). In order to detect the expression of THOR, we used qRT-PCR primers located in the gene deletion region, the expression of THOR is lost. We also used qRT-PCR primers located outside the gene deletion region to detect the decreased expression of THOR, but not the original THOR. It was proved that after the large fragment of THOR was deleted, the gene is recombined to form a new truncated THOR. Therefore, when we are studying the function of lncRNAs, we can delete a large fragment of lncRNAs to cause recombination of the remaining fragments, structural changes, and produce a phenotype similar to the complete deletion of the entire lncRNAs. The THOR-deficient male mice were smaller than WT mice; moreover, their survival rate was reduced by 60%, their fertility was reduced by 50%, and their female-to-male offspring ratio was approximately 1:3. Further analysis of the effect of THOR on male reproductive system development showed that the testicular size and sperm motility of THOR-deficient male mice were reduced by 50%, that the diameter of seminiferous tubules was decreased, and that the apoptosis of testicular cells was increased by 7-fold, which confirmed that THOR is involved male testicular development. We next investigated whether THOR plays an important role in sperm development and found that the sperm density in the epididymal tissues of THOR-deficient male mouse was decreased by 50%, that the sperm motility was decreased, that the sperm deformity rate was increased, and that the serum T and LH levels were decreased by 50%, thereby indicating that deletion of the THOR gene affected male sperm development. In conclusion, the lncRNA THOR plays an important role in male reproductive system development.
As a signal transduction protein, ERK can transmit mitogen signals. Under normal conditions, ERK is localized in the cytoplasm and can be activated by various growth factors, peroxides, and free radicals [40]. MEK is upstream of ERK and participates in the process by which ERK enters the nucleus [41]. MEK-ERK is the downstream signaling pathway of IGF2 [42]. To prove that the MEK-ERK pathway is involved in testicular and sperm development, we analyzed the mRNA levels of the downstream target genes of THOR by qRT-PCR and revealed that the levels of IGF2BP1, c-MYC, IGF1, and IGF2 were significantly decreased in THOR-deficient mice. Further verification by WB showed reduced expression of the MEK-ERK pathway was. Our results indicate that THOR regulates the MEK-ERK signaling pathway downstream of IGF2 by binding to IGF2BP1, regulates testicular and sperm development, and affects the viability, fertility, and sex ratio of offspring in male mice.
The lncRNA THOR is known to be expressed in a variety of species and human cancers, which furthers our understanding of the correlation between normal and disease processes [11]. Deletion of THOR in zebrafish can lead to abnormal fertilization, and we found that the deletion of THOR in male mice affected their survival and fertility as well as the sex ratio of their offspring. In addition, the regulatory effects of THOR on male reproductive system have not been fully elucidated. We further explored the influence of THOR on the female-to-male offspring ratio, but whether THOR specifically regulates the reduced vitality and energy of X sperm remains unclear.
We herein used CRISPR/Cas9 technology to construct a THOR-deficient mouse model to assess the effects of THOR on testicular and sperm development in male mice. The results of this study provide new perspectives for exploring reproduction-specific lncRNAs, furthers our understanding of the roles of lncRNAs in human reproduction and development, and provides more information on the pathogenesis of infertility and potential therapeutic targets.

Supplementary Materials

The following are available online at https://0-www-mdpi-com.brum.beds.ac.uk/article/10.3390/biomedicines9080859/s1. Figure S1: Description of the conserved region of the exon of lncRNA THOR gene in mouse, humans, pig, rabbit and zebrafish. Figure S2: The expression of a new truncated THOR. Using qRT-PCR primers outside of THOR deletion region. Table S1: The primers of potential off-target sites (POTS) used in this study. Table S2: Reproduction of the offspring of mouse within 6 months. Table S3: Primer. Table S4: Antibody.

Author Contributions

L.Z.: Methodology, Investigation, Validation, Visualization, Data curation, Formal analysis, Software, Writing—original draft, Writing—review and editing. J.L. (Jianing Li): Methodology, Software, Investigation, Data curation. J.L. (Jinsong Liu): Methodology, Investigation. A.W.: Methodology, Investigation. Y.L.: Methodology, Investigation. H.Y.: Software. H.O.: Conceptualization, Funding acquisition, Project administration, Supervision. D.P.: Conceptualization, Funding acquisition, Project administration, Supervision, Writing—review and editing. All authors have read and agreed to the published version of the manuscript.

Funding

This work was financially supported by the National Key Research and Development Program of China Stem Cell and Translational Research (2019YFA0110702), the Program for JLU Science and Technology Innovative Research Team (2017TD-28).

Institutional Review Board Statement

The study was conducted in accordance with the guidelines of the Declaration of Helsinki, and approved by the animal protection and research ethics committee of Jilin University, and all procedures were strictly in accordance with the guidelines for the care and use of laboratory animals (protocol code SY201910010 and SY201910011, date of approval 3 October 2019). All animal operations were performed under anesthesia, and every effort was made to minimize pain.

Informed Consent Statement

Not applicable.

Data Availability Statement

All data generated or analyzed during this study are included in this published article.

Conflicts of Interest

None of the authors have any conflicts of interest to disclose.

References

  1. Ponting, C.P.; Belgard, T.G. Transcribed dark matter: Meaning or myth? Hum. Mol. Genet. 2010, 19, R162–R168. [Google Scholar] [CrossRef] [Green Version]
  2. Lee, H.; Zhang, Z.; Krause, H.M. Long Noncoding RNAs and Repetitive Elements: Junk or Intimate Evolutionary Partners? Trends Genet. 2019, 35, 892–902. [Google Scholar] [CrossRef] [Green Version]
  3. Djebali, S.; Davis, C.A.; Merkel, A.; Dobin, A.; Lassmann, T.; Mortazavi, A.; Tanzer, A.; Lagarde, J.; Lin, W.; Schlesinger, F.; et al. Landscape of transcription in human cells. Nature 2012, 489, 101–108. [Google Scholar] [CrossRef] [PubMed] [Green Version]
  4. Moraes, F.; Goes, A. A Decade of Human Genome Project Conclusion: Scientific Diffusion about Our Genome Knowledge. Biochem. Mol. Biol. Educ. 2016, 44, 215–223. [Google Scholar] [CrossRef] [PubMed] [Green Version]
  5. Wu, H.; Yang, L.; Chen, L.L. The Diversity of Long Noncoding RNAs and Their Generation. Trends Genet. 2017, 33, 540–552. [Google Scholar] [CrossRef] [PubMed]
  6. Glass, J.I.; Merryman, C.; Wise, K.S.; Hutchison, C.A.; Smith, H.O. Minimal Cells-Real and Imagined. Csh. Perspect Biol. 2017, 9, a023861. [Google Scholar] [CrossRef] [Green Version]
  7. Pang, Y.A.; Mao, C.B.; Liu, S.R. Encoding activities of non-coding RNAs. Theranostics 2018, 8, 2496–2507. [Google Scholar] [CrossRef]
  8. Uchida, S.; Dimmeler, S. Long noncoding RNAs in cardiovascular diseases. Circ. Res. 2015, 116, 737–750. [Google Scholar] [CrossRef] [Green Version]
  9. Schmitt, A.M.; Chang, H.Y. Long Noncoding RNAs in Cancer Pathways. Cancer Cell 2016, 29, 452–463. [Google Scholar] [CrossRef] [Green Version]
  10. Chen, S.; Chen, Y.; Qian, Q.; Wang, X.; Chang, Y.; Ju, S.; Xu, Y.; Zhang, C.; Qin, N.; Ding, H.; et al. Gene amplification derived a cancer-testis long noncoding RNA PCAT6 regulates cell proliferation and migration in hepatocellular carcinoma. Cancer Med. 2019, 8, 3017–3025. [Google Scholar] [CrossRef] [Green Version]
  11. Hosono, Y.; Niknafs, Y.S.; Prensner, J.R.; Iyer, M.K.; Dhanasekaran, S.M.; Mehra, R.; Pitchiaya, S.; Tien, J.; Escara-Wilke, J.; Poliakov, A.; et al. Oncogenic Role of THOR, a Conserved Cancer/Testis Long Non-coding RNA. Cell 2017, 171, 1559–1572.e20. [Google Scholar] [CrossRef] [Green Version]
  12. Huang, X.; Zhang, H.; Guo, X.; Zhu, Z.; Cai, H.; Kong, X. Insulin-like growth factor 2 mRNA-binding protein 1 (IGF2BP1) in cancer. J. Hematol. Oncol. 2018, 11, 88. [Google Scholar] [CrossRef] [Green Version]
  13. Shang, Y.M. LncRNA THOR acts as a retinoblastoma promoter through enhancing the combination of c-myc mRNA and IGF2BP1 protein. Biomed. Pharm. 2018, 106, 1243–1249. [Google Scholar] [CrossRef] [PubMed]
  14. Liu, Z.J.; Wu, G.Y.; Lin, C.; Guo, H.L.; Xu, J.J.; Zhao, T.L. IGF2BP1 over-expression in skin squamous cell carcinoma cells is essential for cell growth. Biochem. Biophys. Res. Commun. 2018, 501, 731–738. [Google Scholar] [CrossRef]
  15. Golyshev, V.M.; Abramova, T.V.; Pyshnyi, D.V.; Lomzov, A.A. Structure and Hybridization Properties of Glycine Morpholine Oligomers in Complexes with DNA and RNA: Experimental and Molecular Dynamics Studies. J. Phys. Chem. B 2019, 123, 10571–10581. [Google Scholar] [CrossRef]
  16. Cui, H.M. Loss of imprinting of IGF2 as an epigenetic marker for the risk of human cancer. Dis. Markers 2007, 23, 105–112. [Google Scholar] [CrossRef] [Green Version]
  17. DeChiara, T.M.; Robertson, E.J.; Efstratiadis, A. Parental imprinting of the mouse insulin-like growth factor II gene. Cell 1991, 64, 849–859. [Google Scholar] [CrossRef]
  18. Rainier, S.; Johnson, L.A.; Dobry, C.J.; Ping, A.J.; Grundy, P.E.; Feinberg, A.P. Relaxation of imprinted genes in human cancer. Nature 1993, 362, 747–749. [Google Scholar] [CrossRef] [PubMed]
  19. Ni, W.; Pan, C.; Pan, Q.; Fei, Q.; Huang, X.; Zhang, C. Methylation levels of IGF2 and KCNQ1 in spermatozoa from infertile men are associated with sperm DNA damage. Andrologia 2019, 51, e13239. [Google Scholar] [CrossRef] [PubMed]
  20. Neirijnck, Y.; Kuhne, F.; Mayere, C.; Pavlova, E.; Sararols, P.; Foti, M.; Atanassova, N.; Nef, S. Tumor Suppressor PTEN Regulates Negatively Sertoli Cell Proliferation, Testis Size, and Sperm Production In Vivo. Endocrinology 2019, 160, 387–398. [Google Scholar] [CrossRef] [PubMed]
  21. Wang, D.; Li, M.; Li, J.; Wan, X.; Huang, Y.; Wang, C.; Zhang, P.; Xu, Y.; Kong, Z.; Lu, Y.; et al. Comprehensive Characterization of Androgen-Responsive lncRNAs Mediated Regulatory Network in Hormone-Related Cancers. Dis. Markers 2020, 2020, 8884450. [Google Scholar] [CrossRef]
  22. Nickols, N.G.; Nazarian, R.; Zhao, S.G.; Tan, V.; Uzunangelov, V.; Xia, Z.; Baertsch, R.; Neeman, E.; Gao, A.C.; Thomas, G.V.; et al. MEK-ERK signaling is a therapeutic target in metastatic castration resistant prostate cancer. Prostate Cancer Prostatic Dis. 2019, 22, 531–538. [Google Scholar] [CrossRef]
  23. Pui, H.P.; Saga, Y. Gonocytes-to-spermatogonia transition initiates prior to birth in murine testes and it requires FGF signaling. Mech. Dev. 2017, 144, 125–139. [Google Scholar] [CrossRef]
  24. Bley, N.; Schott, A.; Muller, S.; Misiak, D.; Lederer, M.; Fuchs, T.; Assmann, C.; Glass, M.; Ihling, C.; Sinz, A.; et al. IGF2BP1 is a targetable SRC/MAPK-dependent driver of invasive growth in ovarian cancer. RNA Biol. 2021, 18, 391–403. [Google Scholar] [CrossRef] [PubMed]
  25. Lv, Y.; Yang, X.; Wang, L. Effect of lncrna thor on proliferation and migration of colon cancer cells. Oncol Lett 2019, 18, 2518–2522. [Google Scholar] [PubMed] [Green Version]
  26. Wang, S.S.; Lv, Y.; Xu, X.C.; Zuo, Y.; Song, Y.; Wu, G.P.; Lu, P.H.; Zhang, Z.Q.; Chen, M.B. Triptonide inhibits human nasopharyngeal carcinoma cell growth via disrupting Lnc-RNA THOR-IGF2BP1 signaling. Cancer Lett. 2019, 443, 13–24. [Google Scholar] [CrossRef]
  27. Liu, H.; Xu, Y.; Yao, B.; Sui, T.; Lai, L.; Li, Z. A novel N6-methyladenosine (m6A)-dependent fate decision for the lncRNA THOR. Cell Death Dis. 2020, 11, 613. [Google Scholar] [CrossRef]
  28. El Refaey, M.; Xu, L.; Gao, Y.; Canan, B.D.; Adesanya, T.M.A.; Warner, S.C.; Akagi, K.; Symer, D.E.; Mohler, P.J.; Ma, J.; et al. In Vivo Genome Editing Restores Dystrophin Expression and Cardiac Function in Dystrophic Mice. Circ. Res. 2017, 121, 923–929. [Google Scholar] [CrossRef]
  29. Shen, B.; Zhang, J.; Wu, H.; Wang, J.; Ma, K.; Li, Z.; Zhang, X.; Zhang, P.; Huang, X. Generation of gene-modified mice via Cas9/RNA-mediated gene targeting. Cell Res. 2013, 23, 720–723. [Google Scholar] [CrossRef]
  30. Sui, T.; Yuan, L.; Liu, H.; Chen, M.; Deng, J.; Wang, Y.; Li, Z.; Lai, L. CRISPR/Cas9-mediated mutation of PHEX in rabbit recapitulates human X-linked hypophosphatemia (XLH). Hum. Mol. Genet. 2016, 25, 2661–2671. [Google Scholar]
  31. Xu, L.; Park, K.H.; Zhao, L.; Xu, J.; El Refaey, M.; Gao, Y.; Zhu, H.; Ma, J.; Han, R. CRISPR-mediated Genome Editing Restores Dystrophin Expression and Function in mdx Mice. Mol. Ther. 2016, 24, 564–569. [Google Scholar] [CrossRef] [PubMed] [Green Version]
  32. Weidensdorfer, D.; Stöhr, N.; Baude, A.; Lederer, M.; Köhn, M.; Schierhorn, A.; Buchmeier, S.; Wahle, E.; Hüttelmaier, S. Control of c-myc mrna stability by igf2bp1-associated cytoplasmic rnps. Rna 2009, 15, 104–115. [Google Scholar] [CrossRef] [Green Version]
  33. Ye, X.T.; Huang, H.; Huang, W.P.; Hu, W.L. LncRNA THOR promotes human renal cell carcinoma cell growth. Biochem. Biophys. Res. Commun. 2018, 501, 661–667. [Google Scholar] [CrossRef] [PubMed]
  34. Li, Z.W.; Xue, M.; Zhu, B.X.; Yue, C.L.; Chen, M.; Qin, H.H. microRNA-4500 inhibits human glioma cell progression by targeting IGF2BP1. Biochem. Biophys. Res. Commun. 2019, 513, 800–806. [Google Scholar] [CrossRef] [PubMed]
  35. Moreira, D.P.; Melo, R.M.C.; Weber, A.A.; Rizzo, E. Insulin-like growth factors 1 and 2 are associated with testicular germ cell proliferation and apoptosis during fish reproduction. Reprod. Fertil. Dev. 2020, 32, 988–998. [Google Scholar] [CrossRef] [PubMed]
  36. Li, Y.; Zheng, J.; Gong, C.; Lan, K.; Shen, Y.; Ding, X. Development of an immunogenomic landscape for the competing endogenous RNAs network of peri-implantitis. BMC Med. Genet. 2020, 21, 208. [Google Scholar] [CrossRef]
  37. Chang, Y.; Wang, X.; Xu, Y.; Yang, L.; Qian, Q.; Ju, S.; Chen, Y.; Chen, S.; Qin, N.; Ma, Z.; et al. Comprehensive characterization of cancer-testis genes in testicular germ cell tumor. Cancer Med. 2019, 8, 3511–3519. [Google Scholar] [CrossRef]
  38. Xue, J.; Zhong, S.; Sun, B.M.; Sun, Q.F.; Hu, L.Y.; Pan, S.J. Lnc-THOR silencing inhibits human glioma cell survival by activating MAGEA6-AMPK signaling. Cell Death Dis. 2019, 10, 866. [Google Scholar] [CrossRef]
  39. Cheng, Z.; Lei, Z.; Yang, P.; Si, A.; Xiang, D.; Zhou, J.; Huser, N. Long non-coding RNA THOR promotes cell proliferation and metastasis in hepatocellular carcinoma. Gene 2018, 678, 129–136. [Google Scholar] [CrossRef]
  40. Song, H.; Wei, M.; Liu, W.; Shen, S.; Li, J.; Wang, L. Cisplatin induced apoptosis of ovarian cancer A2780s cells by activation of ERK/p53/PUMA signals. Histol. Histopathol. 2018, 33, 73–79. [Google Scholar]
  41. Fang, C.Y.; Wu, C.Z.; Chen, P.N.; Chang, Y.C.; Chuang, C.Y.; Lai, C.T.; Yang, S.F.; Tsai, L.L. Antimetastatic potentials of salvianolic acid A on oral squamous cell carcinoma by targeting MMP-2 and the c-Raf/MEK/ERK pathway. Environ. Toxicol. 2018, 33, 545–554. [Google Scholar] [CrossRef] [PubMed]
  42. Schmeisser, M.J.; Baumann, B.; Johannsen, S.; Vindedal, G.F.; Jensen, V.; Hvalby, O.C.; Sprengel, R.; Seither, J.; Maqbool, A.; Magnutzki, A.; et al. IkappaB kinase/nuclear factor kappaB-dependent insulin-like growth factor 2 (Igf2) expression regulates synapse formation and spine maturation via Igf2 receptor signaling. J. Neurosci. 2012, 32, 5688–5703. [Google Scholar] [CrossRef] [PubMed]
Figure 1. The evolutionary relationship and tissue conservation of THOR in vertebrates. (A) Sequence alignment of THOR in 12 representative vertebrates. (B) Measurement of mouse THOR expression by qRT-PCR in an adult murine tissue panel (data are shown as the mean ± SD from two independent experiments).
Biomedicines 09 00859 g001
Figure 2. Generation of lncRNA THOR-deficient mice. (A) Schematic diagram of the sgRNA targeting of the mouse THOR gene locus. THOR exons are indicated by rectangles, the target sites of the 2 sgRNA sequences (sgRNA 1 and sgRNA 2) are highlighted in red, and the protospacer-adjacent motif (PAM) sequence is highlighted in green. Primers F and R were used to detect mutations in mice. (B) Target sequences of the two sgRNAs and complementary oligo sgRNAs. (C) Schematic depicting the creation of the THOR-deficient mouse model. (D) THOR mutation detection in mice by T-cloning and Sanger sequencing. (E) PCR analysis of THOR mutations in pups (M) D2000; 1–8 represent the newborn mice used in this study. (F) Mutations in 8-week-old THOR+/− and THOR−/− were detected by qRT-PCR. Compared with that in the WT control group, the expression of THOR in THOR-deficient mice was significantly decreased. **** indicates p ≤ 0.0001 as determined by a t-test. The data are shown as the mean ± SD from two independent experiments. (G) Detection of off-target effects in THOR-deficient mice. T7E1 cleavage analysis of three potential off-target sites (POTS) for sgRNA 1, M, DL2000; 1–3 represent the three POTS. T7E1 cleavage analysis of seven POTS for sgRNA 2, M, DL2000; 4–10 represent the seven POTS. T-cloning and Sanger sequencing of the three POTS for sgRNA1. The region including the 20 bp of the POTS and the PAM is shown in the shadow. T-cloning and Sanger sequencing of the seven POTS for sgRNA 2. The region including the 20 bp of the POTS and the PAM is shown in blue. (H) The centroid and MFE secondary structures of THOR and THOR−/− mice were predicted (http://rna.tbi.univie.ac.at/ accessed on 1 July 2021). The red color indicates strong confidence for the prediction of each base.
Biomedicines 09 00859 g002
Figure 3. THOR-deficient mice exhibit decreased fertility and an imbalance between females and males. (A) Comparison of the body weights of WT and THOR-deficient male mice. * indicates p ≤ 0.05 as determined by a t-test. The data are shown as the mean ± SD from two independent experiments. (B) Food intake changes in the mice. ** indicates p ≤ 0.01 as determined by a t-test, and **** indicates p ≤ 0.0001 as determined by a t-test. The data are shown as the mean ± SD from two independent experiments. (C) Survival curve statistics of WT and THOR-deficient mice. Ten mice in each group. (D) The testes/body weights of WT and THOR-deficient mice. ** indicates p ≤ 0.01 as determined by a t-test, and *** indicates p < 0.001 as determined by a t-test. The data are shown as the mean ± SD from two independent experiments. (E) The fertilization rates of WT female mouse oocytes after in vitro fertilization with sperm from WT and THOR-deficient male mice. (F) Embryonic development after THOR deletion by microinjection of the sgRNA and Cas9 mRNA mixture. Each group of 100 oospheres, repeat 3 times. * indicates p ≤ 0.05 as determined by a t-test. The data are shown as the mean ± SD from two independent experiments. (G) Female mice in estrus were mated with male mice of different genotypes, and the vaginal suppositories were counted the next morning. Six pairs of mice in each group. (H) Female mice in estrus were mated with male mice of different genotypes, and the fertilization of female mice with vaginal suppositories was assessed the next morning. n is the total number of embryos in female mice whose vaginal plugs were detected after mating in Figure 3G. Cultured in vitro for 24 h developed into 2-cell as a fertilization mark. (I) The reproductive statuses of the offspring of mice with different genotypes after 6 months of mating at a 1:1 ratio. (J) The female-to-male ratio of offspring from mice of different genotypes after 6 months of mating at a 1:1 ratio.
Biomedicines 09 00859 g003
Figure 4. THOR deficiency affects testicular development in male mice. (A) Photos of 8-week-old male WT and THOR-deficient mice. From left to right are WT, THOR/, THOR+/ mice. (B) Comparison of the reproductive systems of 8-week-old male WT and THOR-deficient mice. From left to right are WT, THOR+/, THOR/ mice. (C) Comparison of the testicular morphologies of 8-week-old WT and THOR-deficient mice. From left to right are WT, THOR+/, THOR/ mice. (D) H&E-stained tracheal sections of the testes of WT mice and THOR-deficient mice. In the testes of THOR-deficient mice, the seminiferous tubules had decreased diameters and were sparsely arranged and Sertoli and germ cells were arranged abnormally. (E) Immunohistochemical staining of the testes of WT and THOR-deficient mice. (F) Comparison of the diameters and circumferences of WT and THOR-deficient mouse seminiferous tubules. **** indicates p ≤ 0.0001 as determined by a t-test. The data are shown as the mean ± SD from two independent experiments. (G) The apoptotic rates of Sertoli cells in the seminiferous tubules of WT and THOR-deficient mice were determined by immunohistochemistry.
Biomedicines 09 00859 g004
Figure 5. THOR deficiency affects sperm development. (A) Comparison of the density, motility, and deformity rates of epididymal sperm in WT and THOR-deficient mice. (B) Comparison of the levels of T and LH in the blood of WT and THOR-deficient mice. * indicates p ≤ 0.05 as determined by a t-test, ** indicates p ≤ 0.01 as determined by a t-test, and *** indicates p ≤ 0.001 as determined by a t-test. The data are shown as the mean ± SD from two independent experiments. (C) Normal sperm stained with eosin-nigrosin. (D) Abnormal sperm from THOR-deficient mice stained with eosin-nigrosin.
Biomedicines 09 00859 g005
Figure 6. THOR deficiency affects sperm development. (A) Effect of THOR deficiency on the relative mRNA expression levels of target genes as determined by qRT-PCR. *** indicates p ≤ 0.001 as determined by a t-test, and **** indicates p < 0.0001 as determined by a t-test. The data are shown as the mean ± SD from three independent experiments. (B) Western blot analysis of testicular tissues from THOR-deficient mice. (C) Semiquantitative analysis of protein expression. (D) The mechanism of the effect of THOR on testicular and sperm development.
Biomedicines 09 00859 g006
Publisher’s Note: MDPI stays neutral with regard to jurisdictional claims in published maps and institutional affiliations.

