Large Population Analysis of Secondary Cancers in Pediatric Leukemia Survivors


1
Department of Epidemiology, Johns Hopkins Bloomberg School of Public Health, Baltimore, MD 21205, USA
2
Department of Biotechnology, GITAM University, Visakhapatnam, AP 530045, India
3
Center for Distance Learning, GITAM University, Visakhapatnam, AP 530045, India
4
Department of Physiology, Johns Hopkins School of Medicine, Baltimore, MD 21205, USA
*
Author to whom correspondence should be addressed.
Children 2019, 6(12), 130; https://0-doi-org.brum.beds.ac.uk/10.3390/children6120130
Submission received: 23 August 2019
/
Revised: 7 November 2019
/
Accepted: 26 November 2019
/
Published: 29 November 2019
(This article belongs to the Special Issue Leukemia and Other Types of Cancer in Childhood. Medical and Nursing Care Issues for the Improvement of Young Patients’ Quality of Life)
Abstract
:Introduction: Survivors of childhood cancer have an increased risk of developing a subsequent secondary malignant neoplasm (SMN). Among five-year survivors of primary cancer, SMNs account for nearly half of non-relapse deaths, which make them the most frequent cause of non-relapse mortality. Leukemia is the most common childhood cancer and the five-year survival rate of leukemia has drastically improved over the past two decades. Therefore, the chances of developing SMNs are higher in pediatric (0–19 years) leukemia survivors. Methods: The US based Surveillance, Epidemiology, and End Results (SEER-18) database (1973–2014) was probed for SMNs in the pediatric population (age ≤ 19). Variables Sequence-number central, primary site and ICCC3WHO were used to identify the first and second cancers among patients who developed SMN. Results: Our SEER database analysis found 99,380 cases of pediatric primary malignancies (0–19 years), of which 1803 (1.81%) patients developed SMN. The breakdown of SMNs in pediatric leukemia survivors (n = 251) showed thyroid carcinoma (18.33% of cases) as the most common second cancer, followed by sarcoma (15.14%), astrocytoma (10.36%), lymphoma (9.56%), salivary gland carcinoma (7.17%), melanoma (4.38%), and breast cancer (3.98%). Interestingly, we found that over 76% of SMNs that were developed by leukemia patients occurred within 20 years after initial leukemia diagnosis. However, some SMNs occur during later age, for example, the mean age for breast cancer occurrence in leukemia survivors is 26.20 ± 8.53 years after initial leukemia diagnosis. Conclusions: Our study presented comprehensive rates of SMNs among pediatric cancers survivors, and the potential SMNs for pediatric leukemia survivors. This information could we used by oncologists, patients, patient families, and cancer researchers to understand the long-term risks that are associated with the development of SMNs in pediatric leukemia survivors.
1. Introduction
Cancer is the second most common cause of death among children (1–14 years) in the United States. In 2019, it is estimated that 11,060 children will be diagnosed with cancer and 1190 will eventually die from the disease [1]. There has been a decline in cancer mortality in children and adolescents (15–19 years) over the past decades. Cancer mortality was reduced from 6.5 per 100,000 population in 1970, to 2.3 per 100,000 population in 2016 [1]. This reduction is approximately 65% in children and 61% in adolescents [1]. Survival after childhood cancer exceeds 80% in the United States and Europe [2,3]. The number of pediatric cancer survivors in the United States is predicted to approach 500,000 by 2020, which is approximately one survivor for every 750 individuals [4]. As the survival of the pediatric patients (0–19 years) continues to improve, the burden of long-term effects of therapies is also on rise. Secondary malignant neoplasm (SMN), which are new primary malignancies after an initial cancer diagnosis, are one of the side effects of cancer therapy [4]. Among five-year survivors of primary cancer, SMNs account for nearly half of non-relapse deaths, which makes them the most frequent cause of non-relapse mortality [5]. Twenty years following the original diagnosis, pediatric cancer survivors have a four-to-six fold greater risk of developing a new cancer than the general population [5]. Therefore, SMNs are an increasing epidemiologic concern in pediatric cancer survivors.
Risk factors that lead to SMNs include age, hereditary predisposition, and side effects of cancer therapy while treating the first malignancy [6]. Single malignant cell forms tumor with the passage of time, thus the diagnosis of SMNs increases with survivorship years. Genetic or hereditary risk factors, such as RB1, BRCA1/2, NF1, TP53, MLH1, MSH2, MSH6 VHL47, DICER1, and etc., are associated with SMNs [6,7]. Alkylating agents that are used to treat many pediatric malignancies increase the relative risk for a SMN by 1.4–2.2 fold. In particular, exposure to alkylating agents is associated with an increased risk of hematologic malignancies [6,7]. The exposure of first malignancies with topoisomerase inhibitors have an increased risk of developing solid tumors and acute myeloid leukemia as SMNs [6]. Ionizing radiation is a part of standard care therapy for many childhood cancers. Therapy-related ionizing radiation exposure was associated with a 2.7-fold relative risk of developing SMNs, and it is the strongest independent risk factor in the development of SMNs [6]. Several pediatric cancers are preconditioned with Hematopoietic Stem Cell Transplantation (HSCT) before the treatment; patients undergoing HSCT are reported to have an eight-fold higher incidence of SMNs as compared to the general population [6]. Further, environmental/behavioral factors are also associated with SMNs [6].
Leukemia is a cancer of the early blood-forming cells. Leukemia are broadly classified as acute (fast growing) or chronic (slower growing), and by whether they originate from myeloid cells or lymphoid cells [8]. Leukemia is the most common childhood cancer, constituting 29% of all pediatric cancers, 22% of these are lymphoid leukemia, and 4% are myeloid leukemia. In adolescents, leukemia is the third most common cancer, accounting for 13% of total cases [1].
The five-year overall survival rate of lymphoid leukemia is over 90% in children and close to 75% in adolescents, and ~65% in myeloid leukemia [1,9,10]. This means that many pediatric patients with leukemia will live longer. Further, the treatment of both lymphoid and myeloid leukemia include alkylating agents, radiation, and stem cell transplant is used sometimes to improve the chances of cure [8].
Taken together, these factors contribute to elevated chances of SMNs in pediatric leukemia survivors. Therefore, we probed The Surveillance, Epidemiology, and End Results (SEER) database to report the incidence of SMNs in pediatric leukemia survivors.
2. Materials and Methods
SEER Database Analysis
We utilized the Surveillance, Epidemiology, and End Results (SEER) database, which includes data from 18 cancer registries (SEER-18) and represents 28% of the US population, to extract the study population. Pediatric patients (age ≤ 19) at the time of diagnosis of first malignancy who developed a second cancer, excluding relapse, between the years 1973–2014 were selected. The patients who were reported as having non-malignant tumors and those with unknown age were excluded from the analysis. We used the Sequence number-central variable to identify the patients who developed more than one reportable malignant neoplasm. We used the variables primary site and ICCC3WHO (International Classification of Childhood Cancer, World Health Organization) (ICCC Site Recode ICD-O-3/ WHO 2008), a recoded variable provided by SEER that is based on site/histology, to exclude the cases with the same values in the first and second cancers. Further, we created broader categories to identify and exclude cases with different ICCC3WHO recodes but similar malignancies. For example, a patient reported developing lymphoid leukemia as the first cancer and myeloid leukemia as the second cancer was excluded from the analysis. Further, we identified the number of pediatric patients (0–19 years) with leukemia who developed second cancers. The median follow up time in the SEER database is 12 years (range: 0–41) for patients who developed second cancers, and 13 years (range: 0–41) for leukemia survivors who developed SMN.
3. Results
Our SEER database analysis found that, out of 99,380 cases of primary pediatric malignancies (0-19 years), 24,403 cases (24.58%) are leukemia. The total number of SMN cases developed is 1803 (1.81%). The most common SMN was leukemia, which accounted for 227 cases (12.59% of total cases). The second most common SMN is thyroid cancer (217, 12.04%), followed by sarcoma (207, 11.48%), breast carcinoma (203, 11.26%), malignant melanoma (89, 4.94%), and lymphoma (83, 4.60%) (Table 1, Figure S1A).
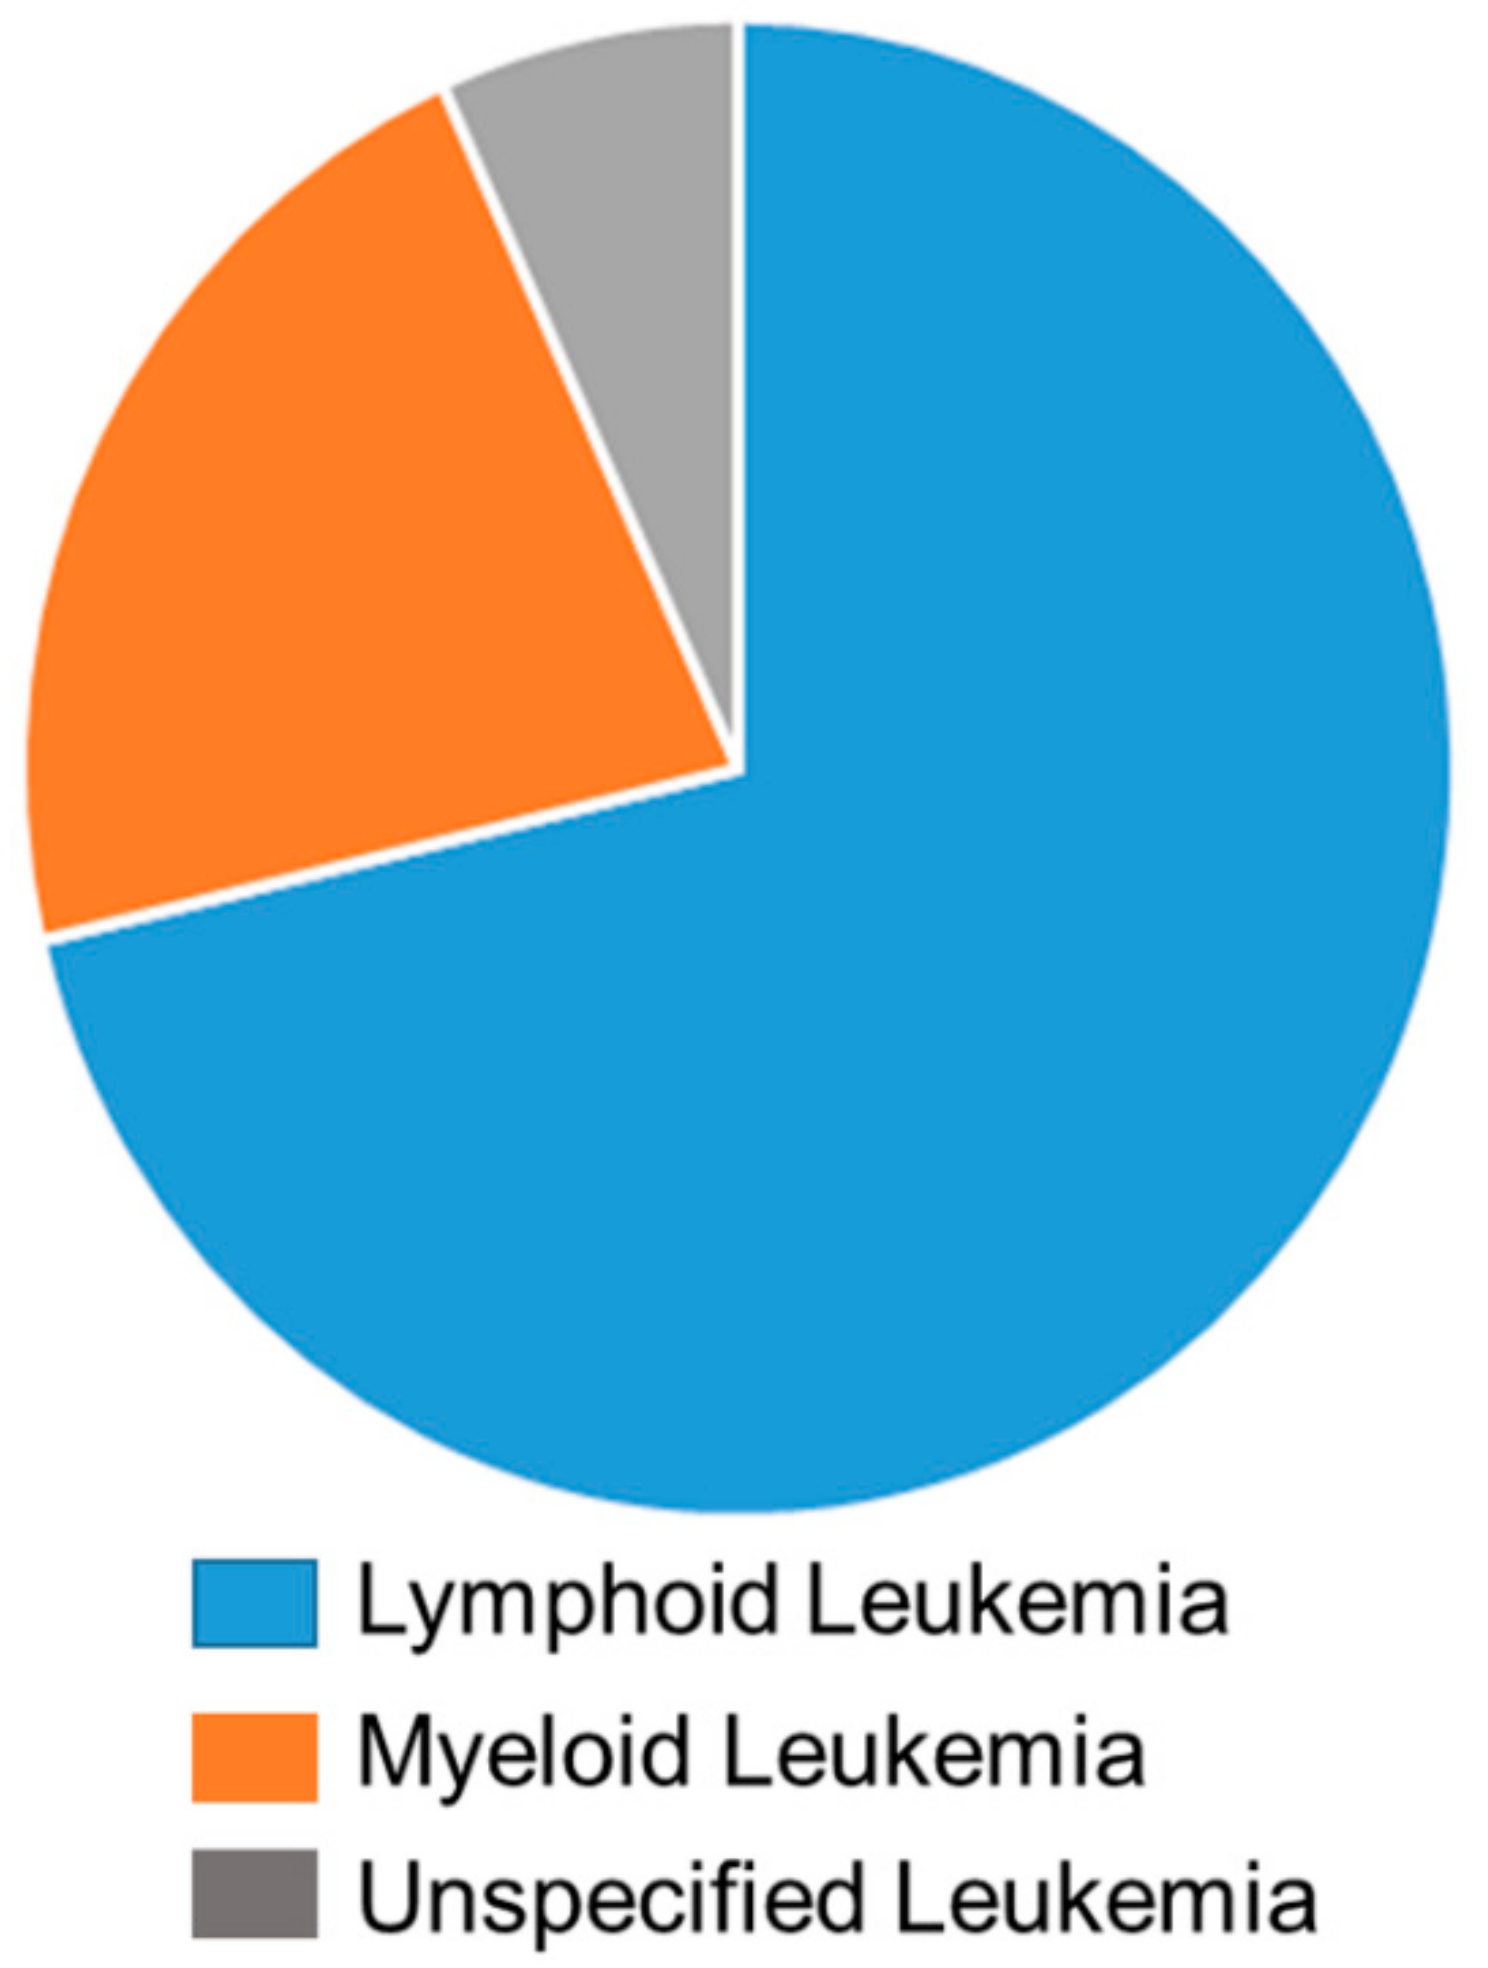
Out of 24,403 leukemia cases, 251 patients (1.03% of total leukemia cases) developed secondary cancers. The breakdown of leukemia primary cancer into the sub groups showed that lymphoid leukemia patients are more prone to second cancer, accounting for 179 cases (71.31%). Fifty-five cases (21.91%) were reported as myeloid leukemia, and 17 cases (6.78%) are unspecified and specified leukemia (Figure 1).
The breakdown of SMNs in pediatric leukemia survivors showed that thyroid carcinoma is the most common second cancer, where 46 cases are reported, accounting for 18.33%, which is approximately one-fifth of all SMNs. Sarcoma is the second most common, with 38 cases (15.14%), followed by astrocytoma (26 cases, 10.36%), lymphoma (24 cases, 9.56%), salivary gland carcinoma (18 cases, 7.17%), melanoma (11 cases, 4.38%), breast cancer (10 cases, 3.98%), and etc. (Table 2, Figure S1B).
Time since diagnosis is one of the factors for SMNs, and we investigated the effect of elapsed time for subsequent cancers after leukemia. Interestingly, the incidence of SMNs decreases with age in pediatric leukemia survivors. We found that 43.42% (109 of 251 cases) SMNs developed within 10 years after primary diagnosis of leukemia and 76.09% (191 of 251 cases) SMNs occurred within 20 years (Table 3).
We also analyzed the distribution of sex, age at initial diagnosis, and cases by decade for the pediatric leukemia survivors who developed SMNs. There is no sizable difference in the number of males and females developing SMNs in lymphoid leukemia, females are more prone to SMNs in myeloid leukemia (Table 4).
4. Discussion
SMNs are rare but devastating complications for cancer survivors. The five-year survival rate of pediatric leukemia has seen significant improvement over the last two decades. Further, leukemia treatment includes alkylating agents and radiation. This means that many pediatric patients with leukemia will live longer and have an increased chance of developing SMNs. Our study showed that leukemia is the most common SMN in pediatric survivors. Here, we report 251 pediatric leukemia survivors who were diagnosed with SMNs, where thyroid cancer is the most common SMN, followed by sarcoma, astrocytoma, and lymphoma.
Our results show that leukemia is a common SMN in the pediatric population. Similar results were also shown in a retrospective review that was conducted on patients diagnosed (1990–2012) with childhood cancer under age 21 in National University Hospital, Singapore [11]. Analysis of medical data in the Korea Central Cancer Registry (KCCR) showed leukemia as the second most common SMN in Korean childhood cancer patients (diagnosed from 1993–2012) [12]. The Pediatric Oncology Group of Ontario Networked Information System (POGONIS) captures 98% of the incident cancer cases in Ontario that were diagnosed in the 0 to 14.9-year age range. Analysis of SMNs in the POGONIS databased showed that 40% of SMNs developed within five years after primary cancer, and leukemia was the most common SMN accounting for 23.9% of total SMNs [13]. Nottage, K. et al. reported that there is a statistically significantly increased risk of subsequent leukemia occurring ≥15 years from treatment of a primary childhood cancers [14]. These results show a trend that is consistent with our results.
Similar to our results, thyroid cancer was reported as the second most common (22% of total cases) SMN in patients that were diagnosed with acute myeloid or acute lymphoblastic leukemia (0–18 years), who survived at least five years after diagnosis [15]. Similarly, a population-based registry study in which 13 registries from around the world provided individual data on more than 16,500 survivors of childhood leukemia showed that lymphoma and thyroid cancers are among the top three SMNs [16]. Another study obtained chemotherapy and radiotherapy information from the medical records of 12,547 five-year survivors of childhood cancer diagnosed from 1970 through 1986, showed that treatments with alkylating agents increased the chance of developing thyroid cancer SMNs [17]. Childhood acute leukemia survivors who received radiotherapy were diagnosed with the greatest risk of short stature, hypothyroidism, and a reduced likelihood of pregnancy or live birth [18]. Additionally, various sarcoma cases are reported as SMNs in pediatric leukemia survivors [19,20,21].
Similar to our study, Choi DK et al. reported that SMNs decrease in childhood cancer survivors with the increase in time elapsed since primary malignancy diagnosis [6]. However, the mean age for development of breast cancer SMNNMs in pediatric leukemia survivors is 26.2 ± 8.53 years. Similarly, it is 19.6 ± 9.67 years for thyroid cancer SMNs. This shows the time elapsed since primary diagnosis is still an important determinant of SMNs for some cancers.
Adolescents and young adults who survive cancer for more than five years were shown to have a higher relative risk of SMN as compared with the general population, and they have a higher absolute risk of SMN when compared with younger or older cancer survivors [22,23].
Although the SEER database is an extremely valuable tool it has a few limitations. SEER data does not track long term outcomes, toxicities, and the cumulative chemotherapy doses of primary cancers. With regard to the investigation of SMNs, a patient moving away from a SEER registry region would be lost from the database, and a subsequent SMN would be unrecorded. This might lead to a relative undercounting of SMNs [24]. A limitation of our study is the exclusion of survivors who suffered from two distinct leukemias. In our analysis, we defined SMN as developing a different second cancer when compared to primary. As a result, a total of 100 patients with leukemia were excluded because they developed leukemia as both primary and secondary cancer. Among them, twelve patients had same type of leukemia and, in 27 cases, diagnosis is unspecified in either primary or secondary leukemia. The remaining 61 excluded cases include patients with distinct leukemia as primary and secondary cancers (for example, myeloid leukemia as primary and lymphoid leukemia as secondary cancer respectively).
5. Conclusions
Our study presented comprehensive rates of SMNs among pediatric cancers survivors, and the potential SMNs for pediatric leukemia survivors. This information will be helpful for oncologists, patients, patient families, and cancer researchers to understand the long-term risks that are associated with the development of SMNs in pediatric leukemia survivors.
Supplementary Materials
All the supplementary data for this article are available online at https://0-www-mdpi-com.brum.beds.ac.uk/2227-9067/6/12/130/s1. Figure S1; Flow chart representing Table 1 (Panel A) and Table 2 (panel B).
Author Contributions
Conceptualization, M.R.M.; Statistical analysis, S.Y. and M.R.M.; Visualization, Y.M. and S.S.; Writing—Original Draft Preparation, M.R.M.; Writing—Review & Editing, S.Y., Y.M., and S.S.
Funding
This research received no external funding.
Acknowledgments
Authors like to thank Ashly Hindle (Texas Tech University Health Sciences Center School of Medicine) for proofreading the manuscript.
Conflicts of Interest
The authors declare no conflicts of interest.
References
- Miller, R.L.S.K.D.; Jemal, A. Cancer statistics 2019. CA A Cancer J. Clin. 2019, 69, 7–34. [Google Scholar] [CrossRef]
- Mogensen, H.; Modig, K.; Tettamanti, G.; Erdmann, F.; Heyman, M.; Feychting, M. Survival after childhood cancer–social inequalities in high-income countries. Front. Oncol. 2018, 8, 485. [Google Scholar] [CrossRef]
- Tai, E.W.; Ward, K.C.; Bonaventure, A.; Siegel, D.A.; Coleman, M.P. Survival among children diagnosed with acute lymphoblastic leukemia in the United States, by race and age 2001 to 2009: Findings from the CONCORD-2 study. Cancer 2017, 123, 5178–5189. [Google Scholar] [CrossRef]
- Robison, L.L.; Hudson, M.M. Survivors of childhood and adolescent cancer: Life-long risks and responsibilities. Nat. Rev. Cancer 2014, 14, 61. [Google Scholar] [CrossRef]
- Inskip, P.D.; Curtis, R.E. New malignancies following childhood cancer in the United States 1973–2002. Int. J. Cancer 2007, 121, 2233–2240. [Google Scholar] [CrossRef]
- Choi, D.K.; Helenowski, I.; Hijiya, N. Secondary malignancies in pediatric cancer survivors: Perspectives and review of the literature. Int. J. Cancer 2014, 135, 1764–1773. [Google Scholar] [CrossRef]
- Mertens, A.C.; Liu, Q.; Neglia, J.P.; Wasilewski, K.; Leisenring, W.; Armstrong, G.T.; Robison, L.L.; Yasui, Y. Cause-specific late mortality among 5-year survivors of childhood cancer: The Childhood Cancer Survivor Study. J. Natl. Cancer Inst. 2008, 100, 1368–1379. [Google Scholar] [CrossRef]
- Hiddemann, W. Handbook of Acute Leukemia; Springer: Berlin, Germany, 2016. [Google Scholar]
- Makena, M.R.; Koneru, B.; Nguyen, T.H.; Kang, M.H.; Reynolds, C.P. Reactive oxygen species-mediated synergism of fenretinide and romidepsin in preclinical models of T-cell lymphoid malignancies. Mol. Cancer Ther. 2017, 16, 649–661. [Google Scholar] [CrossRef] [PubMed]
- Makena, M.R.; Nguyen, T.H.; Koneru, B.; Hindle, A.; Chen, W.-H.; Verlekar, D.U.; Kang, M.H.; Reynolds, C.P. Vorinostat and Fenretinide Synergize in Preclinical Models of T-Cell Lymphoid Malignancies via Reactive Oxygen Species; AACR: Philadelphia, PA, USA, 2018. [Google Scholar]
- Lim, J.W.; Yeap, F.S.; Chan, Y.H.; Yeoh, A.E.; Quah, T.C.; Tan, P.L. Second malignant neoplasms in childhood Cancer survivors treated in a tertiary Paediatric oncology Centre. Ann. Acad. Med. Singap. 2017, 46, 11–19. [Google Scholar] [PubMed]
- Ju, H.Y.; Moon, E.-K.; Lim, J.; Park, B.K.; Shin, H.Y.; Won, Y.-J.; Park, H.J. Second malignant neoplasms after childhood cancer: A nationwide population-based study in Korea. PLoS One 2018, 13, e0207243. [Google Scholar] [CrossRef] [PubMed]
- Pole, J.D.; Gu, L.Y.; Kirsh, V.; Greenberg, M.L.; Nathan, P.C. Subsequent malignant neoplasms in a population-based cohort of pediatric cancer patients: A focus on the first 5 years. Cancer Epidemiol. Prev. Biomark. 2015, 24, 1585–1592. [Google Scholar] [CrossRef] [PubMed]
- Nottage, K.; Lanctot, J.; Li, Z.; Neglia, J.P.; Bhatia, S.; Hammond, S.; Leisenring, W.; Meadows, A.; Srivastava, D.; Robison, L.L. Long-term risk for subsequent leukemia after treatment for childhood cancer: A report from the Childhood Cancer Survivor Study. Blood 2011, 117, 6315–6318. [Google Scholar] [CrossRef] [PubMed]
- Perkins, S.M.; DeWees, T.; Shinohara, E.T.; Reddy, M.M.; Frangoul, H. Risk of subsequent malignancies in survivors of childhood leukemia. J. Cancer Surviv. 2013, 7, 544–550. [Google Scholar] [CrossRef] [PubMed]
- Maule, M.; Scélo, G.; Pastore, G.; Brennan, P.; Hemminki, K.; Tracey, E.; Sankila, R.; Weiderpass, E.; Olsen, J.H.; McBride, M.L. Risk of second malignant neoplasms after childhood leukemia and lymphoma: An international study. J. Natl. Cancer Inst. 2007, 99, 790–800. [Google Scholar] [CrossRef] [PubMed]
- Veiga, L.H.; Bhatti, P.; Ronckers, C.M.; Sigurdson, A.J.; Stovall, M.; Smith, S.A.; Weathers, R.; Leisenring, W.; Mertens, A.C.; Hammond, S. Chemotherapy and thyroid cancer risk: A report from the childhood cancer survivor study. Cancer Epidemiol. Prev. Biomark. 2012, 21, 92–101. [Google Scholar] [CrossRef]
- Chow, E.J.; Liu, W.; Srivastava, K.; Leisenring, W.M.; Hayashi, R.J.; Sklar, C.A.; Stovall, M.; Robison, L.L.; Baker, K.S. Differential effects of radiotherapy on growth and endocrine function among acute leukemia survivors: A childhood cancer survivor study report. Pediatr. Blood Cancer 2013, 60, 110–115. [Google Scholar] [CrossRef]
- Schiffman, J.D.; Wright, J. Ewing’s Sarcoma and Second Malignancies. Sarcoma 2011, 2011, 736841. [Google Scholar] [CrossRef]
- Wolpert, F.; Grotzer, M.A.; Niggli, F.; Zimmermann, D.; Rushing, E.; Bode-Lesniewska, B. Ewing’s sarcoma as a second malignancy in long-term survivors of childhood hematologic malignancies. Sarcoma 2016, 2016, 5043640. [Google Scholar] [CrossRef]
- Henderson, T.O.; Whitton, J.; Stovall, M.; Mertens, A.C.; Mitby, P.; Friedman, D.; Strong, L.C.; Hammond, S.; Neglia, J.P.; Meadows, A.T. Secondary sarcomas in childhood cancer survivors: A report from the Childhood Cancer Survivor Study. J. Natl. Cancer Inst. 2007, 99, 300–308. [Google Scholar] [CrossRef]
- Keegan, T.H.; Bleyer, A.; Rosenberg, A.S.; Li, Q.; Goldfarb, M. Second primary malignant neoplasms and survival in adolescent and young adult cancer survivors. JAMA Oncol. 2017, 3, 1554–1557. [Google Scholar] [CrossRef]
- Lee, J.S.; DuBois, S.G.; Coccia, P.F.; Bleyer, A.; Olin, R.L.; Goldsby, R.E. Increased risk of second malignant neoplasms in adolescents and young adults with cancer. Cancer 2016, 122, 116–123. [Google Scholar] [CrossRef] [PubMed]
- Duggan, M.A.; Anderson, W.F.; Altekruse, S.; Penberthy, L.; Sherman, M.E. The surveillance, epidemiology and end results (SEER) program and pathology: Towards strengthening the critical relationship. Am. J. Surg. Pathol. 2016, 40, e94. [Google Scholar] [CrossRef] [PubMed]
Figure 1.
The breakdown of primary leukemia into sub-groups. Lymphoid leukemia are represented in blue (71.31%), myeloid leukemia are represented in orange (21.91%), and unspecified and specified leukemia are represented in grey (6.78%).
Figure 1.
The breakdown of primary leukemia into sub-groups. Lymphoid leukemia are represented in blue (71.31%), myeloid leukemia are represented in orange (21.91%), and unspecified and specified leukemia are represented in grey (6.78%).


Table 1.
Secondary malignant neoplasms (SMNs) in Pediatric Cancer Survivors. SMN distribution in pediatric cancer survivors (0–19 years), analyzed using SEER database.
Table 1.
Secondary malignant neoplasms (SMNs) in Pediatric Cancer Survivors. SMN distribution in pediatric cancer survivors (0–19 years), analyzed using SEER database.
| Cancer | No. of Cases | % of Total SMN |
|---|---|---|
| Leukemia | 227 | 12.59 |
| Thyroid | 217 | 12.04 |
| Sarcoma | 207 | 11.48 |
| Breast | 203 | 11.26 |
| Melanoma | 89 | 4.94 |
| Lymphoma | 83 | 4.60 |
| Colon and Rectum | 63 | 3.49 |
| Astrocytoma | 56 | 3.11 |
| Renal | 46 | 2.55 |
| Lung | 43 | 2.38 |
| Others | 569 | 31.56 |
| Total | 1803 | 100% |
Table 2.
SMNs in Pediatric Leukemia Survivors. SMN distribution in pediatric leukemia survivors, analyzed using SEER database.
Table 2.
SMNs in Pediatric Leukemia Survivors. SMN distribution in pediatric leukemia survivors, analyzed using SEER database.
| Cancer | No. of Cases | % of Total SMN |
|---|---|---|
| Thyroid | 46 | 18.33 |
| Sarcoma | 38 | 15.14 |
| Astrocytoma | 26 | 10.36 |
| Lymphoma | 24 | 9.56 |
| Salivary gland carcinoma | 18 | 7.17 |
| Melanoma | 11 | 4.38 |
| Breast | 10 | 3.98 |
| Others | 78 | 31.08 |
| Total | 251 | 100% |
Table 3.
SMNs Distribution by Difference in Time Elapsed Since Diagnosis in Leukemia Survivors. Distribution of SMN occurrence by time elapsed since diagnosis of primary leukemia, analyzed using SEER database.
Table 3.
SMNs Distribution by Difference in Time Elapsed Since Diagnosis in Leukemia Survivors. Distribution of SMN occurrence by time elapsed since diagnosis of primary leukemia, analyzed using SEER database.
| Difference in Years | No. of Cases | % of Total SMN |
|---|---|---|
| 0–5 | 56 | 22.30 |
| 06 to 10 | 53 | 21.12 |
| 11 to 15 | 45 | 17.93 |
| 16 to 20 | 37 | 14.74 |
| 21 to 25 | 20 | 7.97 |
| 26 to 30 | 14 | 5.58 |
| 31 to 35 | 19 | 7.57 |
| >36 | 7 | 2.79 |
| Total | 251 | 100% |
Table 4.
Distribution by Sex, Age at Primary Diagnosis, and Cases by Decade in Leukemia Survivors, analyzed using SEER database. LL—Lymphoid leukemia, ML—Myeloid leukemia, and UL- Unspecified leukemia.
Table 4.
Distribution by Sex, Age at Primary Diagnosis, and Cases by Decade in Leukemia Survivors, analyzed using SEER database. LL—Lymphoid leukemia, ML—Myeloid leukemia, and UL- Unspecified leukemia.
| LL (n = 179) | ML (n = 55) | UL (n = 17) | |
|---|---|---|---|
| Sex | |||
| Male | 93 (52.0%) | 21 (38.2%) | 7 (41.2%) |
| Female | 86 (48.0%) | 34 (61.8%) | 10 (58.8%) |
| Age at Primary Diagnosis (Years) | |||
| Median (IQR) | 5 (3–11) | 9 (4–15) | 6 (3–9) |
| Cases by Decade | |||
| 1973–1982 | 45 | 13 | 7 |
| 1983–1992 | 45 | 12 | 3 |
| 1993–2002 | 57 | 14 | 3 |
| 2003–2013 | 32 | 16 | 4 |
© 2019 by the authors. Licensee MDPI, Basel, Switzerland. This article is an open access article distributed under the terms and conditions of the Creative Commons Attribution (CC BY) license (http://creativecommons.org/licenses/by/4.0/).
Share and Cite
MDPI and ACS Style
Yavvari, S.; Makena, Y.; Sukhavasi, S.; Makena, M.R. Large Population Analysis of Secondary Cancers in Pediatric Leukemia Survivors. Children 2019, 6, 130. https://0-doi-org.brum.beds.ac.uk/10.3390/children6120130
AMA Style
Yavvari S, Makena Y, Sukhavasi S, Makena MR. Large Population Analysis of Secondary Cancers in Pediatric Leukemia Survivors. Children. 2019; 6(12):130. https://0-doi-org.brum.beds.ac.uk/10.3390/children6120130
Chicago/Turabian StyleYavvari, Siddhartha, Yasaswi Makena, Sahithi Sukhavasi, and Monish Ram Makena. 2019. "Large Population Analysis of Secondary Cancers in Pediatric Leukemia Survivors" Children 6, no. 12: 130. https://0-doi-org.brum.beds.ac.uk/10.3390/children6120130
Note that from the first issue of 2016, this journal uses article numbers instead of page numbers. See further details here.