Fat Mass Index (FMI) as a Trustworthy Overweight and Obesity Marker in Mexican Pediatric Population

 , ,
, ,
Abstract
:1. Introduction
Childhood Obesity in the Mexican Population
2. Materials and Methods
2.1. BMI or FM Percentage as Diagnostic Tools for Overweight and Obesity
2.2. Fat Mass Index as a Diagnostic Tool
2.3. Calculating Cutoff Points Proposed for Mexican Pediatric Population
3. Results
4. Discussion
5. Conclusions
Author Contributions
Funding
Conflicts of Interest
Appendix A

| BMI (kg/m2), FM%, and FMI Cutoff Points vs. Mexican Pediatric Population Values | ||||||||||||||||||||||||
|---|---|---|---|---|---|---|---|---|---|---|---|---|---|---|---|---|---|---|---|---|---|---|---|---|
| Age (Years) | 3rd Percentile | 10th Percentile | 25th Percentile | 50th Percentile | 75th Percentile | 85th Percentile | 90th Percentile | 97th Percentile | ||||||||||||||||
| Boys | BMI | % FM | FMI | BMI | % FM | FMI | BMI | % FM | FMI | BMI | % FM | FMI | BMI | % FM | FMI | BMI | % FM | FMI | BMI | % FM | FMI | BMI | % FM | FMI |
| 6 | IW | NR | NA | IW | NR | NA | IW | NR | IA | OW | NR | IA | OL | RO | AH | MO | O | MO | MO | O | MO | SO | O | SO |
| 7 | IW | NR | NA | IW | NR | NA | IW | NR | IA | OW | NR | AH | OW | RO | AH | MO | O | MO | MO | O | MO | SO | O | SO |
| 8 | NW | NR | NA | IW | NR | IA | IW | NR | IA | OW | RO | AH | OW | O | AH | MO | O | MO | MO | O | MO | SO | O | SO |
| 9 | NW | NR | IA | IW | NR | IA | IW | NR | AH | OW | RO | AH | OW | O | MO | MO | O | MO | MO | O | MO | SO | O | SO |
| 10 | NW | NR | IA | IW | NR | IA | IW | RO | AH | OW | O | AH | OW | O | MO | MO | O | MO | MO | O | MO | SO | O | SO |
| 11 | NW | NR | IA | IW | NR | IA | IW | RO | AH | OW | O | AH | OW | O | MO | MO | O | MO | MO | O | MO | SO | O | SO |
| 12 | NW | NR | IA | IW | NR | IA | IW | RO | AH | OW | O | AH | OW | O | MO | MO | O | MO | MO | O | MO | SO | O | SO |
| Girls | ||||||||||||||||||||||||
| 6 | NW | NR | NA | IW | NR | NA | IW | NR | NA | IW | NR | IA | OW | NR | AH | OW | RO | AH | MO | RO | AH | SO | O | MO |
| 7 | NW | NR | NA | IW | NR | NA | IW | NR | IA | IW | NR | IA | OW | NR | AH | OW | RO | AH | MO | RO | AH | SO | O | MO |
| 8 | NW | NR | NA | IW | NR | IA | IW | NR | IA | IW | NR | IA | OW | RO | AH | OW | RO | AH | MO | RO | AH | MO | O | MO |
| 9 | NW | NR | NA | IW | NR | IA | IW | NR | IA | IW | NR | IA | OW | RO | AH | OW | RO | AH | MO | O | AH | MO | O | MO |
| 10 | NW | NR | NA | IW | NR | IA | IW | NR | IA | IW | RO | AH | OW | RO | AH | OW | O | AH | MO | O | AH | MO | O | MO |
| 11 | NW | NR | NA | IW | NR | IA | IW | NR | IA | IW | RO | AH | OW | RO | AH | OW | O | AH | MO | O | AH | MO | O | AH |
| 12 | NW | NR | NA | IW | NR | IA | IW | NR | IA | IW | RO | IA | OW | RO | AH | OW | O | AH | MO | O | AH | MO | O | AH |
| FMI (kg/m2) Cutoff Points ∝ for Every BMI Class (kg/m2) | ||||
|---|---|---|---|---|
| Sex | Men | Women | ||
| Class of Weight | BMI | FMI | BMI | FMI |
| Incompatible with life * | ≤13.0 | 0 | ≤11.0 | 0 |
| Thinness–Lipodystrophy | 13.1–18.4 | 0.1–1.2 | 11.1–18.4 | 0.1–3.8 |
| Normal weight–Normal adiposity | 18.5–24.9 | 1.3–4.8 | 18.5–24.9 | 3.9–7.9 |
| Ideal weight–Ideal adiposity | 22.0 | 3.3 | 22.0 | 6.0 |
| Overweight–Adipose hypertrophy | 25.0–29.9 | 4.9–9.8 | 25.0–29.9 | 8.0–12.9 |
| Obesity class I | 30.0–34.9 | 9.9–14.8 | 30.0–34.9 | 13.0–17.9 |
| Obesity class II | 35.0–39.9 | 14.9–19.8 | 35.0–39.9 | 18.0–22.9 |
| Obesity class III | ≥40.0 | ≥19.9 | ≥40.0 | ≥23.0 |
References
- Goossens, G.H. The metabolic phenotype in obesity: Fat mass, body fat distribution, and adipose tissue function. Obes. Facts 2017, 10, 207–215. [Google Scholar] [CrossRef] [PubMed]
- Choe, S.S.; Huh, J.Y.; Hwang, I.J.; Kim, J.I.; Kim, J.B. Adipose tissue remodeling: Its role in energy metabolism and metabolic disorders. Front. Endocrinol. 2016, 7, 1–16. [Google Scholar] [CrossRef] [PubMed] [Green Version]
- Frydman, T.D.; De Aldecoa, J.M.; Alpizar, M. What are you Feeding your kids? Biomed. J. Sci. Tech. Res. 2019, 19, 14448–14449. [Google Scholar] [CrossRef] [Green Version]
- Costa-Urrutia, P.; Vizuet-Gámez, A.; Ramirez-Alcántara, M.; Guillen-González, M.Á.; Medina-Contreras, O.; Valdes-Moreno, M.; Musalem-Younes, C.; Solares-Tlapechco, J.; Granados, J.; Franco-Trecu, V.; et al. Obesity measured as percent body fat, relationship with body mass index, and percentile curves for Mexican pediatric population. PLoS ONE 2019, 14, 1–13. [Google Scholar] [CrossRef] [PubMed]
- Müller, M.J.; Bosy-Westphal, A. Effect of over-and underfeeding on body composition and related metabolic functions in humans. Curr. Diabetes Rep. 2019, 19, 108. [Google Scholar] [CrossRef]
- McConnell-Nzunga, J.; Naylor, P.; Macdonald, H.; Rhodes, R.; Hofer, S.; McKay, H. Classification of obesity varies between body mass index and direct measures of body fat in boys and girls of Asian and European ancestry. Meas. Phys. Educ. Exerc. Sci. 2018, 22, 154–166. [Google Scholar] [CrossRef]
- Alpizar, M.; Peschard, V.-G.; Escalante-Araiza, F.; Altamirano-Bustamante, N.; Murata, C.; Arenas-Pérez, R.; Rodriguez-Ayala, E. Smoothed body composition percentiles curves for Mexican children aged 6 to 12 years. Children 2017, 4, 112. [Google Scholar] [CrossRef] [Green Version]
- De Onis, M.; Garza, C.; Onyango, A.W.; Borghi, E. Comparison of the WHO child growth standards and the CDC 2000 growth charts. J. Nutr. 2007, 137, 144–148. [Google Scholar] [CrossRef] [Green Version]
- Hernández-Cordero, S.; Cuevas-Nasu, L.; Morán-Ruán, M.; Méndez-Gómez Humarán, I.; Ávila-Arcos, M.; Rivera-Dommarco, J. Overweight and obesity in Mexican children and adolescents during the last 25 years. Nutr. Diabetes 2017, 7, e247–e249. [Google Scholar] [CrossRef] [Green Version]
- Mendoza Pablo, P.A.; Valdes, J.; Ortiz-Hernandez, L. Accuracy of body mass index for age to diagnose obesity in Mexican schoolchildren. Nutr. Hosp. 2015. [Google Scholar] [CrossRef]
- Going, S.B.; Lohman, T.G.; Cussler, E.C.; Williams, D.P.; Morrison, J.A.; Horn, P.S. Percent body fat and chronic disease risk factors in U.S. children and youth. AMEPRE 2011, 41, S77–S86. [Google Scholar] [CrossRef] [PubMed]
- WHO Expert Consultation. Appropriate body-mass index for Asian populations and its implications for policy and intervention strategies. Lancet 2004, 363, 157–163. [Google Scholar] [CrossRef]
- Liu, P.; Ma, F.; Lou, H.; Liu, Y. The utility of fat mass index vs. body mass index and percentage of body fat in the screening of metabolic syndrome. BMC Public Health 2013, 13, 1–8. [Google Scholar] [CrossRef] [PubMed] [Green Version]
- Madeira, F.B.; Silva, A.A.; Veloso, H.F.; Goldani, M.Z.; Kac, G.; Cardoso, V.C.; Bettiol, H.; Barbieri, M.A. Normal weight obesity is associated with metabolic syndrome and insulin resistance in young adults from a middle-income country. PLoS ONE 2013, 8, e60673. [Google Scholar] [CrossRef] [Green Version]
- Oreopoulos, A.; Ezekowitz, J.A.; McAlister, F.A.; Kalantar-Zadeh, K.; Fonarow, G.C.; Norris, C.M.; Johnson, J.A.; Padwal, R.S. Association between direct measures of body composition and prognostic factors in chronic heart failure. Mayo Clin. Proc. 2010, 85, 609–617. [Google Scholar] [CrossRef] [Green Version]
- VanItallie, T.B.; Yang, M.U.; Heymsfield, S.B.; Funk, R.C.; Boileau, R.A. Height-normalized indices of the body’s fat-free mass and fat mass: Potentially useful indicators of nutritional status. Am. J. Clin. Nutr. 1990, 52, 953–959. [Google Scholar] [CrossRef] [Green Version]
- De Oliveira, P.M.; Almeida, F.; Maria, R.; Oliveira, S.; Mendes, L.L.; Netto, M.P.; Cândido, A.P.C. Association between fat mass index and fat-free mass index values and cardiovascular risk in adolescents. Rev. Paul. Pediatr. (Engl. Ed.) 2016, 34, 30–37. [Google Scholar] [CrossRef] [Green Version]
- Loomba-Albrecht, L.A.; Styne, D.M. Effect of puberty on body composition. Curr. Opin. Endocrinol. Diabetes Obes. 2009, 16, 10–15. [Google Scholar] [CrossRef]
- Siervogel, R.M.; Demerath, E.W.; Schubert, C.; Remsberg, K.E.; Chumlea, W.C.; Sun, S.; Czerwinski, S.A.; Towne, B. Puberty and body composition. Horm. Res. 2003, 60, 36–45. [Google Scholar] [CrossRef]
- Freedman, D.S.; Wang, J.; Maynard, L.M.; Thornton, J.C.; Mei, Z.; Pierson, R.N.; Dietz, W.H.; Horlick, M. Relation of BMI to fat and fat-free mass among children and adolescents. Int. J. Obes. 2005, 29, 1–8. [Google Scholar] [CrossRef] [Green Version]
- Viswanathan, M.; Berkman, N.D. Development of the RTI item bank on risk of bias and precision of observational studies. J. Clin. Epidemiol. 2012, 65, 163–178. [Google Scholar] [CrossRef] [PubMed]
- Ramírez López, E.; Puente Hernandez, D.; Negrete Lopez, N.L.; Serna Gutierrez, A.; Calderón Ramos, Z.; Omaña Covarrubias, A.; Flores-Guillen, E.; Tijerina-Sáenz, A. Comparison of perceived weight as ideal against ideal body weight formulas and body mass index of 22 kg/m2 in young adult women. Rev. Salud Pública Y Nutr. 2018, 17, 7–15. [Google Scholar]
- Kudsk, K.A.; Munoz-del-Rio, A.; Busch, R.A.; Kight, C.E.; Schoeller, D.A. Stratification of fat-free mass index percentiles for body composition based on national health and nutrition examination survey III bioelectric impedance data. J. Parenter. Enter. Nutr. 2017, 41, 249–257. [Google Scholar] [CrossRef] [PubMed] [Green Version]
- Jensen, B.; Moritoyo, T.; Kaufer-Horwitz, M.; Peine, S.; Norman, K.; Maisch, M.J.; Matsumoto, A.; Masui, Y.; Velázquez-González, A.; Domínguez-García, J.; et al. Ethnic differences in fat and muscle mass and their implication for interpretation of bioelectrical impedance vector analysis. Appl. Physiol. Nutr. Metab. 2019, 44, 619–626. [Google Scholar] [CrossRef] [PubMed] [Green Version]
- Ortega, F.B.; Sui, X.; Lavie, C.J.; Blair, S.N. Body mass index, the most widely used but also widely criticized index: Would a gold-standard measure of total body fat be a better predictor of cardiovascular disease mortality? Mayo Clin. Proc. 2016, 91, 443–455. [Google Scholar] [CrossRef] [Green Version]
- Ramírez-Vélez, R.; Carrillo, H.A.; Correa-Bautista, J.E.; Schmidt-RioValle, J.; González-Jiménez, E.; Correa-Rodríguez, M.; González-Ruíz, K.; García-Hermoso, A. Fat-to-muscle ratio: A new anthropometric indicator as a screening tool for metabolic syndrome in young Colombian people. Nutrients 2018, 10, 1027. [Google Scholar] [CrossRef] [Green Version]
- Ramírez-Vélez, R.; Correa-Bautista, J.E.; Sanders-Tordecilla, A.; Ojeda-Pardo, M.L.; Cobo-Mejía, E.A.; Castellanos-Vega, R.d.P.; García-Hermoso, A.; González-Jiménez, E.; Schmidt-RioValle, J.; González-Ruíz, K. Percentage of body fat and fat mass index as a screening tool for metabolic syndrome prediction in Colombian university students. Nutrients 2017, 9, 1009. [Google Scholar] [CrossRef]
- Hattori, K.; Tatsumi, N.; Tanaka, S. Assessment of body composition by using a new chart method. Am. J. Hum. Biol. 1997, 9, 573–578. [Google Scholar] [CrossRef]
- Wells, J.C.K. Toward body composition reference data for infants, children, and adolescents. Adv. Nutr. 2014, 5, 3205–3295. [Google Scholar] [CrossRef] [Green Version]
- ENSANUT-ECU. Encuesta Nacional de Salud y Nutrición 2018. Ensanut-Ecu 2018 2019. Available online: https://ensanut.insp.mx/encuestas/ensanut2018/doctos/informes/ensanut_2018_presentacion_resultados.pdf (accessed on 29 January 2020).
- Henry, C.J.K. The biology of human starvation: Some new insights. Nutr. Bull. 2001, 205–211. [Google Scholar] [CrossRef]


| Z Scores (6 to 12 Years Old) | ||||||||||||||
|---|---|---|---|---|---|---|---|---|---|---|---|---|---|---|
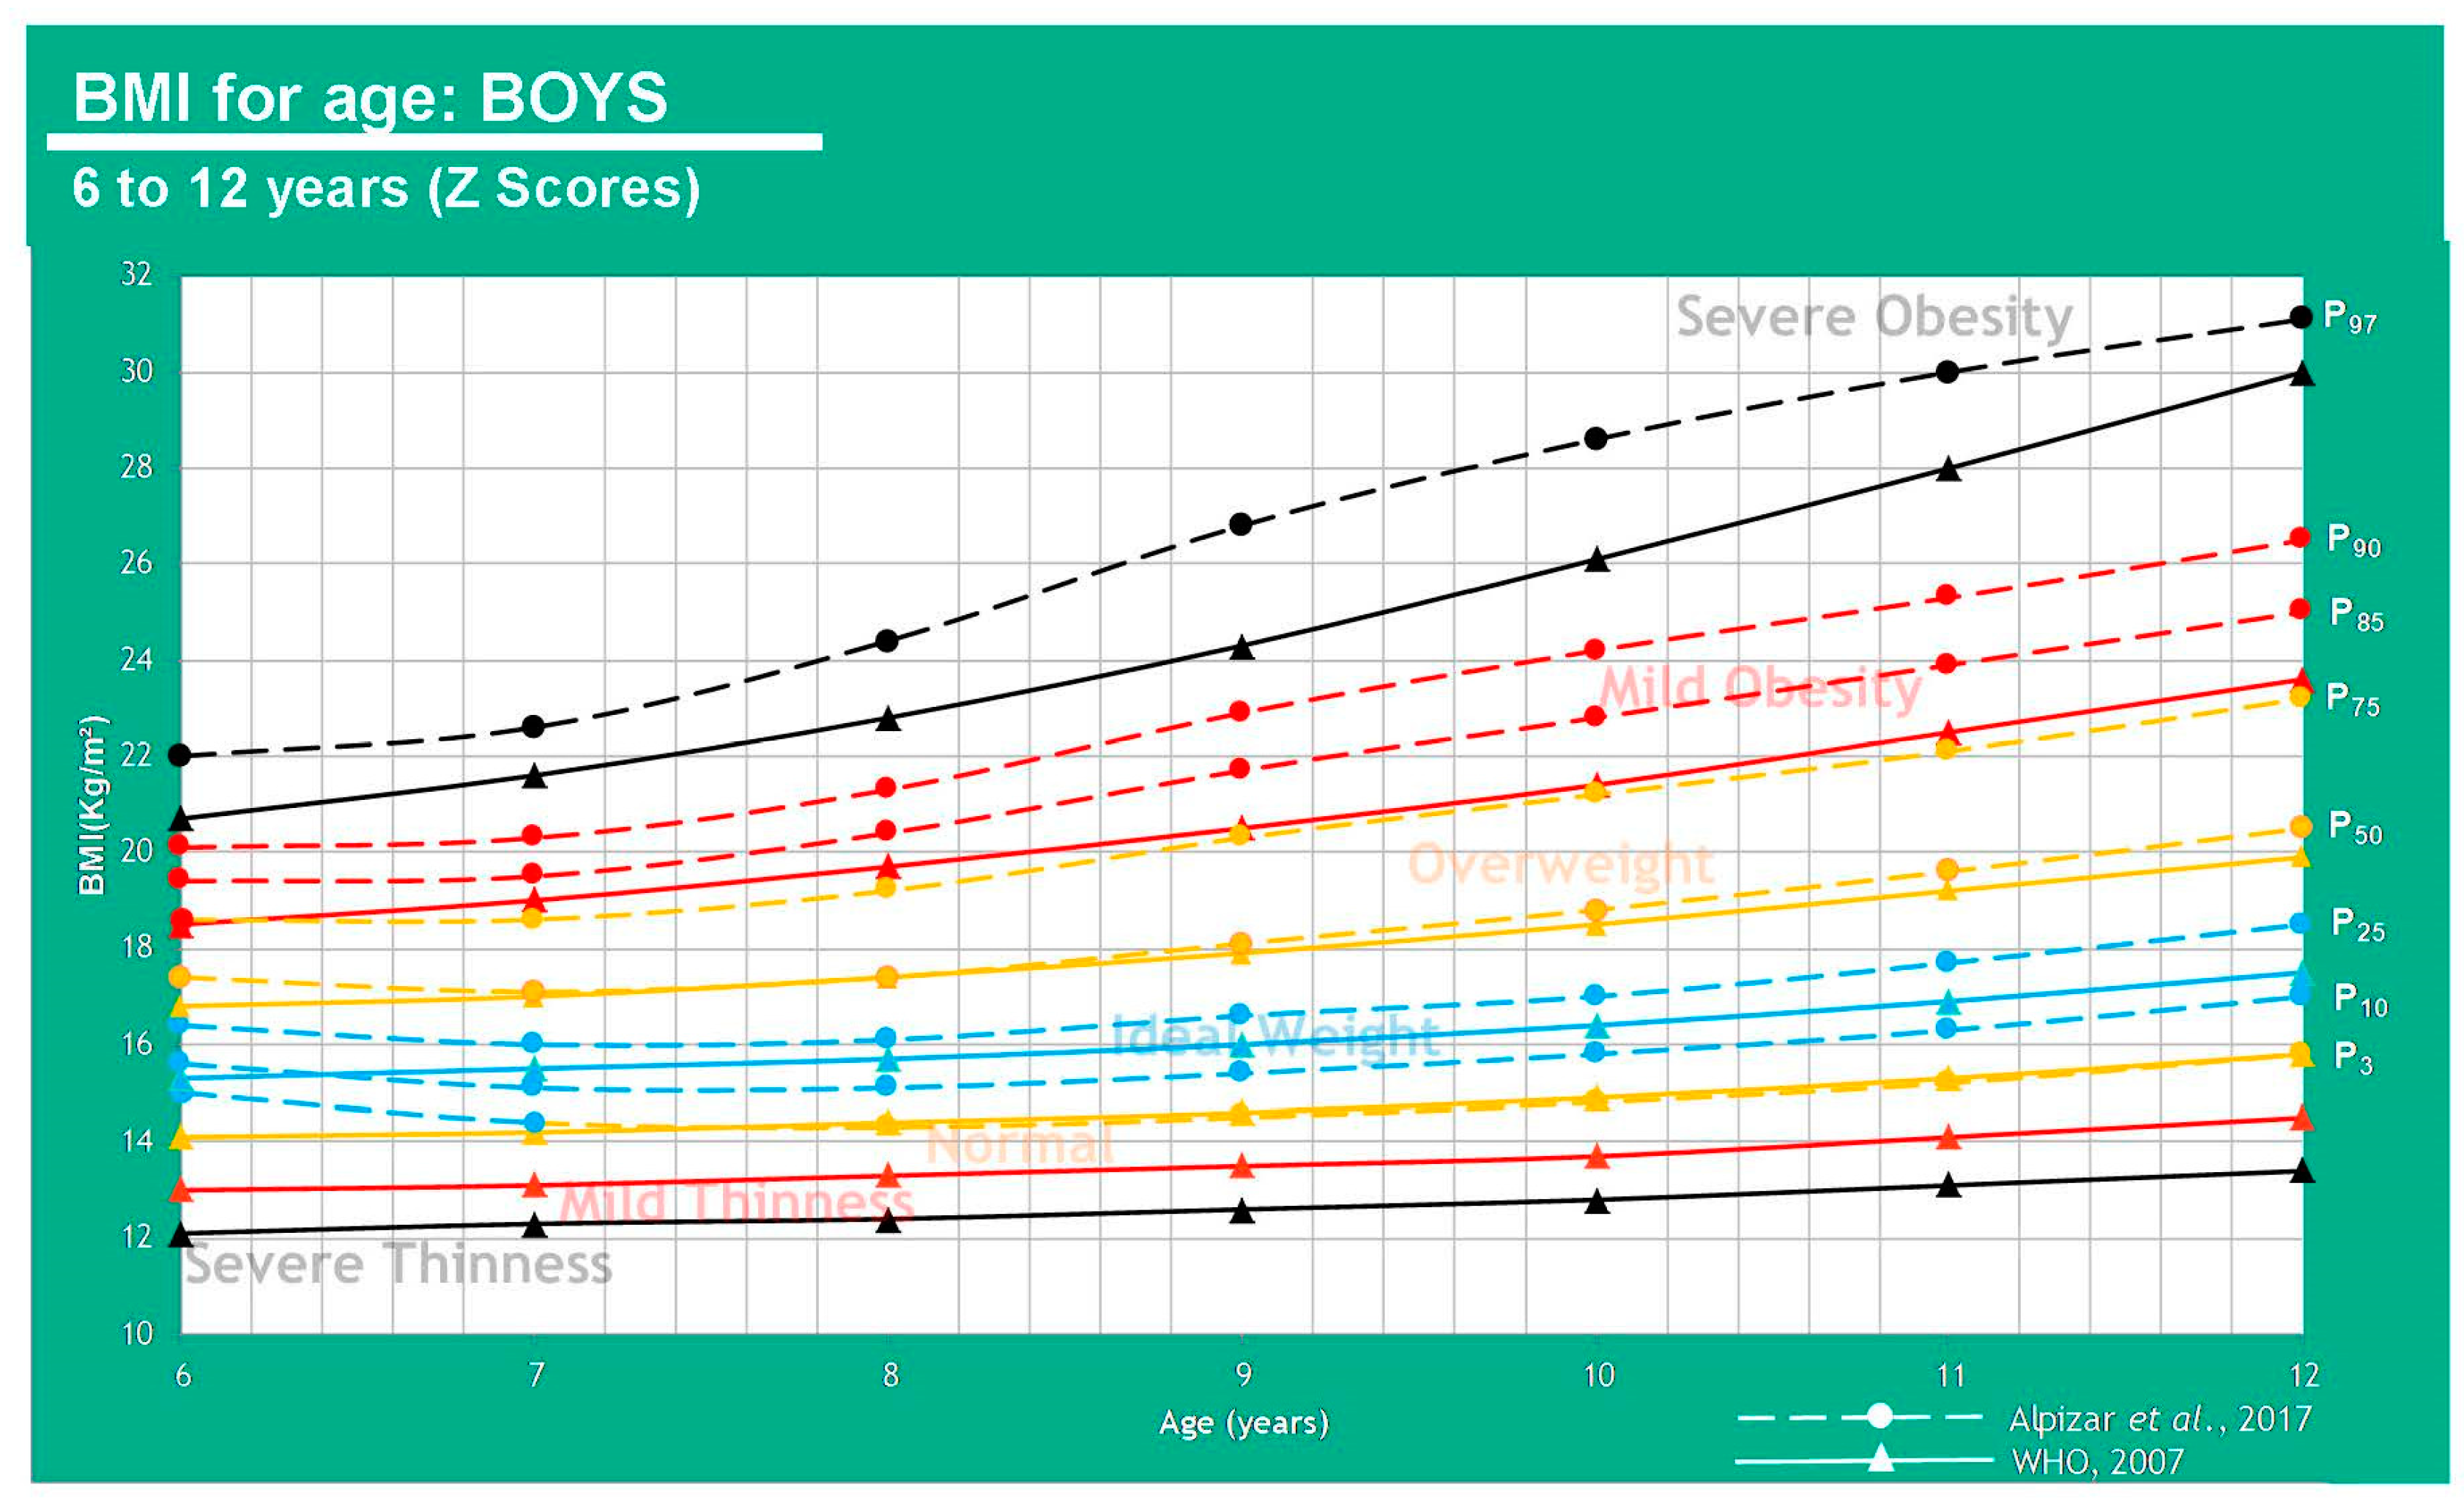
| Z Scores WHO (BMI kg/m2) | ||||||||||||||
| Age (Years) | −3 DE (Severe Thinness) | −2 DE (Mild Thinness) | −1 DE (Normal Weight) | Average (Ideal Weight) | +1 DE (Overweight) | +2 DE (Mild Obesity) | +3 DE (Severe Obesity) | |||||||
| Boys | WHO | Alpízar | WHO | Alpízar | WHO | Alpízar | WHO | Alpízar | WHO | Alpízar | WHO | Alpízar | WHO | Alpízar |
| 6 | 12.1 | - | 13.0 | - | 14.1 | - | 15.3 | P3, P10, P25 | 16.8 | P50 | 18.5 | P75, P85, P90 | 20.7 | P97 |
| 7 | 12.3 | - | 13.1 | - | 14.2 | - | 15.5 | P3, P10, P25 | 17.0 | P50, P75 | 19.0 | P85, P90 | 21.6 | P97 |
| 8 | 12.4 | - | 13.3 | - | 14.4 | P3 | 15.7 | P10, P25 | 17.4 | P50, P75 | 19.7 | P85, P90 | 22.8 | P97 |
| 9 | 12.6 | - | 13.5 | - | 14.6 | P3 | 16.0 | P10, P25 | 17.9 | P50, P75 | 20.5 | P85, P90 | 24.3 | P97 |
| 10 | 12.8 | - | 13.7 | - | 14.9 | P3 | 16.4 | P10, P25 | 18.5 | P50, P75 | 21.4 | P85, P90 | 26.1 | P97 |
| 11 | 13.1 | - | 14.1 | - | 15.3 | P3 | 16.9 | P10, P25 | 19.2 | P50, P75 | 22.5 | P85, P90 | 28.0 | P97 |
| 12 | 13.4 | - | 14.5 | - | 15.8 | P3 | 17.5 | P10, P25 | 19.9 | P50, P75 | 23.6 | P85, P90 | 30.0 | P97 |
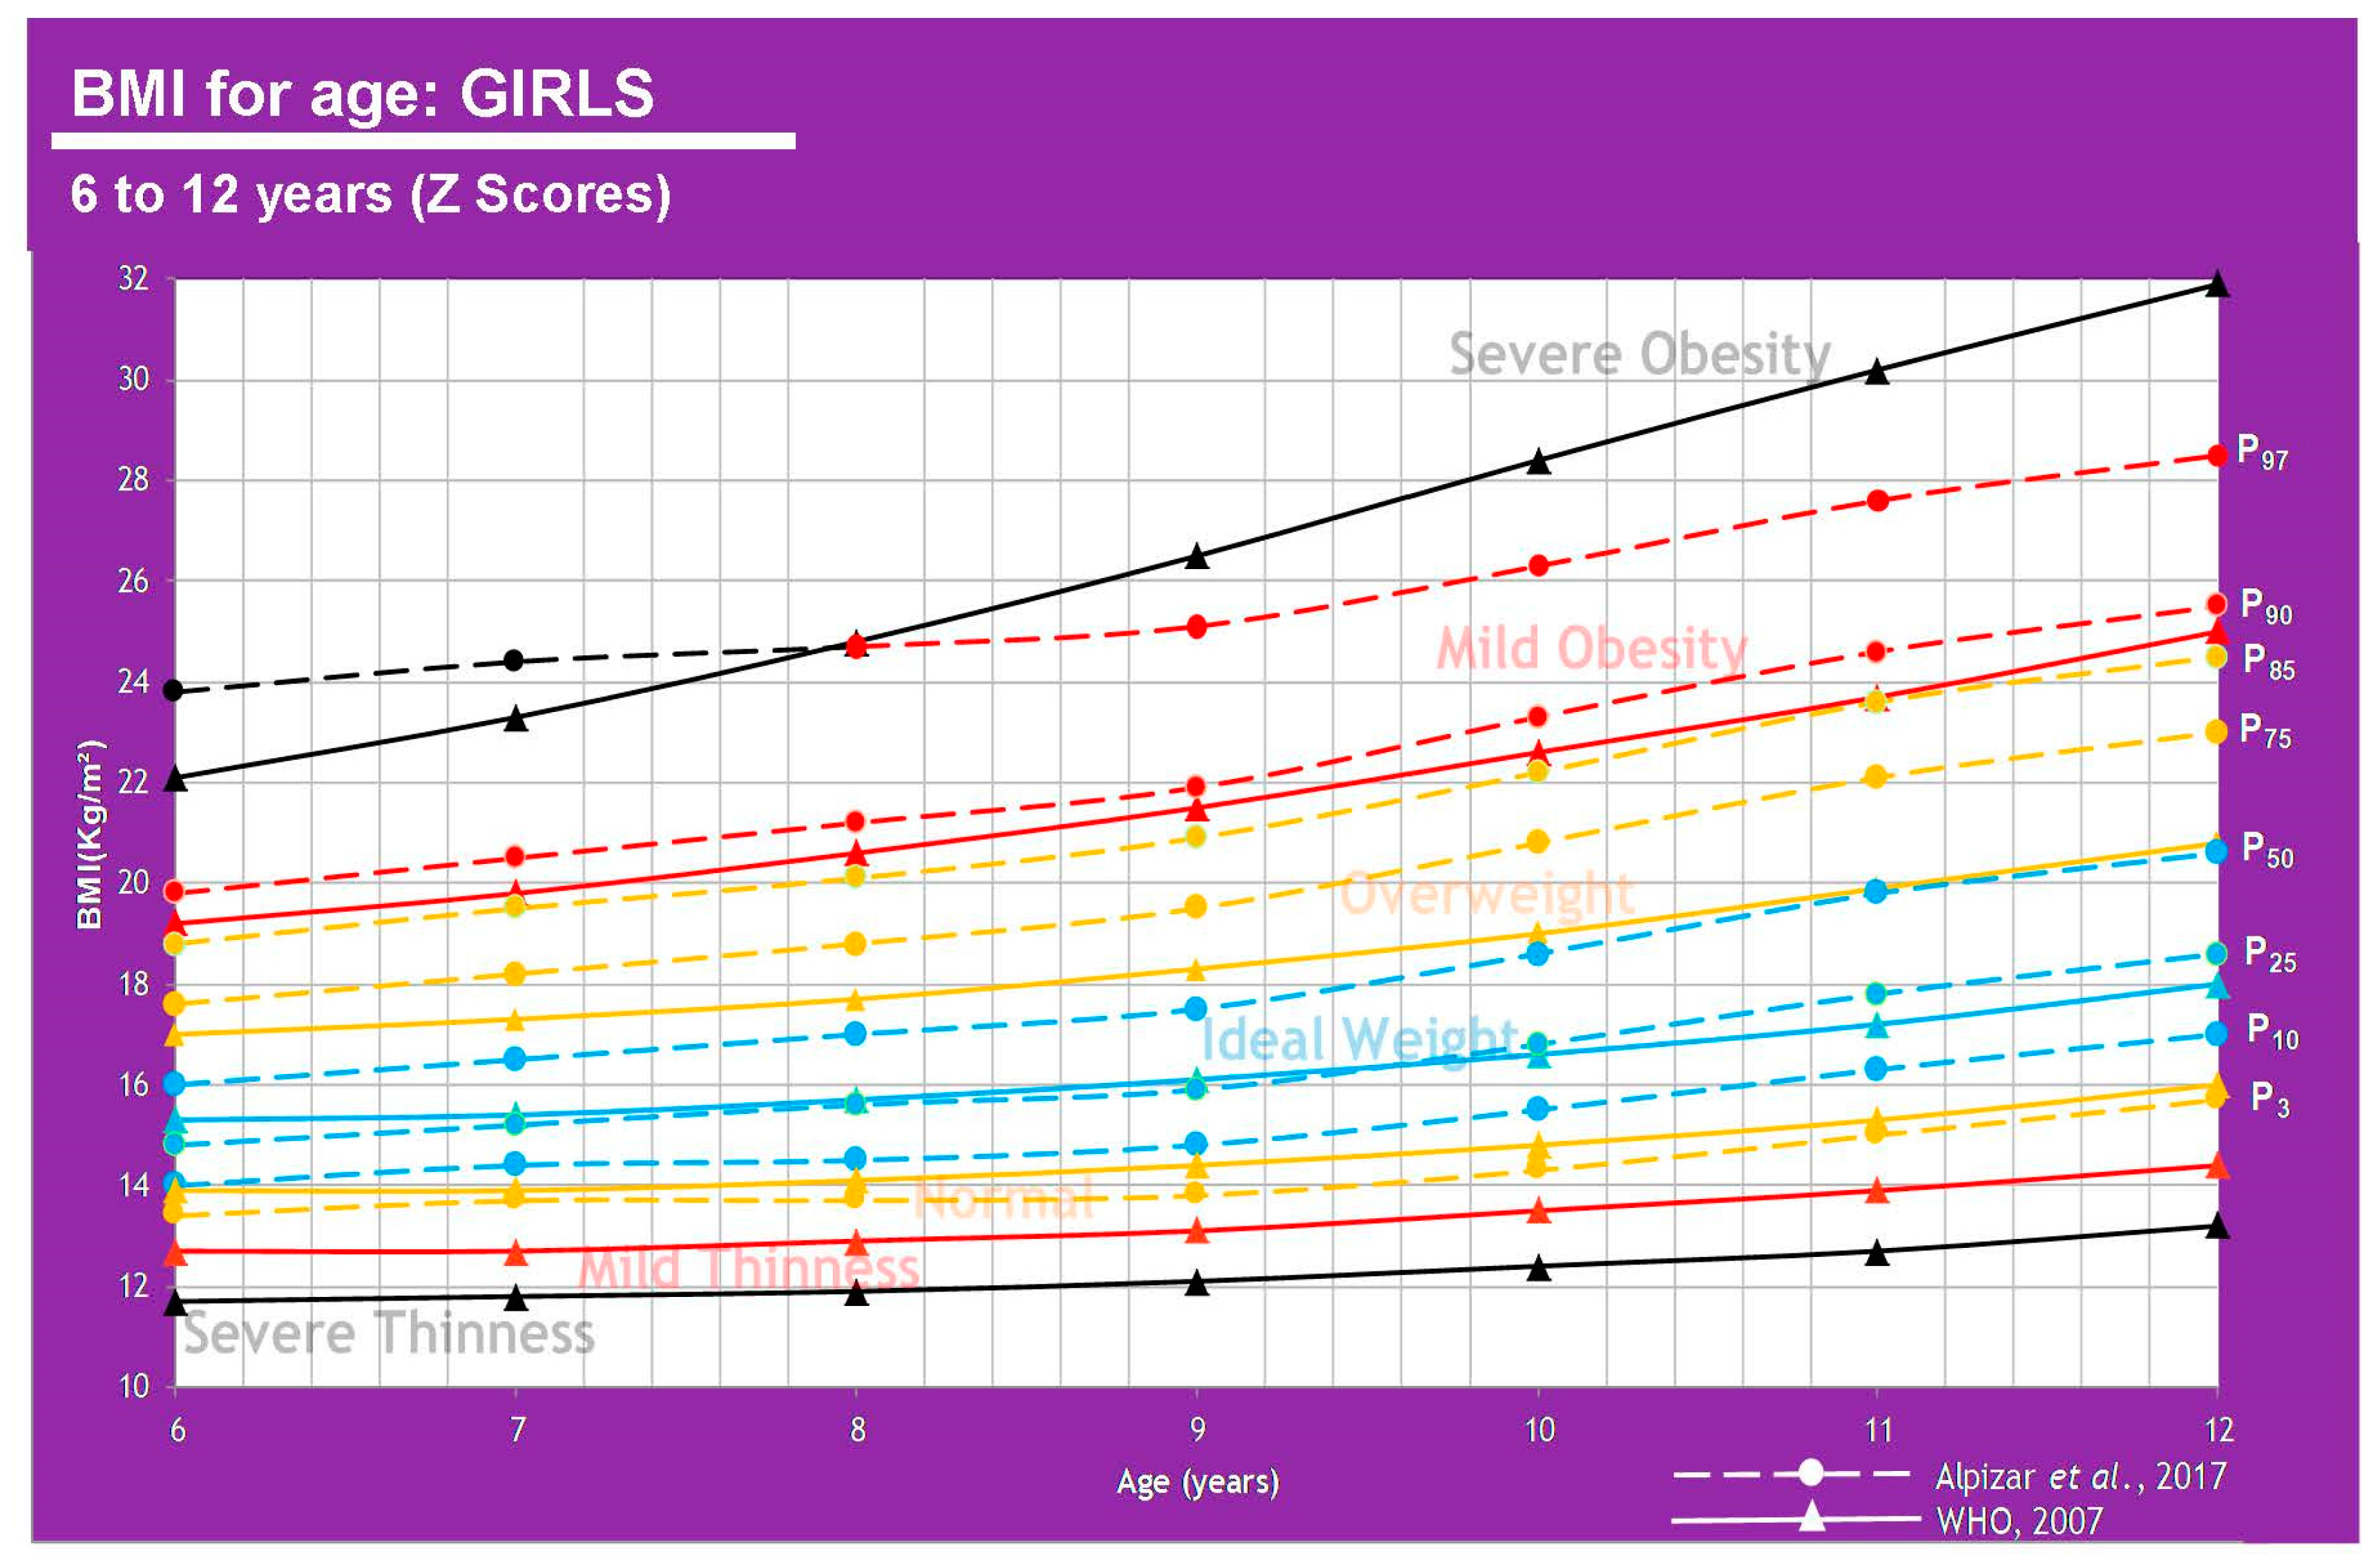
| Girls | ||||||||||||||
| 6 | 11.7 | - | 12.7 | - | 13.9 | P3 | 15.3 | P10, P25, P50 | 17.0 | P75, P85 | 19.2 | P90 | 22.1 | P97 |
| 7 | 11.8 | - | 12.7 | - | 13.9 | P3 | 15.4 | P10, P25, P50 | 17.3 | P75, P85 | 19.8 | P90 | 23.3 | P97 |
| 8 | 11.9 | - | 12.9 | - | 14.1 | P3 | 15.7 | P10, P25, P50 | 17.7 | P75, P85 | 20.6 | P90, P97 | 24.8 | - |
| 9 | 12.1 | - | 13.1 | - | 14.4 | P3 | 16.1 | P10, P25, P50 | 18.3 | P75, P85 | 21.5 | P90, P97 | 26.5 | - |
| 10 | 12.4 | - | 13.5 | - | 14.8 | P3 | 16.6 | P10, P25, P50 | 19.0 | P75, P85 | 22.6 | P90, P97 | 28.4 | - |
| 11 | 12.7 | - | 13.9 | - | 15.3 | P3 | 17.2 | P10, P25, P50 | 19.9 | P75, P85 | 23.7 | P90, P97 | 30.2 | - |
| 12 | 13.2 | - | 14.4 | - | 16.0 | P3 | 18.0 | P10, P25, P50 | 20.8 | P75, P85 | 25.0 | P90, P97 | 31.9 | - |
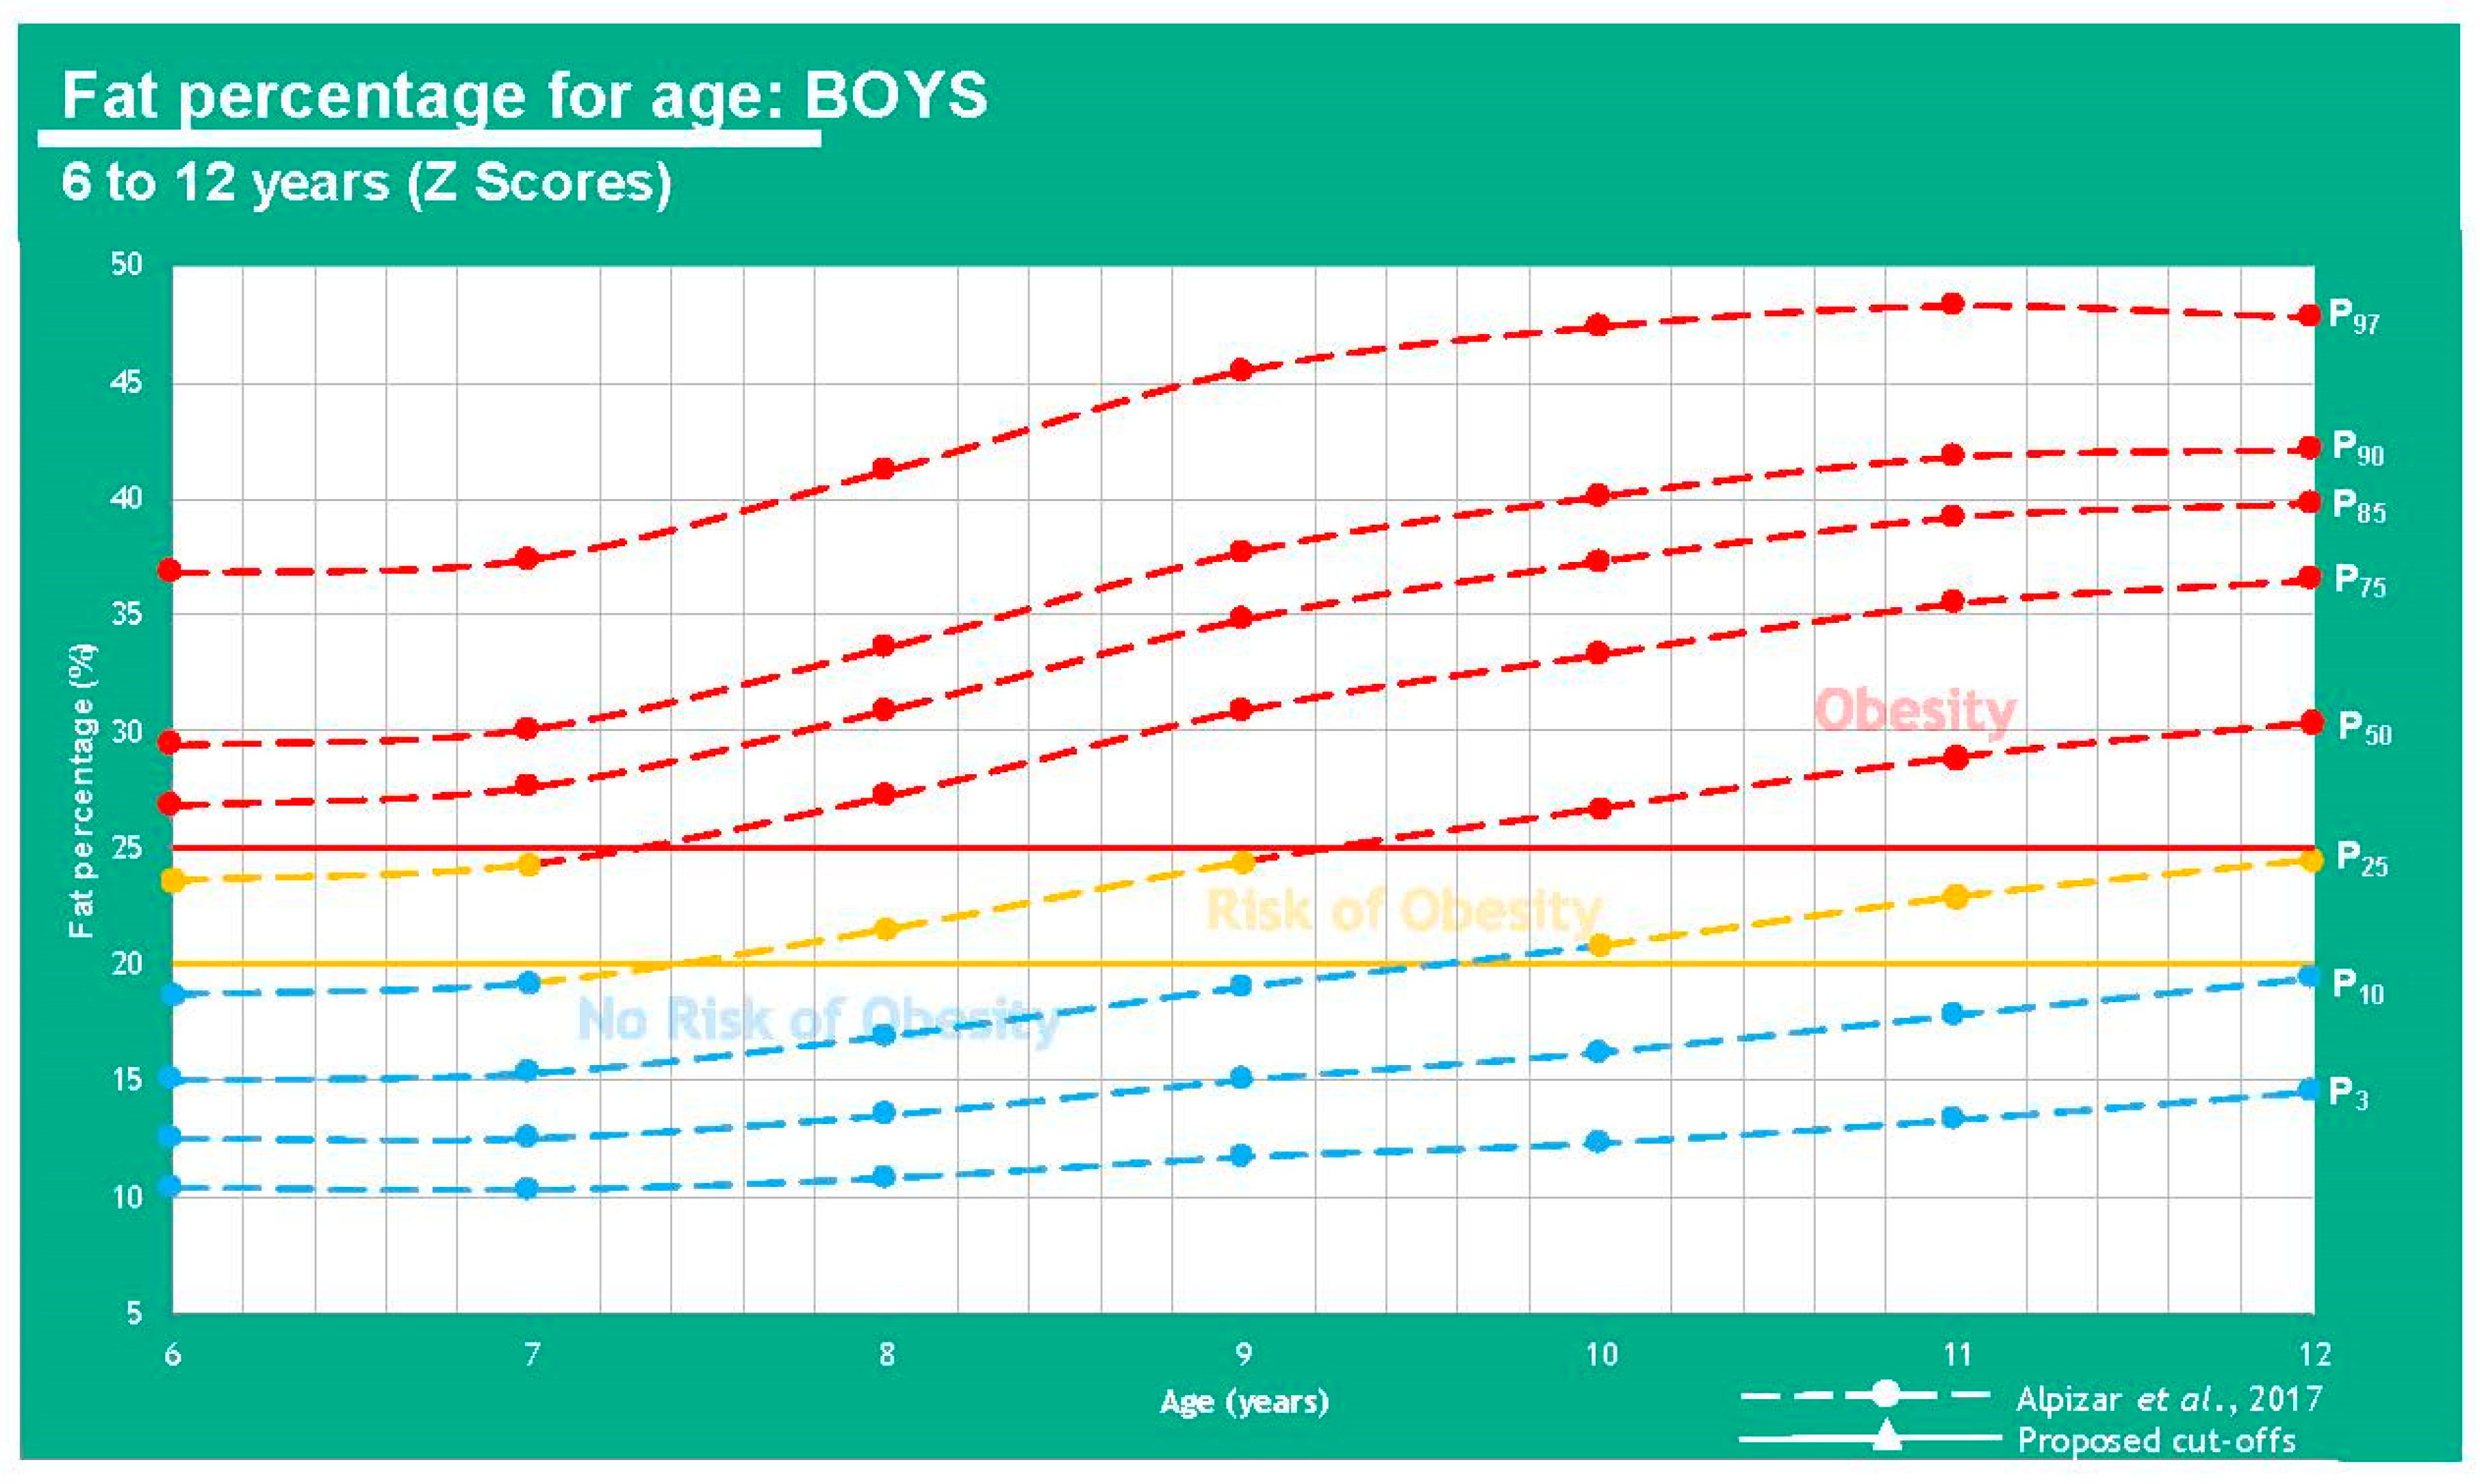
| %FM Based Cutoff Points for Childhood Obesity | ||||||
|---|---|---|---|---|---|---|
| Age (Years) | Percentiles | FM% | Percentiles | FM% | Percentiles | FM% |
| Boys | No Obesity Risk (<20.0%) | Risk of Obesity (20.0–25.0%) | Obesity (>25.0%) | |||
| 6 | P3, P10, P25, P50 | 10.4–18.7 | P75 | 23.6 | P85, P90, P97 | 26.8–36.8 |
| 7 | P3, P10, P25, P50 | 10.3–19.2 | P75 | 24.3 | P85, P90, P97 | 27.6–37.4 |
| 8 | P3, P10, P25 | 10.8–16.9 | P50 | 21.5 | P75, P85, P90, P97 | 27.2–41.2 |
| 9 | P3, P10, P25 | 11.7–19.0 | P50 | 24.4 | P75, P85, P90, P97 | 30.9–45.5 |
| 10 | P3, P10 | 12.3–16.2 | P25 | 20.8 | P50, P75, P85, P90, P97 | 26.7–47.4 |
| 11 | P3, P10 | 13.3–17.8 | P25 | 22.9 | P50, P75, P85, P90, P97 | 28.9–48.3 |
| 12 | P3, P10 | 14.5–19.4 | P25 | 24.5 | P50, P75, P85, P90, P97 | 30.4–47.8 |
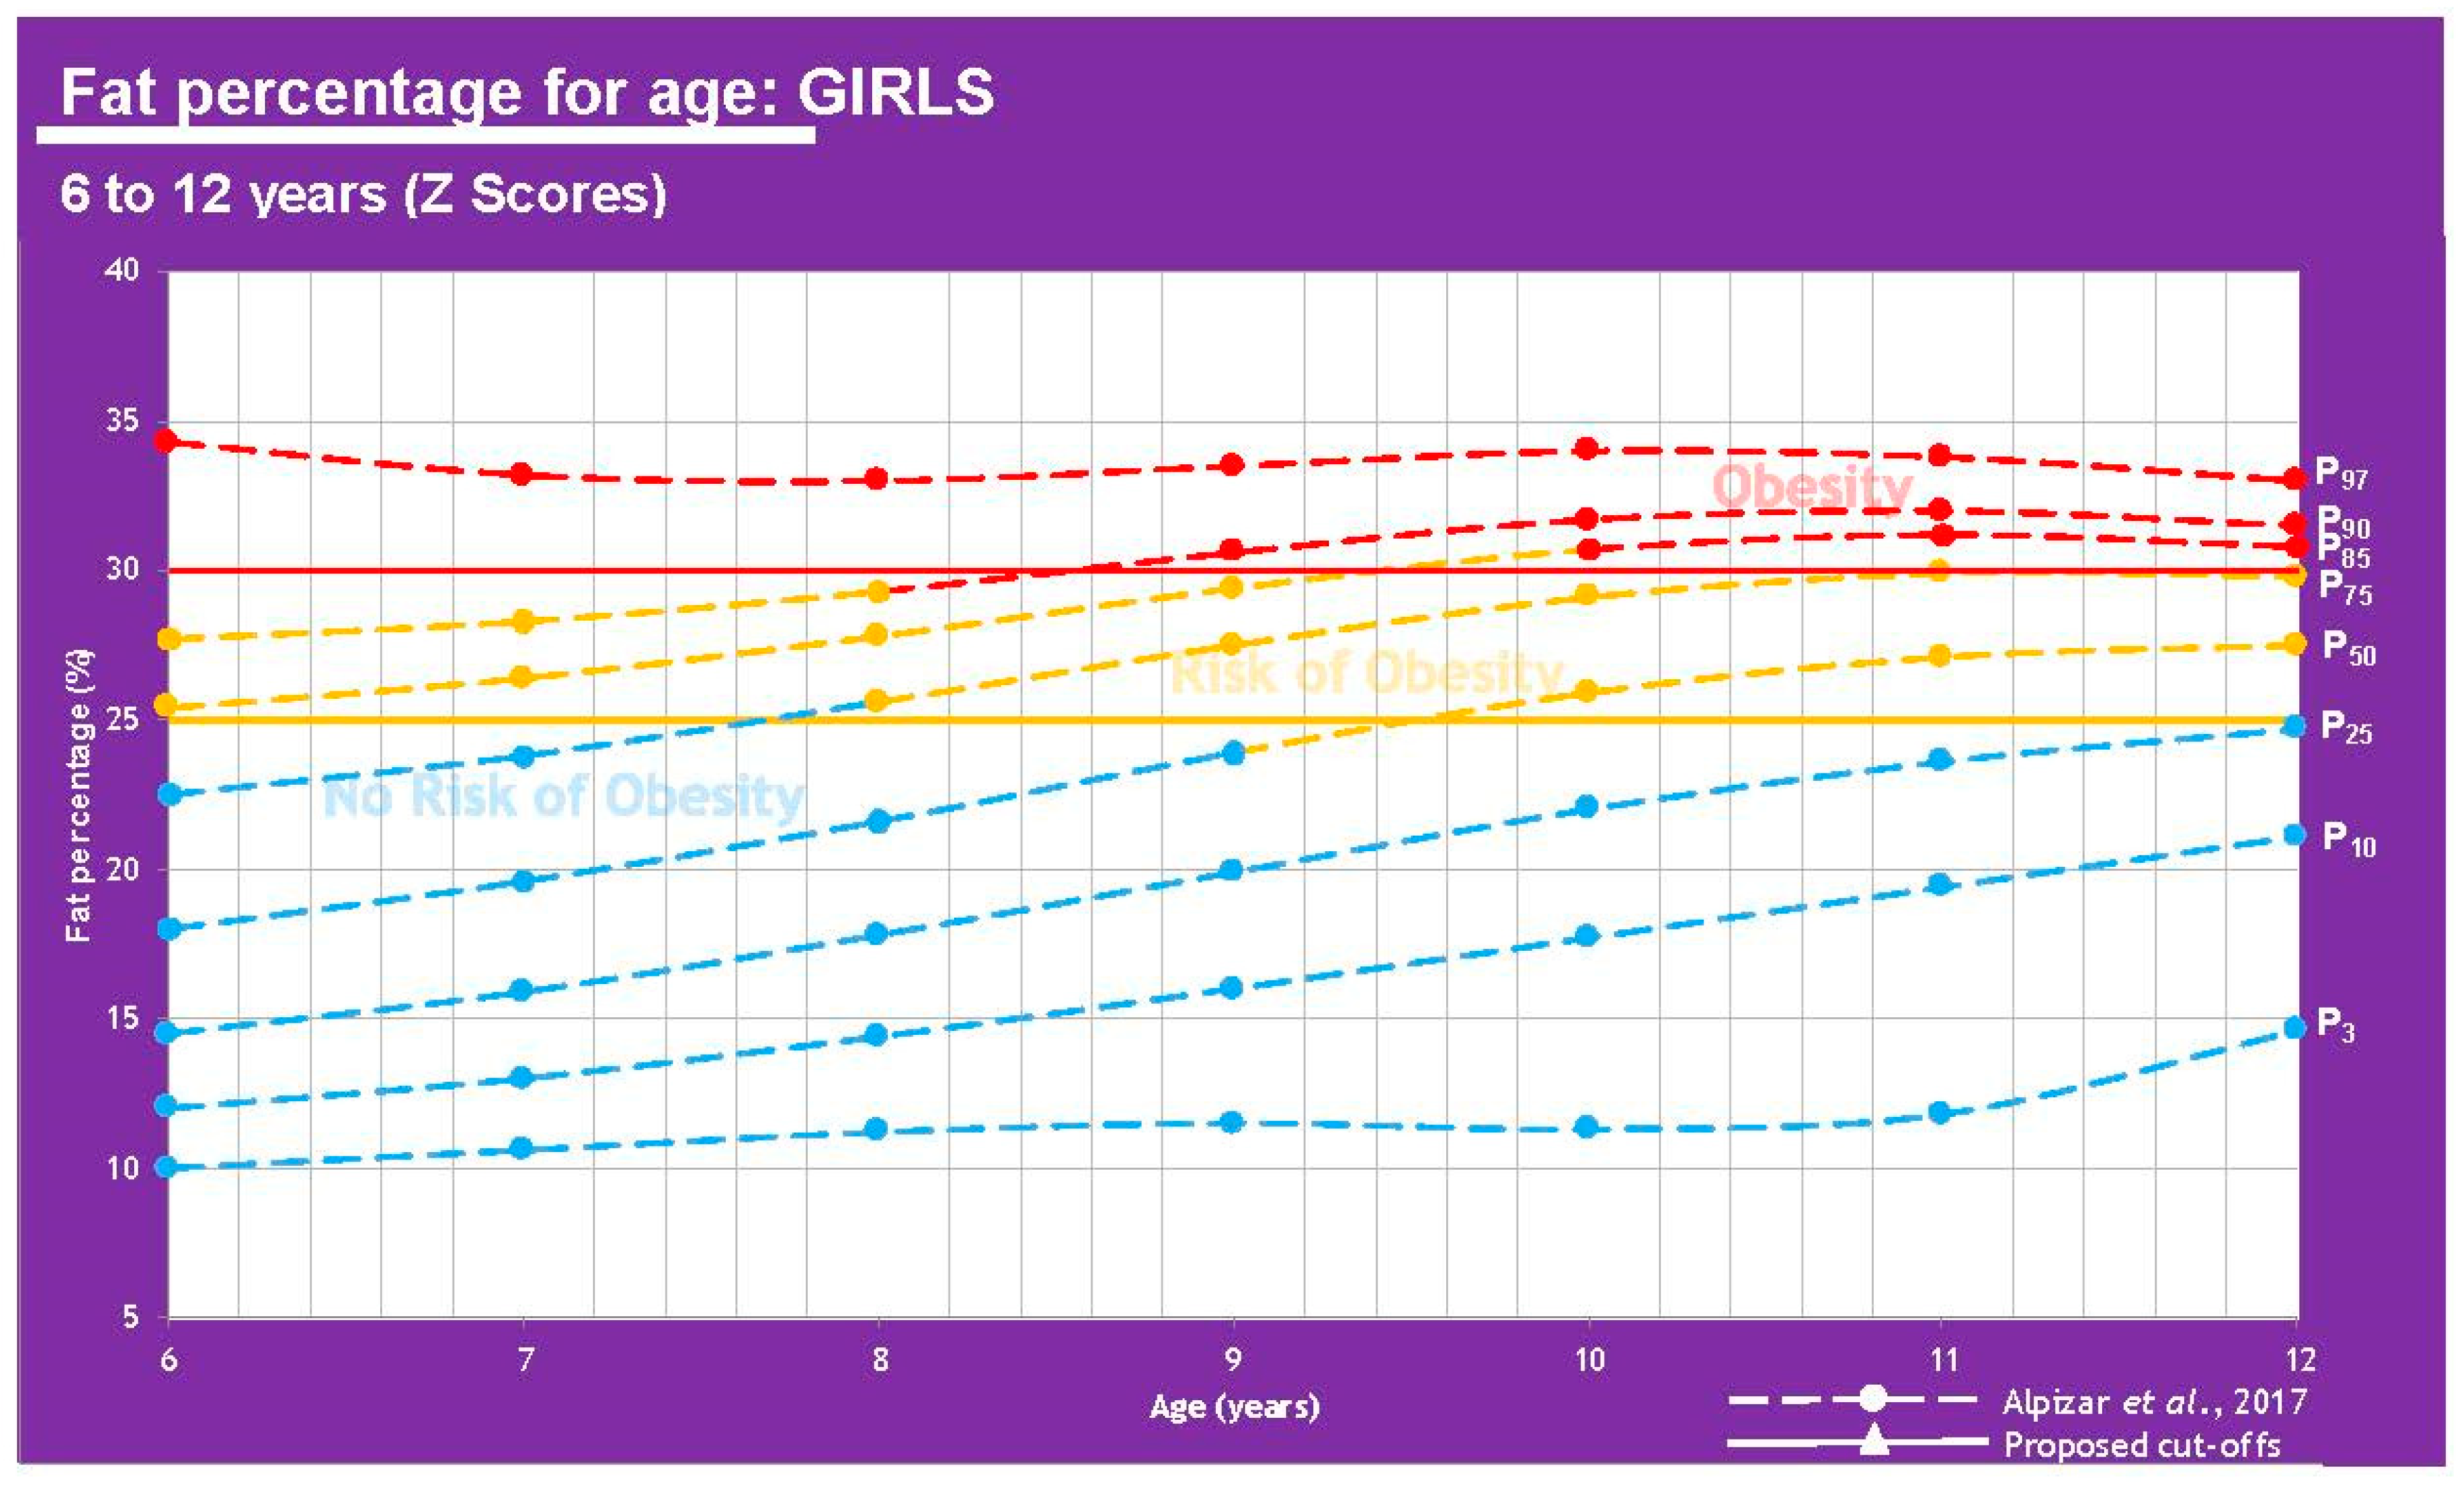
| Girls | No Obesity Risk (<25.0 %) | Risk of Obesity (25.0–30.0%) | Obesity (>30.0%) | |||
| 6 | P3, P10, P25, P50, P75 | 10.0–22.5 | P85, P90 | 25.4–27.7 | P97 | 34.3 |
| 7 | P3, P10, P25, P50, P75 | 10.6–23.8 | P85, P90 | 26.4–28.3 | P97 | 33.2 |
| 8 | P3, P10, P25, P50 | 11.2–21.6 | P75, P85, P90 | 25.6–29.3 | P97 | 33.0 |
| 9 | P3, P10, P25, P50 | 11.5–23.9 | P75, P85 | 27.5–29.4 | P90, P97 | 30.6–33.5 |
| 10 | P3, P10, P25 | 11.3–22.0 | P50, P75 | 25.9–29.1 | P85, P90. P97 | 30.7–34.0 |
| 11 | P3, P10, P25 | 11.8–23.6 | P50, P75 | 27.1–29.9 | P85, P90. P97 | 31.2–33.8 |
| 12 | P3, P10, P25 | 14.6–24.7 | P50, P75 | 27.5–29.8 | P85, P90. P97 | 30.8–33.0 |
| Different Population Studies | |||||||||||||
|---|---|---|---|---|---|---|---|---|---|---|---|---|---|
| Reference | n Total | n Men | n Women | 6–8 y-o | 9–11 y-o | 12–14 y-o | 15–18 y-o | Population | Risk of Bias | ||||
| Boys | Girls | Boys | Girls | Boys | Girls | Boys | Girls | ||||||
| Freedman et al. (2005) [20] | 1104 | 578 | 526 | 12.5–14.0 | 12.1–13.2 | 13.1–14.5 | 12.3–14.2 | 14.7–17.0 | 13.5–15.2 | 17.4–18.3 | 14.3–15.8 | USA | Low |
| Different Population Studies | ||||||||||
|---|---|---|---|---|---|---|---|---|---|---|
| Reference | n Total | n Men | n Women | Ages (Years) | Population | FFMI (kg/m2) Men, Ranges | FFMI (kg/m2) Women, Ranges | FFMI (kg/m2) Men, Mean | FFMI (kg/m2) Women, Mean | Risk of Bias |
| Kudsk et al. (2017) [23] | 16,000 | 8000 | 8000 | 12–90 | USA | N/D | N/D | 19.1 | 15.9 | Moderate |
| Jensen et al. (2019) [24] | 3072 | 1554 | 1518 | 18–87 | Germany, Japan and Mexico | 16.8–19.0 | 14.1–15.9 | 17.9 | 15.0 | Low |
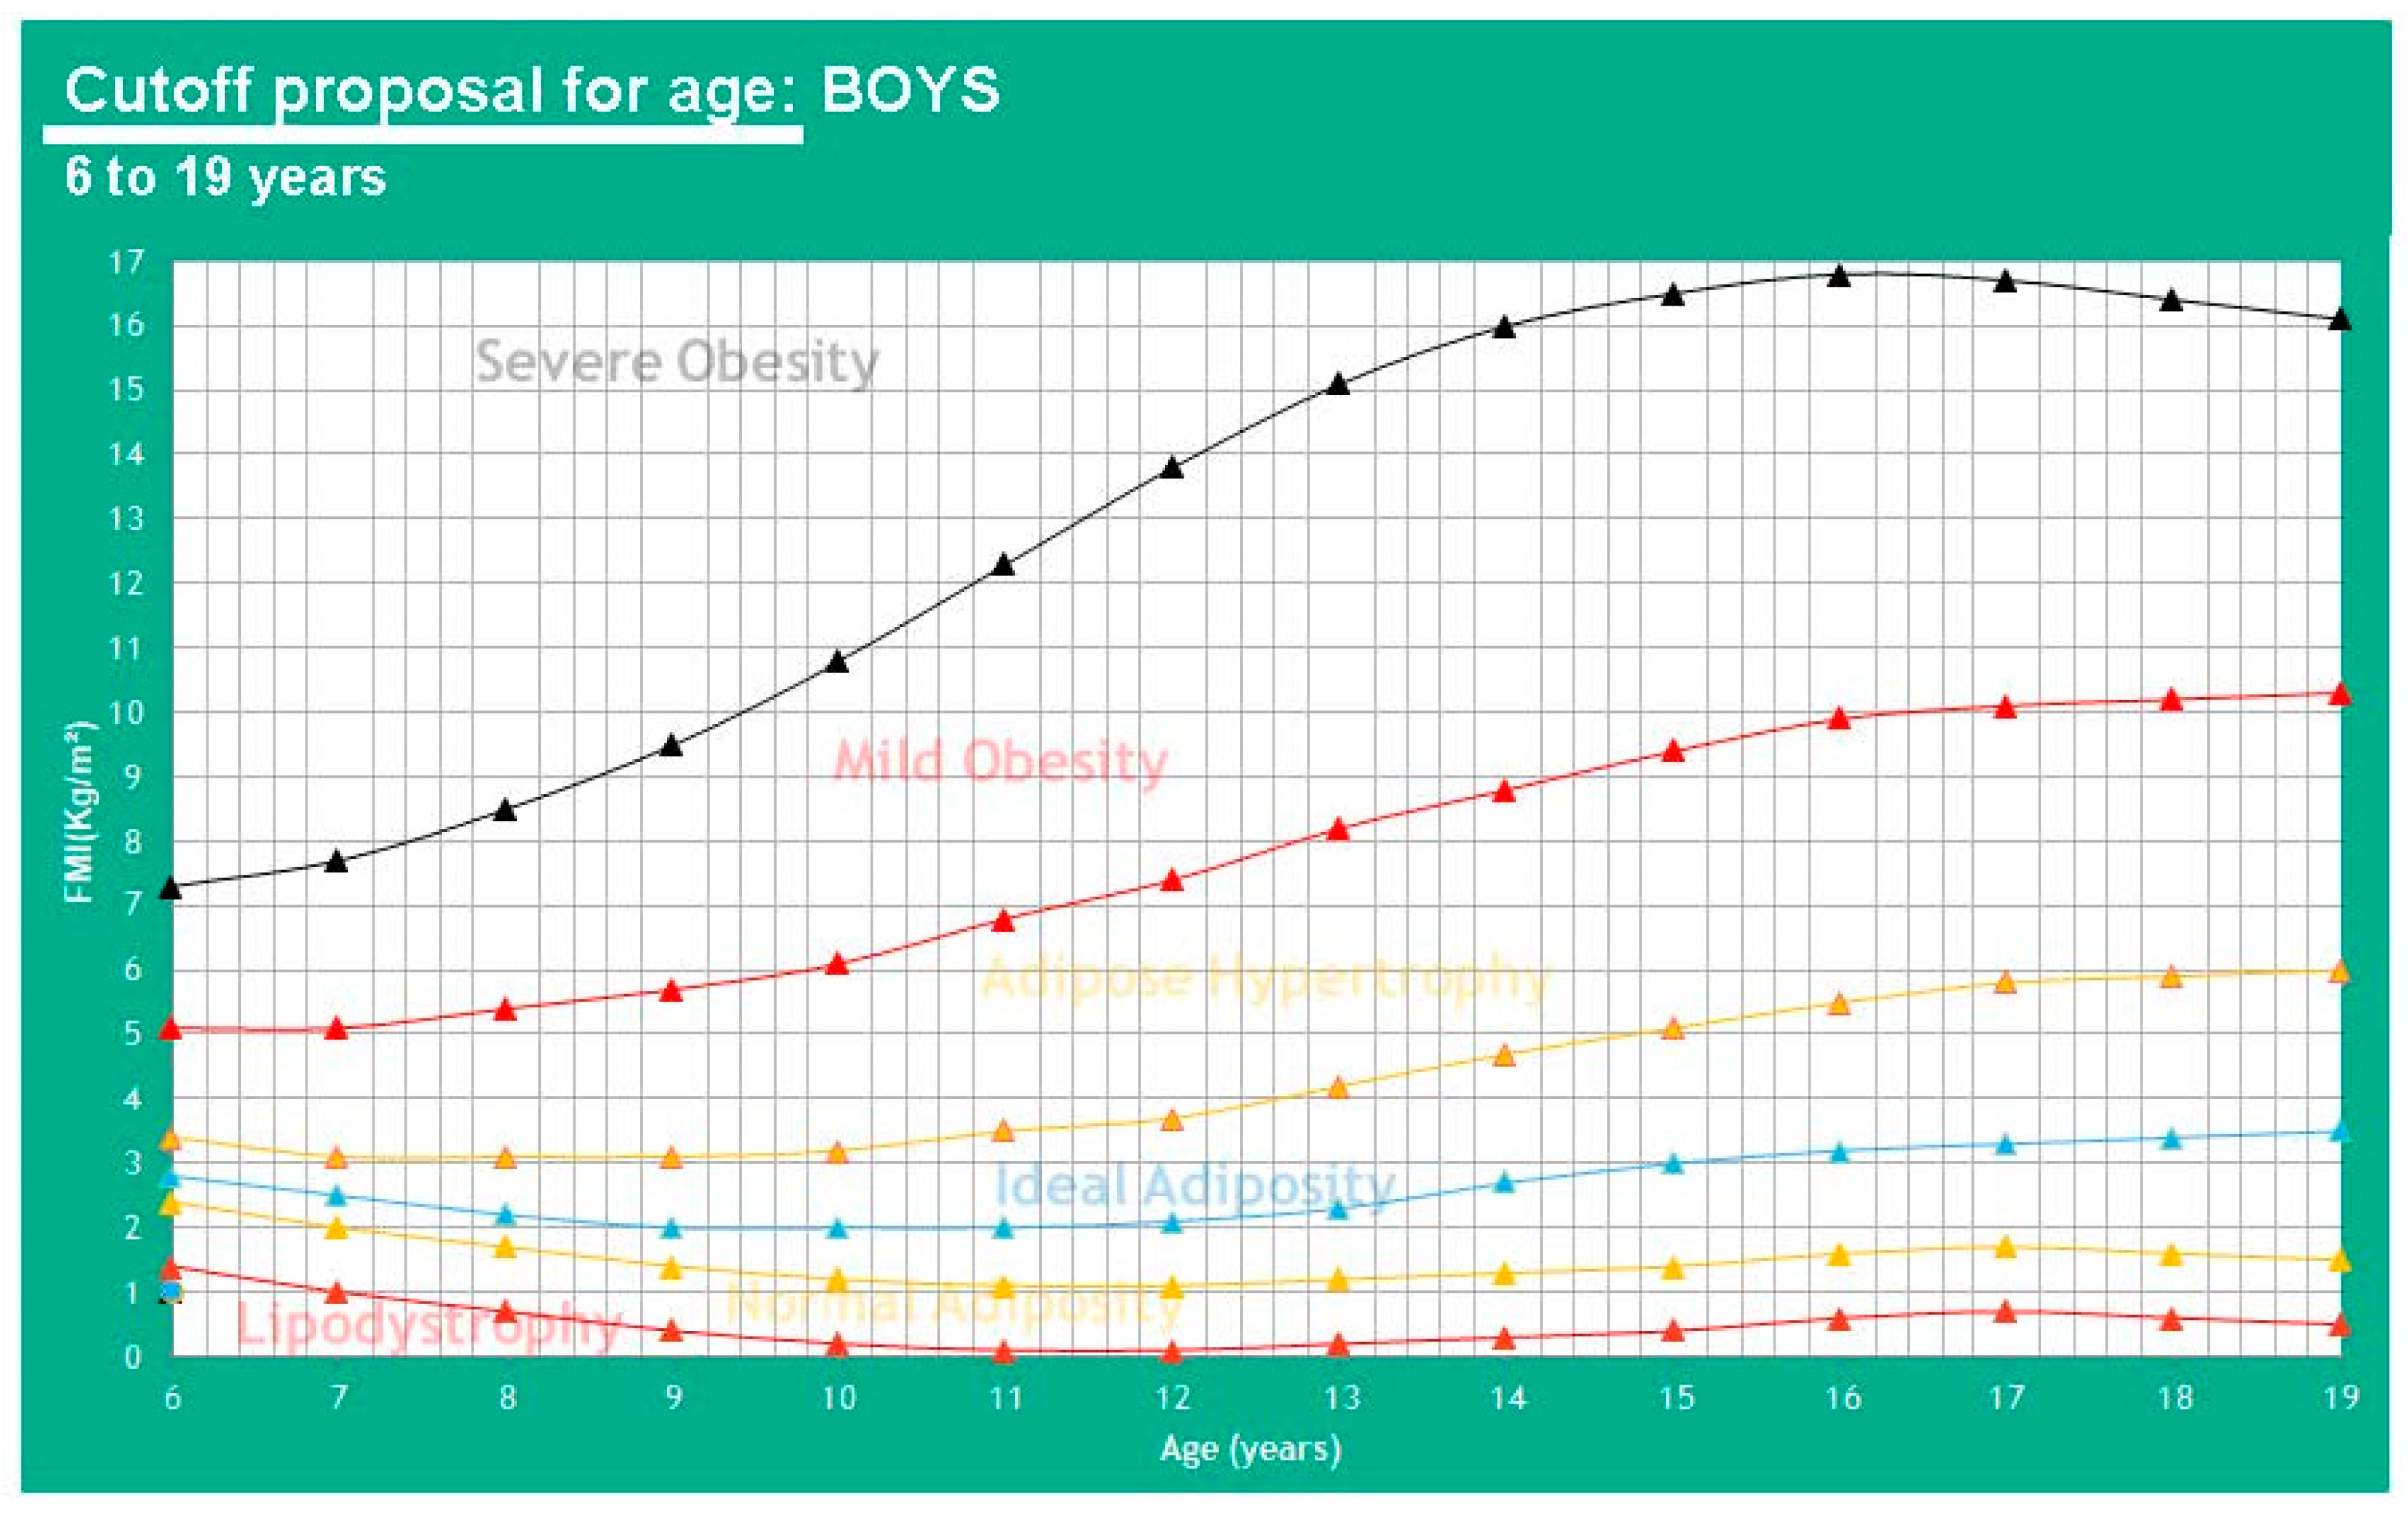
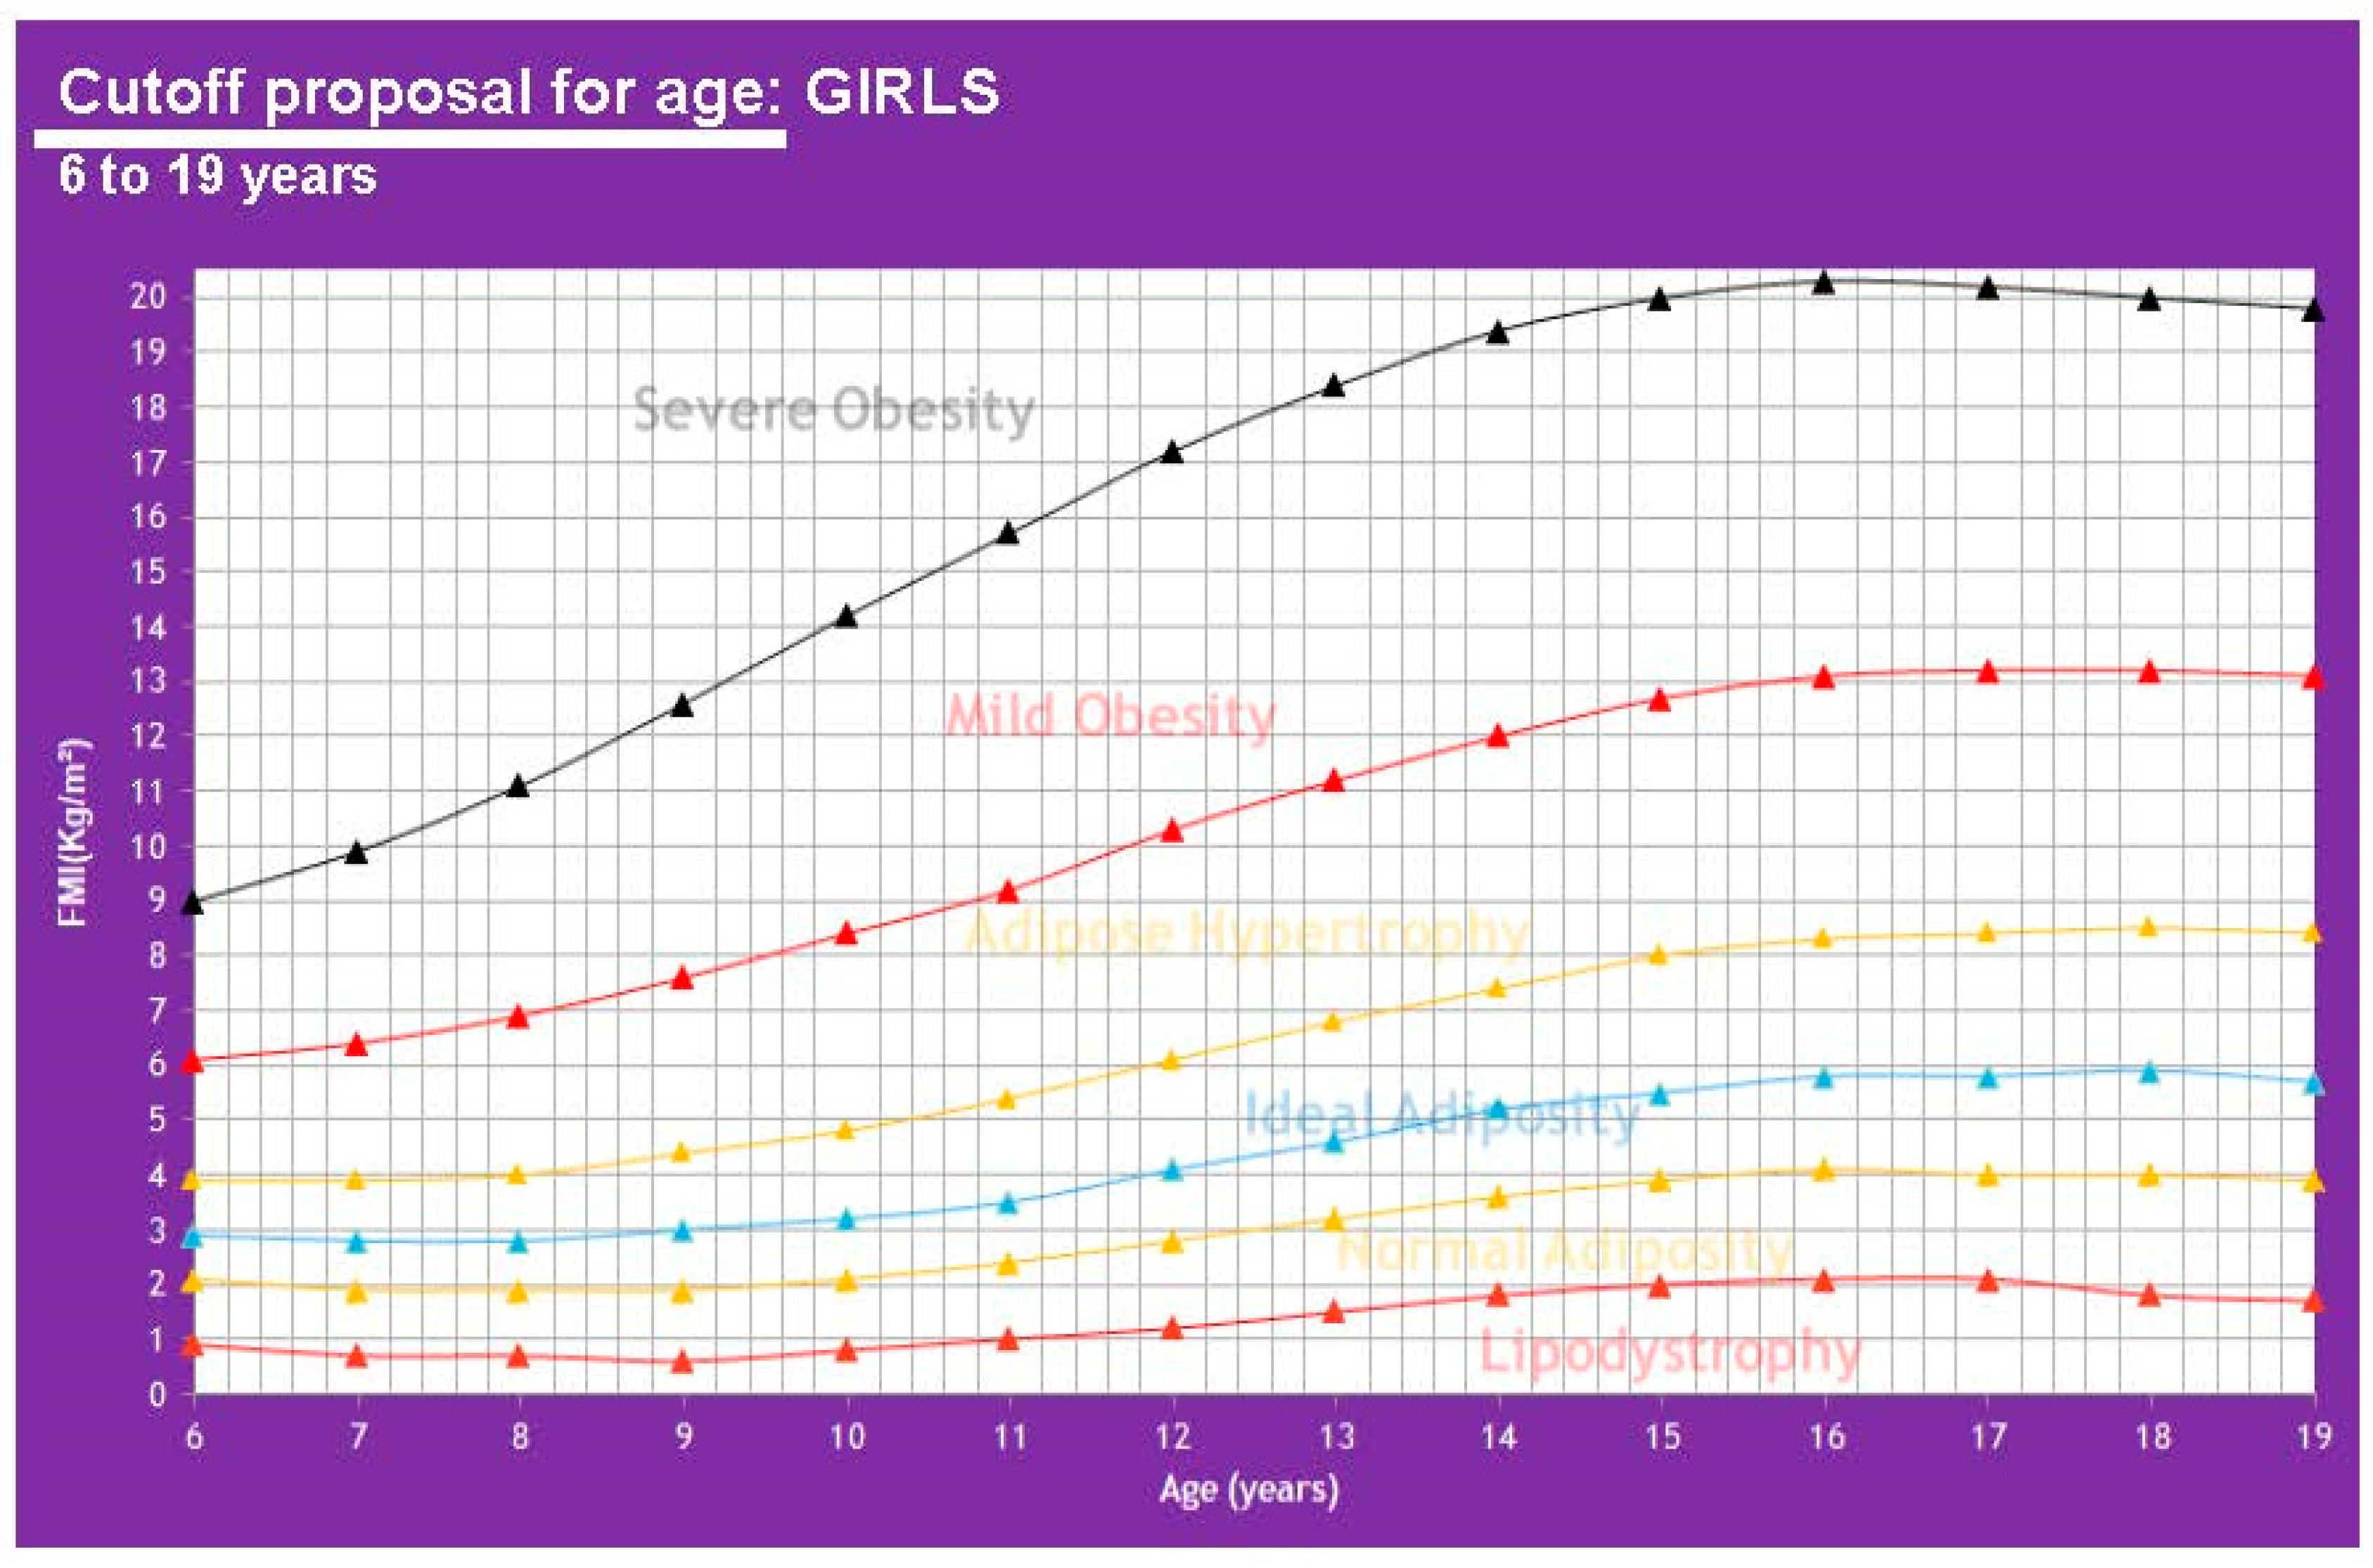
| FMI (kg/m2) ∝ to BMI (kg/m2) Proposal | ||||||||||||
|---|---|---|---|---|---|---|---|---|---|---|---|---|
| Age (Years)/Tanner Stage | −2 DE (Thinness–Lipodystrophy) | −1 DE (Normal Weight–Normal Adiposity) | Mean (Ideal Weight–Ideal Adiposity) | +1 DE (Overweight–Adipose Hypertrophy) | +2 DE (Mild Obesity) | +3 DE (Severe Obesity) | ||||||
| Girls | BMI | FMI | BMI | FMI | BMI | FMI | BMI | FMI | BMI | FMI | BMI | FMI |
| 6 y-o | ||||||||||||
| I-II | 12.7 | 0.9 | 13.9 | 2.1 | 15.3 | 2.9 | 17.0 | 3.9 | 19.2 | 6.1 | 22.1 | 9.0 |
| 7 y-o | ||||||||||||
| I-II | 12.7 | 0.7 | 13.9 | 1.9 | 15.4 | 2.8 | 17.3 | 3.9 | 19.8 | 6.4 | 23.3 | 9.9 |
| 8 y-o | ||||||||||||
| II-III | 12.9 | 0.7 | 14.1 | 1.9 | 15.7 | 2.8 | 17.7 | 4.0 | 20.6 | 6.9 | 24.8 | 11.1 |
| 9 y-o | ||||||||||||
| II-III | 13.1 | 0.6 | 14.4 | 1.9 | 16.1 | 3.0 | 18.3 | 4.4 | 21.5 | 7.6 | 26.5 | 12.6 |
| 10 y-o | ||||||||||||
| II-III | 13.5 | 0.8 | 14.8 | 2.1 | 16.6 | 3.2 | 19.0 | 4.8 | 22.6 | 8.4 | 28.4 | 14.2 |
| 11 y-o | ||||||||||||
| II-III | 13.9 | 1.0 | 15.3 | 2.4 | 17.2 | 3.5 | 19.9 | 5.4 | 23.7 | 9.2 | 30.2 | 15.7 |
| 12 y-o | ||||||||||||
| III-IV | 14.4 | 1.2 | 16.0 | 2.8 | 18.0 | 4.1 | 20.8 | 6.1 | 25.0 | 10.3 | 31.9 | 17.2 |
| 13 y-o | ||||||||||||
| III-IV | 14.9 | 1.5 | 16.6 | 3.2 | 18.8 | 4.6 | 21.8 | 6.8 | 26.2 | 11.2 | 33.4 | 18.4 |
| 14 y-o | ||||||||||||
| III-V | 15.4 | 1.8 | 17.2 | 3.6 | 19.6 | 5.2 | 22.7 | 7.4 | 27.3 | 12.0 | 34.7 | 19.4 |
| 15 y-o | ||||||||||||
| IV-V | 15.9 | 2.0 | 17.8 | 3.9 | 20.2 | 5.5 | 23.5 | 8.0 | 28.2 | 12.7 | 35.5 | 20.0 |
| 16 y-o | ||||||||||||
| IV-V | 16.2 | 2.1 | 18.2 | 4.1 | 20.7 | 5.8 | 24.1 | 8.3 | 28.9 | 13.1 | 36.1 | 20.3 |
| 17 y-o | ||||||||||||
| IV-V | 16.4 | 2.1 | 18.4 | 4.1 | 21.0 | 5.8 | 24.5 | 8.4 | 29.3 | 13.2 | 36.3 | 20.2 |
| 18 y-o | ||||||||||||
| V | 16.4 | 1.8 | 18.6 | 4.0 | 21.3 | 5.9 | 24.8 | 8.5 | 29.5 | 13.2 | 36.3 | 20.0 |
| 19 y-o | ||||||||||||
| V | 16.5 | 1.7 | 18.7 | 3.9 | 21.4 | 5.7 | 25.0 | 8.4 | 29.7 | 13.1 | 36.4 | 19.8 |
| Boys | ||||||||||||
| 6 y-o | 13.0 | 1.4 | 14.1 | 2.4 | 15.3 | 2.8 | 16.8 | 3.4 | 18.5 | 5.1 | 20.7 | 7.3 |
| 7 y-o | 13.1 | 1.0 | 14.2 | 2.0 | 15.5 | 2.5 | 17.0 | 3.1 | 19.0 | 5.1 | 21.6 | 7.7 |
| 8 y-o | 13.3 | 0.7 | 14.4 | 1.7 | 15.7 | 2.2 | 17.4 | 3.1 | 19.7 | 5.4 | 22.8 | 8.5 |
| 9 y-o | 13.5 | 0.4 | 14.6 | 1.4 | 16.0 | 2.0 | 17.9 | 3.1 | 20.5 | 5.7 | 24.3 | 9.5 |
| 10 y-o | 13.7 | 0.2 | 14.9 | 1.2 | 16.4 | 2.0 | 18.5 | 3.2 | 21.4 | 6.1 | 26.1 | 10.8 |
| 11 y-o | 14.1 | 0.1 | 15.3 | 1.1 | 16.9 | 2.0 | 19.2 | 3.5 | 22.5 | 6.8 | 28.0 | 12.3 |
| 12 y-o | 14.5 | 0.1 | 15.8 | 1.1 | 17.5 | 2.1 | 19.9 | 3.7 | 23.6 | 7.4 | 30.0 | 13.8 |
| 13 y-o | 14.9 | 0.2 | 16.4 | 1.2 | 18.2 | 2.3 | 20.8 | 4.2 | 24.8 | 8.2 | 31.7 | 15.1 |
| 14 y-o | 15.5 | 0.3 | 17.0 | 1.3 | 19.0 | 2.7 | 21.8 | 4.7 | 25.9 | 8.8 | 33.1 | 16.0 |
| 15 y-o | 16.0 | 0.4 | 17.6 | 1.4 | 19.8 | 3.0 | 22.7 | 5.1 | 27.0 | 9.4 | 34.1 | 16.5 |
| 16 y-o | 16.5 | 0.6 | 18.2 | 1.6 | 20.5 | 3.2 | 23.5 | 5.5 | 27.9 | 9.9 | 34.8 | 16.8 |
| 17 y-o | 16.9 | 0.7 | 18.8 | 1.7 | 21.1 | 3.3 | 24.3 | 5.8 | 28.6 | 10.1 | 35.2 | 16.7 |
| 18 y-o | 17.3 | 0.6 | 19.2 | 1.6 | 21.7 | 3.4 | 24.9 | 5.9 | 29.2 | 10.2 | 35.4 | 16.4 |
| 19 y-o | 17.6 | 0.5 | 19.6 | 1.5 | 22.2 | 3.5 | 25.4 | 6.0 | 29.7 | 10.3 | 35.5 | 16.1 |
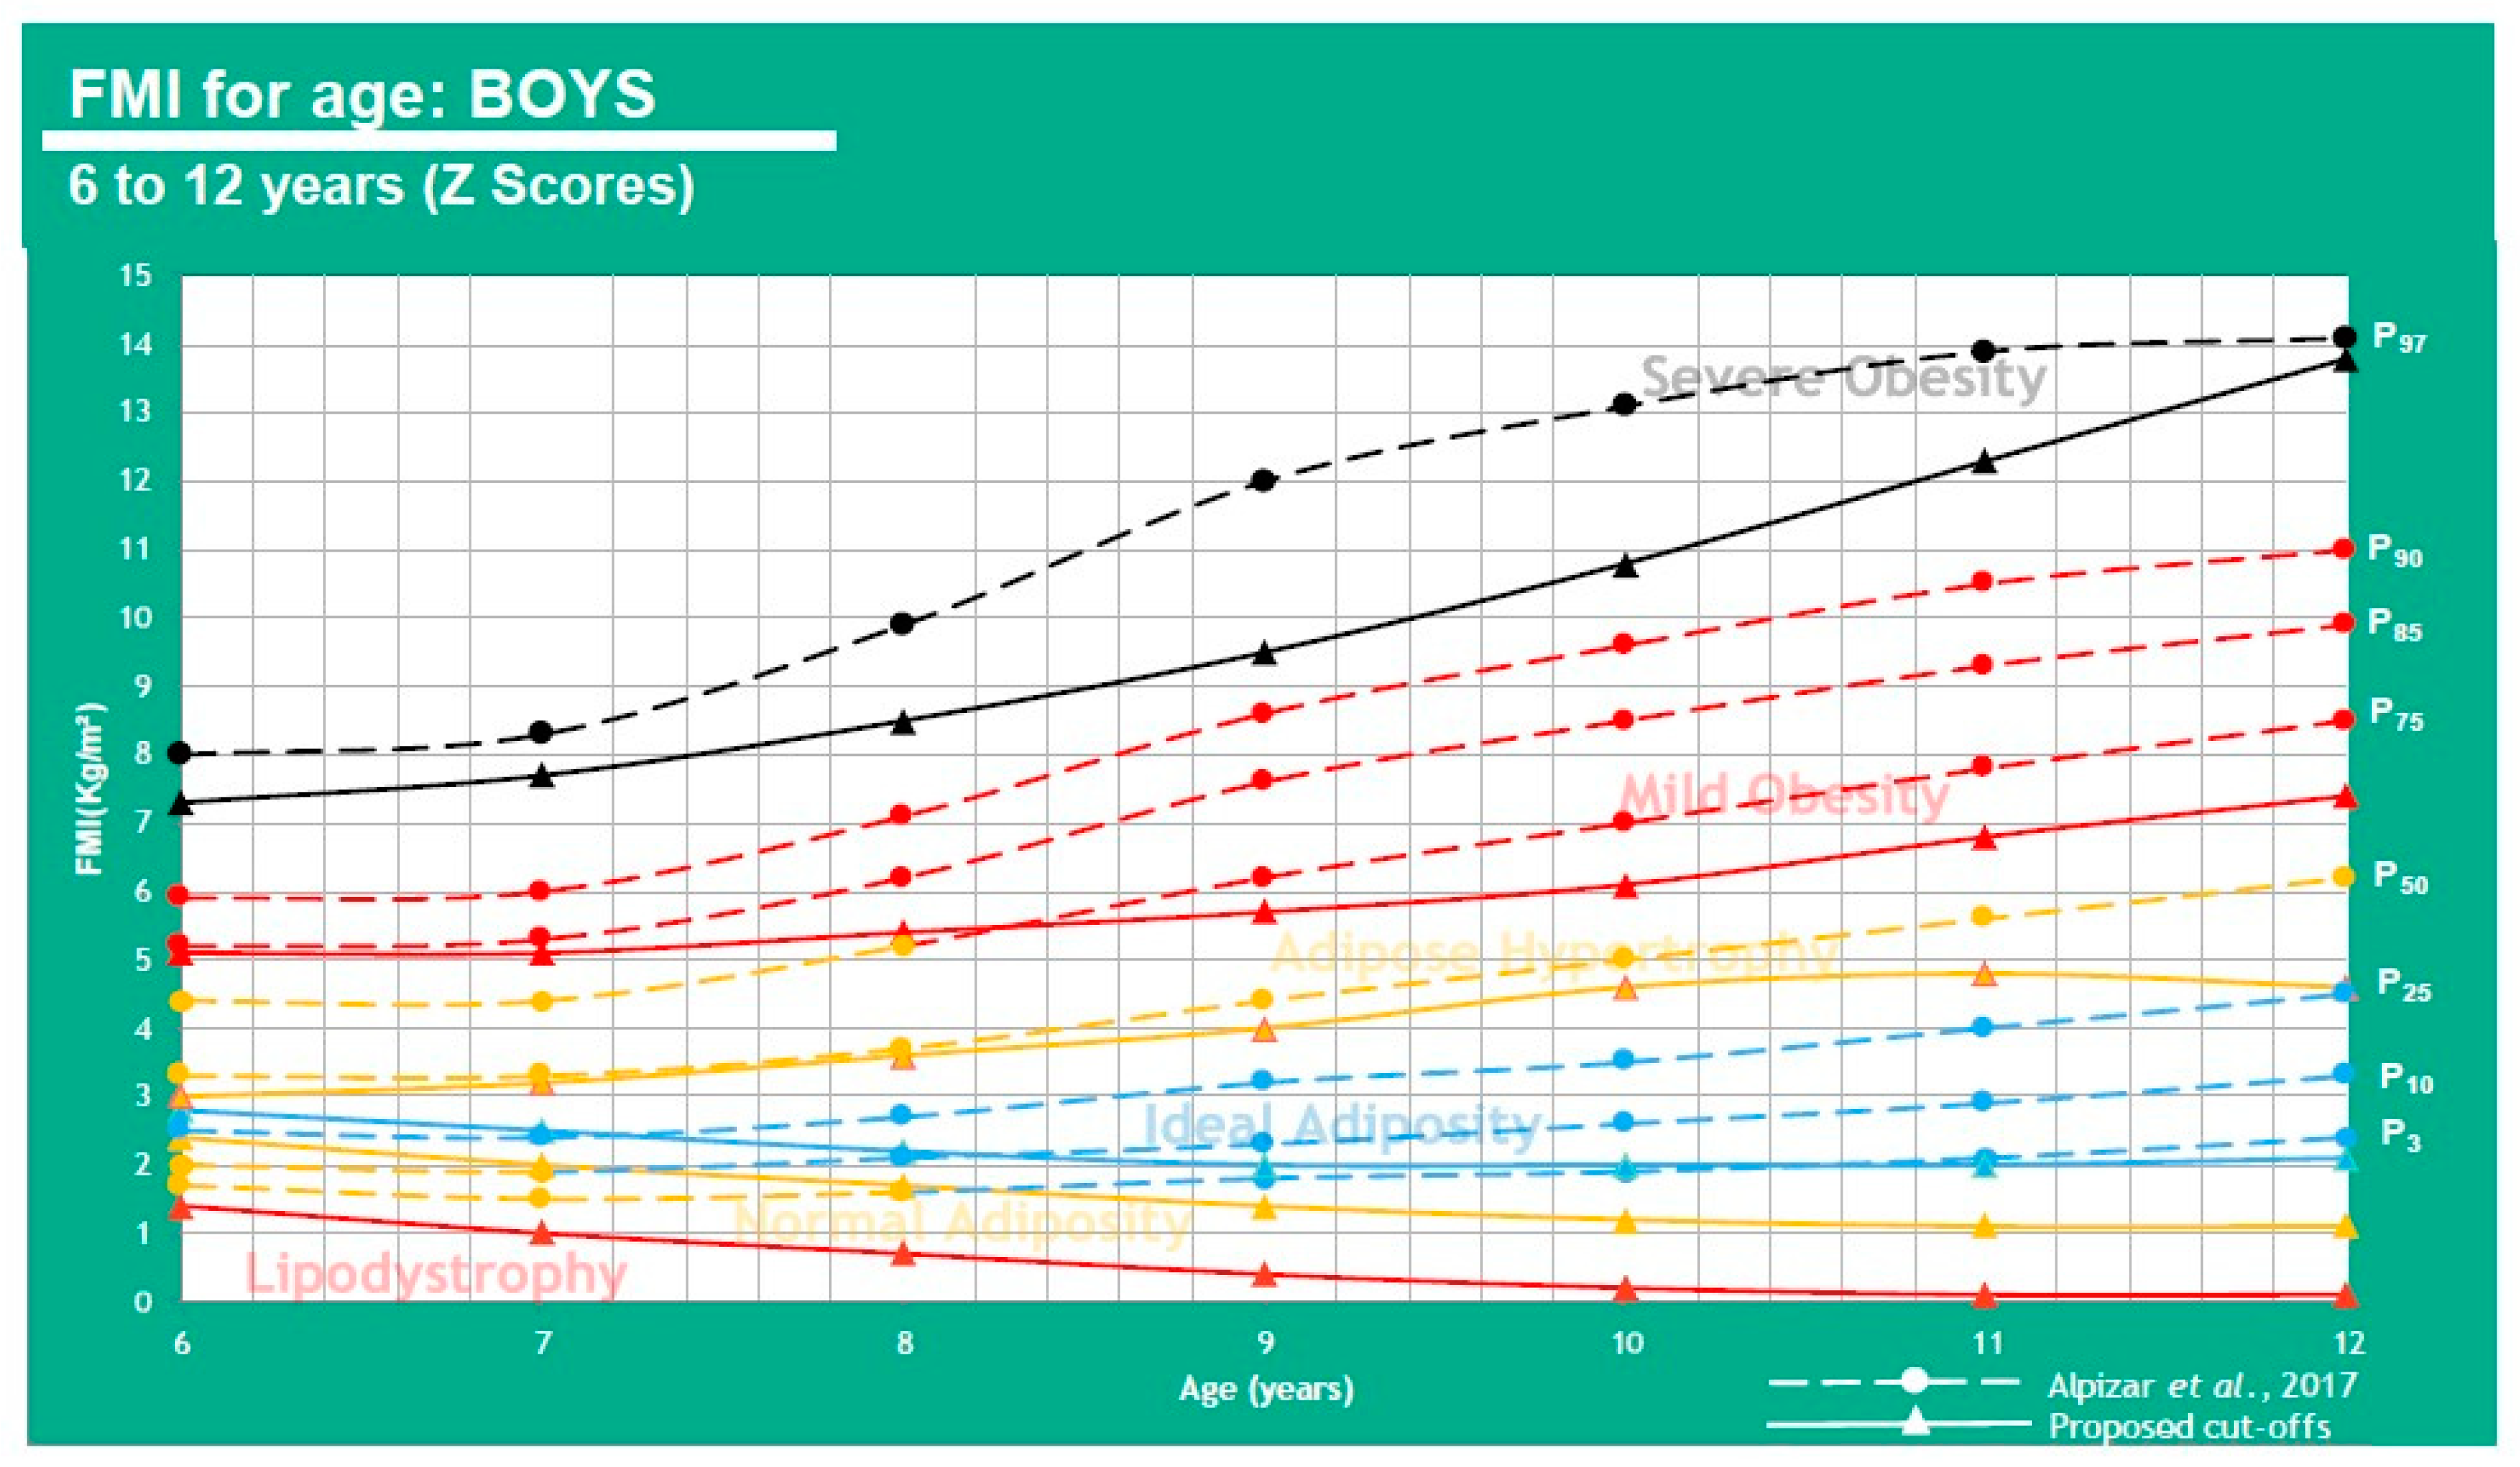
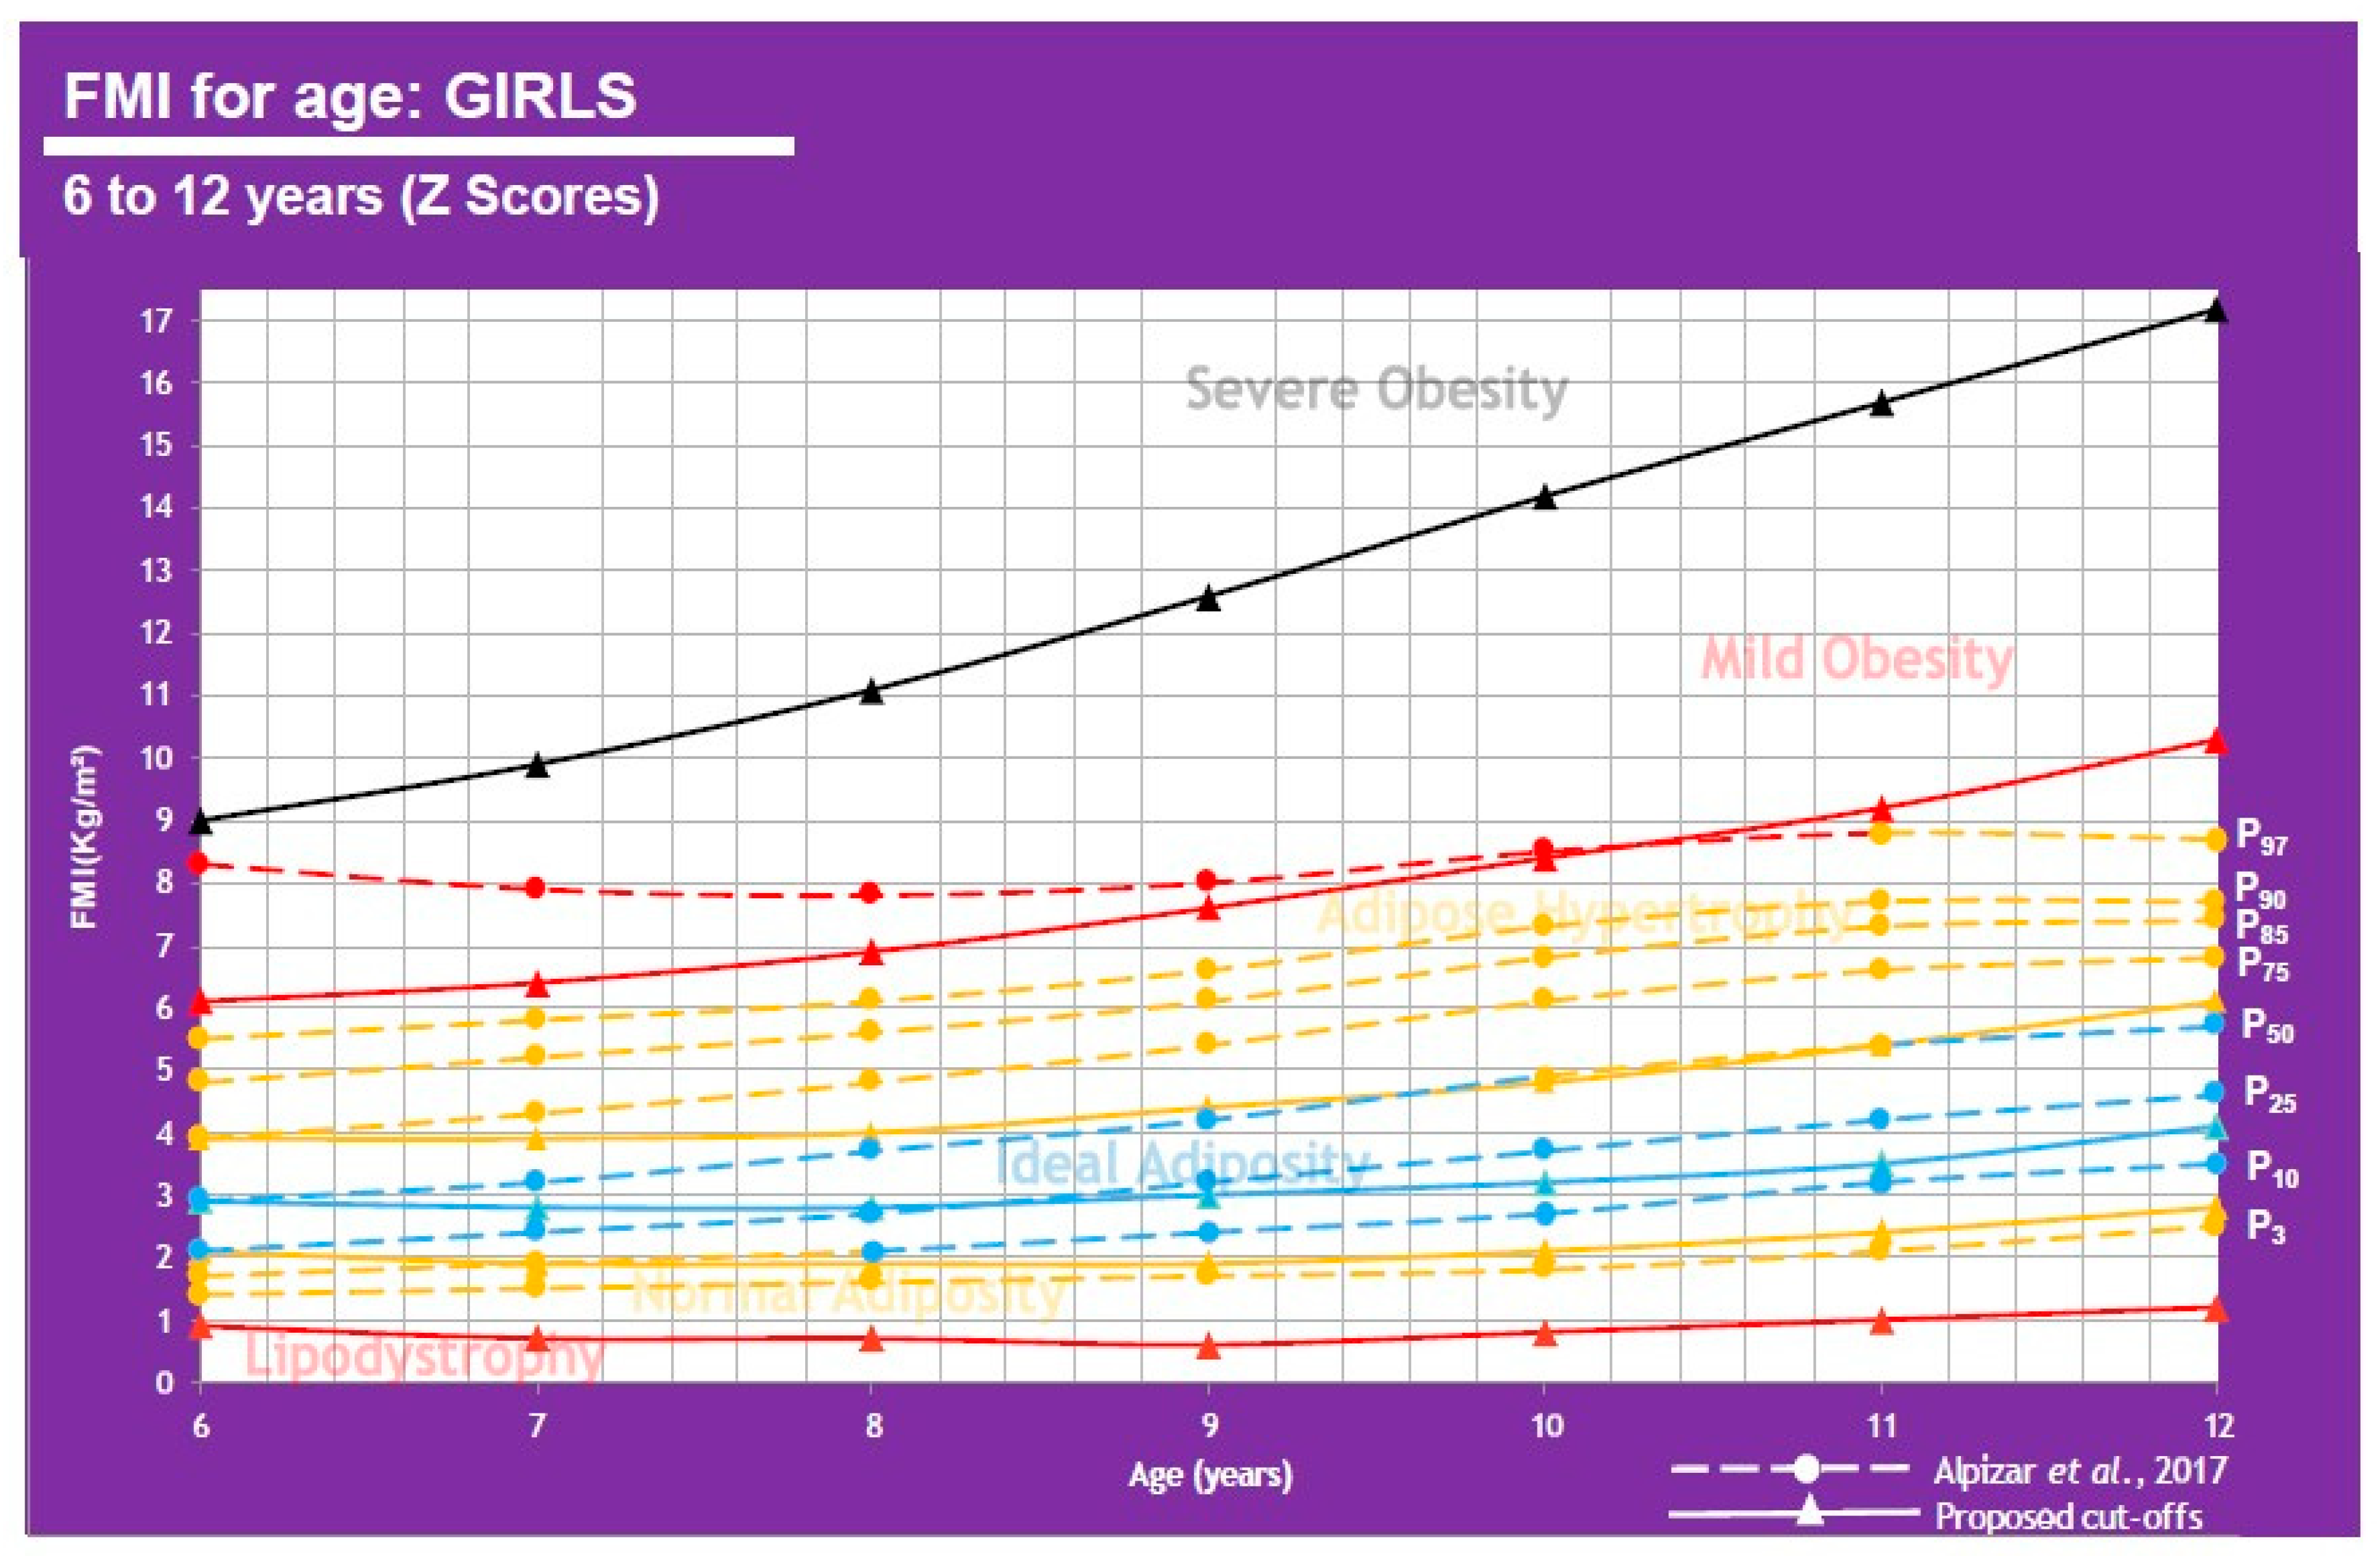
| Childhood Obesity Cutoff Points Using FMI (kg/m2) | ||||||||||||
|---|---|---|---|---|---|---|---|---|---|---|---|---|
| Age (Years) | −2 DE (Lipodystrophy) | −1 DE (Normal Adiposity) | Mean (Ideal Adiposity) | +1 DE (Adipose Hypertrophy) | +2 DE (Mild Obesity) | +3 DE (Severe Obesity) | ||||||
| Boys | FMI∝ | Alpízar | FMI∝ | Alpízar | FMI∝ | Alpízar | FMI∝ | Alpízar | FMI∝ | Alpízar | FMI∝ | Alpízar |
| 6 | 1.4 | - | 2.4 | P3, P10 | 2.8 | P25, P50 | 3.4 | P75 | 5.1 | P85, P90 | 7.3 | P97 |
| 7 | 1.0 | - | 2.0 | P3, P10 | 2.5 | P25 | 3.1 | P50, P75 | 5.1 | P85, P90 | 7.7 | P97 |
| 8 | 0.7 | - | 1.7 | P3 | 2.2 | P10, P25 | 3.1 | P50, P75 | 5.4 | P85, P90 | 8.5 | P97 |
| 9 | 0.4 | - | 1.4 | - | 2.0 | P3, P10 | 3.1 | P25, P50 | 5.7 | P75, P85, P90 | 9.5 | P97 |
| 10 | 0.2 | - | 1.2 | - | 2.0 | P3, P10 | 3.2 | P25, P50 | 6.1 | P75, P85, P90 | 10.8 | P97 |
| 11 | 0.1 | - | 1.1 | - | 2.0 | P3, P10 | 3.5 | P25, P50 | 6.8 | P75, P85, P90 | 12.3 | P97 |
| 12 | 0.1 | - | 1.1 | - | 2.1 | P3, P10 | 3.7 | P25, P50 | 7.4 | P75, P85, P90 | 13.8 | P97 |
| Girls | ||||||||||||
| 6 | 0.9 | - | 2.1 | P3, P10, P25 | 2.9 | P50 | 3.9 | P75, P85, P90 | 6.1 | P97 | 9.0 | - |
| 7 | 0.7 | - | 1.9 | P3, P10 | 2.8 | P25, P50 | 3.9 | P75, P85, P90 | 6.4 | P97 | 9.9 | - |
| 8 | 0.7 | - | 1.9 | P3 | 2.8 | P10, P25, P50 | 4.0 | P75, P85, P90 | 6.9 | P97 | 11.1 | - |
| 9 | 0.6 | - | 1.9 | P3 | 3.0 | P10, P25, P50 | 4.4 | P75, P85, P90 | 7.6 | P97 | 12.6 | - |
| 10 | 0.8 | - | 2.1 | P3 | 3.2 | P10, P25 | 4.8 | P50, P75, P85, P90 | 8.4 | P97 | 14.2 | - |
| 11 | 1.0 | - | 2.4 | P3 | 3.5 | P10, P25 | 5.4 | P50, P75, P85, P90, P97 | 9.2 | - | 15.7 | - |
| 12 | 1.2 | - | 2.8 | P3 | 4.1 | P10, P25, P50 | 6.1 | P75, P85, P90, P97 | 10.3 | - | 17.2 | - |
| BMI (kg/m2) Cutoff Points, FM% and FMI (kg/m2) vs. Mexican Pediatric Population Values | |||
|---|---|---|---|
| Age (Years) | 50th Percentile | ||
| Boys | BMI | FM% | FMI |
| 6 | Overweight | No risk of obesity | Ideal adiposity |
| 7 | Overweight | No risk of obesity | Adipose hypertrophy |
| 8 | Overweight | At risk | Adipose hypertrophy |
| 9 | Overweight | At risk | Adipose hypertrophy |
| 10 | Overweight | Obesity | Adipose hypertrophy |
| 11 | Overweight | Obesity | Adipose hypertrophy |
| 12 | Overweight | Obesity | Adipose hypertrophy |
| Girls | |||
| 6 | Ideal weight | No risk of obesity | Ideal adiposity |
| 7 | Ideal weight | No risk of obesity | Ideal adiposity |
| 8 | Ideal weight | No risk of obesity | Ideal adiposity |
| 9 | Ideal weight | No risk of obesity | Ideal adiposity |
| 10 | Ideal weight | At risk | Adipose hypertrophy |
| 11 | Ideal weight | At risk | Adipose hypertrophy |
| 12 | Ideal weight | At risk | Ideal adiposity |
| Different Population Studies | ||||||||||
|---|---|---|---|---|---|---|---|---|---|---|
| Reference | n Total | n Men | n Women | Ages (Years) | Population | FMI (kg/m2) Men | FMI (kg/m2) Women | Notes | Technique Used to Determine Adiposity | Risk of Bias |
| Van Itallie et al. (1990) [16] | 192 | 192 | 0 | 20.59 | USA | 8.3–9.7 | N/D | P95, FM excess (obesity). | Electromagnetic scanning instrument (EM-SCAN) | Moderate |
| Liu et al. (2013) [13] | 1698 | 1105 | 593 | 20–79 | China | 7.0 | 7.9 | MetS risk | Bioelectrical impedance analysis | Moderate |
| Morais et al. (2016) [17] | 403 | 185 | 218 | 10–14 | Brazil | 4.9–5.3 | 6.2–8.5 | Cardiovascular risk | Bioelectrical impedance analysis | Moderate |
| Aerobics Center Longitudinal Study, ACLS (2016) [25] | 60,335 | 44,234 | 16,101 | 43 (media) | USA | 10.4; 11.9 | 12.0; 12.9 | Cardiovascular risk; class II obesity in men and class I in women | Skinfold thicknesses–sum of 7 skinfold measures or hydrostatic weighting | Low |
| FUPRECOL Study (2017) [27] | 1687 | 617 | 1070 | 18–35 | Colombia | 6.97 | 11.86 | MetS risk | Bioelectrical impedance analysis | Low |
© 2020 by the authors. Licensee MDPI, Basel, Switzerland. This article is an open access article distributed under the terms and conditions of the Creative Commons Attribution (CC BY) license (http://creativecommons.org/licenses/by/4.0/).
Share and Cite
Alpízar, M.; Frydman, T.D.; Reséndiz-Rojas, J.d.J.; Trejo-Rangel, M.A.; Aldecoa-Castillo, J.M.D. Fat Mass Index (FMI) as a Trustworthy Overweight and Obesity Marker in Mexican Pediatric Population. Children 2020, 7, 19. https://0-doi-org.brum.beds.ac.uk/10.3390/children7030019
Alpízar M, Frydman TD, Reséndiz-Rojas JdJ, Trejo-Rangel MA, Aldecoa-Castillo JMD. Fat Mass Index (FMI) as a Trustworthy Overweight and Obesity Marker in Mexican Pediatric Population. Children. 2020; 7(3):19. https://0-doi-org.brum.beds.ac.uk/10.3390/children7030019
Chicago/Turabian StyleAlpízar, Melchor, Tamara Daniela Frydman, José de Jesús Reséndiz-Rojas, Miguel Alejandro Trejo-Rangel, and Jesús Manuel De Aldecoa-Castillo. 2020. "Fat Mass Index (FMI) as a Trustworthy Overweight and Obesity Marker in Mexican Pediatric Population" Children 7, no. 3: 19. https://0-doi-org.brum.beds.ac.uk/10.3390/children7030019