Eating Behaviors in Relation to Child Weight Status and Maternal Education


Abstract
:1. Introduction
2. Materials and Methods
2.1. Participants
2.2. Anthropometric Measures
2.3. Psychometric Measures
2.4. Statistical Analysis
3. Results
4. Discussion
5. Conclusions
Author Contributions
Funding
Institutional Review Board Statement
Informed Consent Statement
Data Availability Statement
Acknowledgments
Conflicts of Interest
References
- Ng, M.; Fleming, T.; Robinson, M.; Thomson, B.; Graetz, N.; Margono, C.; Mullany, E.C.; Biryukov, S.; Abbafati, C.; Abera, S.F.; et al. Global, regional, and national prevalence of overweight and obesity in children and adults during 1980–2013: A systematic analysis for the global burden of disease study 2013. Lancet 2014, 384, 766–781. [Google Scholar] [CrossRef] [Green Version]
- WHO. BMI Classification; World Health Organization: Geneva, Switzerland, 2018. [Google Scholar]
- Basen-Engquist, K.M.; Swartz, M.C. Obesity and cancer risk: Recent review and evidence. Curr. Oncol. Rep. 2011, 13, 71–76. [Google Scholar] [CrossRef] [PubMed]
- Chu, D.-T.; Tao, Y. Molecular connections of obesity and aging: A focus on adipose protein 53 and retinoblastoma protein. Biogerontology 2017, 18, 321–332. [Google Scholar] [CrossRef] [PubMed]
- Mitchell, A.B.; Cole, J.W.; McArdle, P.F.; Cheng, Y.-C.; Ryan, K.A.; Sparks, M.J.; Mitchell, B.D.; Kittner, S.J. Obesity increases risk of ischemic stroke in young adults. Stroke 2015, 46, 1690–1692. [Google Scholar] [CrossRef] [PubMed] [Green Version]
- Rimm, E.B.; Stampfer, M.J.; Giovannucci, E.; Ascherio, A.; Spiegelman, D.; Colditz, G.A.; Willett, W.C. Body size and fat distribution as predictors of coronary heart disease among middle-aged and older US men. Am. J. Epidemiol. 1995, 141, 1117–1127. [Google Scholar] [CrossRef] [PubMed]
- Hanh, N.T.H.; Le, T.; Dao, D.T.A.; Tao, Y.; Chu, D.-T. Childhood obesity is a high-risk factor for hypertriglyceridemia: A case-control study in vietnam. Osong Public Health Res. Perspect. 2017, 8, 138–146. [Google Scholar] [CrossRef]
- Hu, F.B. Sedentary lifestyle and risk of obesity and type 2 diabetes. Lipids 2003, 38, 103–108. [Google Scholar] [CrossRef]
- Ogden, C.L.; Carroll, M.D.; Kit, B.K.; Flegal, K.M. Prevalence of childhood and adult obesity in the United States, 2011–2012. JAMA 2014, 311, 806–814. [Google Scholar] [CrossRef] [Green Version]
- Guo, S.S.; Wu, W.; Chumlea, W.C.; Roche, A.F. Predicting overweight and obesity in adulthood from body mass index values in childhood and adolescence. Am. J. Clin. Nutr. 2002, 76, 653–658. [Google Scholar] [CrossRef] [Green Version]
- Ouchi, N.; Higuchi, A.; Ohashi, K.; Oshima, Y.; Gokce, N.; Shibata, R.; Akasaki, Y.; Shimono, A.; Walsh, K. Sfrp5 is an anti-inflammatory adipokine that modulates metabolic dysfunction in obesity. Science 2010, 329, 454–457. [Google Scholar] [CrossRef] [Green Version]
- Bartrina, J.A. Current mapping of obesity. Nutr. Hosp. 2013, 28, 21–31. [Google Scholar]
- Reilly, J.J.; Armstrong, J.; Dorosty, A.R.; Emmett, P.M.; Ness, A.; Rogers, I.; Steer, C.; Sherriff, A. Early life risk factors for obesity in childhood: Cohort study. BMJ 2005, 330, 1357. [Google Scholar] [CrossRef] [PubMed] [Green Version]
- Whitaker, K.L.; Jarvis, M.J.; Beeken, R.J.; Boniface, D.; Wardle, J. Comparing maternal and paternal intergenerational transmission of obesity risk in a large population-based sample. Am. J. Clin. Nutr. 2010, 91, 1560–1567. [Google Scholar] [CrossRef] [PubMed] [Green Version]
- Fairburn, C.G.; Welch, S.L.; Doll, H.A.; Davies, B.A.; O’Connor, M. Risk factors for bulimia nervosa. Arch. Gen. Psychiatry 1997, 54, 509. [Google Scholar] [CrossRef] [PubMed]
- Hudson, J.I.; Hiripi, E.; Pope, H.G.; Kessler, R.C. The prevalence and correlates of eating disorders in the national comorbidity survey replication. Biol. Psychiatry 2007, 61, 348–358. [Google Scholar] [CrossRef] [Green Version]
- Moskowitz, L.; Weiselberg, E. Anorexia nervosa/atypical anorexia nervosa. Curr. Probl. Pediatr. Adolesc. Health Care 2017, 47, 70–84. [Google Scholar] [CrossRef]
- Jahnke, D.L.; Warschburger, P.A. Familial transmission of eating behaviors in preschool-aged children. Obesity 2008, 16, 1821–1825. [Google Scholar] [CrossRef]
- Story, M.; Neumark-Sztainer, D.; French, S. Individual and environmental influences on adolescent eating behaviors. J. Am. Diet. Assoc. 2002, 102, S40–S51. [Google Scholar] [CrossRef]
- Klesges, R.C.; Stein, R.J.; Eck, L.H.; Isbell, T.R.; Klesges, L.M. Parental influence on food selection in young children and its relationships to childhood obesity. Am. J. Clin. Nutr. 1991, 53, 859–864. [Google Scholar] [CrossRef]
- Aranceta-Bartrina, J.; Pérez-Rodrigo, C.; Ribas, L.; Serra-Majem, L. Sociodemographic and lifestyle determinants of food patterns in Spanish children and adolescents: The enKid study. Eur. J. Clin. Nutr. 2003, 57, S40–S44. [Google Scholar] [CrossRef] [Green Version]
- Rogers, P.E.I.; Emmett, P. The effect of maternal smoking status, educational level and age on food and nutrient intakes in preschool children: Results from the Avon longitudinal study of parents and children. Eur. J. Clin. Nutr. 2003, 57, 854–864. [Google Scholar] [CrossRef] [PubMed] [Green Version]
- Vereecken, C.; Keukelier, E.; Maes, L. Influence of mother’s educational level on food parenting practices and food habits of young children. Appetite 2004, 43, 93–103. [Google Scholar] [CrossRef] [PubMed]
- Wachs, T.D.; Creed-Kanashiro, H.M.; Cueto, S.; Jacoby, E. Maternal education and intelligence predict offspring diet and nutritional status. J. Nutr. 2005, 135, 2179–2186. [Google Scholar] [CrossRef] [PubMed] [Green Version]
- Wachs, T.D.; McCabe, G. Relation of maternal intelligence and schooling to offspring nutritional intake. Int. J. Behav. Dev. 2001, 25, 444–449. [Google Scholar] [CrossRef]
- Savage, J.S.; Fisher, J.O.; Birch, L.L. Parental influence on eating behavior: Conception to adolescence. J. Law Med. Ethics 2007, 35, 22–34. [Google Scholar] [CrossRef] [Green Version]
- McCaffree, J. Childhood eating patterns: The roles parents play. J. Am. Diet. Assoc. 2003, 103, 1587. [Google Scholar] [CrossRef]
- Wardle, J.; Carnell, S.; Cooke, L. Parental control over feeding and children’s fruit and vegetable intake: How are they related? J. Am. Diet. Assoc. 2005, 105, 227–232. [Google Scholar] [CrossRef]
- Skouteris, H.; McCabe, M.; Ricciardelli, L.A.; Milgrom, J.; Baur, L.A.; Aksan, N.; Dell’Aquila, D. Parent–child interactions and obesity prevention: A systematic review of the literature. Early Child Dev. Care 2012, 182, 153–174. [Google Scholar] [CrossRef]
- Groth, M.V.; Fagt, S.; Brøndsted, L. Social determinants of dietary habits in Denmark. Eur. J. Clin. Nutr. 2001, 55, 959–966. [Google Scholar] [CrossRef]
- Northstone, K.; Emmett, P.M. Multivariate analysis of diet in children at four and seven years of age and associations with socio-demographic characteristics. Eur. J. Clin. Nutr. 2005, 59, 751–760. [Google Scholar] [CrossRef] [Green Version]
- Robinson, S.; Crozier, S.R.; Borland, S.E.; Hammond, J.; Barker, D.J.P.; Inskip, H.M. Impact of educational attainment on the quality of young women’s diets. Eur. J. Clin. Nutr. 2004, 58, 1174–1180. [Google Scholar] [CrossRef] [PubMed] [Green Version]
- Smithers, L.; Brazionis, L.; Golley, R.K.; Mittinty, M.N.; Northstone, K.; Emmett, P.; McNaughton, S.A.; Campbell, K.J.; Lynch, J.W. Associations between dietary patterns at 6 and 15 months of age and sociodemographic factors. Eur. J. Clin. Nutr. 2012, 66, 658–666. [Google Scholar] [CrossRef] [Green Version]
- Ystrom, E.; Niegel, S.; Vollrath, M.E. The impact of maternal negative affectivity on dietary patterns of 18-month-old children in the Norwegian mother and child cohort study. Matern. Child Nutr. 2009, 5, 234–242. [Google Scholar] [CrossRef] [PubMed]
- Fisk, C.M.; Crozier, S.R.; Inskip, H.M.; Godfrey, K.M.; Cooper, C.; Robinson, S.M.; the Southampton Women’s Survey Study Group. Influences on the quality of young children’s diets: The importance of maternal food choices. Br. J. Nutr. 2010, 105, 287–296. [Google Scholar] [CrossRef] [Green Version]
- Northstone, K.; the Avon Longitudinal Study of Pregnancy and Childhood (ALSPAC) Study Team; Emmett, P. Multivariate analysis of diet among three-year-old children and associations with socio-demographic characteristics. Eur. J. Clin. Nutr. 2000, 54, 73–80. [Google Scholar] [CrossRef] [Green Version]
- Ruiz, M.A.; Goldblatt, P.; Torrent, M.; Iñiguez, C.; Larrañaga, I.; Chryssa, B.; Veltsista, A.; Van Eijsden, M.; Vrijkotte, T.G.; Andrýsková, L.; et al. Impact of low maternal education on early childhood overweight and obesity in Europe. Paediatr. Périnat. Epidemiol. 2016, 30, 274–284. [Google Scholar] [CrossRef] [PubMed] [Green Version]
- Craigie, A.M.; Lake, A.A.; Kelly, S.A.; Adamson, A.J.; Mathers, J.C. Tracking of obesity-related behaviours from childhood to adulthood: A systematic review. Maturitas 2011, 70, 266–284. [Google Scholar] [CrossRef] [Green Version]
- Wardle, J.; Guthrie, C.A.; Sanderson, S.; Rapoport, L. Development of the children’s eating behaviour questionnaire. J. Child Psychol. Psychiatry 2001, 42, 963–970. [Google Scholar] [CrossRef] [Green Version]
- Ek, A.; Sorjonen, K.; Eli, K.; Lindberg, L.; Nyman, J.; Marcus, C.; Nowicka, P. Associations between parental concerns about preschoolers’ weight and eating and parental feeding practices: Results from analyses of the child eating behavior questionnaire, the child feeding questionnaire, and the lifestyle behavior checklist. PLoS ONE 2016, 11, e0147257. [Google Scholar] [CrossRef] [Green Version]
- Viana, V.; Sinde, S.; Saxton, J.C. Children’s eating behaviour questionnaire: Associations with BMI in Portuguese children. Br. J. Nutr. 2008, 100, 445–450. [Google Scholar] [CrossRef] [Green Version]
- Jansen, P.W.; De Barse, L.M.; Jaddoe, V.W.; Verhulst, F.C.; Franco, O.H.; Tiemeier, H. Bi-directional associations between child fussy eating and parents’ pressure to eat: Who influences whom? Physiol. Behav. 2017, 176, 101–106. [Google Scholar] [CrossRef] [PubMed]
- Ayine, P.; Selvaraju, V.; Venkatapoorna, C.M.K.; Geetha, T. Parental feeding practices in relation to maternal education and childhood obesity. Nutrients 2020, 12, 1033. [Google Scholar] [CrossRef] [PubMed] [Green Version]
- Venkatapoorna, C.M.K.; Ayine, P.; Selvaraju, V.; Parra, E.P.; Koenigs, T.; Babu, J.R.; Geetha, T. The relationship between obesity and sleep timing behavior, television exposure, and dinnertime among elementary school-age children. J. Clin. Sleep Med. 2020, 16, 129–136. [Google Scholar] [CrossRef] [PubMed]
- CDC. Defining Childhood Obesity. BMI for Children and Teens; CDC: Atlanta, GA, USA, 2018.
- Ashcroft, J.J.; Semmler, C.; Carnell, S.; Van Jaarsveld, C.H.M.; Wardle, J. Continuity and stability of eating behaviour traits in children. Eur. J. Clin. Nutr. 2007, 62, 985–990. [Google Scholar] [CrossRef] [Green Version]
- Carnell, S.; Wardle, J. Measuring behavioural susceptibility to obesity: Validation of the child eating behaviour questionnaire. Appetite 2007, 48, 104–113. [Google Scholar] [CrossRef]
- Cohen, J. Statistical Power Analysis for the Behavioral Sciences, 2nd ed.; Routledge: New York, NY, USA, 1988. [Google Scholar]
- Nunnally, J.C., Jr. Introduction to Psychological Measurement; McGraw-Hill: New York, NY, USA, 1978. [Google Scholar]
- Dos Passos, D.R.; Gigante, D.P.; Maciel, F.V.; Matijasevich, A. Children’s eating behaviour: Comparison between normal and overweight children from a school in Pelotas, Rio Grande do Sul, Brazil. Rev. Paul. Pediatr. 2015, 33, 42–49. [Google Scholar] [CrossRef] [Green Version]
- Sleddens, E.F.; Kremers, S.P.; Thijs, C. The children’s eating behaviour questionnaire: Factorial validity and association with body mass index in Dutch children aged 6–7. Int. J. Behav. Nutr. Phys. Act. 2008, 5, 49. [Google Scholar] [CrossRef] [Green Version]
- Bammann, K.; Peplies, J.; De Henauw, S.; Hunsberger, M.; Molnar, D.; Moreno, L.A.; Tornaritis, M.; Veidebaum, T.; Ahrens, W.; Siani, A.; et al. Early life course risk factors for childhood obesity: The IDEFICS case-control study. PLoS ONE 2014, 9, e86914. [Google Scholar] [CrossRef] [Green Version]
- Dixon, B.; Peña, M.-M.; Taveras, E.M. Lifecourse approach to racial/ethnic disparities in childhood obesity. Adv. Nutr. 2012, 3, 73–82. [Google Scholar] [CrossRef] [Green Version]
- Pillas, D.; Marmot, M.; Naicker, K.; Goldblatt, P.; Morrison, J.; Pikhart, H. Social inequalities in early childhood health and development: A European-wide systematic review. Pediatr. Res. 2014, 76, 418–424. [Google Scholar] [CrossRef] [Green Version]
- Suglia, S.F.; Duarte, C.S.; Chambers, E.C.; Boynton-Jarrett, R. Social and behavioral risk factors for obesity in early childhood. J. Dev. Behav. Pediatr. 2013, 34, 549–556. [Google Scholar] [CrossRef] [PubMed] [Green Version]
- Webber, L.S.; Hill, C.; Saxton, J.M.; Van Jaarsveld, C.H.M.; Wardle, J. Eating behaviour and weight in children. Int. J. Obes. 2008, 33, 21–28. [Google Scholar] [CrossRef] [PubMed] [Green Version]

| CEBQ Subscales | Mean ± SE | Cronbach |
|---|---|---|
| Food Responsiveness (FR) | 1.96 ± 0.07 | 0.815 |
| Enjoyment of Food (EF) | 2.97 ± 0.06 | 0.798 |
| Desire to Drink (DD) | 2.23 ± 0.09 | 0.915 |
| Emotional Overeating (EOE) | 1.20 ± 0.06 | 0.872 |
| Satiety Responsiveness (SR) | 1.73 ± 0.05 | 0.784 |
| Food Fussiness (FF) | 1.73 ± 0.08 | 0.906 |
| Emotional Undereating (EUE) | 1.41 ± 0.07 | 0.796 |
| CEBQ Subscales | FR | EF | DD | EOE | SR | FF | EUE |
|---|---|---|---|---|---|---|---|
| 1. Food responsiveness | 1.000 | ||||||
| 2. Enjoyment of food | 0.418 * | 1.000 | |||||
| 3. Desire to drink | 0.294 * | 0.094 | 1.000 | ||||
| 4. Emotional overeating | 0.530 * | 0.144 | 0.279 * | 1.000 | |||
| 5. Satiety responsiveness | −0.477 * | −0.495 * | −0.045 | −0.130 | 1.000 | ||
| 6. Food fussiness | −0.118 | −0.513 * | 0.078 | 0.009 | 0.378 * | 1.000 | |
| 7. Emotional undereating | 0.007 | −0.251 * | 0.136 | 0.281 * | 0.267 * | 0.273 * | 1.000 |
| OW | p Value | OB | p Value | |
|---|---|---|---|---|
| Food approach | ||||
| Food responsiveness (FR) | −0.186 (0.24) | 0.44 | 0.865 (0.26) | 0.001 |
| Enjoyment of food (EF) | 0.172 (0.26) | 0.51 | 0.633 (0.30) | 0.037 |
| Desire to drink (DD) | −0.511 (0.20) | 0.01 | −0.173 (0.20) | 0.39 |
| Emotional overeating (EOE) | −0.528 (0.29) | 0.07 | 0.568 (0.26) | 0.032 |
| Food avoidance | ||||
| Satiety responsiveness (SR) | −0.303 (0.32) | 0.34 | −1.180 (0.37) | 0.001 |
| Food fussiness (FF) | −0.219 (0.20) | 0.27 | −0.134 (0.21) | 0.53 |
| Emotional undereating (EUE) | −0.037 (0.22) | 0.87 | 0.06 (0.24) | 0.80 |
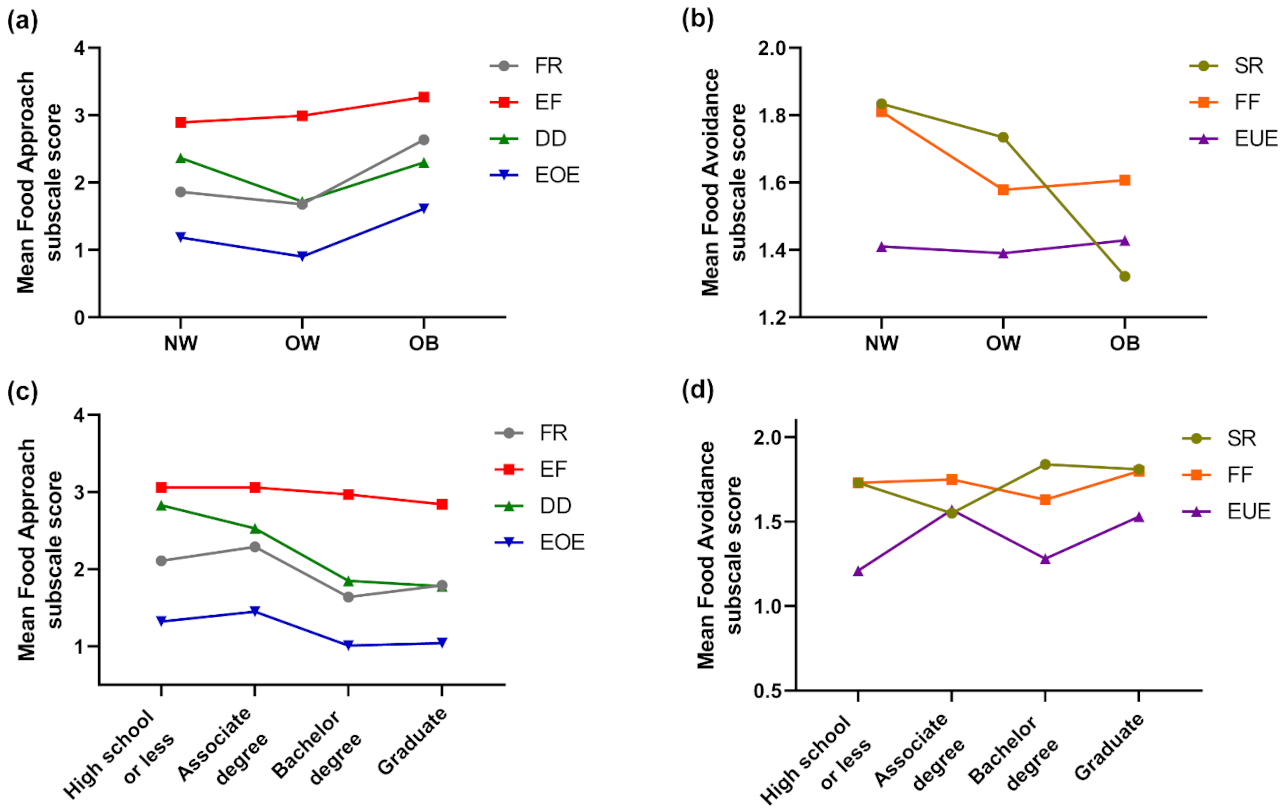
| Food Approach | Food Avoidance | ||||||
|---|---|---|---|---|---|---|---|
| FR | EF | DD | EOE | SR | FF | EUE | |
| Body Mass Index | |||||||
| NW (n = 109) | 1.86(0.08) | 2.89(0.80) | 2.36(0.11) | 1.19(0.08) | 1.83(0.07) | 1.81(0.10) | 1.41(0.09) |
| OW (n = 32) | 1.68(0.16) | 2.99(0.12) | 1.72(0.18) | 0.90(0.13) | 1.73(0.10) | 1.58(0.18) | 1.39(0.17) |
| OB (n = 28) | 2.63(0.20) | 3.27(0.14) | 2.30(0.22) | 1.61(0.18) | 1.32(0.13) | 1.61(0.21) | 1.43(0.17) |
| p-value | 0.001 | 0.086 | 0.021 | 0.003 | 0.002 | 0.435 | 0.988 |
| Maternal Education | |||||||
| High school or less (n = 40) | 2.11(0.16) | 3.06(0.13) | 2.83(0.17) | 1.32(0.17) | 1.73(0.09) | 1.73(0.14) | 1.21(0.13) |
| Associate degree (n = 42) | 2.29(0.14) | 3.06(0.13) | 2.53(0.17) | 1.45(0.13) | 1.55(0.12) | 1.75(0.18) | 1.57(0.14) |
| Bachelor degree (n = 37) | 1.64(0.14) | 2.97(0.12) | 1.85(0.18) | 1.01(0.11) | 1.84(0.11) | 1.63(0.19) | 1.28(0.17) |
| Graduate (n = 50) | 1.79(0.13) | 2.84(0.12) | 1.78(0.15) | 1.04(0.09) | 1.81(0.10) | 1.80(0.14) | 1.53(0.13) |
| p-value | 0.008 | 0.499 | 0.001 | 0.037 | 0.217 | 0.909 | 0.220 |
Publisher’s Note: MDPI stays neutral with regard to jurisdictional claims in published maps and institutional affiliations. |
© 2021 by the authors. Licensee MDPI, Basel, Switzerland. This article is an open access article distributed under the terms and conditions of the Creative Commons Attribution (CC BY) license (http://creativecommons.org/licenses/by/4.0/).
Share and Cite
Ayine, P.; Selvaraju, V.; Venkatapoorna, C.M.K.; Bao, Y.; Gaillard, P.; Geetha, T. Eating Behaviors in Relation to Child Weight Status and Maternal Education. Children 2021, 8, 32. https://0-doi-org.brum.beds.ac.uk/10.3390/children8010032
Ayine P, Selvaraju V, Venkatapoorna CMK, Bao Y, Gaillard P, Geetha T. Eating Behaviors in Relation to Child Weight Status and Maternal Education. Children. 2021; 8(1):32. https://0-doi-org.brum.beds.ac.uk/10.3390/children8010032
Chicago/Turabian StyleAyine, Priscilla, Vaithinathan Selvaraju, Chandra M. K. Venkatapoorna, Yida Bao, Philippe Gaillard, and Thangiah Geetha. 2021. "Eating Behaviors in Relation to Child Weight Status and Maternal Education" Children 8, no. 1: 32. https://0-doi-org.brum.beds.ac.uk/10.3390/children8010032