
Learning Disabilities in Reading and Writing and Type of Delivery in Twin Births

 ,
,
Abstract
:1. Introduction
2. Material and Methods
2.1. Design
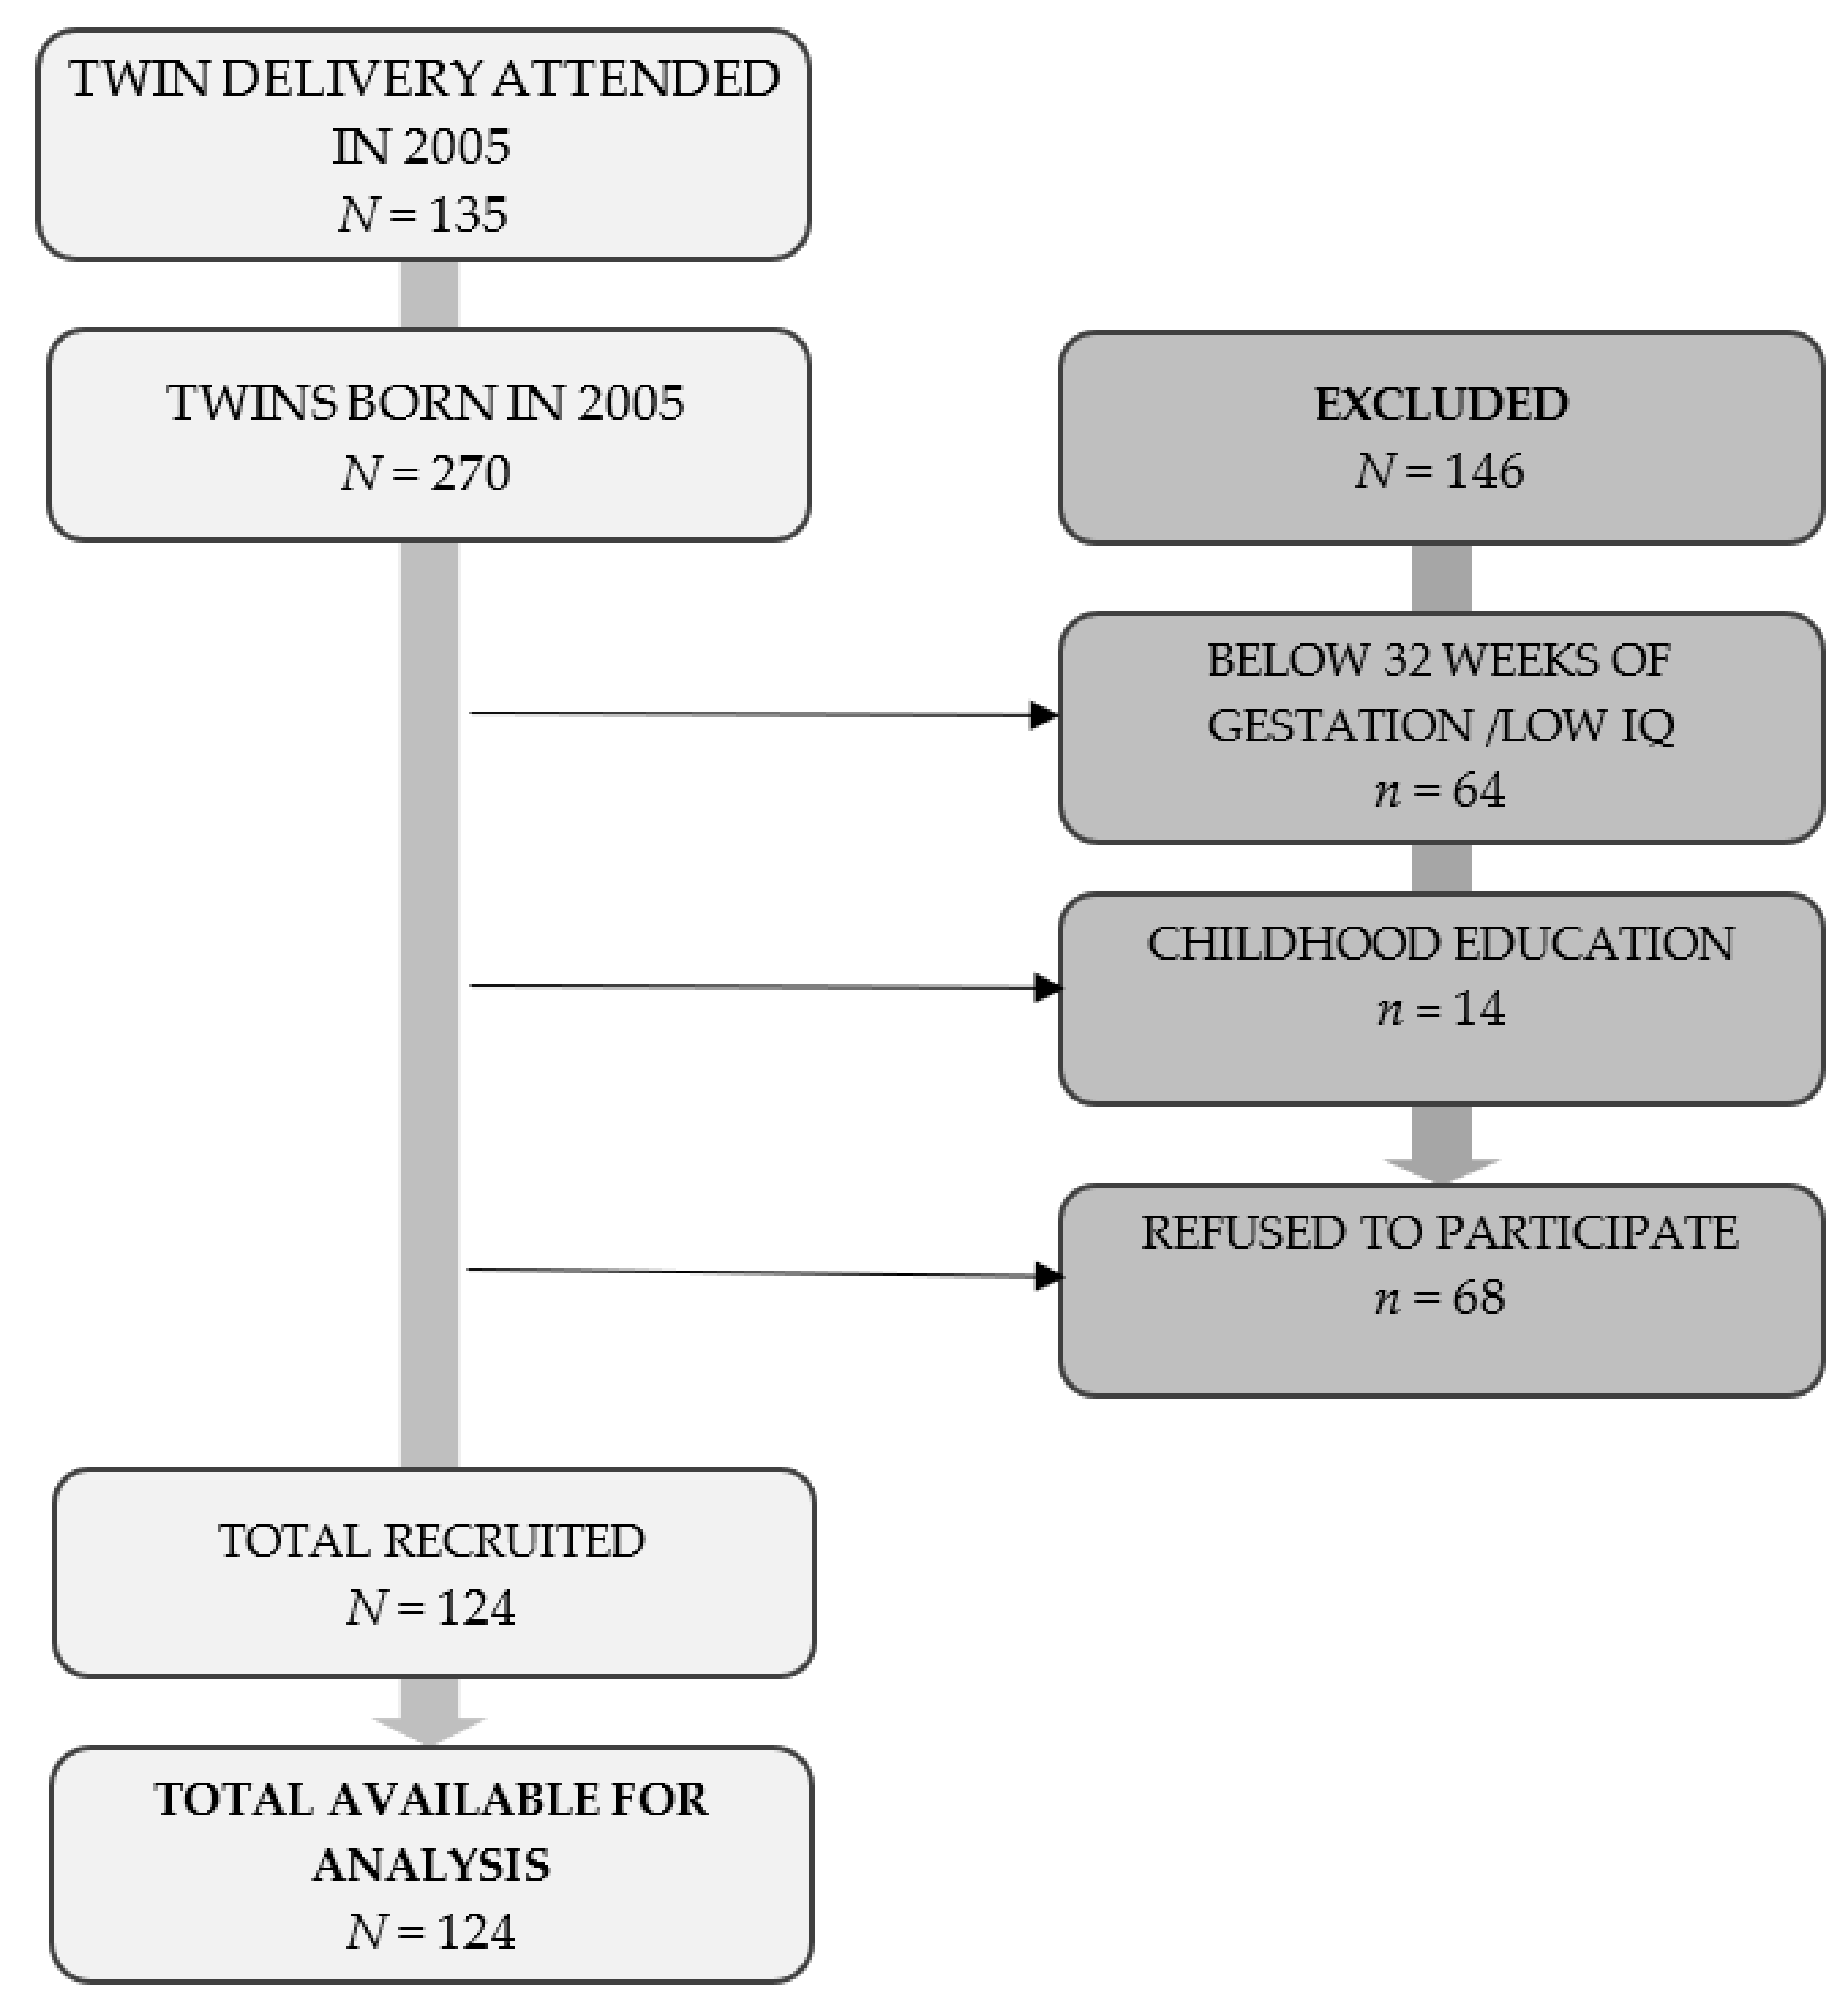
2.2. Participants
2.3. Instruments
2.4. Procedure
2.5. Statistical Analysis
3. Results
4. Discussion
Author Contributions
Funding
Institutional Review Board Statement
Informed Consent Statement
Data Availability Statement
Conflicts of Interest
References
- Allin, A.B.; Fischbein, S. Twins: Are they at risk? A longitudinal study of twins and nontwins from birth to 18 years of age. Acta Genet. Med. Gemellol. 1991, 40, 29–40. [Google Scholar] [CrossRef]
- Carlsson Wallin, M.; Ekström, P.; Marsál, K.; Källé, K. Apgar score and perinatal death after one previous caesarean delivery. BJOG 2010, 117, 1088–1097. [Google Scholar] [CrossRef] [PubMed]
- Hogle, K.L.; Hutton, E.K.; McBrien, K.A.; Barrett, J.F.; Hannah, M.E. Cesarean delivery for twins: A systematic review and meta-analysis. Am. J. Obstet. Gynecol. 2003, 188, 220–227. [Google Scholar] [CrossRef] [PubMed] [Green Version]
- Liston, F.A.; Allen, V.M.; O’Connell, C.M.; Jangaard, K.A. Neonatal outcomes with caesarean delivery at term. Arch. Dis. Child Fetal Neonatal Ed. 2008, 93, 176–182. [Google Scholar] [CrossRef] [Green Version]
- Olusanya, B.O. Perinatal outcomes of multiple births in southwest Nigeria. J. Health Popul. Nutr. 2011, 29, 639–647. [Google Scholar] [PubMed] [Green Version]
- Villar, J.; Carroli, G.; Zavaleta, N.; Donner, A.; Wojdyla, D.; Faundes, A.; Velazco, A.; Bataglia, V.; Langer, A.; Narváez, A.; et al. Maternal and neonatal individual risks and benefits associated with caesarean delivery: Multicentre prospective study. BMJ 2007, 335, 1025. [Google Scholar] [CrossRef] [Green Version]
- American Psychiatric Association (APA). Diagnostic and Statistical Manual of Mental Disorders, 5th ed.; American Psychiatric Publishing: Arlington, VA, USA, 2014. [Google Scholar]
- Becker, N.; Vasconcelos, M.; Oliveira, V.; Santos, F.; Bizarro, L.; Almeida, R.; Salles, J.F.; Carvalho, M. Genetic and environmental risk factors for developmental dyslexia in children: Systematic review of the last decade. Dev. Neuropsychol. 2017, 42, 423–445. [Google Scholar] [CrossRef]
- Ramus, F.; Altarelli, I.; Jednoróg, K.; Zhao, J.; Scotto di Covella, L. Neruoanatomy of developmental dyslexia: Pitfalls and promise. Neurosci. Biobehav. Rev. 2018, 84, 434–452. [Google Scholar] [CrossRef] [PubMed]
- Richlan, F.; Kronbichler, M.; Wimmer, H. Functional abnormalities in the dyslexic brain: A quantitative meta-analysis of neuroimaging studies. Hum. Brain Mapp. 2009, 30, 3299–3308. [Google Scholar] [CrossRef] [PubMed] [Green Version]
- Richlan, F.; Kronbichler, M.; Wimmer, H. Meta-analyzing brain dysfunctions in dyslexic children and adults. Neuroimage 2011, 56, 1735–1742. [Google Scholar] [CrossRef] [PubMed]
- Shaywitz, S.E.; Shaywitz, B.A. Nelson Textbook of Pediatrics, 21st ed.; Kliegman, R.M., Stanton, B.F., Geme, J.W., St., Schor, N.F., Eds.; Saunders Elsevier: Philadelphia, PA, USA, 2020; Volume 1, pp. 267–269. [Google Scholar]
- Fletcher, J.M. Dyslexia: The evolution of a scientific concept. J. Int. Neuropsychol. Soc. 2009, 15, 501–508. [Google Scholar] [CrossRef] [Green Version]
- Peterson, R.L.; Pennington, B.F. Developmental Dyslexia. Annu. Rev. Clin. Psychol. 2015, 11, 283–307. [Google Scholar] [CrossRef] [Green Version]
- Colletti, L.F. Relationship between pregnancy and birth complications and the later development of learning disabilities. J. Learn. Disabil. 1979, 12, 25–29. [Google Scholar] [CrossRef]
- Hill, S.K.; Cawthorne, V.; Dean, R.S. Utilitiy of the Maternal Perinatal Scale (MPS) in distinguishing normal from learning disabled children. Int. J. Neurosci. 1998, 95, 141–154. [Google Scholar] [CrossRef]
- Liu, L.; Wang, J.; Shanshan, S.; Luo, X.; Kong, R.; Zhang, X.; Song, R. Descriptive epidemiology of prenatal and perinatal risk factors in a Chinese population with reading disorder. Sci. Rep. 2016, 6, 36697. [Google Scholar] [CrossRef] [PubMed] [Green Version]
- Xue, J.A. Perinatal Complications as Predictors of Neuropsychological Outcome in Children with Learning Disabilities. Ph.D. Thesis, Ball State University, Muncie, IN, USA, 1996. [Google Scholar]
- Labouesse, M.A.; Langhans, W.; Meyer, U. Long-term pathological consequences of prenatal infection: Beyond brain disorders. Am. J. Physiol. Regul. Integr. Comp. Psysiol. 2015, 309, 1–12. [Google Scholar] [CrossRef]
- Ranasinghe, S.; Or, G.; Wang, E.Y.; Levins, A.; McLean, M.A.; Niell, C.M.; Chau, V. Reduced cortical activity impairs development and plasticity after neonatal hypoxia ischemia. J. Neurosci. 2015, 35, 11946–11959. [Google Scholar] [CrossRef] [PubMed]
- Rosen, M.G.; Debanne, S.M.; Thompson, K.; Dickinson, J.C. Abnormal labor and infant brain damage. Obstet. Gynecol. 1992, 80, 961–965. [Google Scholar] [PubMed]
- Chyi, L.J.; Lee, H.C.; Hintz, S.R.; Gould, J.B.; Sutcliffe, T.L. School outcomes of late preterm infants: Special needs and challenges for infants born at 32 to 36 weeks gestation. J. Pediatr. 2010, 153, 25–31. [Google Scholar] [CrossRef]
- Guarini, A.; Sansavini, A.; Fabbri, C.; Savini, S.; Alessandroni, R.; Faldella, G.; Karmiloff-Smith, A. Long-term effects of preterm birth on language and literacy at eight years. J. Child Lang. 2010, 37, 865–885. [Google Scholar] [CrossRef]
- Hall, A.; McLeod, A.; Counsell, C.; Thomson, L.; Mutch, L. School attainment, cognitive ability and motor function in a total Scottish very-low-birthweight population at eight years: A controlled study. Dev. Med. Child Neurol. 1995, 37, 1037–1050. [Google Scholar] [CrossRef]
- Jansson-Verkasalo, E.; Korpilathi, P.; Jäntti, V.; Valkama, M.; Vainionpää, L.; Alku, P.; Suominen, K.; Näätänen, R. Neurophysiologic correlates of deficit phonological representations and object naming in prematurely born children. Clin. Neurophysiol. 2004, 115, 179–187. [Google Scholar] [CrossRef] [PubMed]
- Johnson, S.; Wolke, D.; Hennessy, E.; Marlow, N. Educational outcomes in extremely preterm children: Neuropsychological correlates and predictors of attainment. Dev. Neuropsychol. 2011, 36, 74–95. [Google Scholar] [CrossRef] [PubMed]
- Kovachy, V.N.; Adams, J.N.; Tamaresis, J.S.; Feldman, H.M. Reading abilities in school-aged preterm children: A review and meta-analysis. Dev. Med. Child Neurol. 2015, 57, 410–419. [Google Scholar] [CrossRef] [PubMed] [Green Version]
- Marlow, N.; Wolke, D.; Bracewell, M.; Samara, M.; EPICure Study Group. Neurologic and developmental disability at six years of age after extremely preterm birth. N. Engl. J. Med. 2005, 352, 9–19. [Google Scholar] [CrossRef] [PubMed]
- Morse, S.B.; Zheng, H.; Tang, Y.; Roth, J. Early school age outcomes of late preterm infants. Pediatrics 2009, 123, 622–629. [Google Scholar] [CrossRef] [Green Version]
- Roberts, G.; Lim, J.; Doyle, L.W.; Anderson, P.J. High rates of school readiness difficulties at 5 years of age in very preterm infants compared with term controls. J. Dev. Behav. Pediatr. 2011, 32, 117–123. [Google Scholar] [CrossRef]
- Wolke, D.; Samara, M.; Bracewell, M.; Marlow, N.; EPICure Study Group. Specific language difficulties and school achievement in children born at 25 weeks of gestation or less. J. Pediatr. 2008, 152, 256–262. [Google Scholar] [CrossRef] [Green Version]
- Holm, A.; Crosbie, S. Literacy skills of children born preterm. Aust. J. Learn. Diffic. 2010, 15, 51–69. [Google Scholar] [CrossRef]
- Russell, R.B.; Petrini, J.R.; Damus, K.; Mattison, D.R.; Schwarz, R.H. The changing epidemiology of multiple births in the United States. Obstetrics Gynecol. 2003, 101, 129–135. [Google Scholar] [CrossRef]
- Cleary-Goldman, J.; Malone, F.D.; Vidaver, J.; Ball, R.H.; Nyberg, D.A.; Comstock, C.H.; Saade, G.R.; Eddleman, K.A.; Klugman, S.; Dugoff, L.; et al. Impact of maternal age on obstetric outcome. Obstet. Gynecol. 2005, 105 Pt 1, 983–990. [Google Scholar] [CrossRef] [PubMed] [Green Version]
- McLennan, A.S.; Gyamfi-Bannerman, C.; Ananth, C.V.; Wright, J.D.; Siddiq, Z.; D’Alton, M.E.; Friedman, A.M. The role of maternal age in twin pregnancy outcomes. Am. J. Obstet. Gynecol. 2017, 217. [Google Scholar] [CrossRef]
- Bogner, G.; Wallner, V.; Fazelnia, C.; Strobl, M.; Volgger, B.; Fischer, T.; Jacobs, V.R. Delivery of the second twin: Influence of presentation on neonatal outcome, a case controlled study. BMC Pregnancy Childbirth 2018, 18, 176. [Google Scholar] [CrossRef] [Green Version]
- Seelbach-Goebel, B. Twin Birth Considering the Current Results of the “Twin Birth Study”. Geburtshilfe Frauenheilkd. 2014, 74, 838–844. [Google Scholar] [CrossRef] [PubMed] [Green Version]
- Barrett, J.F.; Hannah, M.E.; Hutton, E.K.; Willan, A.R.; Allen, A.C.; Armson, B.A.; Gafni, A.; Joseph, K.S.; Mason, D.; Ohlsson, A.; et al. A randomized trial of planned cesarean or vaginal delivery for twin pregnancy. N. Engl. J. Med. 2013, 369, 1295–1305. [Google Scholar] [CrossRef] [PubMed] [Green Version]
- Pasupathy, D.; Smith, G.C. Neonatal outcomes with caesarean delivery al term. Arch. Dis. Child Fetal Neonatal Ed. 2008, 93, 174–175. [Google Scholar] [CrossRef] [Green Version]
- Robbins, L.S.; Blanchard, C.T.; Biasini, F.J.; Powell, M.F.; Casey, B.M.; Tita, A.T.; Harper, L.M. General anesthesia for cesarean delivery and childhood neurodevelopmental and perinatal outcomes: A secondary analysis of a randomized controlled trial. Int. J. Obstet. Anesth. 2020, 45, 34–40. [Google Scholar] [CrossRef]
- González-Mesa, E.; Cazorla-Granados, O.; González-Valenzuela, M.J. The influence of obstetric variables on school achievement, intelligence and neuropsychological development in a sample of Spanish twins at the age of six: A retrospective study. J. Matern. Fetal Neonatal Med. 2016, 29, 1595–1602. [Google Scholar] [CrossRef]
- González-Valenzuela, M.J.; González-Mesa, E.; Cazorla-Granados, O.; López-Montiel, D. Type of Delivery, Neuropsychological Development and Intelligence in Twin Births. Front. Psychol. 2019, 10, 972. [Google Scholar] [CrossRef]
- González-Valenzuela, M.J.; López-Montiel, D.; Cazorla-Granados, O.; González-Mesa, E. Type of delivery and reading, writing, and arithmetic learning in twin births. Dev. Psychobiol. 2019, 64, 484–495. [Google Scholar] [CrossRef]
- Fletcher, J.M.; Coulter, W.A.; Reschly, D.J.; Vaughn, S. Alternative approaches to definition and identification on learning disabilities: Some questions and answers. Ann. Dyslexia. 2004, 54, 304–331. [Google Scholar] [CrossRef] [PubMed] [Green Version]
- García-Vidal, J.; González-Manjón, D.; Ortiz, B.G. Batería Psicopedagógica EVALÚA-1; Psychopedagogical Battery EVALUA-1; EOS: Madrid, Spain, 2011. [Google Scholar]
- González-Valenzuela, M.J.; Martín-Ruiz, I. Effects on Reading of an Early Intervention Program for Spanish Children at Risk of Learning Difficulties. RASE 2017, 38, 67–75. [Google Scholar] [CrossRef]
- Welsch, R.G. Using experimental analysis to determine interventions for reading fluency and recalls of students with learning disabilities. Learn. Disabil. Q. 2007, 30, 115–129. [Google Scholar]
- Kaufman, A.S.; Kaufman, N.L. Test Breve de Inteligencia de Kaufman (K. BIT); TEA Ediciones: Madrid, Spain, 2000. [Google Scholar]
- Cohen, J. Statistical Power Analysis for the Behavioral Sciences, 2nd ed.; Lawrence Erlbaum: Hillsdale, NJ, USA, 1998. [Google Scholar]
- Tomczak, A.; Tomczak, E. The need to report effect size estimates revisited. An overview of some recommended measures of effect size. Trends Sport Sci. 2014, 1, 19–25. [Google Scholar]
- Hosmer, D.W.; Lemeshow, S. Applied Logistic Regression, 2nd ed.; Wiley: New York, NY, USA, 2000. [Google Scholar]
- Kleinbaum, D.G.; Klein, M. Logistic Regression: A Self-Learning Text; Springer: New York, NY, USA, 2001. [Google Scholar]
- Chen, H.; Cohen, P.; Chen, S. How big is a big odds ratio? Interpreting the magnitudes of odds ratios in epidemiological studies. Commun. Stat. Simul. Comput. 2010, 39, 860–864. [Google Scholar] [CrossRef]
- Efron, B.; Tibshirani, R.J. An Introduction to the Bootstrap; Chapman and Hall: New York, NY, USA, 1993. [Google Scholar] [CrossRef] [Green Version]
- Simón-Areces, J.; Dietrich, M.; Hermes, G.; García-Segura, L.; Arévalo, M.; Horvath, T. Ucp2 induced by natural birth regulates neuronal differentiation of the hippocampus and related adult behavior. PloS ONE 2012, e42911. [Google Scholar] [CrossRef] [Green Version]
- Saccone, G.; Berghella, V. Antenatal corticosteroids for maturity of term or near term fetuses: Systematic review and meta-analysis of randomized controlled trials. BMJ 2016, 12, 355. [Google Scholar] [CrossRef] [Green Version]
- El-Khodor, B.F.; Boksa, P. Long-term reciprocal changes in dopamine levels in prefrontal cortex versus nucleus accumbens in rats born by Caesarean section compared to vaginal birth. Exp Neurol. 1997, 145, 118–129. [Google Scholar] [CrossRef]
- Vaillancourt, C.; Boksa, P. Birth insult alters dopamine-mediated behavior in a precocial species, the guinea pig. Implications for schizophrenia. Neuropsychopharmacology 2000, 23, 654–666. [Google Scholar] [CrossRef]
- El-Khodor, B.F.; Boksa, P. Differential vulnerability of male versus female rats to long-term effects of birth insult on brain catecholamine levels. Exp. Neurol. 2003, 182, 208–219. [Google Scholar] [CrossRef] [PubMed]
- Van Handel, M.; Swaab, H.; de Vries, L.S.; Jongmans, M.J. Long-term cognitive and behavioral consequences of neonatal encephalopathy following perinatal asphyxia: A review. Eur. J. Pediatr. 2007, 166, 645–654. [Google Scholar] [CrossRef] [PubMed] [Green Version]
- Hokkanen, L.; Launes, J.; Michelsson, K. Adult neurobehavioral outcome of hyperbilirubinemia in full term neonates-a 30-year prospective follow-up study. PeerJ 2014, 2, e294. [Google Scholar] [CrossRef] [Green Version]
- Cho, K.; Frijters, J.C.; Zhang, H.; Miller, L.L.; Gruen, J.R. Prenatal exposure to nicotine and impaired reading performance. J. Pediatr. 2013, 162, 713–718. [Google Scholar] [CrossRef] [Green Version]
- Mascheretti, S.; Bureau, A.; Battaglia, M.; Simone, D.; Quadrelli, E.; Croteau, J.; Cellino, M.R.; Giorda, R.; Beri, S.; Maziade, M.; et al. An assessment of gene-by-environment interactions in developmental dyslexia-related phenotypes. Genes Brain Behav. 2013, 12, 47–55. [Google Scholar] [CrossRef] [PubMed]


| Variables | N = 124 (Study Sample) | N = 62 (Validation Sample) | ||||
|---|---|---|---|---|---|---|
| n (%) | M (SD) | Range | n (%) | M (SD) | Range | |
| Age (months) | 79.42 (3.44) | 74–86 | 79.42 (3.46) | 74–86 | ||
| Gender | ||||||
| Female | 62 (50) | 34 (50) | ||||
| Male | 62 (50) | 28 (45.2) | ||||
| Mother’s level of education | ||||||
| Low | 51 (41.1) | 25 (40.3) | ||||
| Middle | 38 (30.6) | 19 (30.6) | ||||
| High | 35 (28.2) | 18 (29) | ||||
| Father’s level of education | ||||||
| Low | 58 (46.8) | 29 (46.8) | ||||
| Middle | 40 (32.3) | 20 (32.3) | ||||
| High | 26 (21) | 13 (21) | ||||
| Type of delivery | ||||||
| Vaginal | 84 (67.7) | 42 (67.7) | ||||
| Caesarean | 40 (32.3) | 20 (32.3) | ||||
| Foetal presentation | ||||||
| Cephalic | 80 (64.5%) | 41 (66.1%) | ||||
| Non-cephalic | 44 (35.5%) | 21 (33.9%) | ||||
| Maternal Age (years) | 33.24 (4.29) | 22–45 | 33.24 (4.29) | 22–45 | ||
| Gestational Age (weeks) | 35.14 (2.09) | 32–41 | 35.14 (2.09) | 32–41 | ||
| Weight of Newborn (grams) | 2137.76 (432.79) | 1179–3080 | 2170.90 (433.66) | 1250–3080 | ||
| Apgar 1 | 8.41 (1.18) | 4–10 | 8.36 (1.25) | 5–9 | ||
| Reading Accuracy | 110.18 (27.21) | 25–144 | 107.82 (29.25) | 25–144 | ||
| Phonetic Orthography | 61.60 (12.67) | 11–78 | 60.29 (15.31) | 11–78 | ||
| Visual Orthography | 16.12 (6.26) | 0–28 | 16.23 (6.36) | 0–26 | ||
| Variables | Type of Delivery | |||||||||||||
|---|---|---|---|---|---|---|---|---|---|---|---|---|---|---|
| Vaginal Delivery | Caesarean | |||||||||||||
| N= 124 Study Sample | n= 84 (66.7%) | n = 40 (32.3%) | Statistical Test | |||||||||||
| n(%) | M | SD | Range | MR | n(%) | M | SD | Range | MR | U | Z | p | ES | |
| Reading Accuracy | 114.73 | 25.35 | 26–144 | 69.17 | 100.63 | 28.81 | 25–144 | 48.49 | 1119.50 | −2.99 | 0.003 | 0.26 1 | ||
| Phonetic Orthography | 64.06 | 11.68 | 11–78 | 70.30 | 56.43 | 13.26 | 25–78 | 46.13 | 1025.00 | −3.50 | 0.000 | 0.31 1 | ||
| Visual Orthography | 17.06 | 5.46 | 0–26 | 67.48 | 14.15 | 7.36 | 0–28 | 52.05 | 1262.00 | −2.24 | 0.025 | 0.20 1 | ||
| Maternal Age (years) | 32.71 | 4.03 | 22–40 | 59.21 | 34.35 | 4.42 | 28–45 | 69.40 | 1404.00 | −1.48 | 0.139 | 0.13 1 | ||
| Gestational Age (weeks) | 35.09 | 1.99 | 32–40 | 62.31 | 35.25 | 2.27 | 32–41 | 62.90 | 1664.00 | −0.08 | 0.932 | 0.01 1 | ||
| Apgar 1 | 8.36 | 1.23 | 4–10 | 61.11 | 8.53 | 1.06 | 5–9 | 63.85 | 1586.00 | −0.51 | 0.612 | 0.04 1 | ||
| t | df | |||||||||||||
| Weight of Newborn (grams) | 2154.48 | 445.26 | 1310–3080 | − | 2102.65 | 408.59 | 1179–2905 | − | 0.62 | 122 | 0.535 | 0.12 2 | ||
| Foetal presentation | χ2 | |||||||||||||
| Cephalic | 71 (84.5) | 9 (22.5) | 45.53 | 1 | 0.000 | 0.60 3 | ||||||||
| Non-cephalic | 13 (15.5) | 31 (77.5) | ||||||||||||
| N= 62 Validation Sample | n= 42 (66.7%) | n= 20 (32.3%) | ||||||||||||
| n(%) | M | SD | Range | MR | n(%) | M | SD | Range | MR | U | Z | p | ES | |
| Reading Accuracy | 112.69 | 27.88 | 26–143 | 35.11 | 97.60 | 30.13 | 25–144 | 23.93 | 268.50 | −2.28 | 0.022 | 0.29 1 | ||
| Phonetic Orthography | 64.05 | 14.56 | 11–78 | 36.96 | 52.40 | 14.07 | 25–76 | 20.03 | 190.50. | −3.46 | 0.001 | 0.44 1 | ||
| Visual Orthography | 17.48 | 5.19 | 3–26 | 34.74 | 13.60 | 7.81 | 0–25 | 24.70 | 284.00 | −2.05 | 0.040 | 0.26 1 | ||
| Maternal Age (years) | 32.81 | 3.20 | 22–40 | 30.31 | 34.15 | 4.66 | 28–45 | 34.00 | 370.00 | −0.75 | 0.450 | 0.09 1 | ||
| Gestational Age (weeks) | 35.00 | 2.03 | 32–40 | 30.43 | 35.44 | 2.22 | 32–41 | 33.75 | 375.00 | −0.68 | 0.497 | 0.08 1 | ||
| Apgar 1 | 8.37 | 1.22 | 5–9 | 31.07 | 8.53 | 1.35 | 5–9 | 30.85 | 407.00 | −0.06 | 0.951 | 0.01 1 | ||
| t | df | |||||||||||||
| Weight of Newborn (grams) | 2140.93 | 456.88 | 1310–3080 | − | 2233.85 | 383.65 | 1250–2905 | − | −0.78 | 60 | 0.435 | 0.22 2 | ||
| Foetal presentation | 112.69 | 27.88 | 26–143 | 35.11 | 97.60 | 30.13 | 25–144 | 23.93 | χ2 | |||||
| Cephalic | 37 (88.1) | 4 (20) | 28.05 | 1 | .000 | 0.67 3 | ||||||||
| Non-cephalic | 5 (11.9) | 16 (80) | ||||||||||||
| Variables | Categories | Total N = 124 | Dependent Variable Reading Accuracy | Test 1 | Sig. | ES 2 | OR | 95% CI | ||
|---|---|---|---|---|---|---|---|---|---|---|
| No RAD n = 93 (75%) | RAD n = 31 (25%) | Lower | Upper | |||||||
| Independent Type of delivery | Vaginal Caesarean | 84 (67.7%) 40 (32.3%) | 70 (83.3%) 23 (57.5%) | 14 (16.7%) 17 (42.5%) | 9.64 a | 0.002 | 0.28 | 3.69 | 1.58 | 8.64 |
| Control Maternal age (years) | Under 35 Over 35 | 88 (71%) 36 (29%) | 66 (75%) 27 (75%) | 22 (25%) 9 (25%) | 0.00 a | 0.999 | 0.00 | 1.00 | 0.41 | 2.45 |
| Gestational age of newborn (weeks) | Over 37 Under 37 | 40 (32.3%) 84 (67.7%) | 29 (72.5%) 64 (76.2%) | 11 (27.5%) 20 (23.8%) | 0.19 a | 0.657 | 0.04 | 0.82 | 0.35 | 1.94 |
| Foetal presentation | Cephalic Non-cephalic | 80 (64.5%) 44 (35.5%) | 62 (77.5%) 31 (70.5%) | 18 (22.5%) 13 (29.5%) | 0.75 a | 0.386 | 0.08 | 1.44 | 0.63 | 3.32 |
| Weight of newborn (grams) | Over 1500 Under 1500 | 112 (90.3%) 12 (9.7%) | 83 (74.1%) 10 (83.3%) | 29 (25.9%) 2 (16.7%) | 0.49 b | 0.729 | 0.06 | 0.57 | 0.12 | 2.77 |
| Apgar 1 | Over 7 Under 7 | 99 (79.8%) 25 (20.2%) | 75 (75.8%) 18 (72%) | 24 (24.2%) 7 (28%) | 0.15 a | 0.698 | 0.03 | 1.21 | 0.45 | 3.26 |
| Variables | Categories | Total N = 124 | Dependent Variable Phonetic Orthography | Test 1 | Sig. | ES 2 | OR | 95% CI | ||
|---|---|---|---|---|---|---|---|---|---|---|
| No POD n = 92 (74.2%) | POD n = 32 (25.8%) | Lower | Upper | |||||||
| Independent Type of delivery | Vaginal Caesarean | 84 (67.7%) 40 (32.3%) | 69 (82.1%) 23 (57.5%) | 15 (17.9%) 17 (42.5%) | 8.59 a | 0.003 | 0.26 | 3.40 | 1.47 | 7.87 |
| Control Maternal age (years) | Under 35 Over 35 | 88 (71%) 36 (29%) | 69 (78.4%) 23 (63.9%) | 19 (21.16%) 13 (36.1%) | 2.81 a | 0.093 | 0.15 | 2.05 | 0.88 | 4.79 |
| Gestational age ofnewborn (weeks) | Over 37 Under 37 | 40 (32.3%) 84 (67.7%) | 31 (77.5%) 61 (72.6%) | 9 (22.5%) 23 (27.4%) | 0.33 a | 0.561 | 0.05 | 1.30 | 0.53 | 3.14 |
| Foetal presentation | Cephalic Non-cephalic | 80 (64.5%) 44 (35.5%) | 66 (82.5%) 26 (59.1%) | 14 (17.5%) 18 (40.9%) | 8.12 a | 0.004 | 0.25 | 3.26 | 1.42 | 7.51 |
| Weight of newborn (grams) | Over 1500 Under 1500 | 112 (90.3%) 12 (9.7%) | 82 (73.2%) 10 (83.3%) | 30 (26.8%) 2 (16.7%) | 0.58 b | 0.729 | 0.07 | 0.54 | 0.11 | 2.64 |
| Apgar 1 | Over 7 Under 7 | 99 (79.8%) 25 (20.2%) | 75 (75.8%) 17 (68%) | 24 (24.2%) 8 (32%) | 0.63 a | 0.478 | 0.07 | 1.47 | 0.56 | 3.83 |
| Variables | Categories | Total N = 124 | Dependent Variable Visual orthography | Test 1 | Sig. | ES 2 | OR | 95% CI | ||
|---|---|---|---|---|---|---|---|---|---|---|
| No VOD n = 93 (75%) | VOD n = 31 (25%) | Lower | Upper | |||||||
| Independent Type of delivery | Vaginal Caesarean | 84 (67.7%) 40 (32.3%) | 69 (82.1%) 24 (60%) | 15 (17.9%) 16 (40%) | 7.08a | 0.008 | 0.24 | 3.06 | 1.32 | 7.13 |
| Control Maternal age (years) | Under 35 Over 35 | 88 (71%) 36 (29%) | 67 (76.1%) 26 (72.2%) | 21 (23.9%) 10 (27.8%) | 0.21 a | 0.648 | 0.04 | 1.23 | 0.51 | 2.95 |
| Gestational age of newborn (weeks) | Over 37 Under 37 | 40 (32.3%) 84 (67.7%) | 29 (72.5%) 64 (76.2%) | 11 (27.5%) 20 (23.8%) | 0.19 a | 0.657 | 0.04 | 0.82 | 0.35 | 1.94 |
| Foetal presentation | Cephalic Non-cephalic | 80 (64.5%) 44 (35.5%) | 64 (80%) 29 (65.9%) | 16 (20%) 15 (34.1%) | 3.00 a | 0.083 | 0.15 | 2.07 | 0.90 | 4.74 |
| Weight of newborn (grams) | Over 1500 Under 1500 | 112 (90.3%) 12 (9.7%) | 85 (75.9%) 8 (66.7%) | 27 (24.1%) 4 (33.3%) | 0.49 b | 0.493 | 0.06 | 1.57 | 0.44 | 5.64 |
| Apgar 1 | Over 7 Under 7 | 99 (79.8%) 25 (20.2%) | 77 (77.8%) 16 (64%) | 22 (22.2%) 9 (36%) | 2.00 a | 0.155 | 0.13 | 1.97 | 0.76 | 5.06 |
| N = 124 | Variables | b | SE | Wald χ2 | df | p | OR | 95% CI | |
| Study Sample | Lower | Upper | |||||||
| RAD | Type of delivery (a) | 1.31 | 0.43 | 9.08 | 1 | 0.003 | 3.69 1 | 1.58 | 8.64 |
| Model 1 | Constant | −1.61 | 0.29 | 30.22 | 1 | 0.000 | 0.20 | ||
| * χ2(1, N = 124) = 9.21, p = 0.002; R2 = 0.10; GPC = 75% | |||||||||
| POD | Type of delivery (a) | 1.00 | 0.77 | 1.65 | 1 | 0.198 | 2.72 | 0.59 | 12.56 |
| Model 1 | Foetal presentation (b) | 0.88 | 0.68 | 1.67 | 1 | 0.196 | 2.42 | 0.63 | 9.27 |
| Type of delivery x Foetal presentation | −0.38 | 1.05 | 0.13 | 1 | 0.712 | 0.68 | 0.08 | 5.30 | |
| Constant | −1.69 | 0.33 | 26.75 | 1 | 0.000 | 0.18 | |||
| * χ2(3, N = 124) = 10.20, p = 0.017; χ2(3, N = 124) = 0.00, p = 0.999; R2 = 0.11; GPC = 74.2% | |||||||||
| Model 2 | Type of delivery (a) | 0.79 | 0.53 | 2.19 | 1 | 0.139 | 2.20 | 0.77 | 6.25 |
| Foetal presentation (b) | 0.72 | 0.53 | 1.85 | 1 | 0.173 | 2.05 | 0.73 | 5.81 | |
| Constant | −1.66 | 0.31 | 28.90 | 1 | 0.000 | 0.19 | |||
| * χ2(2, N = 124) = 10.06, p = 0.007; χ2(2, N = 124) = 0.13, p = 0.934; R2 = 0.11; GPC = 74.2% | |||||||||
| Model 3 | Type of delivery (a) | 1.22 | 0.43 | 8.16 | 1 | 0.004 | 3.40 1 | 1.47 | 7.87 |
| Constant | −1.52 | 0.28 | 28.69 | 1 | 0.000 | 0.21 | |||
| * χ2(1, N = 124) = 8.23, p = 0.004; R2 = 0.09; GPC = 74.2% | |||||||||
| VOD | Type of delivery (a) | 1.12 | 0.43 | 6.77 | 1 | 0.009 | 3.06 1 | 1.32 | 7.13 |
| Model 1 | Constant | −1.52 | 0.28 | 28.69 | 1 | 0.000 | 0.21 | ||
| * χ2(1, N = 124) = 6.79, p = 0.009; R2 = 0.08; GPC = 75% | |||||||||
| N= 62 | Variables | b | SE | Waldχ2 | df | p | OR | 95% CI | |
| Validation Sample | Lower | Upper | |||||||
| RAD | Type of delivery (a) | 1.24 | 0.60 | 4.36 | 1 | 0.037 | 3.48 1 | 1.08 | 11.20 |
| Model 1 | Constant | −1.45 | 0.39 | 13.56 | 1 | 0.000 | 0.23 | ||
| * χ2(1, N = 62) = 4.41, p = 0.036; R2 = 0.10; GPC = 72.6% | |||||||||
| POD | Type of delivery (a) | 0.36 | 1.23 | 0.08 | 1 | 0.772 | 1.43 | 0.13 | 15.87 |
| Model 1 | Foetal presentation (b) | 1.05 | 1.00 | 1.09 | 1 | 0.296 | 2.86 | 0.40 | 20.47 |
| Type of delivery x Foetal presentation | 0.30 | 1.61 | 0.03 | 1 | 0.852 | 1.35 | 0.06 | 31.77 | |
| Constant | −1.69 | 0.33 | 26.75 | 1 | 0.000 | 0.18 | |||
| * χ2(3, N = 62) = 7.36, p = 0.006; χ2(3, N = 62) = 0.00, p = 0.999; R2 = 0.16; GPC = 72.6% | |||||||||
| Model 2 | Type of delivery (a) | 0.53 | 0.78 | 0.46 | 1 | 0.498 | 1.70 | 0.37 | 7.85 |
| Foetal presentation (b) | 1.17 | 0.77 | 2.28 | 1 | 0.131 | 3.21 | 0.70 | 14.67 | |
| Constant | −1.47 | 0.41 | 13.15 | 1 | 0.000 | 0.23 | |||
| * χ2(2, N = 62) = 7.32, p = 0.026; χ2(2, N = 62) = 0.03, p = 0.983; R2 = 0.16; GPC = 72.6% | |||||||||
| Model 3 | Type of delivery (a) | 1.30 | 0.58 | 4.94 | 1 | 0.026 | 3.67 1 | 1.17 | 11.52 |
| Constant | −1.30 | 0.37 | 11.94 | 1 | 0.001 | 0.27 | |||
| * χ2(1, N = 62) = 5.04, p = 0.025; R2 = 0.11; GPC = 69.4% | |||||||||
| VOD | Type of delivery (a) | 1.61 | 0.61 | 6.97 | 1 | 0.008 | 5.001 | 1.51 | 16.51 |
| Model 1 | Constant | −1.61 | 0.41 | 15.11 | 1 | 0.000 | 0.20 | ||
| * χ2(1, N = 62) = 7.26, p = 0.007; R2 = 0.16; GPC = 72.6% | |||||||||
Publisher’s Note: MDPI stays neutral with regard to jurisdictional claims in published maps and institutional affiliations. |
© 2021 by the authors. Licensee MDPI, Basel, Switzerland. This article is an open access article distributed under the terms and conditions of the Creative Commons Attribution (CC BY) license (https://creativecommons.org/licenses/by/4.0/).
Share and Cite
González-Valenzuela, M.-J.; López-Montiel, D.; Cazorla-Granados, O.; González-Mesa, E.-S. Learning Disabilities in Reading and Writing and Type of Delivery in Twin Births. Children 2021, 8, 834. https://0-doi-org.brum.beds.ac.uk/10.3390/children8100834
González-Valenzuela M-J, López-Montiel D, Cazorla-Granados O, González-Mesa E-S. Learning Disabilities in Reading and Writing and Type of Delivery in Twin Births. Children. 2021; 8(10):834. https://0-doi-org.brum.beds.ac.uk/10.3390/children8100834
Chicago/Turabian StyleGonzález-Valenzuela, María-José, Dolores López-Montiel, Olga Cazorla-Granados, and Ernesto-Santiago González-Mesa. 2021. "Learning Disabilities in Reading and Writing and Type of Delivery in Twin Births" Children 8, no. 10: 834. https://0-doi-org.brum.beds.ac.uk/10.3390/children8100834