
Understanding Suicide in Our Community through the Lens of the Pediatric ICU: An Epidemiological Review (2011–2017) of One Midwestern City in the US

 , and
, and
Abstract
:1. Introduction
2. Materials and Methods
2.1. Site and Population
2.2. Variables
2.3. Statistical Analyses
3. Results
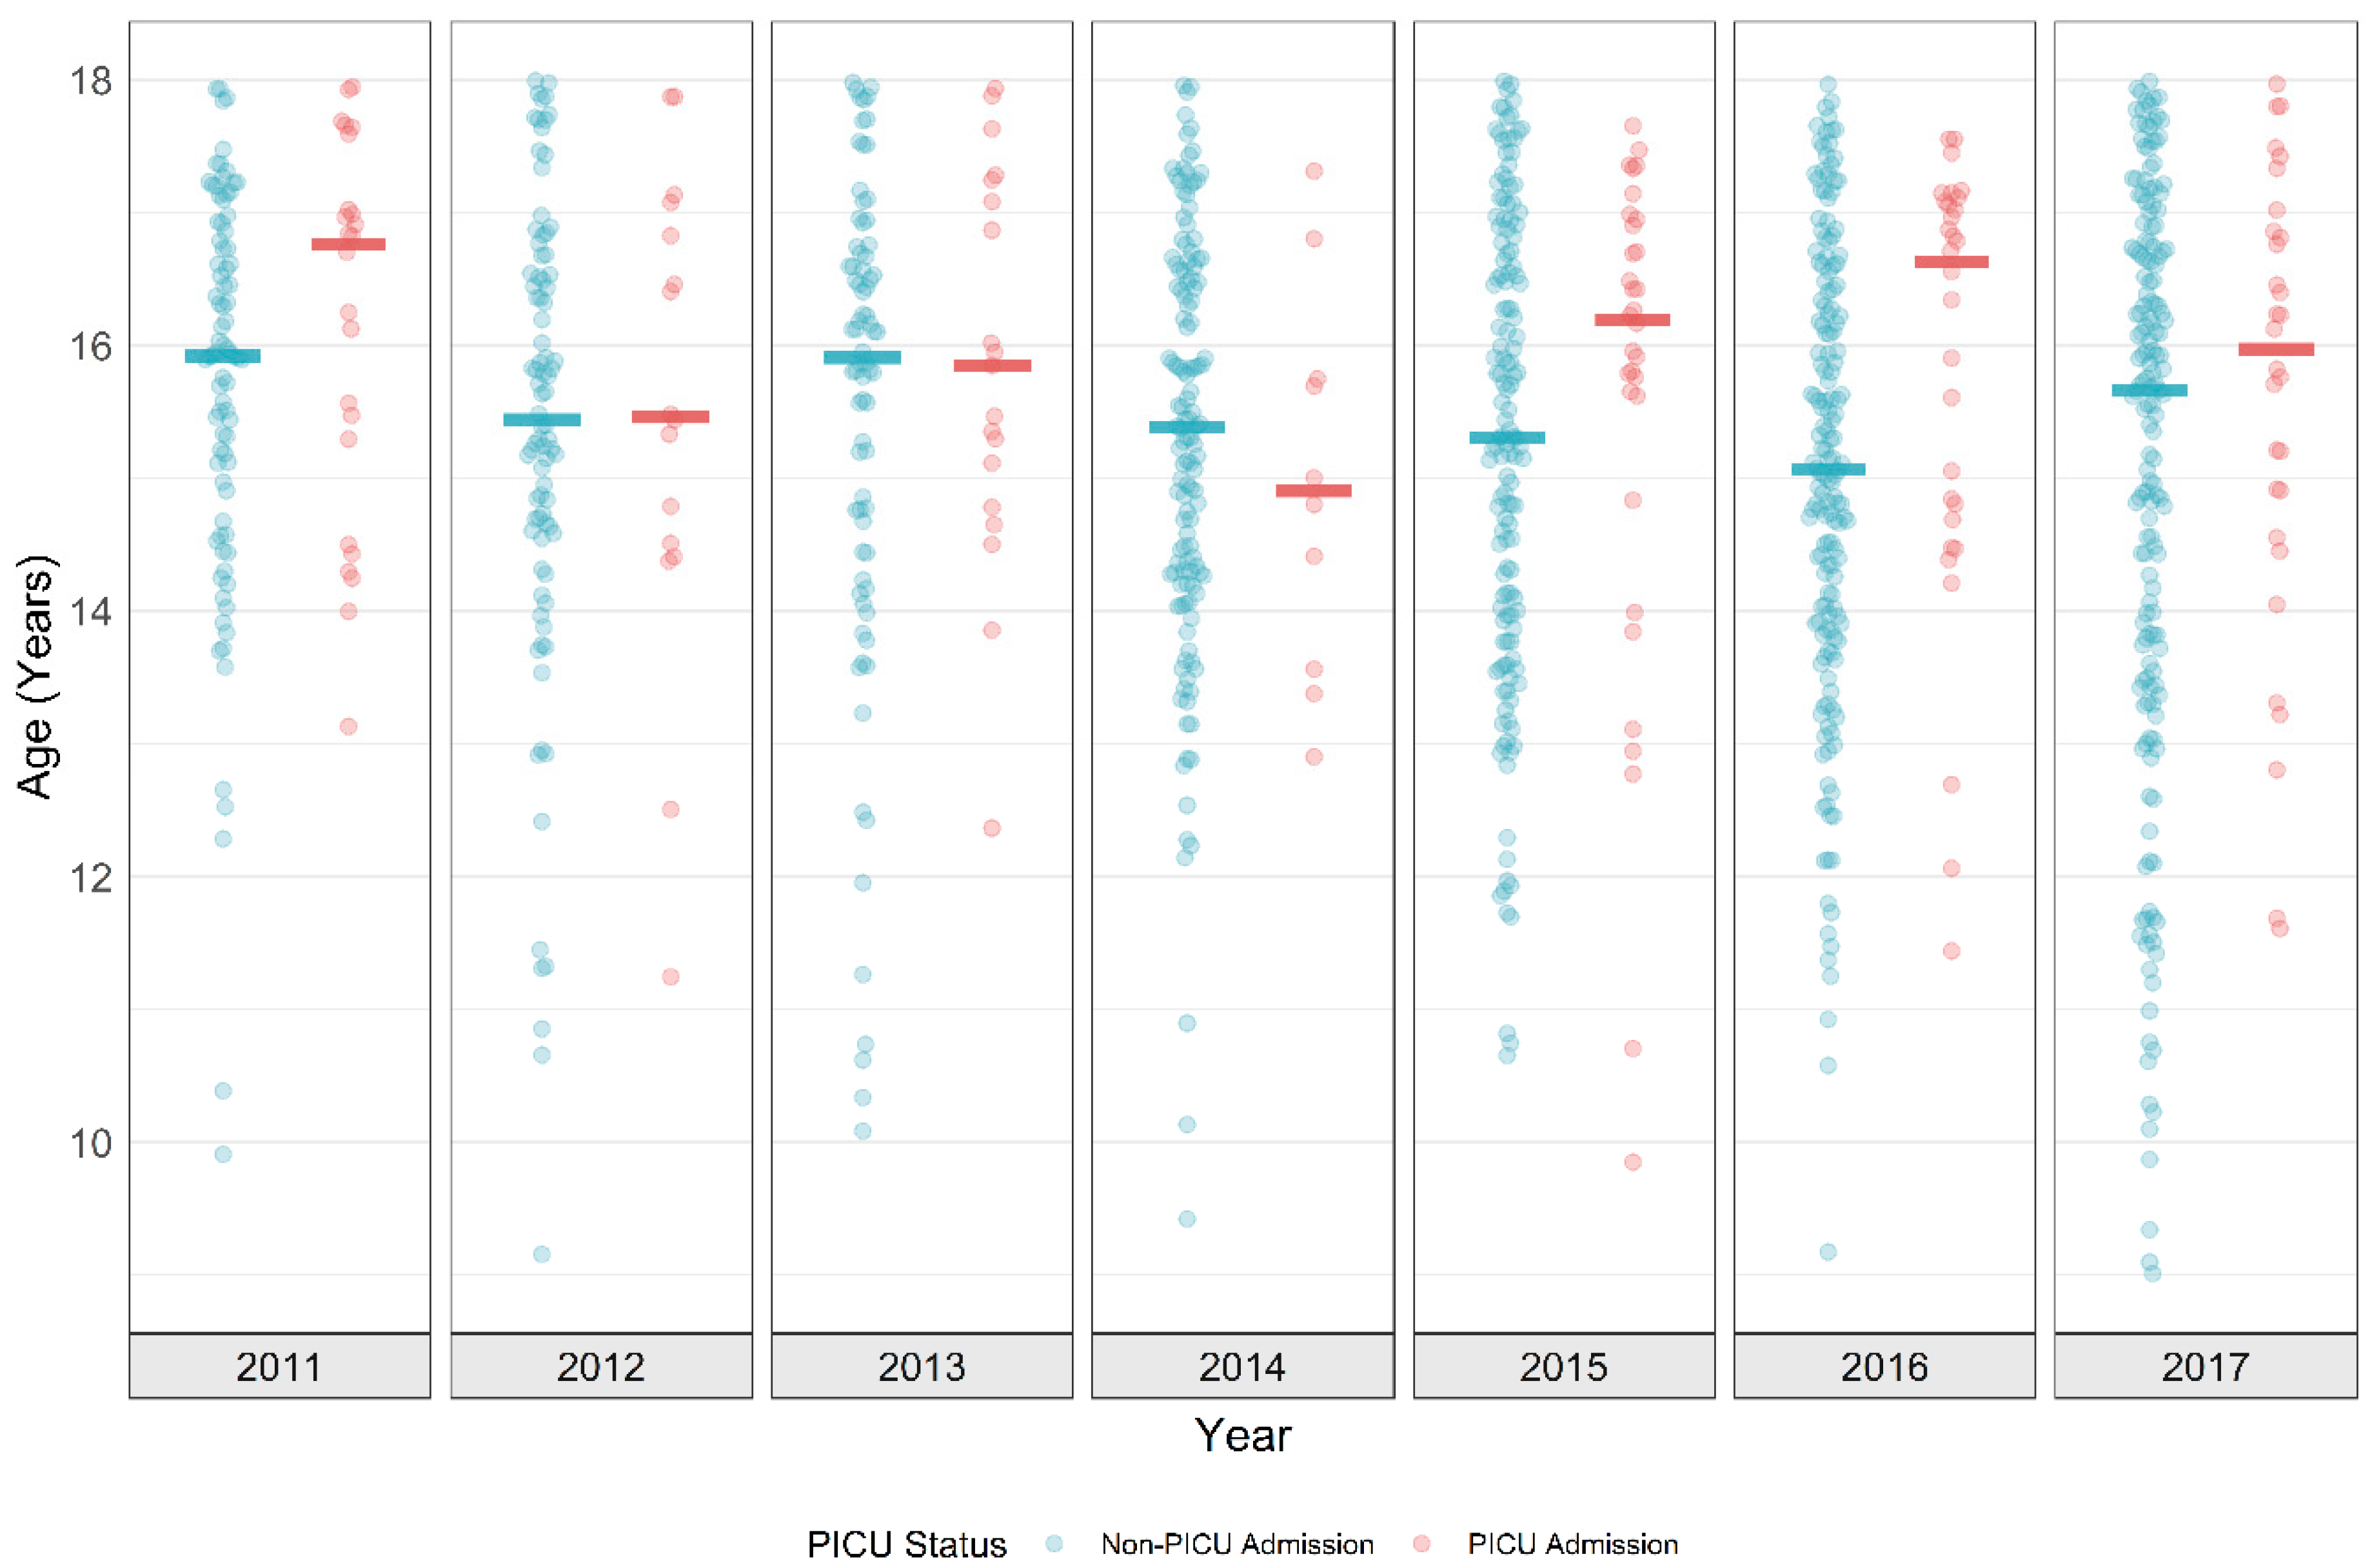
3.1. Demographics
3.2. Logistic Regression
3.3. Temporal Changes and Time-Series Decomposition
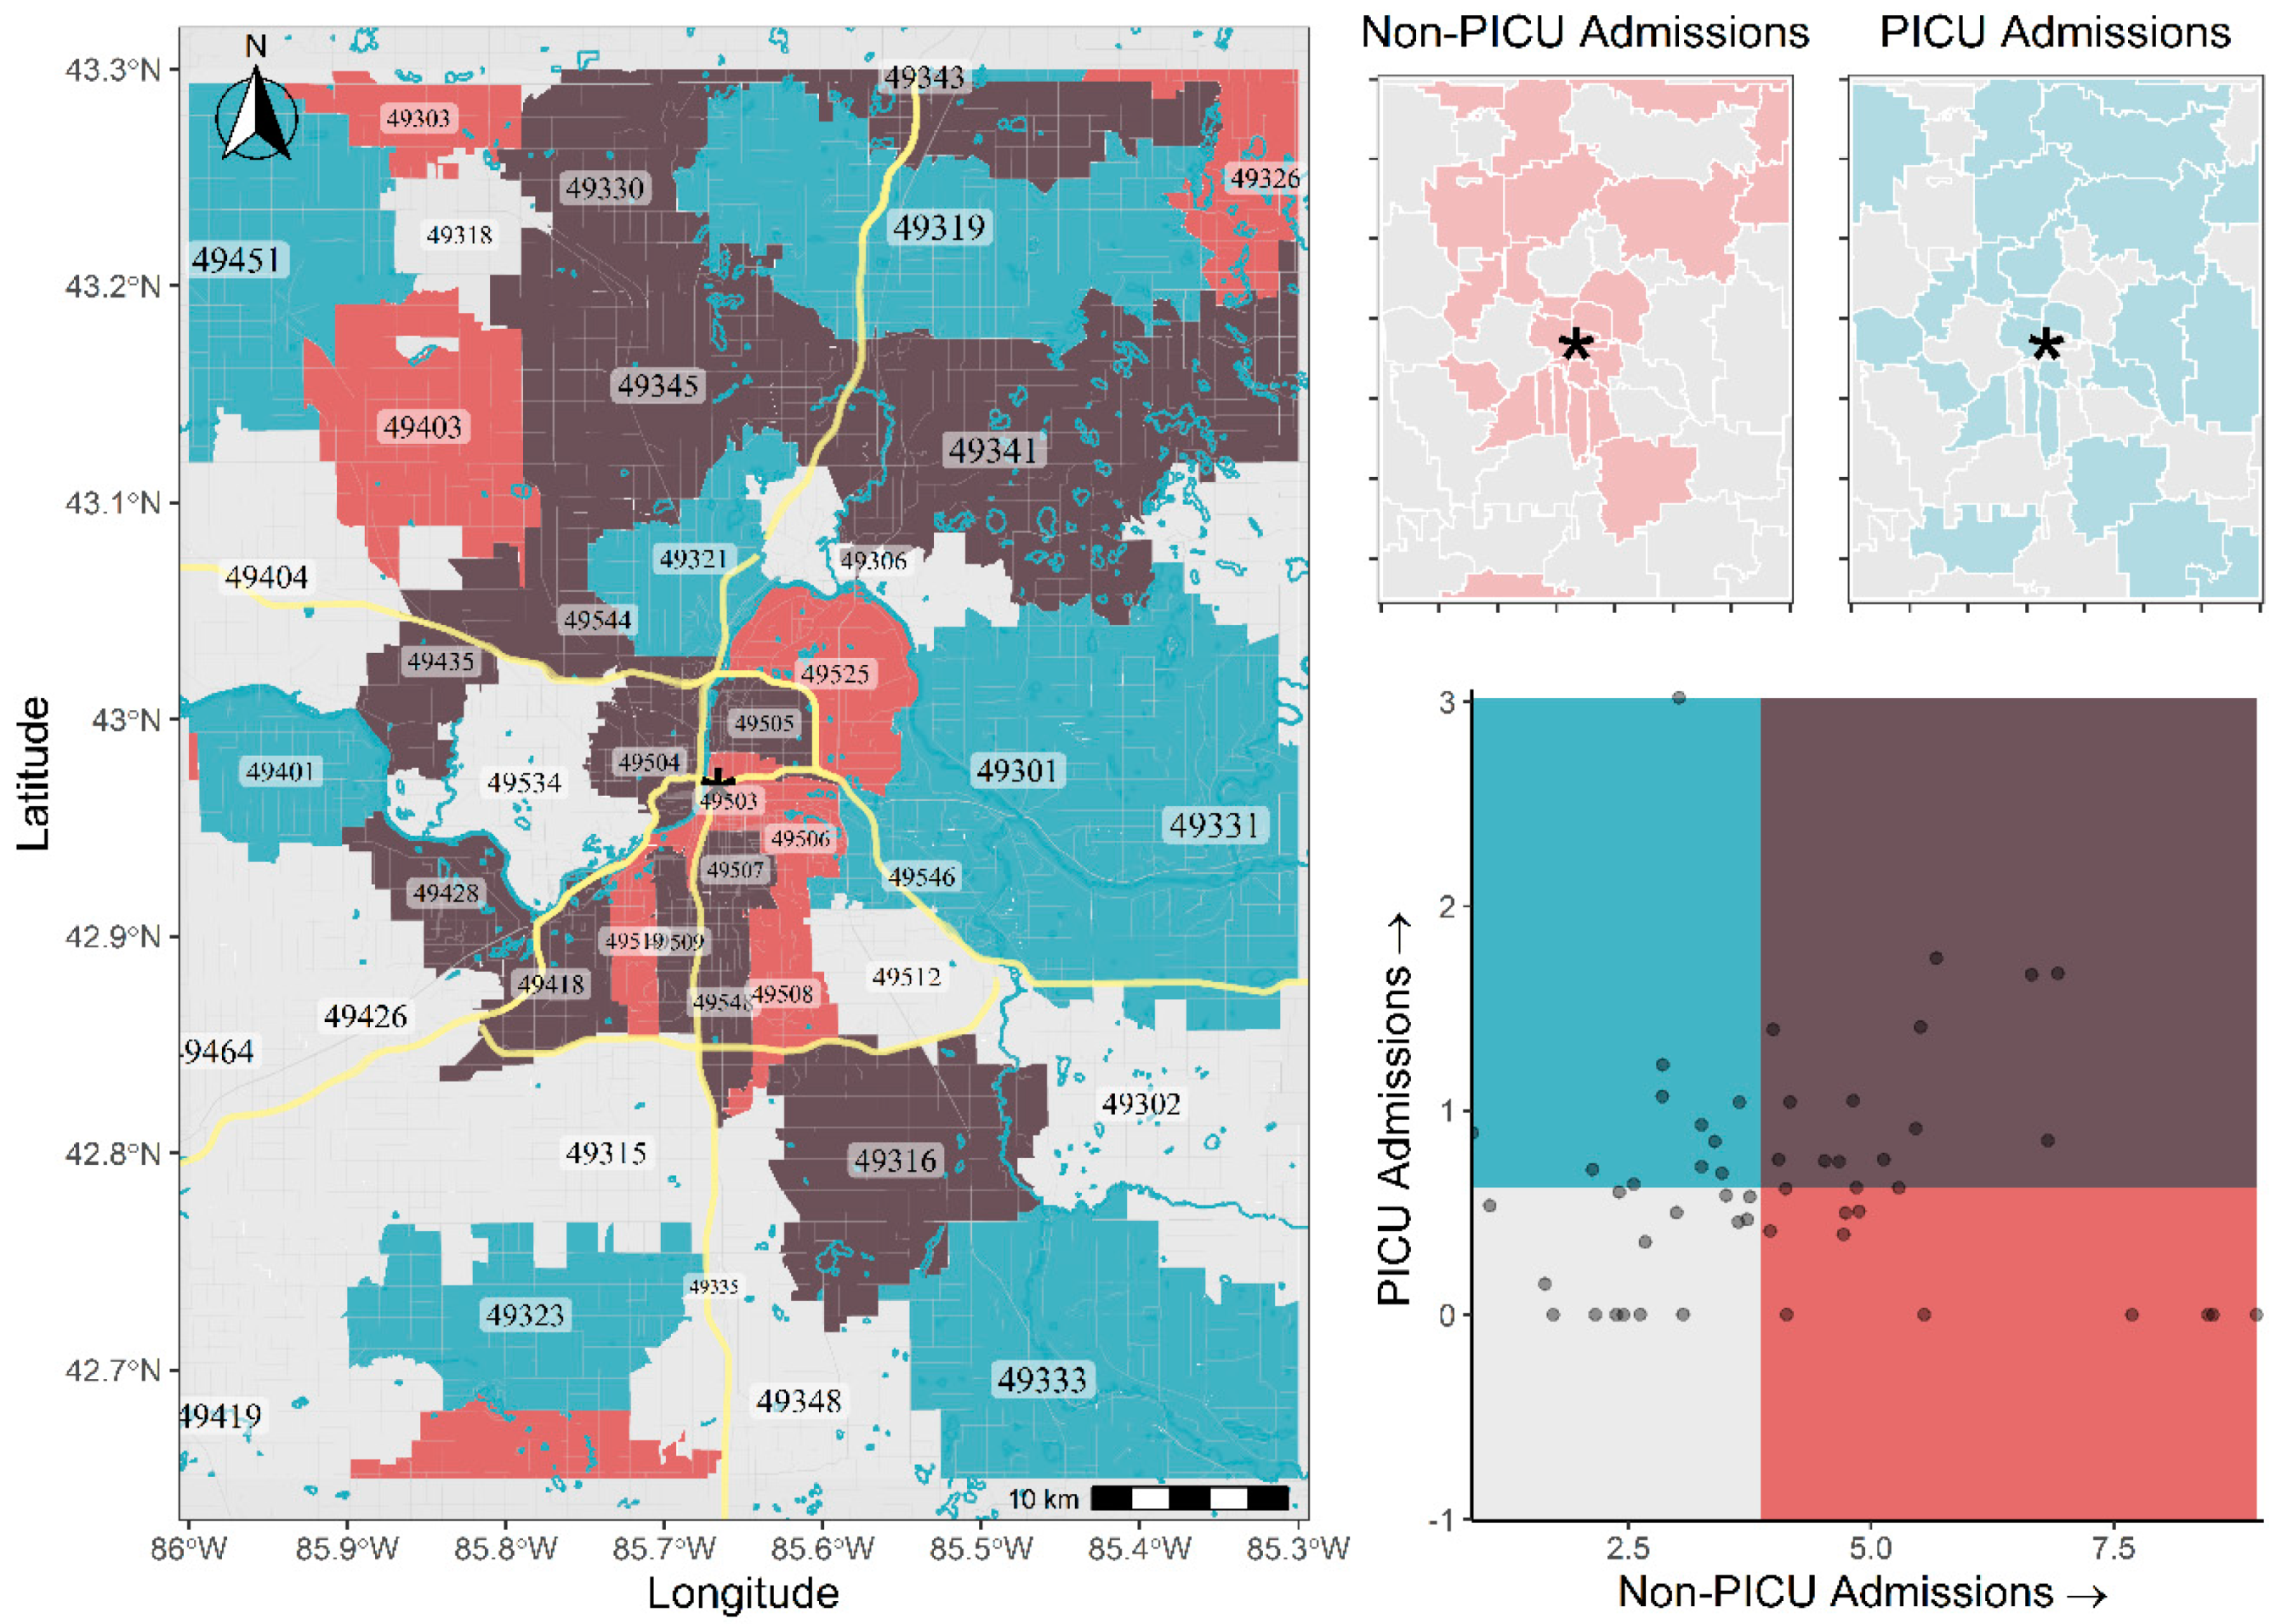
3.4. Spatial Relationships and Patterns
4. Discussion
5. Conclusions
Supplementary Materials
Author Contributions
Funding
Institutional Review Board Statement
Informed Consent Statement
Acknowledgments
Conflicts of Interest
References
- Crosby, A.E.; Ortega, L.; Melanson, C. Self-directed Violence Surveillance: Uniform Definitions and Recommended Data Elements, Version 1.0. Control; Centers for Disease Control and Prevention: Atlanta, GA, USA, 2011.
- Gvion, Y.; Levi-Belz, Y. Serious Suicide Attempts: Systematic Review of Psychological Risk Factors. Front. Psychiatry 2018, 9, 56. [Google Scholar] [CrossRef]
- Kegler, S.R.; Stone, D.M.; Holland, K.M. Trends in Suicide by Level of Urbanization—United States, 1999–2015. MMWR Morb. Mortal. Wkly. Rep. 2017, 66, 270–273. [Google Scholar] [CrossRef]
- Patton, G.C.; Coffey, C.; Sawyer, S.M.; Viner, R.M.; Haller, D.M.; Bose, K.; Vos, T.; Ferguson, J.; Mathers, C.D. Global patterns of mortality in young people: A systematic analysis of population health data. Lancet 2009, 374, 881–892. [Google Scholar] [CrossRef]
- Curtin, S.C.; Warner, M.; Hedegaard, H. Increase in Suicide in the United States, 1999–2014; U.S. National Centers for Health Statistics: Hyattsville, MD, USA, 2016; pp. 1–8.
- Fontanella, C.A.; Hiance-Steelesmith, D.L.; Phillips, G.S.; Bridge, J.A.; Lester, N.; Sweeney, H.A.; Campo, J.V. Widening rural-urban disparities in youth suicides, United States, 1996–2010. JAMA Pediatrics 2015, 169, 466–473. [Google Scholar] [CrossRef] [PubMed]
- Joe, S.; Banks, A.; Belue, R. Suicide risk among urban children. Child. Youth Serv. Rev. 2016, 68, 73–79. [Google Scholar] [CrossRef]
- Woo, J.-M.; Okusaga, O.; Postolache, T.T. Seasonality of suicidal behavior. Int. J. Environ. Res. Public Health 2012, 9, 531–547. [Google Scholar] [CrossRef] [Green Version]
- Pollack, M.M.; Patel, K.M.; Ruttimann, U.E. PRISM III: An updated Pediatric Risk of Mortality score. Crit. Care Med. 1996, 24, 743–752. [Google Scholar] [CrossRef] [PubMed]
- Slater, A.; Shann, F.; Pearson, G. Paediatric Index of Mortality Study, G. PIM2: A revised version of the Paediatric Index of Mortality. Intensive Care Med. 2003, 29, 278–285. [Google Scholar] [CrossRef] [PubMed]
- Venables, W.N.; Ripley, B.D. Modern Applied Statistics with S, 4th ed.; Springer: New York, NY, USA, 2002. [Google Scholar]
- Bureau, U.S.C. American Community Survey, 2016 American Community Survey 5-Year Estimates; Table DP02; HDVCH: Grand Rapids, MI, USA, 2019. [Google Scholar]
- Finalfit: Quickly Create Elegant Regression Tables and Plots when Modelling. Available online: https://cran.r-project.org/web/packages/finalfit/index.html (accessed on 15 July 2020).
- R Core Team. R: A Language and Environment for Statistical Computing; The R Project for Statistical Computing: Vienna, Austria, 2018. [Google Scholar]
- Tigris: Load Census TIGER/Line Shapefiles. Available online: https://cran.r-project.org/web/packages/tigris/index.html (accessed on 15 July 2020).
- Manson, S.; Schroeder, J.; Van Riper, D.; Ruggles, S. IPUMS National Historical Geographic Information System: Version 14.0; IPUMS: Minneapolis, MN, USA, 2019. [Google Scholar] [CrossRef]
- Tools and Palettes for Bivariate Thematic Mapping. Available online: https://cran.r-project.org/web/packages/biscale/index.html (accessed on 15 July 2020).
- Wickham, H. ggplot2: Elegant Graphics for Data Analysis; Springer: New York, NY, USA, 2016. [Google Scholar]
- Lindsey, M.A.; Sheftall, A.H.; Xiao, Y.; Joe, S. Trends of Suicidal Behaviors among High School Students in the United States: 1991–2017. Pediatrics 2019, 144. [Google Scholar] [CrossRef] [Green Version]
- Fang, M. School poverty and the risk of attempted suicide among adolescents. Soc. Psychiatry Psychiatr. Epidemiol. 2018, 53, 955–967. [Google Scholar] [CrossRef]
- Benbenishty, R.; Astor, R.A.; Roziner, I. A School-Based Multilevel Study of Adolescent Suicide Ideation in California High Schools. J. Pediatr. 2018, 196, 251–257. [Google Scholar] [CrossRef]
- Aleck, O.; Stefania, M.; James, T.; James, D.; Ruth, H.; Lisa, C.; Amber, L.; Clyde, H. The impact of fathers’ physical and psychosocial work conditions on attempted and completed suicide among their children. BMC Public Health 2006, 6, 77. [Google Scholar] [CrossRef] [Green Version]
- Bridge, J.A.; Horowitz, L.M.; Fontanella, C.A.; Sheftall, A.H.; Greenhouse, J.; Kelleher, K.J.; Campo, J.V. Age-Related Racial Disparity in Suicide Rates among US Youths from 2001 through 2015. JAMA Pediatr. 2018, 172, 697–699. [Google Scholar] [CrossRef]
- Bjørngaard, J.H.; Carslake, D.; Lund Nilsen, T.I.; Linthorst, A.C.; Davey Smith, G.; Gunnell, D.; Romundstad, P.R. Association of Body Mass Index with Depression, Anxiety and Suicide-An Instrumental Variable Analysis of the HUNT Study. PLoS ONE 2015, 10, e0131708. [Google Scholar] [CrossRef] [Green Version]
- Resident Population Estimates for the 100 Fastest-Growing, U.S. Counties with 10,000 or More Population in 2010: April 1, 2010 to July 1, 2019 (CO-EST2019-CUMGR). U.S. Census Bureau. 2020. Available online: https://www.census.gov/data/tables/time-series/demo/popest/2010s-counties-total.html (accessed on 15 July 2020).
- Cumulative Estimates of Resident Population Change and Rankings for Counties in Michigan: April 1, 2010 to July 1, 2019 (CO-EST2019-CUMCHG-26). U.S. Census Bureau. 2020. Available online: https://www.census.gov/data/tables/time-series/demo/popest/2010s-counties-total.html (accessed on 15 July 2020).
- Meyer, S.; Warnke, I.; Rössler, W.; Held, L. Model-based testing for space–time interaction using point processes: An application to psychiatric hospital admissions in an urban area. Spat. Spatio-Temporal Epidemiol. 2016, 17, 15–25. [Google Scholar] [CrossRef] [Green Version]
- Evans, R.; Hurrell, C. The role of schools in children and young people’s self-harm and suicide: Systematic review and meta-ethnography of qualitative research. BMC Public Health 2016, 16, 401. [Google Scholar] [CrossRef] [Green Version]
- Bostwick, J.M.; Pabbati, C.; Geske, J.R.; McKean, A.J. Suicide Attempt as a Risk Factor for Completed Suicide: Even More Lethal Than We Knew. Am. J. Psychiatry 2016, 173, 1094–1100. [Google Scholar] [CrossRef] [Green Version]
- Luoma, J.B.; Martin, C.E.; Pearson, J.L. Contact with mental health and primary care providers before suicide: A review of the evidence. Am. J. Psychiatry 2002, 159, 909–916. [Google Scholar] [CrossRef]
- Posner, K.; Brown, G.K.; Stanley, B.; Brent, D.A.; Yershova, K.V.; Oquendo, M.A.; Currier, G.W.; Melvin, G.A.; Greenhill, L.; Shen, S.; et al. The Columbia-Suicide Severity Rating Scale: Initial validity and internal consistency findings from three multisite studies with adolescents and adults. Am. J. Psychiatry 2011, 168, 1266–1277. [Google Scholar] [CrossRef] [Green Version]
- Commission, T.J. R3 Report Issue 18: National Patient Safety Goal (NPSG) 15.01.01 for Suicide Prevention. 2019. Available online: https://www.sprc.org/resources-programs/r3-report-issue-18-national-patient-safety-goal-suicide-prevention#:~:text=R3%20Report%20Issue%2018%3A%20National%20Patient%20Safety%20Goal,who%20are%20identified%20as%20high%20risk%20for%20suicide (accessed on 21 July 2020).
- Crosby, A.E.; Han, B.; Ortega, L.A.; Parks, S.E.; Gfroerer, J.; Disease, C. Prevention. Suicidal thoughts and behaviors among adults aged >/=18 years—United States, 2008–2009. MMWR Surveill. Summ. 2011, 60, 1–22. [Google Scholar]
- Sheftall, A.H.; Asti, L.; Horowitz, L.M.; Felts, A.; Fontanella, C.A.; Campo, J.V.; Bridge, J.A. Suicide in Elementary School-Aged Children and Early Adolescents. Pediatrics 2016, 138. [Google Scholar] [CrossRef] [Green Version]
- Na, P.J.; Yaramala, S.R.; Kim, J.A.; Kim, H.; Goes, F.S.; Zandi, P.P.; Vande Voort, J.L.; Sutor, B.; Croarkin, P.; Bobo, W.V. The PHQ-9 Item 9 based screening for suicide risk: A validation study of the Patient Health Questionnaire (PHQ)-9 Item 9 with the Columbia Suicide Severity Rating Scale (C-SSRS). J. Affect. Disord. 2018, 232, 34–40. [Google Scholar] [CrossRef] [PubMed]
- Gilbody, S.; Richards, D.; Brealey, S.; Hewitt, C. Screening for depression in medical settings with the Patient Health Questionnaire (PHQ): A diagnostic meta-analysis. J. Gen. Intern. Med. 2007, 22, 1596–1602. [Google Scholar] [CrossRef] [Green Version]


| Variable | Levels | Missing N | No PICU | PICU | Total | p |
|---|---|---|---|---|---|---|
| Total N (%) | 875 (84.5) | 161 (15.5) | 1036 | |||
| Age | Median (IQR) | 0 | 15.5 (2.6) | 16.0 (2.4) | 15.6 (2.5) | 0.001 |
| Gender | Female | 0 | 600 (68.6) | 103 (64.0) | 703 (67.9) | 0.271 |
| Male | 275 (31.4) | 58 (36.0) | 333 (32.1) | |||
| Race | White | 0 | 609 (69.6) | 134 (83.2) | 743 (71.7) | 0.002 |
| Black | 90 (10.3) | 10 (6.2) | 100 (9.7) | |||
| Hispanic | 86 (9.8) | 5 (3.1) | 91 (8.8) | |||
| Other | 90 (10.3) | 12 (7.5) | 102 (9.8) | |||
| BMI | Median (IQR) | 116 | 23.0 (8.0) | 22.0 (5.0) | 23.0 (7.3) | 0.006 |
| ED Admission | Non-ED | 0 | 435 (49.7) | 68 (42.2) | 503 (48.6) | 0.086 |
| ED | 440 (50.3) | 93 (57.8) | 533 (51.4) | |||
| Discharge Disp. | Home | 0 | 320 (36.6) | 31 (19.3) | 351 (33.9) | <0.001 |
| Psychiatric/Rehab | 533 (60.9) | 121 (75.2) | 654 (63.1) | |||
| Expired | 4 (0.5) | 3 (1.9) | 7 (0.7) | |||
| Other | 18 (2.1) | 6 (3.7) | 24 (2.3) | |||
| LOS (days) | Median (IQR) | 0 | 1.6 (1.5) | 1.9 (1.7) | 1.6 (1.6) | <0.001 |
| Insurance Type | Unknown | 0 | 16 (1.8) | 1 (0.6) | 17 (1.6) | 0.681 |
| Commercial | 781 (89.3) | 145 (90.1) | 926 (89.4) | |||
| Government | 78 (8.9) | 15 (9.3) | 93 (9.0) | |||
| Suicide Category | Ingestion | 0 | 580 (66.3) | 106 (65.8) | 686 (66.2) | 0.745 |
| Hanging/Strangulation | 7 (0.8) | 3 (1.9) | 10 (1.0) | |||
| Suicidal Ideation | 95 (10.9) | 17 (10.6) | 112 (10.8) | |||
| Other/Self Harm | 28 (3.2) | 4 (2.5) | 32 (3.1) | |||
| Self-Harm not Apparent | 165 (18.9) | 31 (19.3) | 196 (18.9) | |||
| Hospital Death | Survived | 0 | 871 (99.5) | 158 (98.1) | 1029 (99.3) | 0.080 |
| Expired | 4 (0.5) | 3 (1.9) | 7 (0.7) | |||
| Death | Survived | 0 | 867 (99.1) | 156 (96.9) | 1023 (98.7) | 0.038 |
| Expired | 8 (0.9) | 5 (3.1) | 13 (1.3) | |||
| Weekday/Weekend | Weekday | 0 | 662 (75.7) | 124 (77.0) | 786 (75.9) | 0.764 |
| Weekend | 213 (24.3) | 37 (23.0) | 250 (24.1) | |||
| School Session | School Year | 0 | 674 (77.0) | 112 (69.6) | 786 (75.9) | 0.045 |
| Summer Vacation | 201 (23.0) | 49 (30.4) | 250 (24.1) | |||
| Time of Day | Night Hours | 0 | 645 (73.7) | 106 (65.8) | 751 (72.5) | 0.044 |
| Office Hours | 230 (26.3) | 55 (34.2) | 285 (27.5) | |||
| Median Income | Median (IQR) | 56 (%) | 49,428.0 (18,162.0) | 50,232.0 (20,163.2) | 49,428.0 (18,160.0) | 0.097 |
| Dependent: PICU Admission | No PICU | PICU | OR (Univariable) | OR (Multivariable) | |
|---|---|---|---|---|---|
| Age | Mean (SD) | 15.2 (1.8) | 15.7 (1.7) | 1.17 (1.06–1.30, p = 0.003) | 1.20 (1.08–1.35, p = 0.001) |
| Gender | Female | 600 (85.3) | 103 (14.7) | - | - |
| Male | 275 (82.6) | 58 (17.4) | 1.23 (0.86–1.74, p = 0.252) | - | |
| Race | White | 609 (82.0) | 134 (18.0) | - | - |
| Black | 90 (90.0) | 10 (10.0) | 0.50 (0.24–0.95, p = 0.049) | 0.53 (0.24–1.05, p = 0.091) | |
| Hispanic | 86 (94.5) | 5 (5.5) | 0.26 (0.09–0.60, p = 0.005) | 0.19 (0.05–0.51, p = 0.005) | |
| Other | 90 (88.2) | 12 (11.8) | 0.61 (0.31–1.10, p = 0.120) | 0.62 (0.30–1.17, p = 0.166) | |
| BMI | Mean (SD) | 24.7 (6.3) | 23.1 (5.4) | 0.95 (0.92–0.98, p = 0.004) | 0.95 (0.92–0.98, p = 0.004) |
| Insurance Type | Unknown | 16 (94.1) | 1 (5.9) | - | - |
| Commercial | 781 (84.3) | 145 (15.7) | 2.97 (0.60–53.82, p = 0.293) | - | |
| Government | 78 (83.9) | 15 (16.1) | 3.08 (0.56–57.59, p = 0.293) | - | |
| Suicide Category | Ingestion | 580 (84.5) | 106 (15.5) | - | - |
| Hanging/Strangulation | 7 (70.0) | 3 (30.0) | 2.35 (0.50–8.58, p = 0.222) | - | |
| Suicidal Ideation | 95 (84.8) | 17 (15.2) | 0.98 (0.55–1.67, p = 0.941) | - | |
| Other/Self Harm | 28 (87.5) | 4 (12.5) | 0.78 (0.23–2.04, p = 0.651) | - | |
| Self-Harm not Apparent | 165 (84.2) | 31 (15.8) | 1.03 (0.66–1.57, p = 0.901) | - | |
| Weekday/Weekend | Weekday | 662 (84.2) | 124 (15.8) | - | - |
| Weekend | 213 (85.2) | 37 (14.8) | 0.93 (0.62–1.37, p = 0.711) | - | |
| School Session | School Year | 674 (85.8) | 112 (14.2) | - | - |
| Summer Vacation | 201 (80.4) | 49 (19.6) | 1.47 (1.01–2.12, p = 0.043) | - | |
| Season | High Season | 276 (80.0) | 69 (20.0) | - | - |
| Low Season | 599 (86.7) | 92 (13.3) | 0.61 (0.44–0.87, p = 0.005) | 0.62 (0.43–0.91, p = 0.013) | |
| Time of Day | Night Hours | 645 (85.9) | 106 (14.1) | - | - |
| Office Hours | 230 (80.7) | 55 (19.3) | 1.46 (1.01–2.08, p = 0.040) | 1.41 (0.94–2.07, p = 0.088) | |
| Median Income | Mean (SD) | 51,669.2 (13,855.4) | 54,187.8 (16,094.6) | 1.00 (1.00–1.00, p = 0.044) | - |
Publisher’s Note: MDPI stays neutral with regard to jurisdictional claims in published maps and institutional affiliations. |
© 2021 by the authors. Licensee MDPI, Basel, Switzerland. This article is an open access article distributed under the terms and conditions of the Creative Commons Attribution (CC BY) license (http://creativecommons.org/licenses/by/4.0/).
Share and Cite
Kampfschulte, A.; Oram, M.; Escobar Vasco, A.M.; Essenmacher, B.; Herbig, A.; Behere, A.; Leimanis-Laurens, M.L.; Rajasekaran, S. Understanding Suicide in Our Community through the Lens of the Pediatric ICU: An Epidemiological Review (2011–2017) of One Midwestern City in the US. Children 2021, 8, 59. https://0-doi-org.brum.beds.ac.uk/10.3390/children8020059
Kampfschulte A, Oram M, Escobar Vasco AM, Essenmacher B, Herbig A, Behere A, Leimanis-Laurens ML, Rajasekaran S. Understanding Suicide in Our Community through the Lens of the Pediatric ICU: An Epidemiological Review (2011–2017) of One Midwestern City in the US. Children. 2021; 8(2):59. https://0-doi-org.brum.beds.ac.uk/10.3390/children8020059
Chicago/Turabian StyleKampfschulte, Andrew, Matthew Oram, Alejandra M. Escobar Vasco, Brittany Essenmacher, Amy Herbig, Aniruddh Behere, Mara L. Leimanis-Laurens, and Surender Rajasekaran. 2021. "Understanding Suicide in Our Community through the Lens of the Pediatric ICU: An Epidemiological Review (2011–2017) of One Midwestern City in the US" Children 8, no. 2: 59. https://0-doi-org.brum.beds.ac.uk/10.3390/children8020059