
Newborn Screening and Treatment of Phenylketonuria: Projected Health Outcomes and Cost-Effectiveness

Abstract
:
1. Introduction
2. Materials and Methods
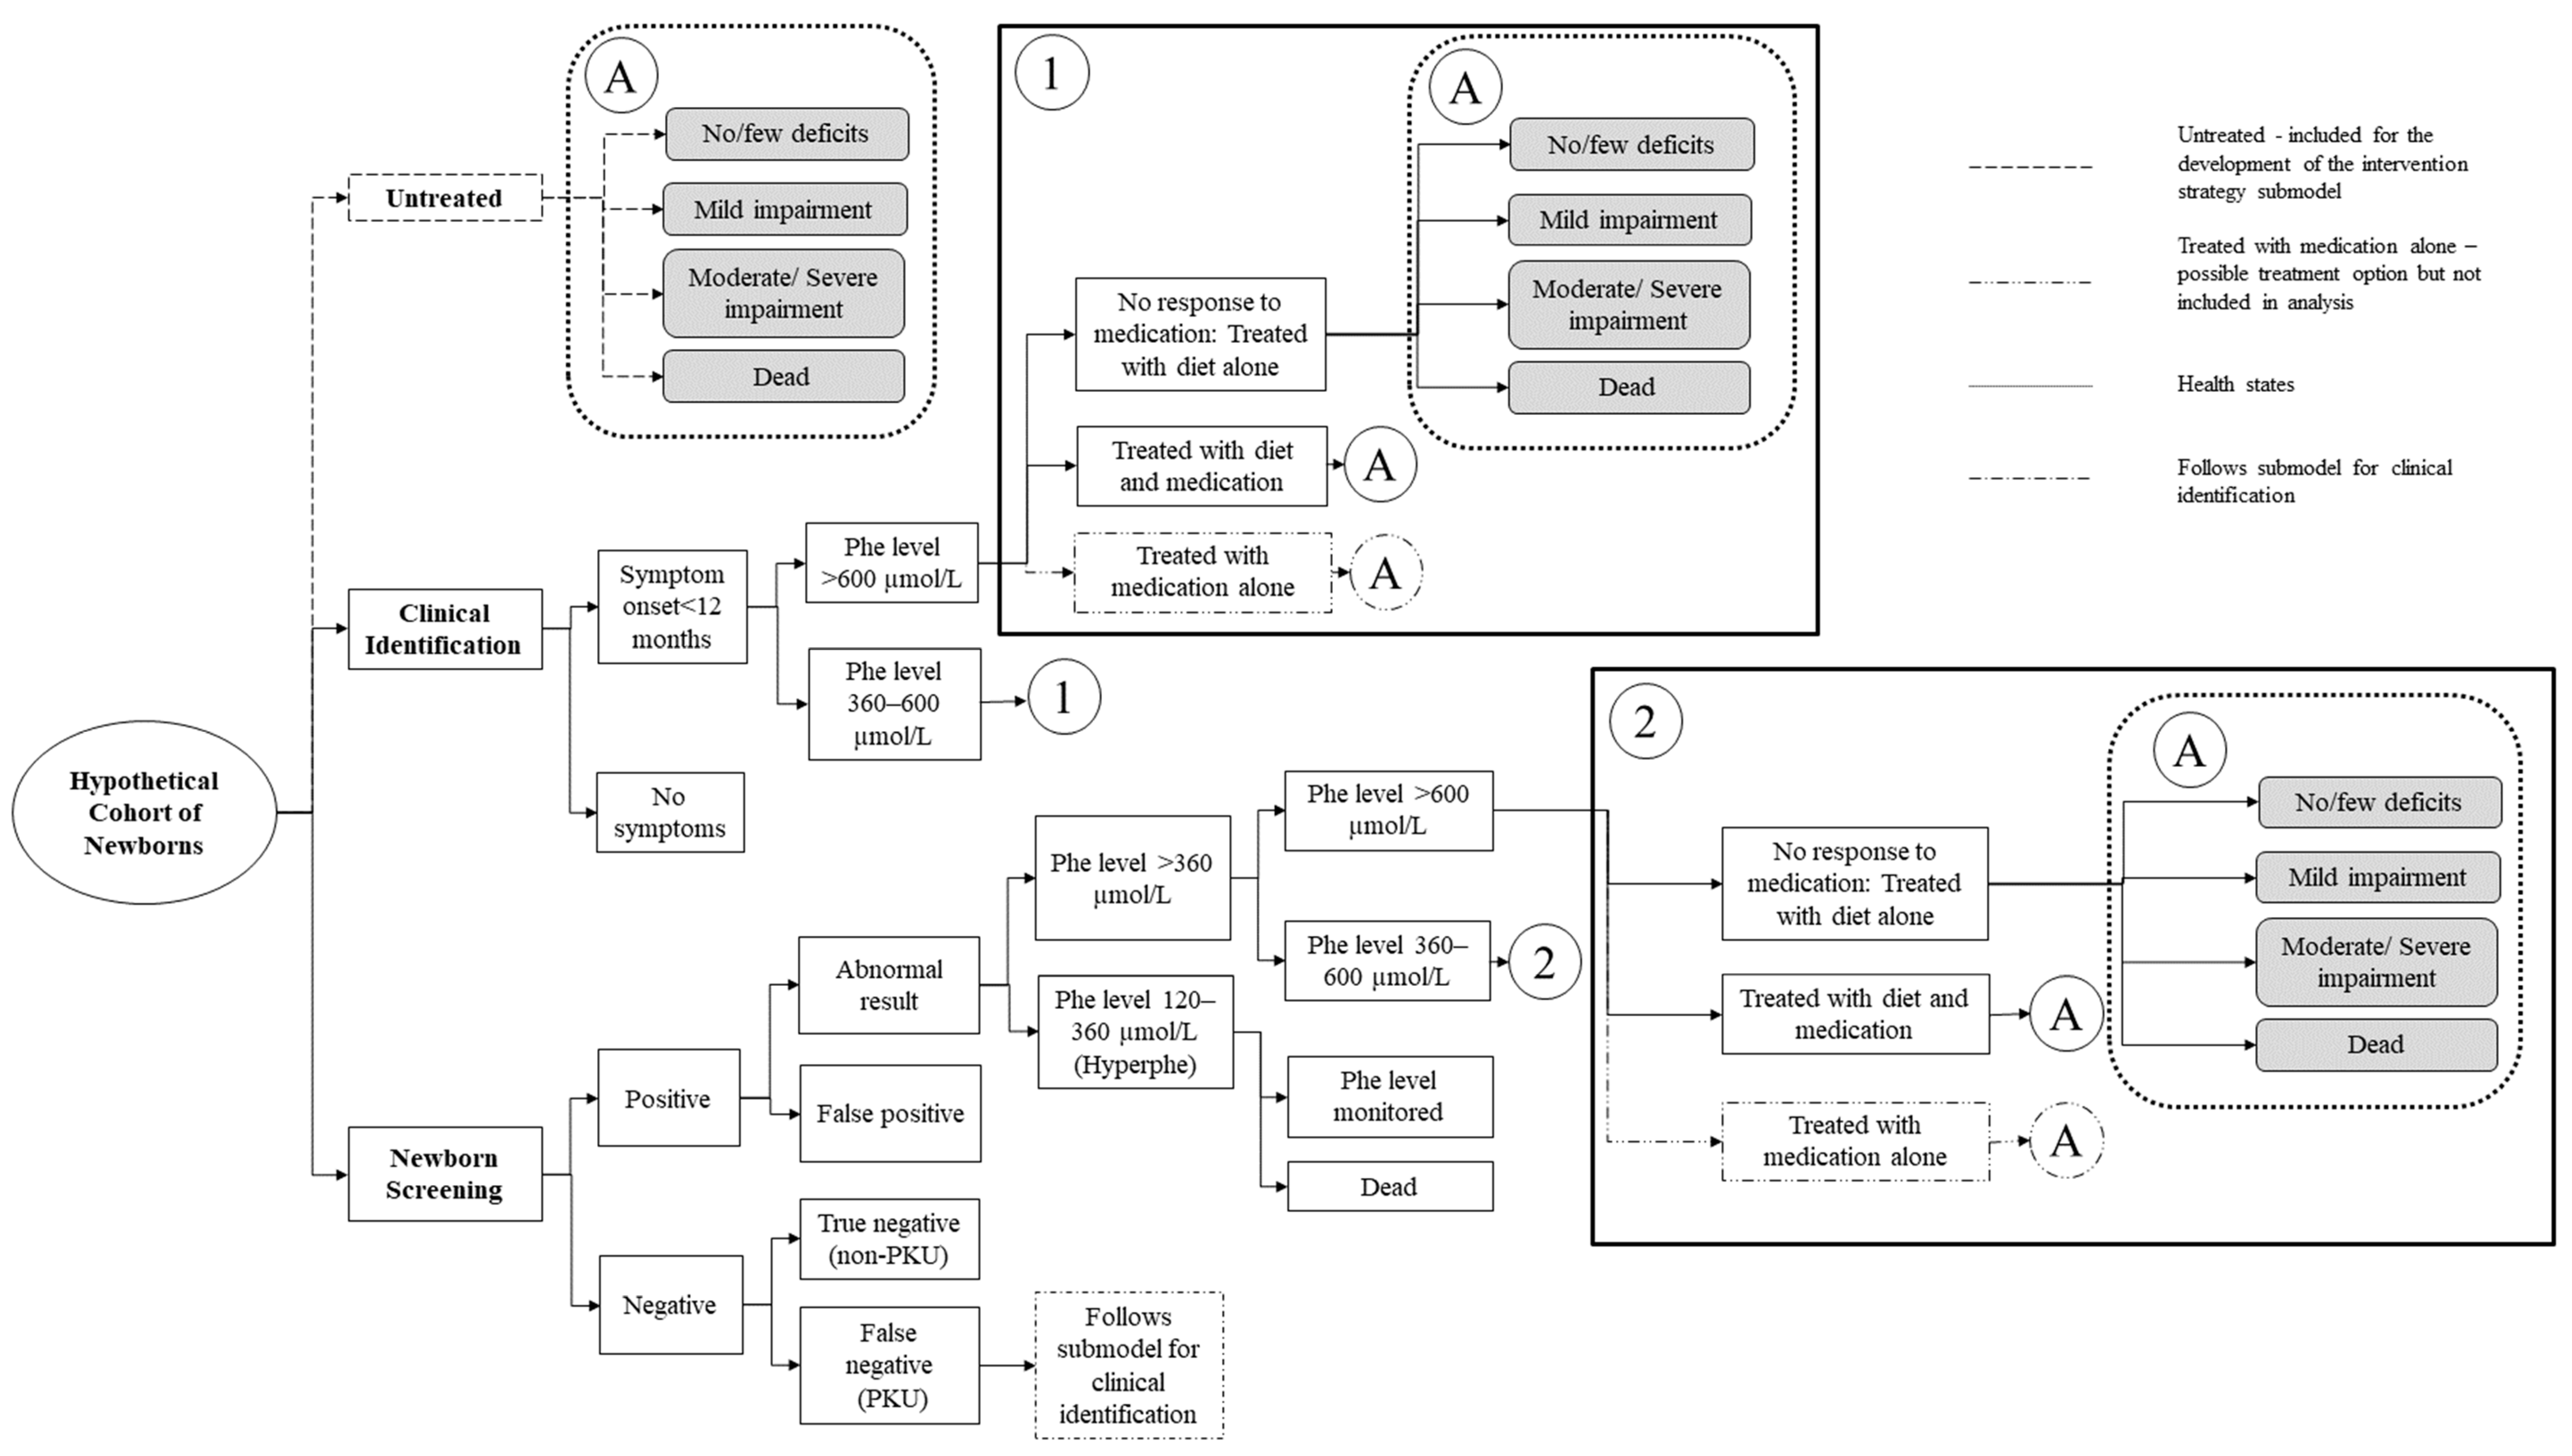
2.1. Model Structure and Assumptions
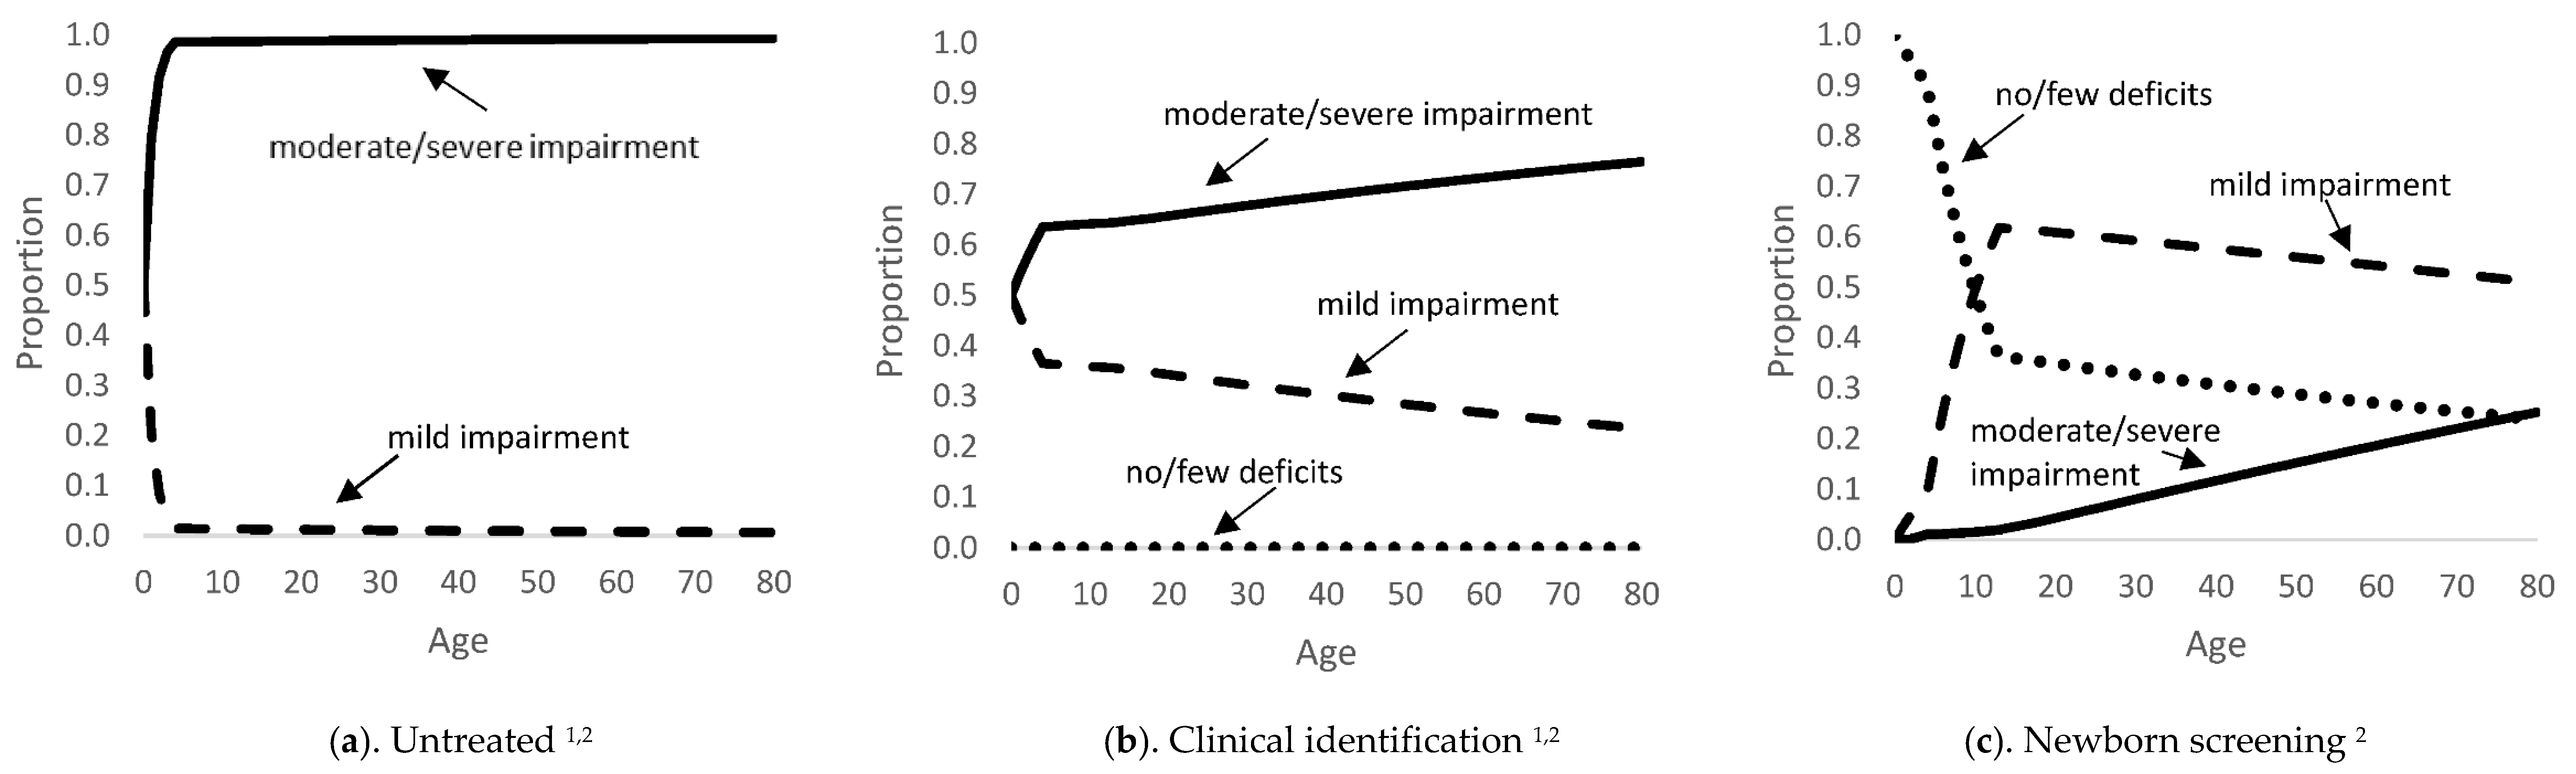
2.2. Epidemiology: Natural History of PKU
2.3. Clinical Identification and Newborn Screening Submodels
2.4. Treatment Interventions
2.5. Adherence Rates
2.6. Mortality Rates
2.7. Costs and Resource Use
2.8. Health-Related Quality of Life
2.9. Analysis Plan
3. Results
3.1. Base–Case Analysis
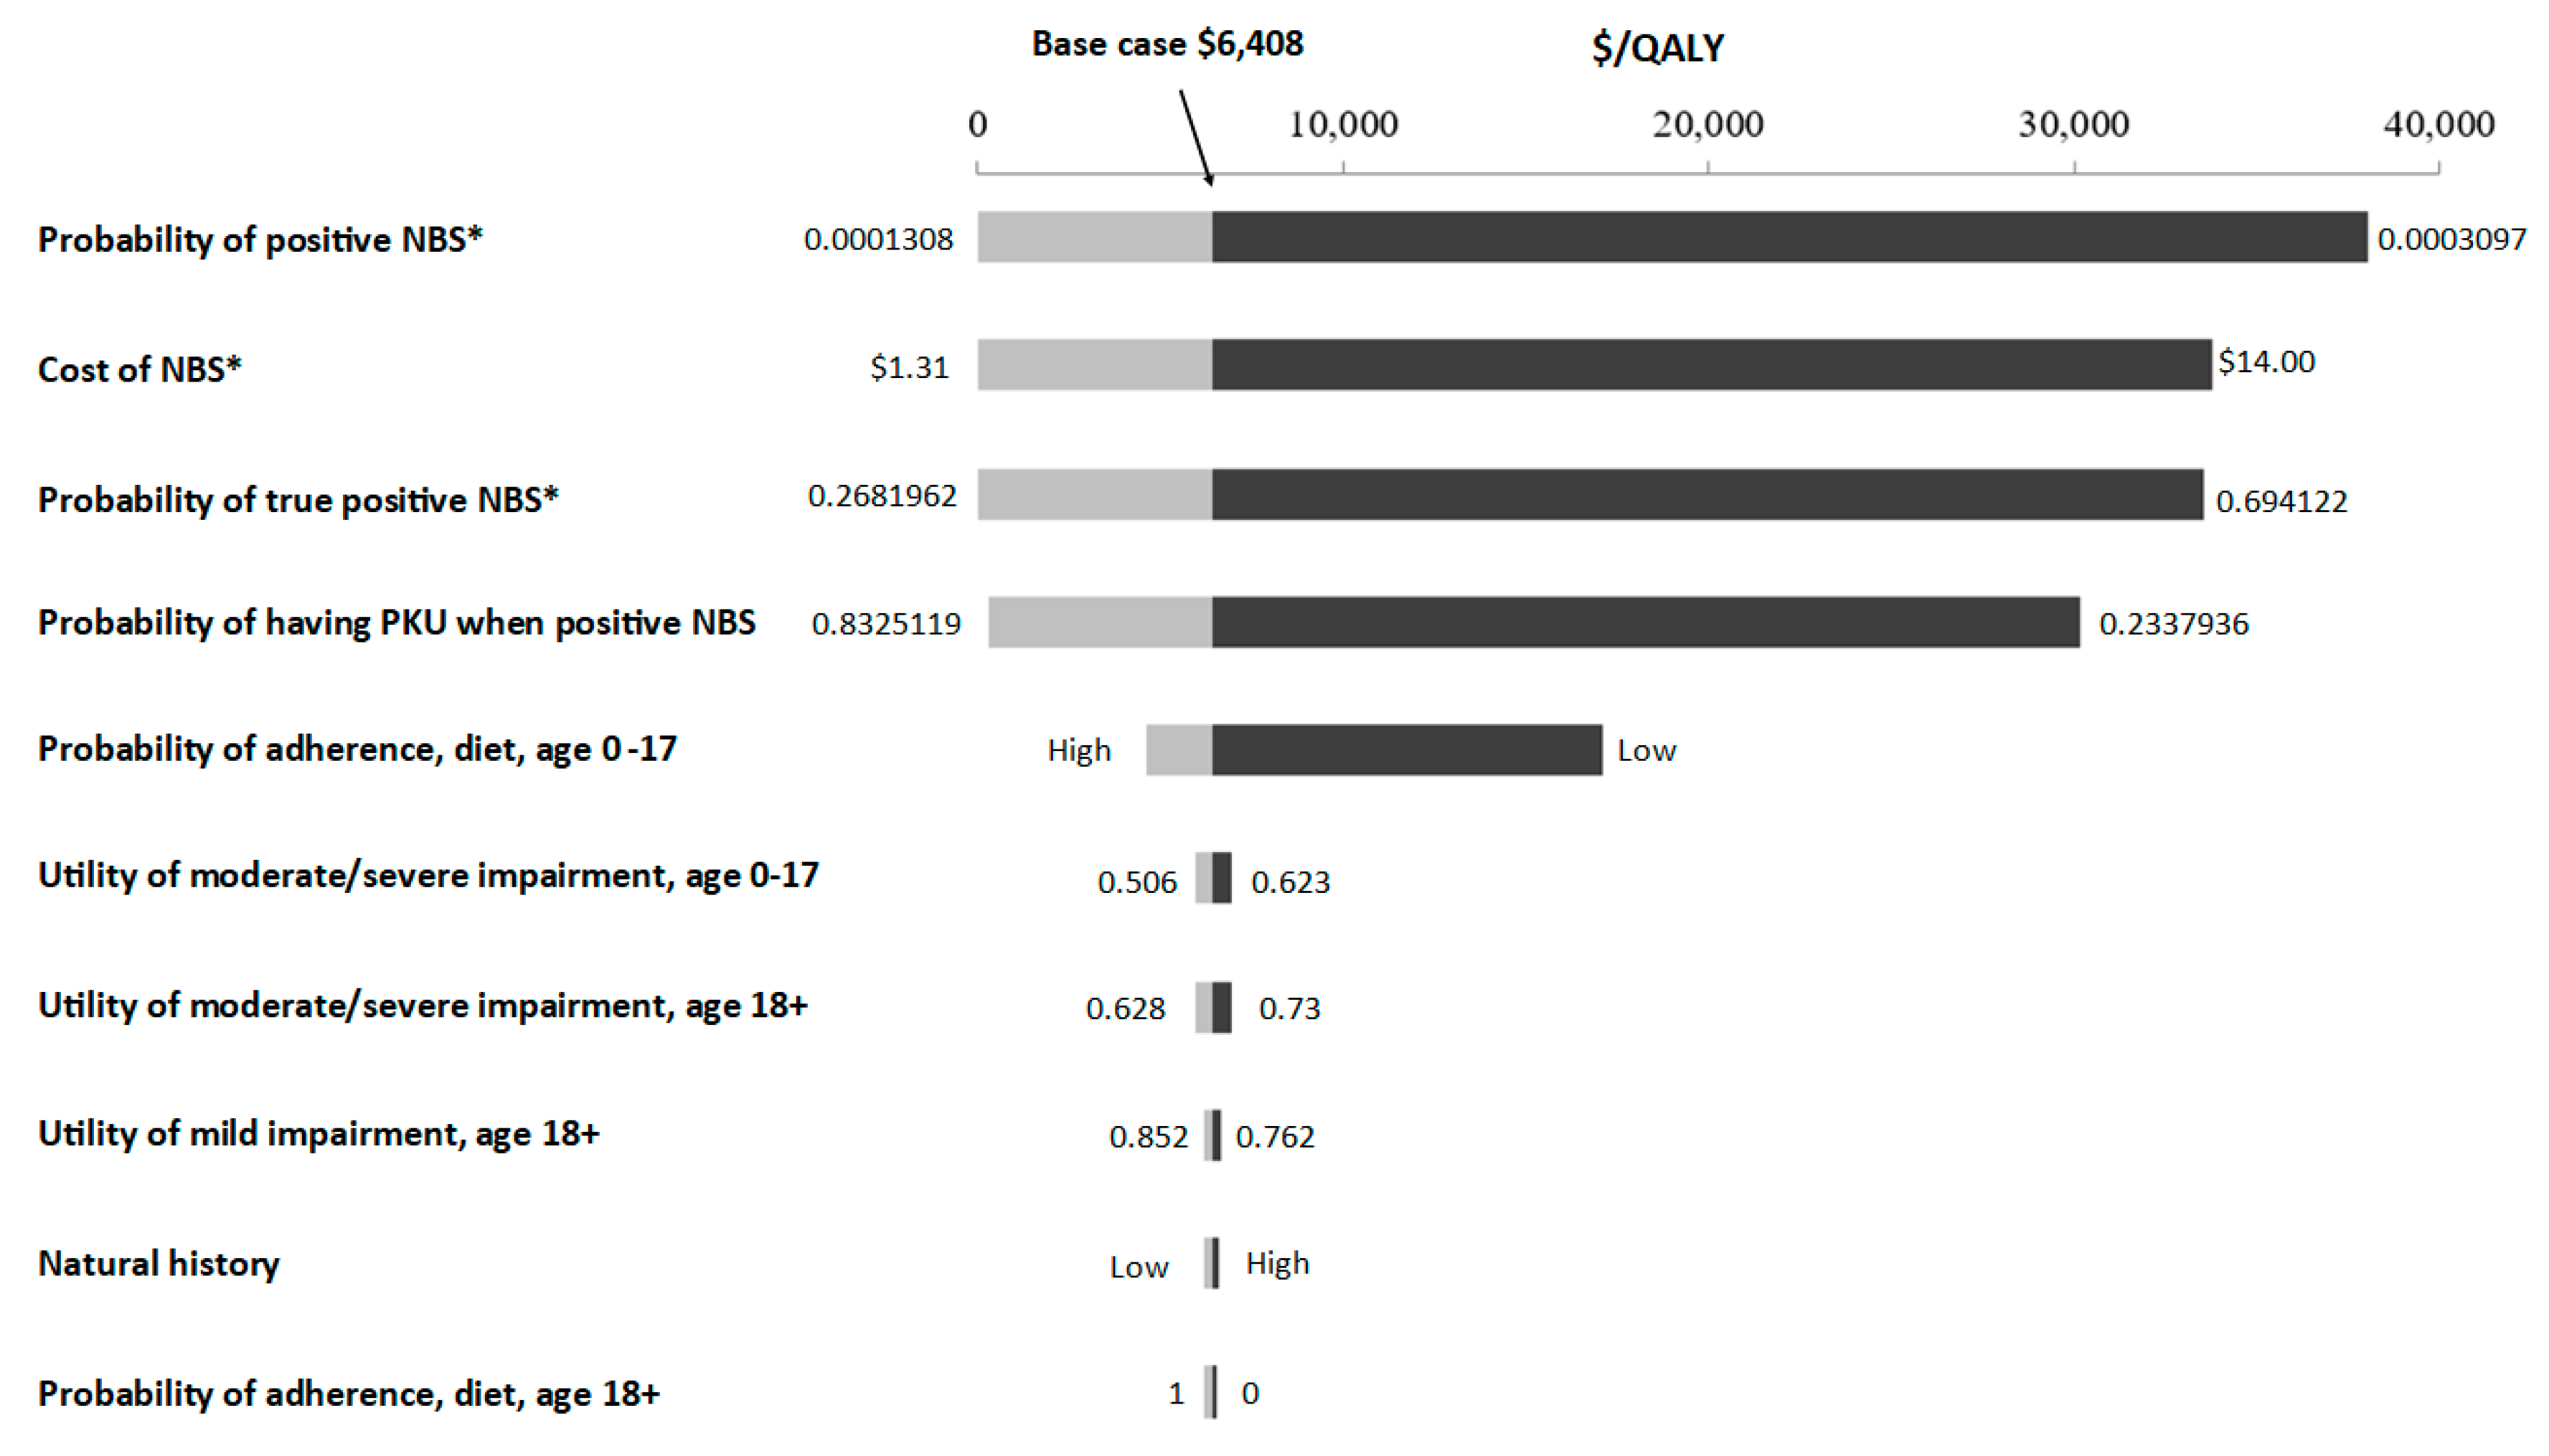
3.2. Sensitivity Analysis
One–Way Sensitivity Analysis
3.3. Scenario Analysis
3.3.1. Healthcare Sector Perspective
3.3.2. Full Adherence to Dietary Treatment and Medication
3.3.3. Using Experienced Individuals with PKU Ratings for Quality of Life Adjustments
3.3.4. Using the VA-Negotiated Drug Pricing Schedule
3.3.5. Including Caregiver Disutility
4. Discussion
5. Conclusions
Supplementary Materials
Author Contributions
Funding
Institutional Review Board Statement
Informed Consent Statement
Data Availability Statement
Acknowledgments
Conflicts of Interest
Ethic Code
References
- National Institutes of Health Consensus Development Panel. National Institutes of Health Consensus Development Conference statement: Phenylketonuria: Screening and management, October 16–18, 2000. Pediatrics 2001, 108, 972. [Google Scholar] [CrossRef]
- Blau, N.; van Spronsen, F.J.; Levy, H.L. Phenylketonuria. Lancet 2010, 376, 1417–1427. [Google Scholar] [CrossRef]
- Kleyn, M.; Audruszewski, K. Michigan Newborn Screening Program, Annual Report 2015; Michigan Department of Health and Human Services: Hart, MI, USA, 2017.
- Pitt, D.B.; Danks, D.M. The natural history of untreated phenylketonuria over 20 years. J. Paediatr. Child Health 1991, 27, 189–190. [Google Scholar] [CrossRef] [PubMed]
- Singh, R.H.; Rohr, F.; Frazier, D.; Cunningham, A.; Mofidi, S.; Ogata, B.; Splett, P.L.; Moseley, K.; Huntington, K.; Acosta, P.B.; et al. Recommendations for the nutrition management of phenylalanine hydroxylase deficiency. Genet. Med. 2014, 16, 121–131. [Google Scholar] [CrossRef] [PubMed] [Green Version]
- Center for Drug Research and Evaluation. Approval Letter. 2007. Available online: https://www.accessdata.fda.gov/drugsatfda_docs/nda/2007/022181s000_Approv.pdf (accessed on 19 September 2019).
- Blau, N.; Bélanger–Quintana, A.; Demirkol, M.; Feillet, F.; Giovannini, M.; MacDonald, A.; Trefz, F.K.; van Spronsen, F.J. Optimizing the use of sapropterin (BH4) in the management of phenylketonuria. Mol. Genet. Metab. 2009, 96, 158–163. [Google Scholar] [CrossRef] [PubMed]
- Cunningham, A.; Bausell, H.; Brown, M.; Chapman, M.; DeFouw, K.; Ernst, S.; McClure, J.; McCune, H.; O’Steen, D.; Pender, A.; et al. Recommendations for the use of sapropterin in phenylketonuria. Mol. Genet. Metab. 2012, 106, 269–276. [Google Scholar] [CrossRef]
- Lachmann, R. Sapropterin hydrochloride: Enzyme enhancement therapy for phenylketonuria. Ther. Adv. Endocrinol. Metab. 2011, 2, 127–133. [Google Scholar] [CrossRef]
- Ford, S.; O’Driscoll, M.; MacDonald, A. Living with phenylketonuria: Lessons from the PKU community. Mol. Genet. Metab. Rep. 2018, 17, 57–63. [Google Scholar] [CrossRef]
- Seashore, M.R.; Wappner, R.; Cho, S.; de la Cruz, F.; Kronmal, R.A.; Schuett, V. Management of phenylketonuria for optimal outcome: A review of guidelines for phenylketonuria management and a report of surveys of parents, patients, and clinic directors. Pediatrics 1999, 104, e68. [Google Scholar]
- MacDonald, A.; Gokmen–Ozel, H.; van Rijn, M.; Burgard, P. The reality of dietary compliance in the management of phenylketonuria. J. Inherit. Metab. Dis. 2010, 33, 665–670. [Google Scholar] [CrossRef] [PubMed]
- Cunningham, G.C. Two years of PKU testing in California. The role of the laboratory. Calif Med. 1969, 110, 11–16. [Google Scholar] [PubMed]
- Carroll, A.E.; Downs, S.M. Comprehensive cost–utility analysis of newborn screening strategies. Pediatrics 2006, 117 (Suppl. S3), S287–S295. [Google Scholar] [CrossRef] [Green Version]
- Geelhoed, E.A.; Lewis, B.; Hounsome, D.; O’Leary, P. Economic evaluation of neonatal screening for phenylketonuria and congenital hypothyroidism. J. Paediatr. Child Health 2005, 41, 575–579. [Google Scholar] [CrossRef] [PubMed]
- Massachusetts Department of Public Health. Cost–benefit analysis of newborn screening for metabolic disorders. N. Engl. J. Med. 1974, 291, 1414–1416. [Google Scholar] [CrossRef] [PubMed]
- Lord, J.; Thomason, M.J.; Littlejohns, P.; Chalmers, R.A.; Bain, M.D.; Addison, G.M.; Wilcox, A.H.; Seymour, C.A. Secondary analysis of economic data: A review of cost–benefit studies of neonatal screening for phenylketonuria. J. Epidemiol. Community Health 1999, 53, 179–186. [Google Scholar] [CrossRef] [Green Version]
- Steiner, K.C.; Smith, H.A. Application of cost–benefit analysis to a PKU screening program. Inquiry 1973, 10, 34–40. [Google Scholar]
- Rose, A.M.; Grosse, S.D.; Garcia, S.P.; Bach, J.; Kleyn, M.; Simon, N.J.E.; Prosser, L.A. The financial and time burden associated with phenylketonuria treatment in the United States. Mol. Genet. Metab. Rep. 2019, 21, 100523. [Google Scholar] [CrossRef]
- Simon, N.J.; Richardson, J.; Ahmad, A.; Rose, A.; Wittenberg, E.; D’Cruz, B.; Prosser, L.A. Health utilities and parental quality of life effects for three rare conditions tested in newborns. J. Patient Rep. Outcomes 2019, 3, 4. [Google Scholar] [CrossRef] [Green Version]
- Pandor, A.; Eastham, J.; Beverley, C.; Chilcott, J.; Paisley, S. Clinical effectiveness and cost-effectiveness of neonatal screening for inborn errors of metabolism using tandem mass spectrometry: A systematic review. Health Technol. Assess. 2004, 8, 1–121. [Google Scholar] [CrossRef] [Green Version]
- Chace, D.H.; Sherwin, J.E.; Hillman, S.L.; Lorey, F.; Cunningham, G.C. Use of phenylalanine–to–tyrosine ratio determined by tandem mass spectrometry to improve newborn screening for phenylketonuria of early discharge specimens collected in the first 24 hours. Clin. Chem. 1998, 44, 2405–2409. [Google Scholar] [CrossRef]
- Fiege, B.; Blau, N. Assessment of tetrahydrobiopterin (BH4) responsiveness in phenylketonuria. J. Pediatr. 2007, 150, 627–630. [Google Scholar] [CrossRef] [PubMed]
- Jurecki, E.R.; Cederbaum, S.; Kopesky, J.; Perry, K.; Rohr, F.; Sanchez–Valle, A.; Viau, K.S.; Sheinin, M.Y.; Cohen–Pfeffer, J.L. Adherence to clinic recommendations among patients with phenylketonuria in the United States. Mol. Genet. Metab. 2017, 120, 190–197. [Google Scholar] [CrossRef] [PubMed]
- Rohr, F.; Wessel, A.; Brown, M.; Charette, K.; Levy, H.L. Adherence to tetrahydrobiopterin therapy in patients with phenylketonuria. Mol. Genet. Metab. 2015, 114, 25–28. [Google Scholar] [CrossRef]
- PricewaterhouseCoppers L.L.P. Newborn Screening Programs: An Overview of Costs and Financing. 2002. Available online: https://www.marchofdimes.org/chapterassets/files/final_pwc_nbs_report2.pdf (accessed on 6 March 2004).
- Truven Health Analytics. Micromedex Solutions RED BOOK; Truven Health Analytics: Grand Rapids, MI, USA, 2016. [Google Scholar]
- Veterans Administration (V.A.). Pharmaceutical Prices. 2017. Available online: https://www.va.gov/opal/nac/fss/pharmPrices.asp (accessed on 4 July 2017).
- Lee, P.; Treacy, E.P.; Crombez, E.; Wasserstein, M.; Waber, L.; Wolff, J.; Wendel, U.; Dorenbaum, A.; Bebchuk, J.; Christ–Schmidt, H.; et al. Safety and efficacy of 22 weeks of treatment with sapropterin dihydrochloride in patients with phenylketonuria. Am. J. Med. Genet. A 2008, 146, 2851–2859. [Google Scholar] [CrossRef] [PubMed]
- Vernon, H.J.; Koerner, C.B.; Johnson, M.R.; Bergner, A.; Hamosh, A. Introduction of sapropterin dihydrochloride as standard of care in patients with phenylketonuria. Mol. Genet. Metab. 2010, 100, 229–233. [Google Scholar] [CrossRef] [Green Version]
- Centers for Medicare and Medicaid Services. Clinical Laboratory Fee Schedule 2016. Available online: https://www.cms.gov/Medicare/Medicare–Fee–for–Service–Payment/ClinicalLabFeeSched/clinlab.html (accessed on 4 July 2017).
- National PKU Alliance. MY PKU Binder. 2014. Available online: https://npkua.org/Education/My–PKU–Binder (accessed on 5 October 2020).
- Centers for Medicare and Medicaid Services. Physician Fee Schedule Search and Healthcare Common Procedure Coding System (HCPCS) Code. 2017. Available online: https://www.cms.gov/apps/physician–fee–schedule/search/search–criteria.aspx (accessed on 4 July 2017).
- United States Department of Labor. Bureau of Labor Statistics. 2017. Available online: https://www.bls.gov/ (accessed on 5 October 2020).
- Sylvan Learning. Sylvan Learning Program. 2017. Available online: http://www.sylvanlearning.com/tutoring/how–tutoring–works/what–to–expect/pricing (accessed on 5 October 2020).
- National Education Association. Background of Special Education and the Individuals with Disabilities Education Act (IDEA). 2004. Available online: http://www.nea.org/home/19029.htm (accessed on 5 October 2020).
- American Institutes for Rsearch. Center for Special Education Finance (CSEF). 2017. Available online: https://www.air.org/project/center–special–education–finance–csef (accessed on 5 October 2020).
- Smith, I.; Wolff, O.H. Natural history of phenylketonuria and influence of early treatment. Lancet 1974, 2, 540–544. [Google Scholar] [CrossRef]
- Koch, R.; Moseley, K.; Ning, J.; Romstad, A.; Guldberg, P.; Guttler, F. Long–term beneficial effects of the phenylalanine–restricted diet in late–diagnosed individuals with phenylketonuria. Mol. Genet. Metab. 1999, 67, 148–155. [Google Scholar] [CrossRef] [Green Version]
- Arias, E.; Heron, M.; Xu, J. United States Life Tables, 2013. Natl. Vital. Stat. Rep. 2017, 66, 1–64. [Google Scholar]
- Weinstein, M.C.; Russell, L.B.; Gold, M.R.; Siegel, J.E. Cost-Effectiveness in Health and Medicine; Oxford University Press: New York, NY, USA, 2016. [Google Scholar]
- Basu, A.; Ganiats, T. Discounting in Cost-Effectiveness Analysis, in Cost-Effectiveness in Health and Medicine; Neumann, P.J., Sanders, G.D., Russell, L.B., Siegel, J.E., Ganiats, T.G., Eds.; Oxford University Press: New York, NY, USA, 2017. [Google Scholar]
- Neumann, P.J.; Cohen, J.T.; Weinstein, M.C. Updating cost-effectiveness––the curious resilience of the $50,000–per–QALY threshold. N. Engl. J. Med. 2014, 371, 796–797. [Google Scholar] [CrossRef] [Green Version]
- Institute for Clinical and Economic Review ICER. Orphan Drug Assessment: Final Framework Adaptations. 2019. Available online: https://icer–review.org/material/final–ultra–rare–adaptations/ (accessed on 5 October 2020).
- Barden, H.S.; Kessel, R.; Schuett, V.E. The costs and benefits of screening for PKU in Wisconsin. Soc. Biol. 1984, 31, 1–17. [Google Scholar] [CrossRef] [PubMed]
- Clacy, A.; Sharman, R.; McGill, J. Depression, anxiety, and stress in young adults with phenylketonuria: Associations with biochemistry. J. Dev. Behav. Pediatr. 2014, 35, 388–391. [Google Scholar] [CrossRef]
- Sharman, R.; Sullivan, K.; Young, R.M.; McGill, J. Depressive symptoms in adolescents with early and continuously treated phenylketonuria: Associations with phenylalanine and tyrosine levels. Gene 2012, 504, 288–291. [Google Scholar] [CrossRef] [PubMed]
- Camp, K.M.; Parisi, M.A.; Acosta, P.B.; Berry, G.T.; Bilder, D.A.; Blau, N.; Bodamer, O.A.; Brosco, J.P.; Brown, C.S.; Burlina, A.B.; et al. Phenylketonuria Scientific Review Conference: State of the science and future research needs. Mol. Genet. Metab. 2014, 112, 87–122. [Google Scholar] [CrossRef] [PubMed] [Green Version]
- Koch, R.; Moseley, K.; Guttler, F. Tetrahydrobiopterin and maternal PKU. Mol. Genet. Metab. 2005, 86 (Suppl. S1), S139–S141. [Google Scholar] [CrossRef]
- Trefz, F.K.; Blau, N. Potential role of tetrahydrobiopterin in the treatment of maternal phenylketonuria. Pediatrics 2003, 112 Pt 2, 1566–1569. [Google Scholar]
- Grosse, S.D. Late–treated phenylketonuria and partial reversibility of intellectual impairment. Child. Dev. 2010, 81, 200–211. [Google Scholar] [CrossRef]
- Grosse, S.D. Showing Value in Newborn Screening: Challenges in Quantifying the Effectiveness and Cost-Effectiveness of Early Detection of Phenylketonuria and Cystic Fibrosis. Healthcare 2015, 3, 1133–1157. [Google Scholar] [CrossRef] [PubMed] [Green Version]


| Base–Case | Range for Sensitivity Analysis | Reference | |
|---|---|---|---|
| Newborn screening | |||
| Probability false negative screen | 0 | –– | [21,22] |
| Probability positive screen | 0.0002064 | 0.0001308–0.0003097 | [3] |
| Probability positive screen, confirmatory testing|positive initial screen | 0.4782609 | 0.2681962–0.694122 | [3] |
| Probability PKU|positive confirmatory test | 0.5454545 | 0.2337936–0.8325119 | [3] |
| Probability Phe level 360–600|PKU | 0.3770197 | 0.3366195–0.418732 | [23] |
| Treatment1 | |||
| Probability of responding to medication|Phe level 360–600, NBS | 0.81 | 0.79–0.83 | [23] |
| Probability of responding to medication|Phe level > 600, NBS/CI | 0.315 | 0.07–0.6 | [23] |
| Treatment effect–Diet treatment | 0.99 | –– | Assumption 2 |
| Treatment effect–Medication | 1 | –– | Assumption 3 |
| Adherence rate1 | |||
| Diet treatment | |||
| Age 0 to 3 | 0.88 | 0–1 | [24], assumption |
| Age 4 to 12 | 0.74 | 0–1 | |
| Age 13 to 17 | 0.5 | 0–1 | |
| Age 18 and over | 0.375 | 0–1 | |
| Medication | 0.6552 | 0.4567–0.821 | [25] 4 |
| Base-Case | Range for Sensitivity Analysis | Data Source | |
|---|---|---|---|
| Newborn screening and follow-up confirmatory testing | |||
| Screening test | 4.87 | 1.31–14.00 | [26] |
| Confirmatory testing | 114.48 | -- | 1 |
| Interventions | |||
| Diet treatment 2 | 2696–5100 | -- | [19] |
| Medication 3 | 15,142–171,713 | -- | [27,28,29,30] |
| Laboratory and developmental testing | |||
| Laboratory testing, PKU | |||
| Age 0 to 1 | 3870 | -- | [31,32] 4 |
| Age 2 to 17 | 1290 | -- | |
| Age 18 and above | 595 | -- | |
| Laboratory testing, hyperphe | |||
| Age 0 to 1 | 248 | -- | |
| Age 2 to 4 | 198 | -- | |
| Age 5 and above | 50 | -- | |
| Developmental testing | 16 | -- | [33]; expert opinion 5 |
| Special education | |||
| Tutoring, mild impairment | 1507 | -- | [34,35], assumption 6 |
| Special education, age 5 to 17, moderate impairment | 10,517 | -- | [36,37] |
| Average hourly wage | 26.31 | -- | [34] |
| PKU Health State | Utility Weight | ||
|---|---|---|---|
| Base-Case | Range for Sensitivity Analysis | Data Source | |
| Moderate/severe 1 | |||
| Age 0–17 | 0.564 | 0.506–0.623 | [20] |
| Age 18+ | 0.679 | 0.628–0.730 | |
| Mild 1 | |||
| Age 0–17 | 0.639 | 0.581–0.696 | |
| Age 18+ | 0.808 | 0.762–0.852 | |
| Caregiver disutility2 | |||
| Moderate/severe | 0.120 | 0.079–0.160 | [20] |
| Mild | 0.110 | 0.072–0.148 | |
| Strategies | Cost ($USD) | Incremental Cost | QALYs | Incremental QALYs | ICER ($/QALY) |
|---|---|---|---|---|---|
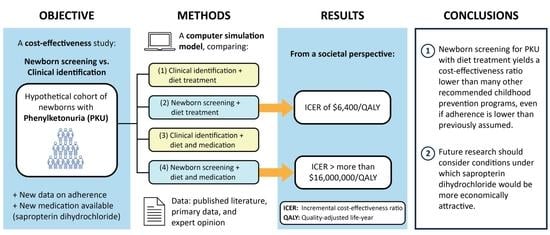
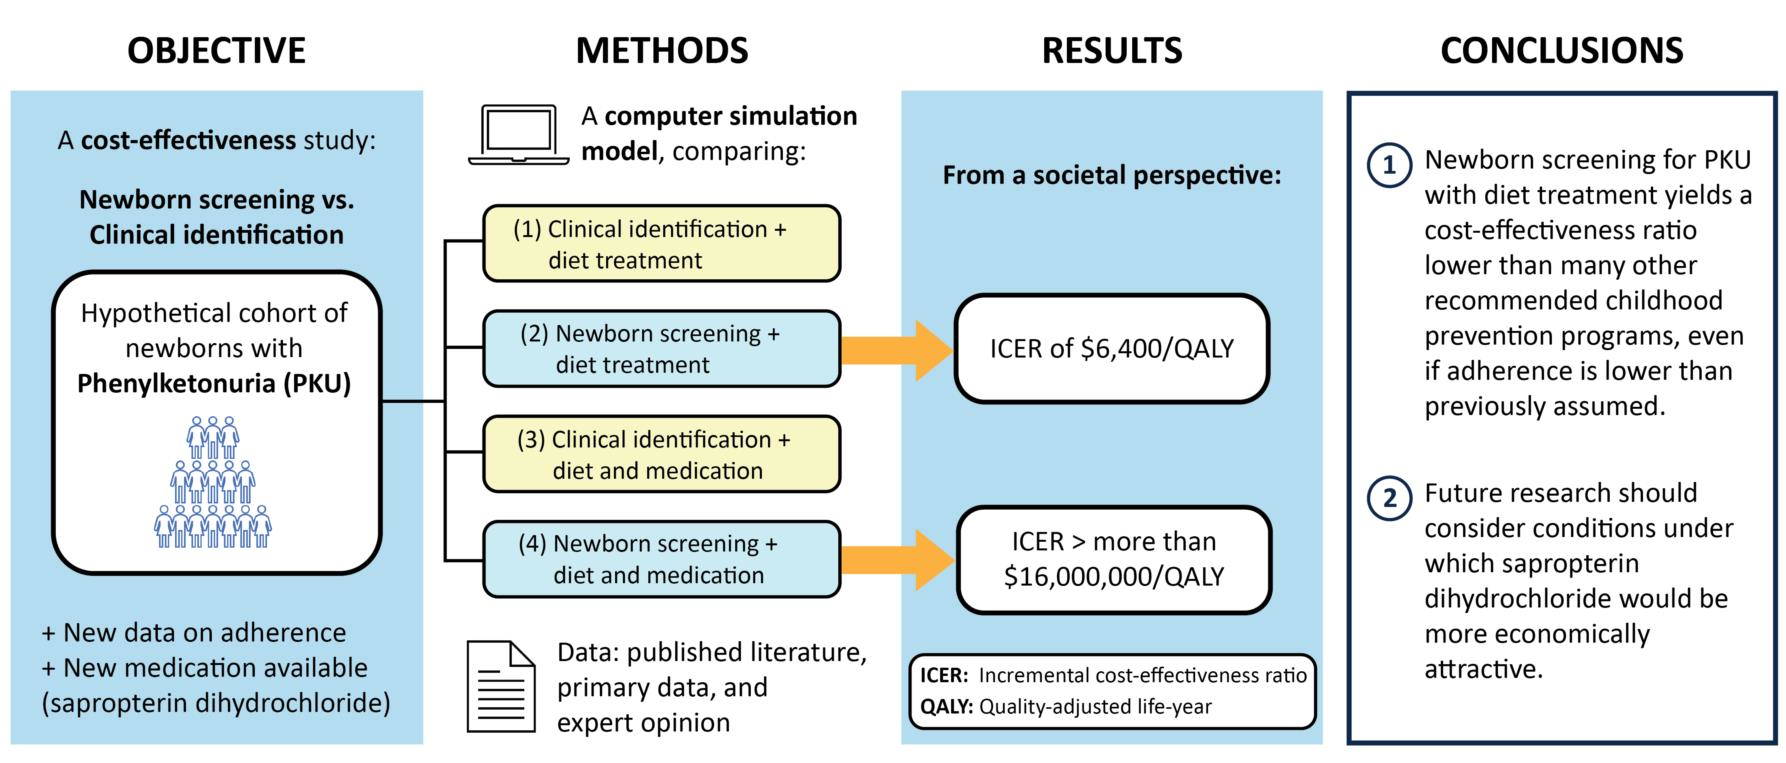
| CI/diet | 15,332 | – | 30,468.921 | – | – |
| NBS/diet | 17,471 | 2139 | 30,469.255 | 0.334 | 6408 |
| CI/diet with medication | 80,865 | 63,394 | 30,468.922 | –0.333 | dominated |
| NBS/diet with medication | 83,003 | 65,532 | 30,469.259 | 0.004 | 16,135,442 |
Publisher’s Note: MDPI stays neutral with regard to jurisdictional claims in published maps and institutional affiliations. |
© 2021 by the authors. Licensee MDPI, Basel, Switzerland. This article is an open access article distributed under the terms and conditions of the Creative Commons Attribution (CC BY) license (https://creativecommons.org/licenses/by/4.0/).
Share and Cite
Chen, H.-F.; Rose, A.M.; Waisbren, S.; Ahmad, A.; Prosser, L.A. Newborn Screening and Treatment of Phenylketonuria: Projected Health Outcomes and Cost-Effectiveness. Children 2021, 8, 381. https://0-doi-org.brum.beds.ac.uk/10.3390/children8050381
Chen H-F, Rose AM, Waisbren S, Ahmad A, Prosser LA. Newborn Screening and Treatment of Phenylketonuria: Projected Health Outcomes and Cost-Effectiveness. Children. 2021; 8(5):381. https://0-doi-org.brum.beds.ac.uk/10.3390/children8050381
Chicago/Turabian StyleChen, Huey-Fen, Angela M. Rose, Susan Waisbren, Ayesha Ahmad, and Lisa A. Prosser. 2021. "Newborn Screening and Treatment of Phenylketonuria: Projected Health Outcomes and Cost-Effectiveness" Children 8, no. 5: 381. https://0-doi-org.brum.beds.ac.uk/10.3390/children8050381