
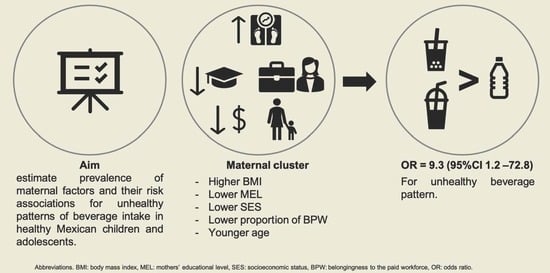
Maternal Factors and Their Association with Patterns of Beverage Intake in Mexican Children and Adolescents

 , ,
, ,
Abstract
:
1. Introduction
2. Materials and Methods
2.1. Study Participants
2.2. Measurements
2.2.1. Beverage, Water, Energy and Added Sugar Intake
2.2.2. Patterns of Beverages Intake
2.2.3. Maternal Factors
2.3. Statistical Analysis
3. Results
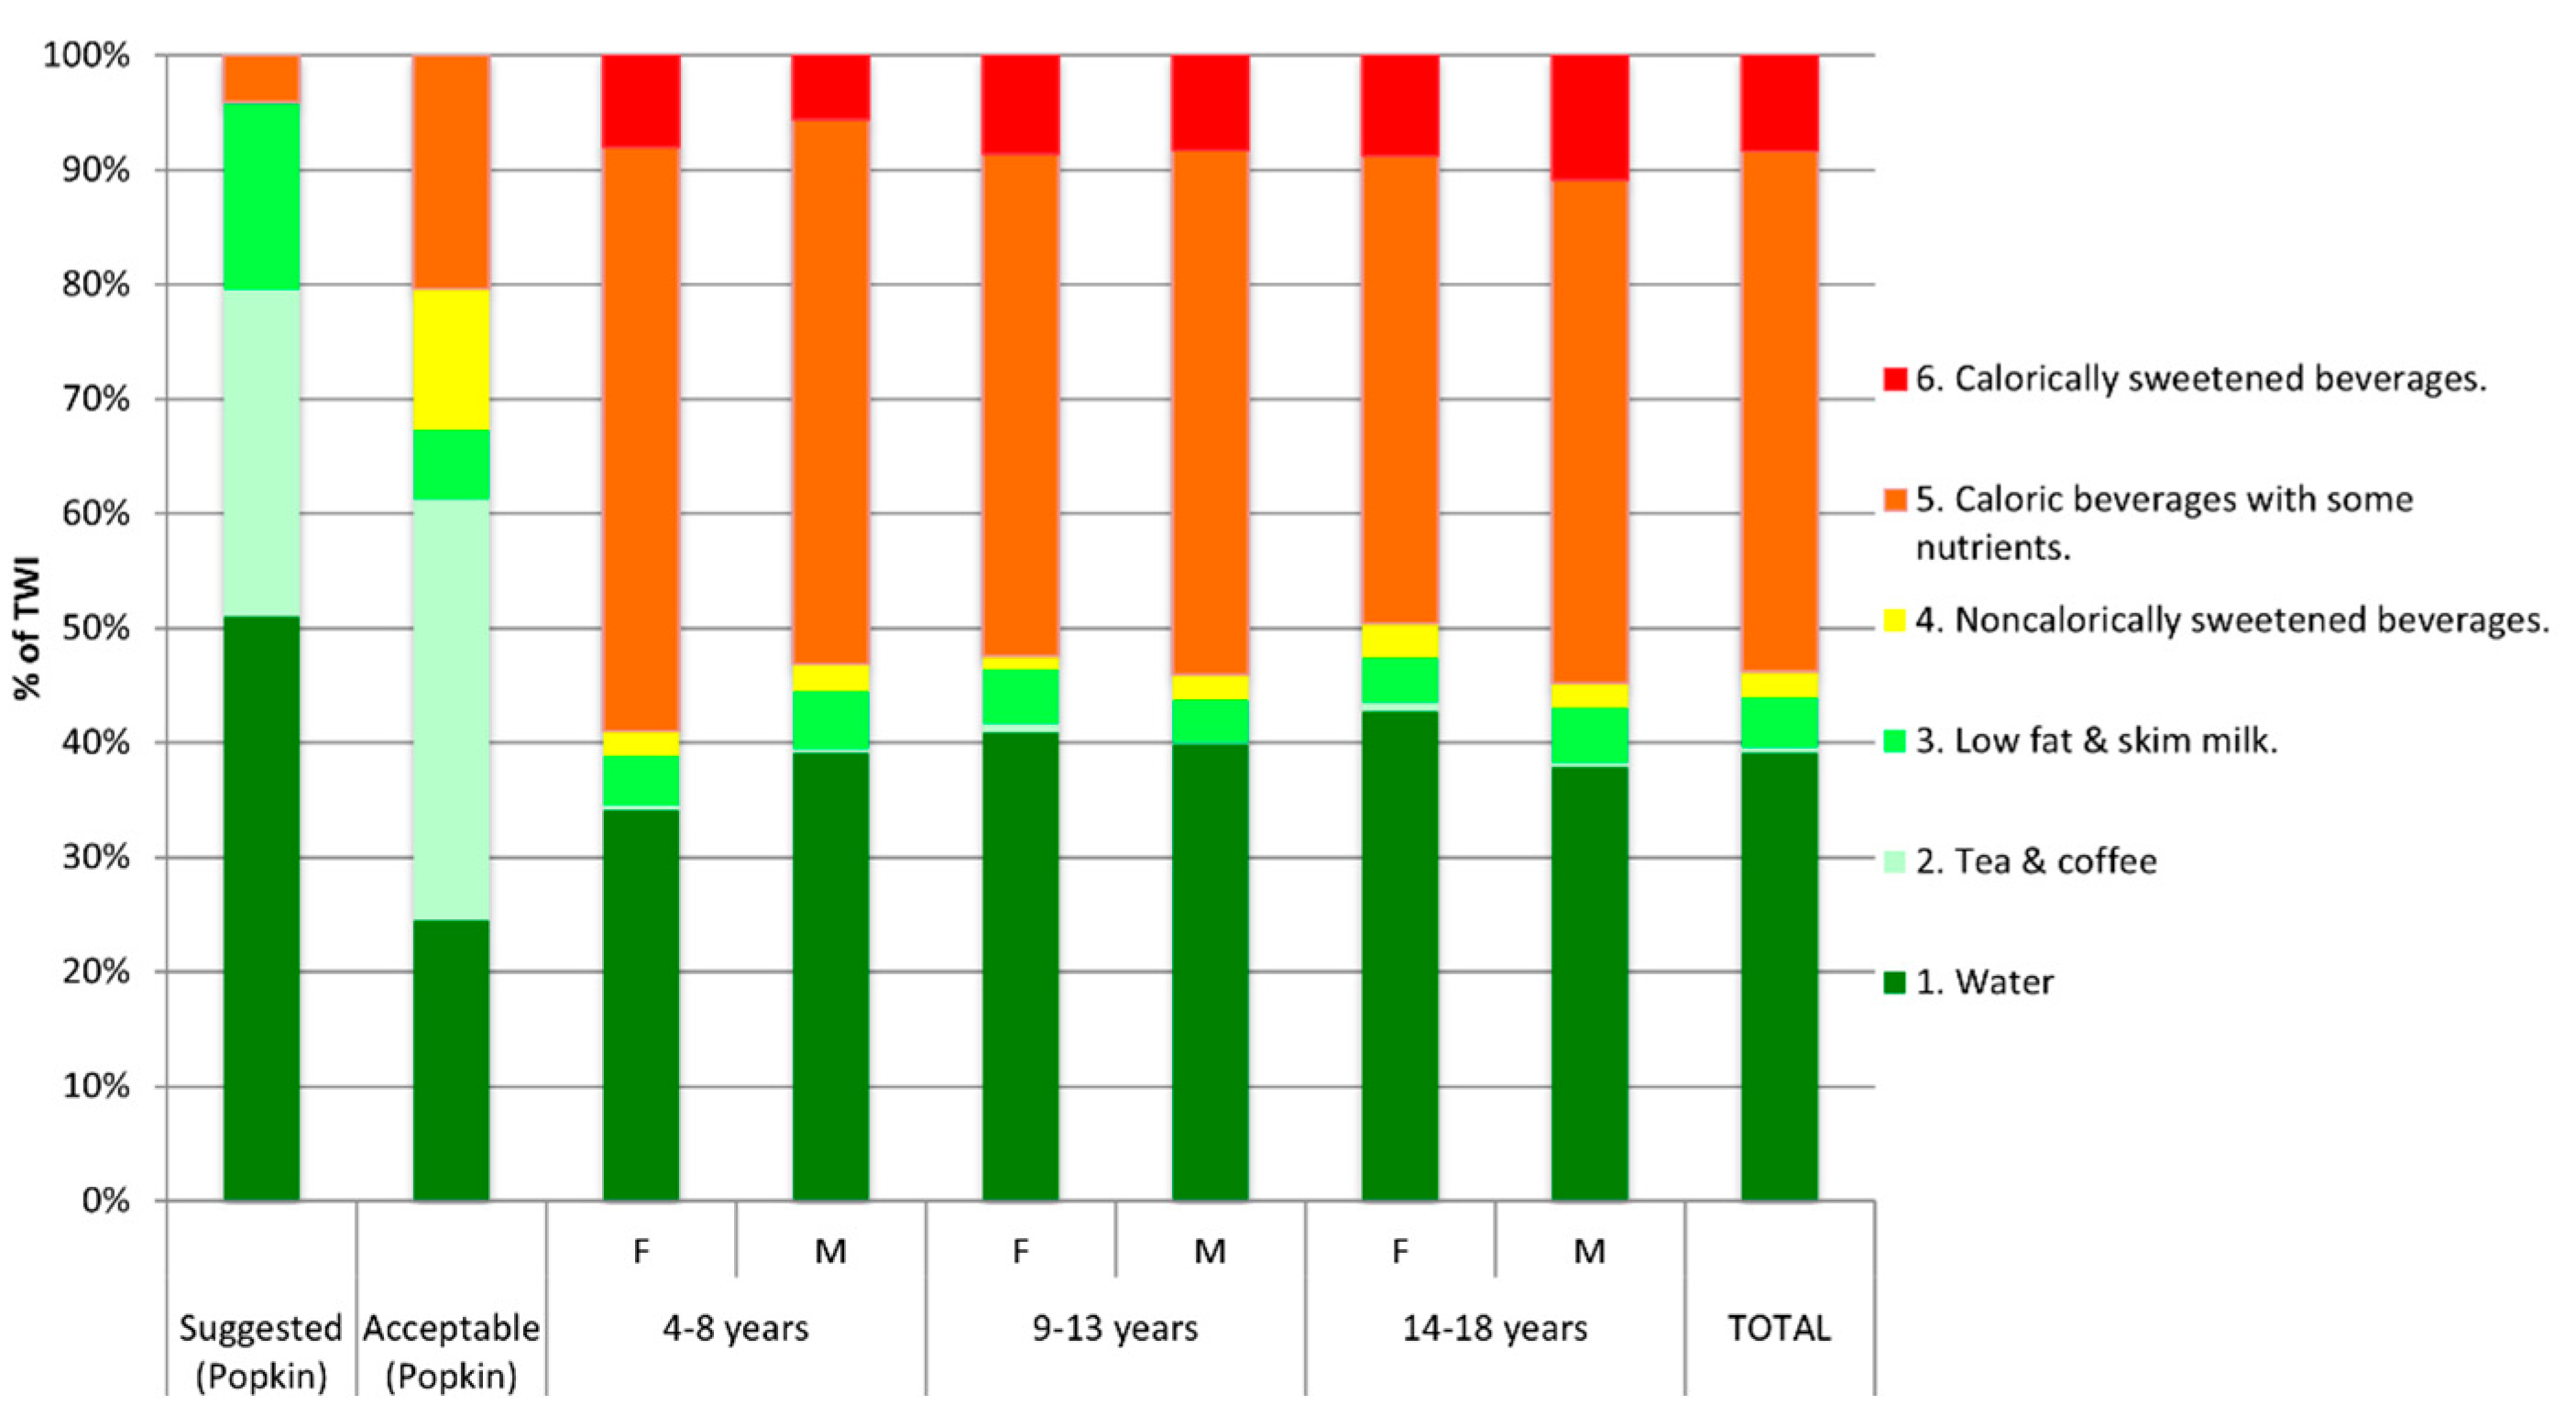
3.1. Beverage Sources
3.2. Maternal Factors
4. Discussion
5. Conclusions
Supplementary Materials
Author Contributions
Funding
Institutional Review Board Statement
Informed Consent Statement
Acknowledgments
Conflicts of Interest
References
- Manz, F.; Wentz, A. Hydration status in the United States and Germany. Nutr. Rev. 2005, 63, S55–S62. [Google Scholar] [CrossRef]
- Jequier, E.; Constant, F. Water as an essential nutrient: The physiological basis of hydration. Eur. J. Clin. Nutr. 2010, 64, 115–123. [Google Scholar] [CrossRef] [Green Version]
- Popkin, B.M.; D’Anci, K.E.; Rosenberg, I.H. Water, hydration, and health. Nutr. Rev. 2010, 68, 439–458. [Google Scholar] [CrossRef]
- IOM. Dietary Reference Intakes for Water, Potassium, Sodium, Chloride, and Sulfate; The National Academies Press, Ed.; The National Academies Press: Washington, DC, USA, 2005. [Google Scholar]
- Perales-Garcia, A.; Estevez-Martinez, I.; Urrialde, R. Hydration: Certain basic aspects for developing technical and scientific parameters into the nutrition knowledge. Nutr. Hosp. 2016, 33, 338. [Google Scholar] [CrossRef]
- Loh, D.A.; Moy, F.M.; Zaharan, N.L.; Jalaludin, M.Y.; Mohamed, Z. Sugar-sweetened beverage intake and its associations with cardiometabolic risks among adolescents. Pediatr. Obes. 2017, 12, e1–e5. [Google Scholar] [CrossRef] [PubMed]
- Popkin, B.M.; Armstrong, L.E.; Bray, G.M.; Caballero, B.; Frei, B.; Willett, W.C. A new proposed guidance system for beverage consumption in the United States. Am. J. Clin. Nutr. 2006, 83, 529–542. [Google Scholar] [CrossRef] [PubMed]
- Helm, L.; Macdonald, I.A. Impact of beverage intake on metabolic and cardiovascular health. Nutr. Rev. 2015, 73 (Suppl. S2), 120–129. [Google Scholar] [CrossRef] [Green Version]
- Vartanian, L.R.; Schwartz, M.B.; Brownell, K.D. Effects of soft drink consumption on nutrition and health: A systematic review and meta-analysis. Am. J. Public Health 2007, 97, 667–675. [Google Scholar] [CrossRef] [PubMed]
- Malik, V.S.; Popkin, B.M.; Bray, G.A.; Despres, J.P.; Hu, F.B. Sugar-sweetened beverages, obesity, type 2 diabetes mellitus, and cardiovascular disease risk. Circulation 2010, 121, 1356–1364. [Google Scholar] [CrossRef]
- Vos, M.B.; Kaar, J.L.; Welsh, J.A.; Van Horn, L.V.; Feig, D.I.; Anderson, C.A.M.; Patel, M.J.; Cruz Munos, J.; Krebs, N.F.; Xanthakos, S.A.; et al. Added Sugars and Cardiovascular Disease Risk in Children: A Scientific Statement From the American Heart Association. Circulation 2017, 135, e1017–e1034. [Google Scholar] [CrossRef] [Green Version]
- Savage, J.S.; Fisher, J.O.; Birch, L.L. Parental influence on eating behavior: Conception to adolescence. J. Law Med. Ethics 2007, 35, 22–34. [Google Scholar] [CrossRef] [PubMed] [Green Version]
- Johannsen, D.L.; Johannsen, N.M.; Specker, B.L. Influence of parents’ eating behaviors and child feeding practices on children’s weight status. Obesity 2006, 14, 431–439. [Google Scholar] [CrossRef] [PubMed]
- Arredondo, E.M.; Elder, J.P.; Ayala, G.X.; Campbell, N.; Baquero, B.; Duerksen, S. Is parenting style related to children’s healthy eating and physical activity in Latino families? Health Educ. Res. 2006, 21, 862–871. [Google Scholar] [CrossRef] [Green Version]
- Rivera, J.A.; Muñoz-Hernández, O.; Rosas-Peralta, M.; Aguilar-Salinas, C.A.; Popkin, B.M.; Willett, W.C. Consumo de bebidas para una vida saludable: Recomendaciones para la población mexicana. Salud Pública De México 2008, 50, 173–195. [Google Scholar] [CrossRef] [Green Version]
- Lopez-Gonzalez, D.; Wells, J.; Cortina-Borja, M.; Clark, P. Reference Values for Body Composition in Mexican Children and Adolescents; Hospital Infantil de Mexico Federico Gomez: Ciudad de Mexico, Mexico, 2019. [Google Scholar]
- Lopez-Gonzalez, D.; Wells, J.C.; Cortina-Borja, M.; Fewtrell, M.; Partida-Gaytan, A.; Clark, P. Reference values for bone mineral density in healthy Mexican children and adolescents. Bone 2021, 142, 115734. [Google Scholar] [CrossRef]
- de Waard, F. Body Mass Index. J. Chronic Dis. 1978, 31, 129. [Google Scholar] [CrossRef]
- de Onis, M.; Onyango, A.W.; Borghi, E.; Siyam, A.; Nishida, C.; Siekmann, J. Development of a WHO growth reference for school-aged children and adolescents. Bull. World Health Organ. 2007, 85, 660–667. [Google Scholar] [CrossRef]
- Lopez-Gonzalez, D.; Partida-Gaytan, A.; Wells, J.C.; Reyes-Delpech, P.; Avila-Rosano, F.; Ortiz-Obregon, M.; Gomez-Mendoza, F.; Diaz-Escobar, L.; Clark, P. Obesogenic Lifestyle and Its Influence on Adiposity in Children and Adolescents, Evidence from Mexico. Nutrients 2020, 12, 819. [Google Scholar] [CrossRef] [Green Version]
- Hernandez-Avila, M.; Romieu, I.; Parra, S.; Hernandez-Avila, J.; Madrigal, H.; Willett, W. Validity and reproducibility of a food frequency questionnaire to assess dietary intake of women living in Mexico City. Salud Publica Mex. 1998, 40, 133–140. [Google Scholar] [CrossRef] [PubMed]
- Pérez, A.B. Sistema Mexicano de Equivalentes, 4th ed.; Fomento de Nutrición y Salud AC: Mexico City, Mexico, 2014. [Google Scholar]
- Goldberg, G.R.; Black, A.E.; Jebb, S.A.; Cole, T.J.; Murgatroyd, P.R.; Coward, W.A.; Prentice, A.M. Critical evaluation of energy intake data using fundamental principles of energy physiology: 1. Derivation of cut-off limits to identify under-recording. Eur. J. Clin. Nutr. 1991, 45, 569–581. [Google Scholar]
- Niveles socioeconónimos AMAI. Available online: https://nse.amai.org/nse/ (accessed on 15 August 2015).
- Gandy, J. Water intake: Validity of population assessment and recommendations. Eur. J. Nutr. 2015, 54 (Suppl. S2), 11–16. [Google Scholar] [CrossRef] [PubMed] [Green Version]
- Sebastian, R.S.; Wilkinson Enns, C.; Goldman, J.D.; Moshfegh, A.J. Change in methodology for collection of drinking water intake in What We Eat in America/National Health and Nutrition Examination Survey: Implications for analysis. Public Health Nutr. 2012, 15, 1190–1195. [Google Scholar] [CrossRef] [Green Version]
- Romero-Martinez, M.; Shamah-Levy, T.; Vielma-Orozco, E.; Heredia-Hernandez, O.; Mojica-Cuevas, J.; Cuevas-Nasu, L.; Rivera-Dommarco, J.; Grupo de trabajo Ensanut. National Health and Nutrition Survey 2018–2019: Methodology and perspectives. Salud Publica Mex. 2019, 61, 917–923. [Google Scholar] [CrossRef] [PubMed]
- Available online: https://ensanut.insp.mx/encuestas/ensanut2018/doctos/informes/ensanut_2018_presentacion_resultados.pdf (accessed on 10 December 2019).
- Available online: http://estadistica.inmujeres.gob.mx/formas/tarjetas/Participacion_economica_femenina.pdf (accessed on 23 November 2019).
- Barquera, S.; Campirano, F.; Bonvecchio, A.; Hernandez-Barrera, L.; Rivera, J.A.; Popkin, B.M. Caloric beverage consumption patterns in Mexican children. Nutr. J. 2010, 9, 47. [Google Scholar] [CrossRef] [PubMed] [Green Version]
- Piernas, C.; Barquera, S.; Popkin, B.M. Current patterns of water and beverage consumption among Mexican children and adolescents aged 1–18 years: Analysis of the Mexican National Health and Nutrition Survey 2012. Public Health Nutr. 2014, 17, 2166–2175. [Google Scholar] [CrossRef] [PubMed] [Green Version]
- Gandy, J.; Martinez, H.; Carmuega, E.; Arredondo, J.L.; Pimentel, C.; Moreno, L.A.; Kavouras, S.A.; Salas-Salvado, J. Fluid intake of Latin American children and adolescents: Results of four 2016 LIQ.IN (7) National Cross-Sectional Surveys. Eur. J. Nutr. 2018, 57, 53–63. [Google Scholar] [CrossRef] [PubMed] [Green Version]
- Guelinckx, I.; Ferreira-Pego, C.; Moreno, L.A.; Kavouras, S.A.; Gandy, J.; Martinez, H.; Bardosono, S.; Abdollahi, M.; Nasseri, E.; Jarosz, A.; et al. Intake of water and different beverages in adults across 13 countries. Eur. J. Nutr. 2015, 54 (Suppl. S2), 45–55. [Google Scholar] [CrossRef] [Green Version]
- Ferreira-Pego, C.; Guelinckx, I.; Moreno, L.A.; Kavouras, S.A.; Gandy, J.; Martinez, H.; Bardosono, S.; Abdollahi, M.; Nasseri, E.; Jarosz, A.; et al. Total fluid intake and its determinants: Cross-sectional surveys among adults in 13 countries worldwide. Eur. J. Nutr. 2015, 54 (Suppl. S2), 35–43. [Google Scholar] [CrossRef] [Green Version]
- Iglesia, I.; Guelinckx, I.; De Miguel-Etayo, P.M.; Gonzalez-Gil, E.M.; Salas-Salvado, J.; Kavouras, S.A.; Gandy, J.; Martinez, H.; Bardosono, S.; Abdollahi, M.; et al. Total fluid intake of children and adolescents: Cross-sectional surveys in 13 countries worldwide. Eur. J. Nutr. 2015, 54 (Suppl. S2), 57–67. [Google Scholar] [CrossRef]
- Bellisle, F.; Thornton, S.N.; Hebel, P.; Denizeau, M.; Tahiri, M. A study of fluid intake from beverages in a sample of healthy French children, adolescents and adults. Eur. J. Clin. Nutr. 2010, 64, 350–355. [Google Scholar] [CrossRef] [PubMed] [Green Version]
- McLeod, E.R.; Campbell, K.J.; Hesketh, K.D. Nutrition knowledge: A mediator between socioeconomic position and diet quality in Australian first-time mothers. J. Am. Diet. Assoc. 2011, 111, 696–704. [Google Scholar] [CrossRef] [PubMed]
- Campbell, K.J.; Abbott, G.; Spence, A.C.; Crawford, D.A.; McNaughton, S.A.; Ball, K. Home food availability mediates associations between mothers’ nutrition knowledge and child diet. Appetite 2013, 71, 1–6. [Google Scholar] [CrossRef] [PubMed] [Green Version]
- Tovar, A.; Vadiveloo, M.; Ostbye, T.; Benjamin-Neelon, S.E. Maternal predictors of infant beverage consumption: Results from the Nurture cohort study. Public Health Nutr. 2019, 22, 2591–2597. [Google Scholar] [CrossRef]
- Cawley, J.; Liu, F. Maternal employment and childhood obesity: A search for mechanisms in time use data. Econ. Hum. Biol. 2012, 10, 352–364. [Google Scholar] [CrossRef]
- Crepinsek, M.K.; Burstein, N.R.; Abt Associates. Maternal Employment and Children’s Nutrition: Volume II. Other Nutrition-Related Outcomes (E-FAN-04-006-2); U.S. Department of Agriculture, Economic Research Service: Washington, DC, USA, 2004. [Google Scholar]
- Brown, J.E.; Broom, D.H.; Nicholson, J.M.; Bittman, M. Do working mothers raise couch potato kids? Maternal employment and children’s lifestyle behaviours and weight in early childhood. Soc. Sci. Med. 2010, 70, 1816–1824. [Google Scholar] [CrossRef]
- Eny, K.M.; Jeyakumar, N.; Dai, D.W.H.; Maguire, J.L.; Parkin, P.C.; Birken, C.S.; Collaboration, T.A.K. Sugar-containing beverage consumption and cardiometabolic risk in preschool children. Prev. Med. Rep. 2020, 17, 101054. [Google Scholar] [CrossRef] [PubMed]
- Gaona-Pineda, E.B.; Martínez-Tapia, B.; Arango-Angarita, A.; Valenzuela-Bravo, D.; Gómez-Acosta, L.M.; Shamah-Levy, T.; Rodríguez-Ramírez, S. Consumo de grupos de alimentos y factores sociodemográficos en población mexicana. Salud Pública De México 2018, 60, 272–282. [Google Scholar] [CrossRef] [Green Version]


| Variable | Total Sample | Children 4–8 y | Children 9–13 y | Adolescent 14–18 y | |||
|---|---|---|---|---|---|---|---|
| (n = 526; 34%) | (n = 588; 38%) | (n = 417; 27%) | |||||
| n = 1532 | Female | Male | Female | Male | Female | Male | |
| n = 230; 53% | n = 296; 47% | n = 272; 45% | n = 316; 56% | n = 208; 50% | n = 209; 50% | ||
| Age (years ± S.D.) | 11.1 ± 3.7 | 6.9 ± 1.2 | 7.2 ± 1.2 | 11.5 ± 1.4 | 11.4 ± 1.5 | 15.9 ± 1.1 | 15.8 ± 1.2 |
| Weight (kg ± S.D.) | 41.5 ± 17.9 | 23.9 ± 6.8 | 25.2 ± 7.4 | 44.1 ± 13.8 | 42.9 ± 12.9 | 57.9 ± 11.1 | 62.3 ±13.3 |
| Height (cm ± S.D.) | 141.6 ± 19.4 | 118.4 ± 9.4 | 121.4 ± 9.1 | 145.7 ±10.0 | 145.8 ±11.1 | 156.1 ± 6.3 | 168.5 ±6.5 |
| BMI (kg/m2 ± S.D.) | 19.6 ± 4.5 | 16.8 ± 2.8 | 16.8 ± 3.1 | 20.3 ± 4.5 | 19.8 ± 4.2 | 23.3 ± 3.9 | 21.9 ± 4.2 |
| BMI WHO classification | |||||||
| Underweight (n, %) | 71 (5%) | 12 (5%) | 18 (6%) | 9 (3%) | 20 (6%) | 1 (0%) | 11 (5%) |
| Healthy weight | 983 (64%) | 154 (67%) | 201 (68%) | 164 (60%) | 184 (58%) | 136 (65%) | 144 (69%) |
| Overweight | 246 (16%) | 33 (14%) | 36 (12%) | 51 (19%) | 48 (15%) | 52 (25%) | 26 (12%) |
| Obesity | 231 (15%) | 31 (13%) | 41 (14%) | 48 (18%) | 64 (20%) | 19 (9%) | 28 (13%) |
| Puberal Tanner stage | |||||||
| 1 (n, %) | 725 (47%) | 222 (97%) | 296 (100%) | 49 (18%) | 158 (50%) | 0 | 0 |
| 2 | 183 (12%) | 8 (3%) | 0 | 80 (29%) | 91 (29%) | 0 | 3 (1%) |
| 3 | 189 (12%) | 0 | 0 | 91 (33%) | 50 (16%) | 13 (6%) | 35 (17%) |
| 4 | 285 (19%) | 0 | 0 | 51 (19%) | 16 (5%) | 116 (56%) | 102 (49%) |
| 5 | 150 (10%) | 0 | 0 | 1 (0%) | 1 (0%) | 79 (38%) | 69 (33%) |
| Maternal factors | |||||||
| Mothers´ age (years ± S.D.) | 38.7 ± 7.1 | 35.2 ± 5.9 | 35.0 ± 6.6 | 39.0 ± 6.7 | 39.0 ± 6.7 | 42.8 ± 6.7 | 42.7 ± 5.8 |
| Mothers’ BMI (kg/m2 ± S.D.) | 27.3 ± 4.6 | 26.9 ± 4.6 | 26.7 ± 4.6 | 27.5 ± 4.7 | 27.5 ± 4.7 | 27.6 ± 4.4 | 27.7 ± 4.5 |
| Mother BMI category | |||||||
| Under weight | 11 (1%) | 2 (1%) | 5 (2%) | 2 (1%) | 2 (1%) | 0 (0%) | 0 (0%) |
| Healthy weight | 484 (33%) | 81 (37%) | 106 (37%) | 86 (33%) | 91 (30%) | 62 (31%) | 58 (29%) |
| Overweight | 619 (42%) | 80 (37%) | 116 (40%) | 110 (43%) | 135 (44%) | 86 (44%) | 90 (44%) |
| Obesity | 356 (24%) | 54 (25%) | 60 (21%) | 61 (23%) | 76 (25%) | 50 (25%) | 55 (27%) |
| Mother level education | |||||||
| Elementary school | 71 (5%) | 11 (5%) | 10 (3%) | 7 (3%) | 18 (6%) | 10 (5%) | 15 (7%) |
| Secondary school | 334 (22%) | 48 (21%) | 54 (18%) | 55 (20%) | 77 (24%) | 51 (25%) | 49 (23%) |
| High school | 417 (27%) | 68 (30%) | 85 (29%) | 85 (31%) | 73 (23%) | 50 (24%) | 56 (27%) |
| Post–secondary education | 161 (11%) | 13 (6%) | 25 (8%) | 37 (14%) | 38 (12%) | 28 (13%) | 20 (10%) |
| Bachelor | 500 (33%) | 79 (34%) | 116 (39%) | 82 (30%) | 96 (30%) | 62 (30%) | 65 (31%) |
| Master or equivalent | 49 (3%) | 11 (5%) | 7 (2%) | 6 (2%) | 14, (4%) | 7 (3%) | 4 (2%) |
| Belongingness to the paid workforce | 807 (53%) | 121 (53%) | 153 (52%) | 154 (57%) | 165 (53%) | 107 (52%) | 107 (52%) |
| Socioeconomical level | |||||||
| Low | 310 (42%) | 40 (40%) | 81 (42%) | 57 (44%) | 43 (42%) | 47 (42%) | 42 (42%) |
| Middle | 392 (53%) | 53 (53%) | 104 (54%) | 66 (51%) | 53 (52%) | 61 (55%) | 55 (56%) |
| Upper | 33 (5%) | 7 (7%) | 8 (4%) | 7 (5%) | 6 (6%) | 3 (3%) | 2 (2%) |
| Age Group | Sex | Total Water Intake (TWI) mL | 1. Water mL | 2. Tea and Coffee mL | 3. Low Fat & Skim Milk | 4. Noncalorically Sweetened Beverages | 5. Caloric Beverages with Some Nutrients | 6. Calorically Sweetened Beverages | Total Daily Energy Intake (TDEI) (kcal/d) | Daily Energy Intake from Beverages (kcal/d) | Energy Intake Coming from Beverages (% of TDEI) | Added Sugar Intake from Beverages (g/d) | ||||||||||
|---|---|---|---|---|---|---|---|---|---|---|---|---|---|---|---|---|---|---|---|---|---|---|
| Mean ± S.D. | Median (IQR) | Mean ± S.D. | Median (IQR) | Mean ± S.D. | Median (IQR) | Mean ± S.D. | Median (IQR) | Mean ± S.D. | Median (IQR) | Mean ± S.D. | Median (IQR) | Mean ± S.D. | Median (IQR) | Mean ± S.D. | Median (IQR) | Mean ± S.D. | Median (IQR) | % of TDEI | Mean ± S.D. | Median (IQR) | ||
| 4–8 y | F | 1511 ± 644 | 1415 (1060–1850) | 547 ± 494 | 500 (250–750) | 7 ± 46 | 0 (0–0) | 68 ± 162 | 0 (0–0) | 27 ± 129 | 0 (0–0) | 748 ± 526 | 628 (450–1000) | 113 ± 185 | 0 (0–250) | 2032 ± 533 | 1969 (1619–2359) | 441 ± 195 | 435 (304–556) | 22% (20.7–23.2) | 27 ± 25 | 20 (5–44) |
| M | 1699 ± 680 | 1560 (1250–2000) | 683 ± 547 | 560 (250–1000) | 4 ± 32 | 0 (0–0) | 77 ± 169 | 0 (0–0) | 42 ± 154 | 0 (0–0) | 794 ± 545 | 750 (430–1060) | 97 ± 188 | 0 (0–120) | 2366 ± 1920 | 2176 (1749–2597) | 475 ± 201 | 443 (327–600) | 22.1% (21.0–23.3) | 29 ± 27 | 22 (9–40) | |
| 9–13 y | F | 1768 ± 664 | 1693 (1305–2100) | 791 ± 696 | 628 (250–1100) | 10 ± 53 | 0 (0–0) | 72 ± 165 | 0 (0–0) | 21 ± 101 | 0 (0–0) | 736 ± 532 | 655 (365–1035) | 136 ± 228 | 0 (0–250) | 2409 ± 986 | 2266 (1868–2762) | 443 ± 208 | 440 (300–580) | 19.5% (18.4–20.6) | 33 ± 32 | 26 (7–51) |
| M | 1831 ± 713 | 1750 (1355–2200) | 783 ± 652 | 750 (250–1175) | 4 ± 68 | 0 (0–0) | 63 ± 169 | 0 (0–0) | 43 ± 215 | 0 (0–0) | 790 ± 562 | 750 (500–1060) | 145 ± 276 | 0 (0–250) | 2691 ± 855 | 2564 (2118–3155) | 509 ± 248 | 470 (350–630) | 19.7% (18.7–20.8) | 39 ± 36 | 31 (10–54) | |
| 14–18 y | F | 1812 ± 650 | 1750 (1375–2215) | 830 ± 681 | 750 (275–1250) | 13 ± 69 | 0 (0–0) | 71 ± 170 | 0 (0–0) | 47 ± 196 | 0 (0–0) | 714 ± 207 | 610 (318–1015) | 136 ± 226 | 0 (0–250) | 2421 ± 1114 | 2285 (1838–2744) | 445 ± 251 | 431 (252–596) | 19.6% (18.2–20.9) | 36 ± 35 | 28 (10–54) |
| M | 2032 ± 650 | 1970 (1500–2420) | 834 ± 730 | 750 (250 -1250) | 7 ± 46 | 0 (0–0) | 73 ± 179 | 0 (0–0) | 43 ± 175 | 0 (0–0) | 860 ± 606 | 750 (500–1100) | 214 ± 331 | 0 (0–290) | 3579 ± 5656 | 3017 (2384–3619) | 559 ± 299 | 524 (360–710) | 18.3% (17.0–19.5) | 48 ± 43 | 38 (15–73) | |
| TOTAL | 1771 ± 774 | 1650 (1260–2100) | 743 ± 642 | 600 (250–1000) | 7 ± 54 | 0 (0–0) | 71 ± 168 | 0 (0–0) | 37 ± 167 | 0 (0–0) | 774 ± 548 | 735 (423–1050) | 138 ± 244 | 0 (0–250) | 2563 ± 2405 | 2327 (1875–2871) | 479 ± 237 | 450 (308–606) | 20.2% (19.7–20.7) | 35 ± 33 | 26 (10–52) | |
| Age Group | Sex | IOM TWI Recommendation | AHA Sugar Intake < 25g/d | Suggested Beverage Pattern—n (%) of Non-Compliant Subjects | Acceptable Beverage Pattern—n (%) of Non-Compliant Subjects | ||||||||||||
|---|---|---|---|---|---|---|---|---|---|---|---|---|---|---|---|---|---|
| Full Pattern | Level 1 | Level 2 | Level 3 | Level 4 | Level 5 | Level 6 | Full pattern | Level 1 | Level 2 | Level 3 | Level 4 | Level 5 | Level 6 | ||||
| 4–8 y | F | 78 (34%) | 101 (44%) | 229 (99.6%) | 173 (75%) | 1 (0.4%) | 29 (13%) | 13 (6%) | 213 (93%) | 90 (39%) | 227 (99%) | 83 (36%) | 0 | 41 (18%) | 13 (6%) | 199 (87%) | 90 (39%) |
| M | 68 (23%) | 141 (48%) | 294 (99%) | 203 (68%) | 2 (0.7%) | 42 (14%) | 27 (9%) | 277 (93%) | 98 (33%) | 288 (97%) | 89 (30%) | 0 | 63 (21%) | 25 (8%) | 244 (82%) | 98 (33%) | |
| 9–13 y | F | 122 (45%) | 144 (53%) | 269 (99%) | 170 (63%) | 2 (0.7%) | 36 (13%) | 13 (5%) | 243 (89%) | 103 (38%) | 249 (92%) | 79 (29%) | 1 (0.4%) | 51 (19%) | 10 (4%) | 202 (74%) | 103 (38%) |
| M | 173 (55%) | 189 (60%) | 311 (98%) | 205 (65%) | 1 (0.3%) | 35 (11%) | 21 (7%) | 294 (93%) | 113 (36%) | 295 (93%) | 91 (29%) | 1 (0.3%) | 47 (15%) | 21 (7%) | 248 (79%) | 113 (36%) | |
| 14–18 y | F | 113 (54%) | 119 (57%) | 204 (98%) | 121 (58%) | 3 (1%) | 26 (13%) | 14 (7%) | 185 (89%) | 78 (37%) | 195 (94%) | 56 (27%) | 0 | 37 (18%) | 13 (6%) | 154 (74%) | 78 (38%) |
| M | 166 (79%) | 135 (65%) | 206 (99%) | 132 (63%) | 0 | 25 (12%) | 14 (7%) | 192 (92%) | 92 (44%) | 199 (95%) | 74 (35%) | 0 | 35 (17%) | 13 (6%) | 161 (77%) | 92 (44%) | |
| TOTAL | 720 (47%) | 829 (54%) | 1513 (99%) | 1004 (66%) | 9 (0.6%) | 193 (13%) | 102 (7%) | 1404 (92%) | 574 (37%) | 1453 (95%) | 472 (31%) | 2 (0.1%) | 274 (18%) | 95 (6%) | 1208 (79%) | 574 (37%) | |
| Age Group | Sex | SBIS | ABIS | ||
|---|---|---|---|---|---|
| Mean ± S.D. | Median (IQR) | Mean ± S.D. | Median (IQR) | ||
| 4–8 y | Female | 0.52 ± 0.21 | 0.5 (0.3–0.7) | 0.6 ± 0.22 | 0.67 (0.5–0.7) |
| Male | 0.55 ± 0.21 | 0.5 (0.47–0.7) | 0.64 ± 0.21 | 0.70 (0.50–0.80) | |
| 9–13 y | Female | 0.51 ± 0.23 | 0.5 (0.3–0.7) | 0.59 ± 0.23 | 0.6 (0.5–0.77) |
| Male | 0.47 ± 0.23 | 0.5 (0.3–0.7) | 0.55 ± 0.23 | 0.53 (0.37–0.7) | |
| 14–18 y | Female | 0.49 ± 0.23 | 0.5 (0.3–0.7) | 0.57 ± 0.23 | 0.57 (0.47–0.7) |
| Male | 0.40 ± 0.21 | 0.4 (0.27–0.5) | 0.47 ± 0.22 | 0.50 (0.3–0.7) | |
| Total sample | 0.49 ± 0.23 | 0.5 (0.3–0.7) | 0.57 ± 0.23 | 0.60 (0.47–0.7) | |
| Cluster | |||
|---|---|---|---|
| Maternal Factor | Cluster 1 n = 335 (47%) | Cluster 2 n = 376 (53%) | Factor Weight |
| SES (n, %) | Low (300, 89.6%) | Middle (376, 100%) | 1 |
| Average education level (n, %) | Secondary (106, 31.6%) | Bachelor (211, 56.1%) | 0.23 |
| BPW (n, %) | Yes (127, 37.9%) | Yes (243, 64.6%) | 0.08 |
| BMI (kg/m2) mean ± S.D. | 27.5 ± 4.71 | 26.5 ± 4.34 | 0.02 |
| Age (years) mean ± S.D. | 38.38 ± 7.5 | 39.1 ± 6.38 | 0.01 |
| OR | 95% CI | p-Value | ||
|---|---|---|---|---|
| Model 1 | ||||
| Maternal Cluster 2 (reference group) | ||||
| Maternal Cluster 1 | 9.126 | 1.162 | 71.669 | 0.035 |
| Model 2 * | ||||
| Maternal Cluster 2 (reference group) | ||||
| Maternal Cluster 1 | 9.259 | 1.178 | 72.787 | 0.034 |
Publisher’s Note: MDPI stays neutral with regard to jurisdictional claims in published maps and institutional affiliations. |
© 2021 by the authors. Licensee MDPI, Basel, Switzerland. This article is an open access article distributed under the terms and conditions of the Creative Commons Attribution (CC BY) license (https://creativecommons.org/licenses/by/4.0/).
Share and Cite
Lopez-Gonzalez, D.; Avila-Rosano, F.; Montiel-Ojeda, D.; Ortiz-Obregon, M.; Reyes-Delpech, P.; Diaz-Escobar, L.; Clark, P. Maternal Factors and Their Association with Patterns of Beverage Intake in Mexican Children and Adolescents. Children 2021, 8, 385. https://0-doi-org.brum.beds.ac.uk/10.3390/children8050385
Lopez-Gonzalez D, Avila-Rosano F, Montiel-Ojeda D, Ortiz-Obregon M, Reyes-Delpech P, Diaz-Escobar L, Clark P. Maternal Factors and Their Association with Patterns of Beverage Intake in Mexican Children and Adolescents. Children. 2021; 8(5):385. https://0-doi-org.brum.beds.ac.uk/10.3390/children8050385
Chicago/Turabian StyleLopez-Gonzalez, Desiree, Fatima Avila-Rosano, Diana Montiel-Ojeda, Marcela Ortiz-Obregon, Pamela Reyes-Delpech, Laura Diaz-Escobar, and Patricia Clark. 2021. "Maternal Factors and Their Association with Patterns of Beverage Intake in Mexican Children and Adolescents" Children 8, no. 5: 385. https://0-doi-org.brum.beds.ac.uk/10.3390/children8050385