
Impact of the COVID-19 Pandemic on Seasonal Variations in Childhood and Adolescent Growth: Experience of Pediatric Endocrine Clinics


Abstract
:
1. Introduction
2. Materials and Methods
2.1. Subjects
2.2. Anthropometric Measurements
2.3. Statistical Analysis
3. Results
4. Discussion
5. Conclusions
Author Contributions
Funding
Institutional Review Board Statement
Informed Consent Statement
Data Availability Statement
Acknowledgments
Conflicts of Interest
References
- WHO. Coronavirus Disease (COVID-19). Available online: https://www.who.int/emergencies/diseases/novel-coronavirus-2019/question-and-answers-hub/q-a-detail/coronavirus-disease-covid-19 (accessed on 30 March 2021).
- Cucinotta, D.; Vanelli, M. WHO Declares COVID-19 a Pandemic. Acta Bio Medica Atenei Parmensis 2020, 91, 157–160. [Google Scholar] [CrossRef] [PubMed]
- WHO. COVID-19 Weekly Epidemiological Update. Available online: https://www.who.int/publications/m/item/weekly-epidemiological-update-8-december-2020 (accessed on 8 December 2020).
- WHO. DRAFT Landscape of COVID-19 Candidate Vaccines. Available online: https://www.who.int/publications/m/item/draft-landscape-of-covid-19-candidate-vaccines (accessed on 10 December 2020).
- Viner, R.M.; Russell, S.J.; Croker, H.; Packer, J.; Ward, J.; Stansfield, C.; Mytton, O.; Bonell, C.; Booy, R. School closure and management practices during coronavirus outbreaks including COVID-19: A rapid systematic review. Lancet Child Adolesc. Health 2020, 4, 397–404. [Google Scholar] [CrossRef]
- Pietrobelli, A.; Pecoraro, L.; Ferruzzi, A.; Heo, M.; Faith, M.; Zoller, T.; Antoniazzi, F.; Piacentini, G.; Fearnbach, S.N.; Heymsfield, S.B. Effects of COVID-19 Lockdown on Lifestyle Behaviors in Children with Obesity Living in Verona, Italy: A Longitudinal Study. Obesity 2020, 28, 1382–1385. [Google Scholar] [CrossRef] [PubMed]
- He, M.; Xian, Y.; Lv, X.; He, J.; Ren, Y. Changes in Body Weight, Physical Activity, and Lifestyle During the Semi-lockdown Period After the Outbreak of COVID-19 in China: An Online Survey. Disaster Med. Public Health Prep. 2020, 1–6. [Google Scholar] [CrossRef]
- Takahashi, E. Growth and environmental factors in Japan. Hum. Biol. 1966, 38, 112–130. [Google Scholar] [PubMed]
- Orr, J.; Clark, M. A Report on Seasonal Variation in the Growth of School-Children. Lancet 1930, 216, 365–367. [Google Scholar] [CrossRef]
- Reynolds, E.L.; Sontag, L.W. Seasonal variations in weight, height, and appearance of ossification centers. J. Pediatrics 1944, 24, 524–535. [Google Scholar] [CrossRef]
- Hong, C. Hong Changeui Pediatrics, 12th ed.; Mi Rae N: Seoul, Korea, 2020; Volume 1, p. 10. [Google Scholar]
- Dalskov, S.M.; Ritz, C.; Larnkjaer, A.; Damsgaard, C.T.; Petersen, R.A.; Sorensen, L.B.; Hjorth, M.F.; Ong, K.K.; Astrup, A.; Molgaard, C.; et al. Seasonal variations in growth and body composition of 8-11-y-old Danish children. Pediatric Res. 2016, 79, 358–363. [Google Scholar] [CrossRef] [Green Version]
- Bhutani, S.; Hanrahan, L.P.; VanWormer, J.; Schoeller, D.A. Circannual variation in relative weight of children 5 to 16 years of age. Pediatric Obes. 2018, 13, 399–405. [Google Scholar] [CrossRef]
- VanWormer, J.J.; Kieke, B.A.; Hanrahan, L.P.; Pomeroy, J.J.; Mundy, A.; Schoeller, D.A. Circannual growth in Wisconsin children and adolescents: Identifying optimal periods of obesity prevention. Pediatric Obes. 2020, 15, e12572. [Google Scholar] [CrossRef]
- Kobayashi, M.; Kobayashi, M. The relationship between obesity and seasonal variation in body weight among elementary school children in Tokyo. Econ. Hum. Biol. 2006, 4, 253–261. [Google Scholar] [CrossRef] [PubMed]
- Moreno, J.P.; Johnston, C.A.; Chen, T.A.; O’Connor, T.A.; Hughes, S.O.; Baranowski, J.; Woehler, D.; Baranowski, T. Seasonal variability in weight change during elementary school. Obesity 2015, 23, 422–428. [Google Scholar] [CrossRef] [PubMed]
- Franckle, R.; Adler, R.; Davison, K. Peer reviewed: Accelerated weight gain among children during summer versus school year and related racial/ethnic disparities: A systematic review. Prev. Chronic Dis. 2014, 11, E101. [Google Scholar] [CrossRef] [Green Version]
- Von Hippel, P.T.; Powell, B.; Downey, D.B.; Rowland, N.J. The effect of school on overweight in childhood: Gain in body mass index during the school year and during summer vacation. Am. J. Public Health 2007, 97, 696–702. [Google Scholar] [CrossRef] [PubMed]
- Kim, J.H.; Yun, S.; Hwang, S.S.; Shim, J.O.; Chae, H.W.; Lee, Y.J.; Lee, J.H.; Kim, S.C.; Lim, D.; Yang, S.W.; et al. The 2017 Korean National Growth Charts for children and adolescents: Development, improvement, and prospects. Korean J. Pediatr. 2018, 61, 135–149. [Google Scholar] [CrossRef] [PubMed]
- Rundle, A.G.; Park, Y.; Herbstman, J.B.; Kinsey, E.W.; Wang, Y.C. COVID-19-Related School Closings and Risk of Weight Gain Among Children. Obesity 2020, 28, 1008–1009. [Google Scholar] [CrossRef] [Green Version]
- Zachary, Z.; Forbes, B.; Lopez, B.; Pedersen, G.; Welty, J.; Deyo, A.; Kerekes, M. Self-quarantine and weight gain related risk factors during the COVID-19 pandemic. Obes. Res. Clin. Pract. 2020, 14, 210–216. [Google Scholar] [CrossRef] [PubMed]
- Pellegrini, M.; Ponzo, V.; Rosato, R.; Scumaci, E.; Goitre, I.; Benso, A.; Belcastro, S.; Crespi, C.; De Michieli, F.; Ghigo, E.; et al. Changes in Weight and Nutritional Habits in Adults with Obesity during the “Lockdown” Period Caused by the COVID-19 Virus Emergency. Nutrients 2020, 12, 2016. [Google Scholar] [CrossRef] [PubMed]
- An, R. Projecting the impact of the coronavirus disease-2019 pandemic on childhood obesity in the United States: A microsimulation model. J. Sport Health Sci. 2020, 9, 302–312. [Google Scholar] [CrossRef]
- Kim, S.H.; Huh, K.; Won, S.; Lee, K.-W.; Park, M.-J. A significant increase in the incidence of central precocious puberty among Korean girls from 2004 to 2010. PLoS ONE 2015, 10, e0141844. [Google Scholar] [CrossRef] [Green Version]
- Kim, Y.J.; Kwon, A.; Jung, M.K.; Kim, K.E.; Suh, J.; Chae, H.W.; Kim, D.H.; Ha, S.; Seo, G.H.; Kim, H.-S. Incidence and prevalence of central precocious puberty in Korea: An epidemiologic study based on a national database. J. Pediatrics 2019, 208, 221–228. [Google Scholar] [CrossRef] [PubMed]
- Teilmann, G.; Pedersen, C.B.; Jensen, T.K.; Skakkebæk, N.E.; Juul, A. Prevalence and incidence of precocious pubertal development in Denmark: An epidemiologic study based on national registries. Pediatrics 2005, 116, 1323–1328. [Google Scholar] [CrossRef] [PubMed]
- Libman, I.; Arslanian, S.A. Type II diabetes mellitus: No longer just adults. Pediatric Ann. 1999, 28, 589–593. [Google Scholar] [CrossRef] [PubMed]
- Arslanian, S.; Bacha, F.; Grey, M.; Marcus, M.D.; White, N.H.; Zeitler, P. Evaluation and management of youth-onset type 2 diabetes: A position statement by the American Diabetes Association. Diabetes Care 2018, 41, 2648–2668. [Google Scholar] [CrossRef] [Green Version]
- Lim, J.S.; Kim, E.Y.; Kim, J.H.; Yoo, J.-H.; Yi, K.H.; Chae, H.W.; Choi, J.-H.; Kim, J.Y.; Hwang, I.T. 2017 Clinical practice guidelines for dyslipidemia of Korean children and adolescents. Ann. Pediatric Endocrinol. Metab. 2020, 25, 199. [Google Scholar] [CrossRef]
- Yoon, G.H. Obesity and Types Diabetes Mellitus. J. Korean Soc. Pediatric Endocrinol. 2002, 7, 150–153. [Google Scholar]
- Kim, S.H.; Ahn, B.C.; Joung, H.; Park, M.J. Lipid Profiles and Prevalence of Dyslipidemia in Korean Adolescents. Endocrinol. Metab. 2012, 27, 208–216. [Google Scholar] [CrossRef] [Green Version]
- Lee, S.H.; Ahn, M.B.; Choi, Y.J.; Kim, S.K.; Kim, S.H.; Cho, W.K.; Cho, K.S.; Suh, B.-K.; Jung, M.H. Comparison of different criteria for the definition of insulin resistance and its relationship to metabolic risk in children and adolescents. Ann. Pediatric Endocrinol. Metab. 2020, 25, 227. [Google Scholar] [CrossRef]
- Chu, S.-Y.; Jung, J.-H.; Park, M.-J.; Kim, S.-H. Risk assessment of metabolic syndrome in adolescents using the triglyceride/high-density lipoprotein cholesterol ratio and the total cholesterol/high-density lipoprotein cholesterol ratio. Ann. Pediatric Endocrinol. Metab. 2019, 24, 41. [Google Scholar] [CrossRef] [Green Version]


| Male (n = 40) | Female (n = 129) | Total (n = 169) | |
|---|---|---|---|
| Age (yr) | 11.1 ± 2.4 | 9.6 ± 2.1 | 9.9 ± 2.3. |
| HT (cm) | 144.2 ± 17.4 | 138.3 ± 9.9 | 139.7 ± 12.3 |
| WT (kg) | 43.2 ± 16.1 | 36.4 ± 8.8 | 38.0 ± 11.3 |
| BMI (kg/m2) | 20.0 ± 3.6 | 18.8 ± 2.5 | 19.0 ± 2.8 |
| HTz | −0.35 ± 1.25 | 0.58 ± 1.14 | 0.36 ± 1.23 |
| WTz | −0.03 ± 1.32 | 0.61 ± 0.97 | 0.46 ± 1.09 |
| BMIz | 0.22 ± 1.17 | 0.47 ± 0.95 | 0.41 ± 1.01 |
| D1 | D2 | D3 | D4 | ||
|---|---|---|---|---|---|
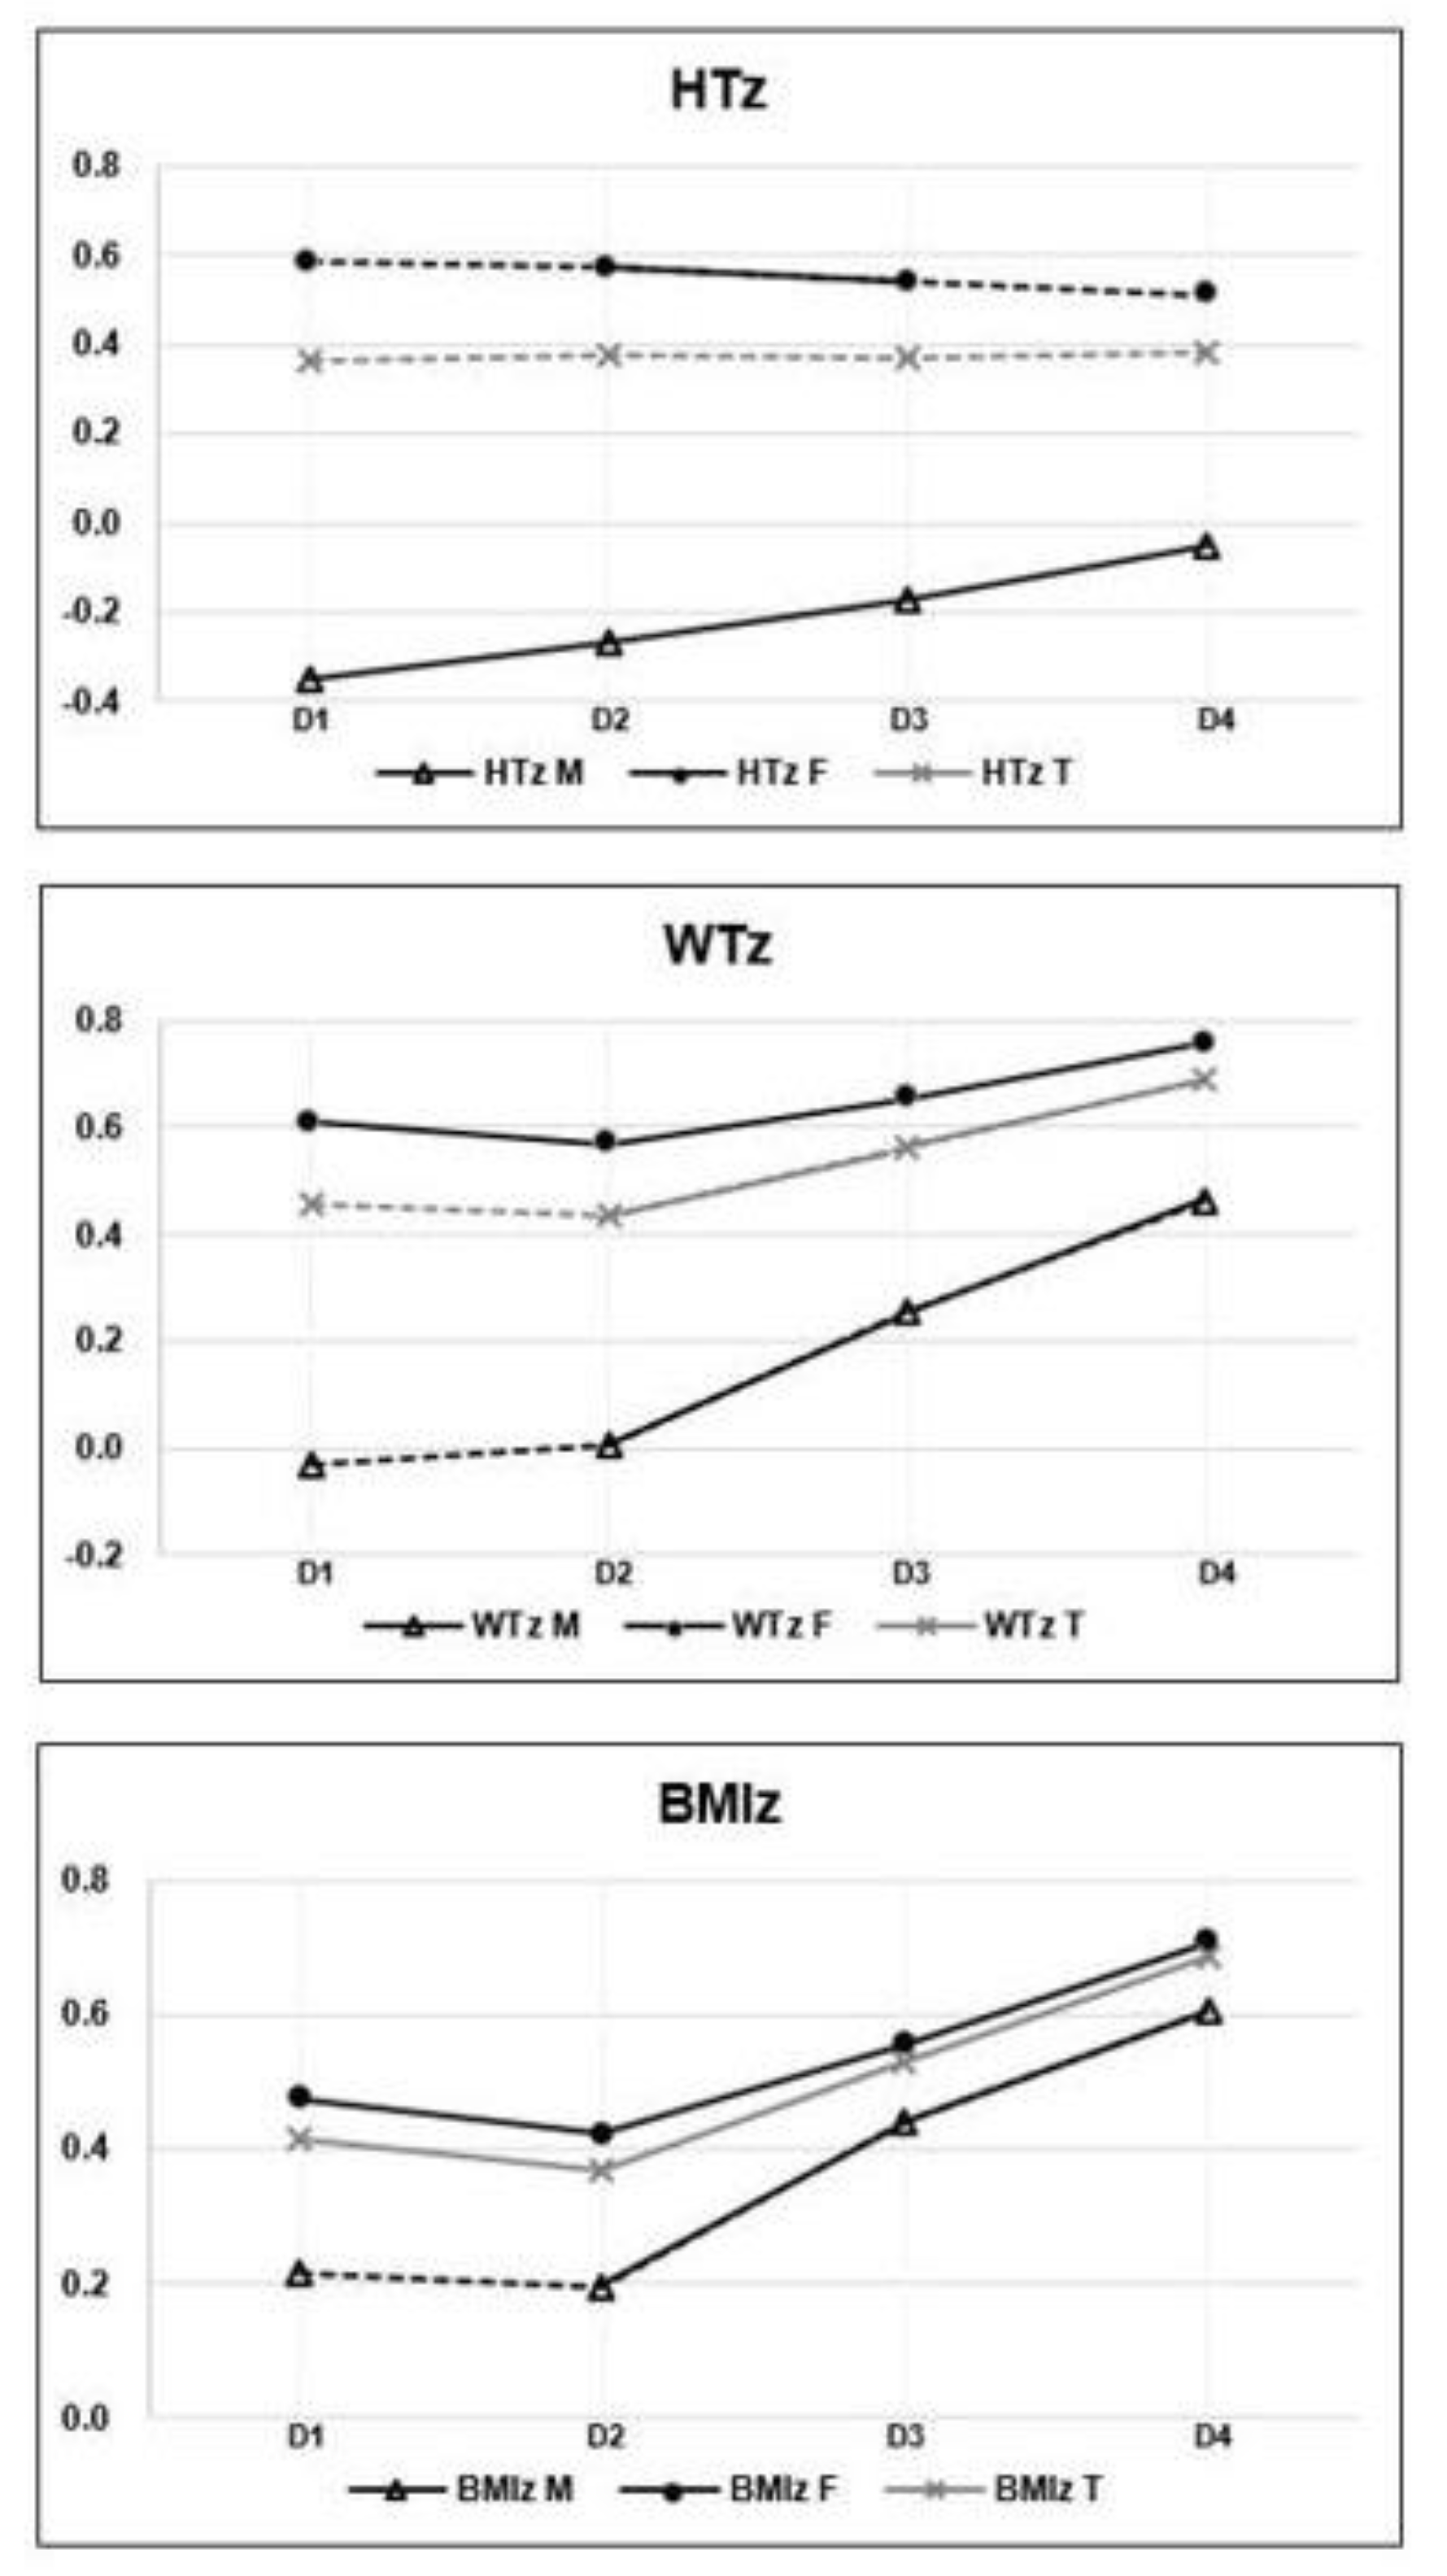
| HTz | M abc | −0.35 ± 1.25 | −0.27 ± 1.24 | −0.17 ± 1.12 | −0.05 ± 1.09 |
| F b | 0.58 ± 1.14 | 0.57 ± 1.10 | 0.54 ± 1.08 | 0.51 ± 1.06 | |
| T | 0.36 ± 1.23 | 0.37 ± 1.18 | 0.37 ± 1.13 | 0.38 ± 1.09 | |
| WTz | M bc | −0.03 ± 1.32 | 0.01 ± 1.31 | 0.26 ± 1.29 | 0.46 ± 1.40 |
| F abc | 0.61 ± 0.97 | 0.57 ± 1.00 | 0.65 ± 0.99 | 0.76 ± 1.02 | |
| T bc | 0.46 ± 1.09 | 0.44 ± 1.10 | 0.56 ± 1.08 | 0.69 ± 1.12 | |
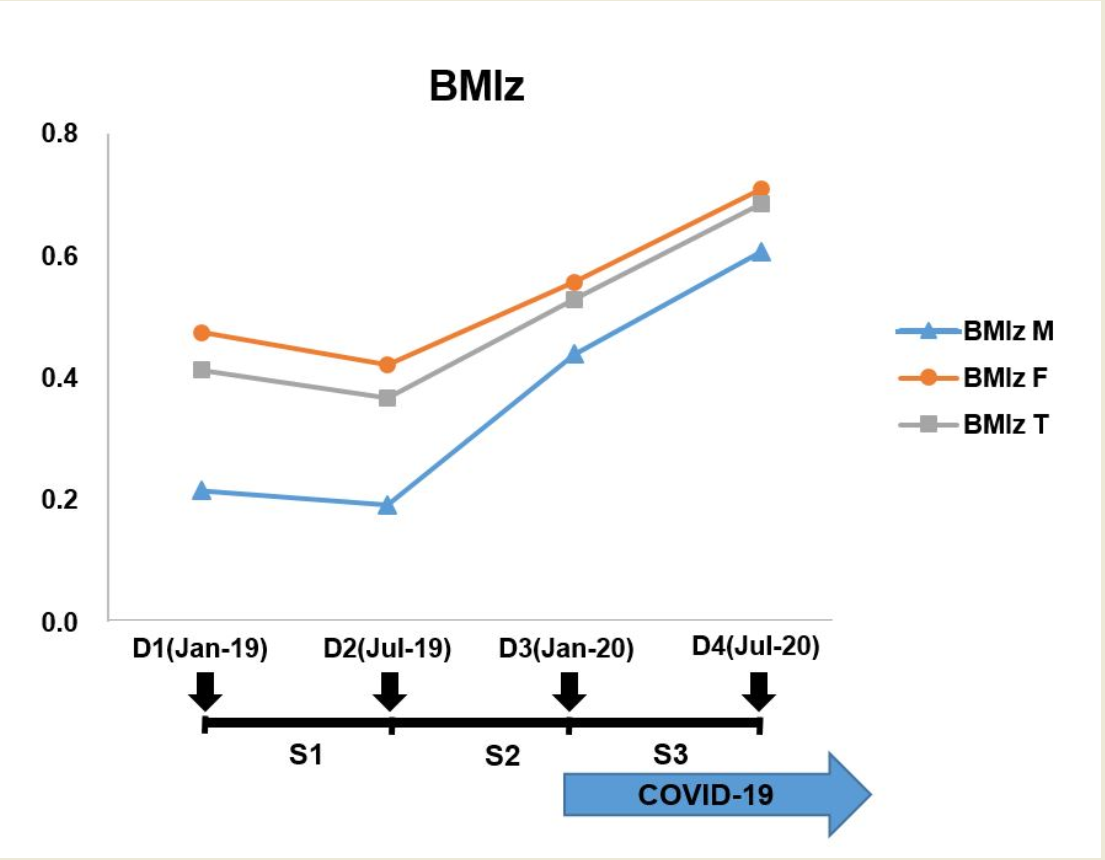
| BMIz | M bc | 0.22 ± 1.17 | 0.19 ± 1.16 | 0.44 ± 1.21 | 0.61 ± 1.36 |
| F abc | 0.47 ± 0.95 | 0.42 ± 1.00 | 0.56 ± 0.98 | 0.71 ± 1.04 | |
| T abc | 0.41 ± 1.01 | 0.37 ± 1.04 | 0.53 ± 1.03 | 0.68 ± 1.12 |
| S1 | S3 | p Value | ||
|---|---|---|---|---|
| HTz | Male | 0.08 ± 0.19 | 0.12 ± 0.23 | 0.236 |
| Female | −0.01 ± 0.17 | −0.03 ± 0.18 | 0.350 | |
| Total | 0.01 ± 0.18 | 0.01 ± 0.20 | 0.882 | |
| WTz | Male | 0.04 ± 0.27 | 0.20 ± 0.35 | 0.025 |
| Female | −0.04 ± 0.23 | 0.10 ± 0.25 | <0.001 | |
| Total | −0.02 ± 0.24 | 0.13 ± 0.28 | <0.001 | |
| BMIz | Male | −0.02 ± 0.31 | 0.17 ± 0.42 | 0.027 |
| Female | −0.05 ± 0.29 | 0.15 ±0.32 | <0.001 | |
| Total | −0.05 ± 0.30 | 0.16 ± 0.34 | <0.001 |
Publisher’s Note: MDPI stays neutral with regard to jurisdictional claims in published maps and institutional affiliations. |
© 2021 by the authors. Licensee MDPI, Basel, Switzerland. This article is an open access article distributed under the terms and conditions of the Creative Commons Attribution (CC BY) license (https://creativecommons.org/licenses/by/4.0/).
Share and Cite
Han, J.-A.; Chung, Y.-E.; Chung, I.-H.; Hong, Y.-H.; Chung, S. Impact of the COVID-19 Pandemic on Seasonal Variations in Childhood and Adolescent Growth: Experience of Pediatric Endocrine Clinics. Children 2021, 8, 404. https://0-doi-org.brum.beds.ac.uk/10.3390/children8050404
Han J-A, Chung Y-E, Chung I-H, Hong Y-H, Chung S. Impact of the COVID-19 Pandemic on Seasonal Variations in Childhood and Adolescent Growth: Experience of Pediatric Endocrine Clinics. Children. 2021; 8(5):404. https://0-doi-org.brum.beds.ac.uk/10.3390/children8050404
Chicago/Turabian StyleHan, Jin-Ah, Yae-Eun Chung, In-Hyuk Chung, Yong-Hee Hong, and Sochung Chung. 2021. "Impact of the COVID-19 Pandemic on Seasonal Variations in Childhood and Adolescent Growth: Experience of Pediatric Endocrine Clinics" Children 8, no. 5: 404. https://0-doi-org.brum.beds.ac.uk/10.3390/children8050404