
A Systematic Literature Review of Volatility and Risk Management on Cryptocurrency Investment: A Methodological Point of View


ISEG—Lisbon School of Economics & Management, Universidade de Lisboa, Advance/CSG, 1200-781 Lisboa, Portugal
*
Author to whom correspondence should be addressed.
Risks 2022, 10(5), 107; https://0-doi-org.brum.beds.ac.uk/10.3390/risks10050107
Submission received: 11 April 2022
/
Revised: 9 May 2022
/
Accepted: 13 May 2022
/
Published: 19 May 2022
Abstract
:In this study, we explore the research published from 2009 to 2021 and summarize what extant literature has contributed in the last decade to the analysis of volatility and risk management in cryptocurrency investment. Our samples include papers published in journals ranked across different fields in ABS ranked journals. We conduct a bibliometric analysis using VOSviewer software and perform a literature review. Our findings are presented in terms of methodologies used to model cryptocurrencies’ volatility and also according to their main findings pertaining to volatility and risk management in those assets and using them in portfolio management. Our research indicates that the models that consider the Markov-switching regime seem to be more consensual among the authors, and that the best machine learning technique performances are hybrid models that consider the support vector machines (SVM). We also argue that the predictability of volatility, risk reduction, and level of speculation in the cryptocurrency market are improved by the leverage effects and the volatility persistence.
1. Introduction
Cryptocurrencies are decentralized digital currencies, that rely on a peer-to-peer architecture (Lansky 2018). Despite this, much of the complexity that is felt in the cryptocurrency market is related to the fact that cryptocurrency’s value is not based on any country’s economy, tangible assets, or on any company’s fundamentals; instead, it is based on an algorithm (Corbet et al. 2019). Therefore, cryptocurrencies are widely different from commodities, equities, and foreign exchange traditional markets (Li et al. 2021).
This market also bears as characteristics, the fact of being an illiquid and highly volatile market (Wang et al. 2016; Ciaian et al. 2017; Corbet et al. 2019; Gil-Alana et al. 2020; Mba and Mwambi 2020; Fang et al. 2021). The high volatility present in this market exposes investors to high risks that can lead to large profits or to big losses. Therefore, investors need the adequate tools to account for these volatility dynamics (Mba et al. 2018; Mba and Mwambi 2020).
In this way, due to the increasing popularity of cryptocurrencies, new empirical evidence is being produced very fast; thus, there is a growing literature that analyses the volatility properties in the cryptocurrency market (see, e.g., Mba et al. 2018; Cheikh et al. 2020; Hattori 2020; Ma et al. 2020; Mba and Mwambi 2020; Aras 2021), as well as between cryptocurrencies and other financial assets (see, e.g., Baur et al. 2018; Klein et al. 2018; Peng et al. 2018; Chan et al. 2019; Garcia-Jorcano and Benito 2020; Sapuric et al. 2020; Umar et al. 2021; Uzonwanne 2021). As a result, the aggregation and synthesis of the existing knowledge, as well as the identification of literature gaps is of the utmost importance (Corbet et al. 2019; Angerer et al. 2020).
Our paper offers a bibliometric analysis and a systematic literature review, focusing on cryptocurrency volatility and risk management, thus, contributing to the important but unconsolidated topic of cryptocurrency investment.
Our motivation to employ a systematic literature review in this study is twofold:
First, this paper is motivated by the necessity of consolidation and a deeper understanding of the growing academic literature on cryptocurrency’s volatility and risk management. Through a systematic literature review approach, we can provide a better understanding of the existing knowledge on cryptocurrency investment as well as facilitate future research by identifying literature gaps.
Secondly, since the cryptocurrency market is maturing, provide useful research findings for investors, academics, professionals, policymakers, businesses, and society, and make clearer the risks and benefits of cryptocurrency investment.
Our intended contribution in this paper is to provide the most comprehensive and up-to-date literature review on the volatility and risk management of cryptocurrency investment so that investors can better perform on their investments.
In our research, we use the Clarivate Web of Science (WoS) database and decided to consider more comprehensive keywords, thus not limiting the possible contributions of more peripheral studies to the subject. Through this methodology, and the use of bibliometric coupling of VOSviewer software, a cluster related to volatility and risk management in the cryptocurrency market naturally emerges.
The remainder of the paper is structured as follows: In Section 2, Methodology, we highlight the way this review has been carried out. In Section 3 we conduct our sample bibliometric analysis. Section 4 presents the literature analysis of knowledge acquired regarding volatility and risk management in cryptocurrencies. Lastly, in Section 5, we provide conclusions and point out future research venues.
2. Methodology
In this study, we followed a systematic review process. In this regard we decided to search in the Web of Science database (WoS) following Liang et al. (2016); Linnenluecke et al. (2020); Jiang et al. (2021) and Yue et al. (2021), thus guaranteeing the integrity of our sample.
We searched the WoS database from the years 2009 (1 January 2009) until 2021 (4 November 2021). Our starting date is justified by the fact that the first published paper in the cryptocurrency literature was by Satoshi Nakamoto in 2008.
When considering our research keywords, we took into account a broader keywords scope, since we do not consider restrictive words regarding volatility and risk management in the cryptocurrency market, thus opting for a different approach from authors such as: Flori (2019); Kyriazis et al. (2020); Haq et al. (2021); Jalal et al. (2021). The selected keywords were: “Cryptocurrency”, “Cryptocurrencies”, “Bitcoin”, “Portfolio diversification”, “Investment”, “Investor”, “investors”, “Alternative investment”. Then, using the wildcard character and the Boolean operators, the research equation took the following form: “cryptocurrenc* OR Bitcoin AND diversification AND portfolio AND invest* AND alternative”.
We also decided as quality criteria to only include academic journals from the Academic Journal Guide ABS (Association of Business Schools) list of 2021, that were written in English, and that addressed the topic of cryptocurrencies through the investor/investment perspective.
As a result, since in our research we do not use any restrictions for the areas of knowledge, in addition to the literature fixed exclusively on volatility and risk management in the cryptomarket, we also achieve the contribution of peripheral studies, thus contributing to the enrichment of this study.
Following the indications of Ding et al. (2014); van Eck and Waltman (2017); Galvao et al. (2019); Rialti et al. (2019); Bartolacci et al. (2020) and Sadeghi Moghadam et al. (2021), we have selected VOSviewer 1.6.17 for our bibliometric analysis.
The bibliometric coupling option aggregates the articles by clusters that cite more than one common article (van Eck and Waltman 2017; Bartolacci et al. 2020), showing the proximity between articles through their shared references (Rialti et al. 2019; Bartolacci et al. 2020).
Considering the fact that the number of cited references does not change over time, allowing for the replication of our analysis, we adopt the bibliometric coupling option of VOSviewer in our analysis (Caputo et al. 2019; Bartolacci et al. 2020). We also considered the normalized citation option available, since it divides the number of citations of an article by the average citations of all articles of the same year in the dataset, therefore reducing the bias against new articles (van Eck and Waltman 2017; Caputo et al. 2019; Bartolacci et al. 2020).
Thus, through VOSviewer bibliometric coupling a cluster referring to volatility and risk management in the cryptocurrency market naturally emerges, which we will analyze in Section 4 of this study.
3. Bibliometric Analysis
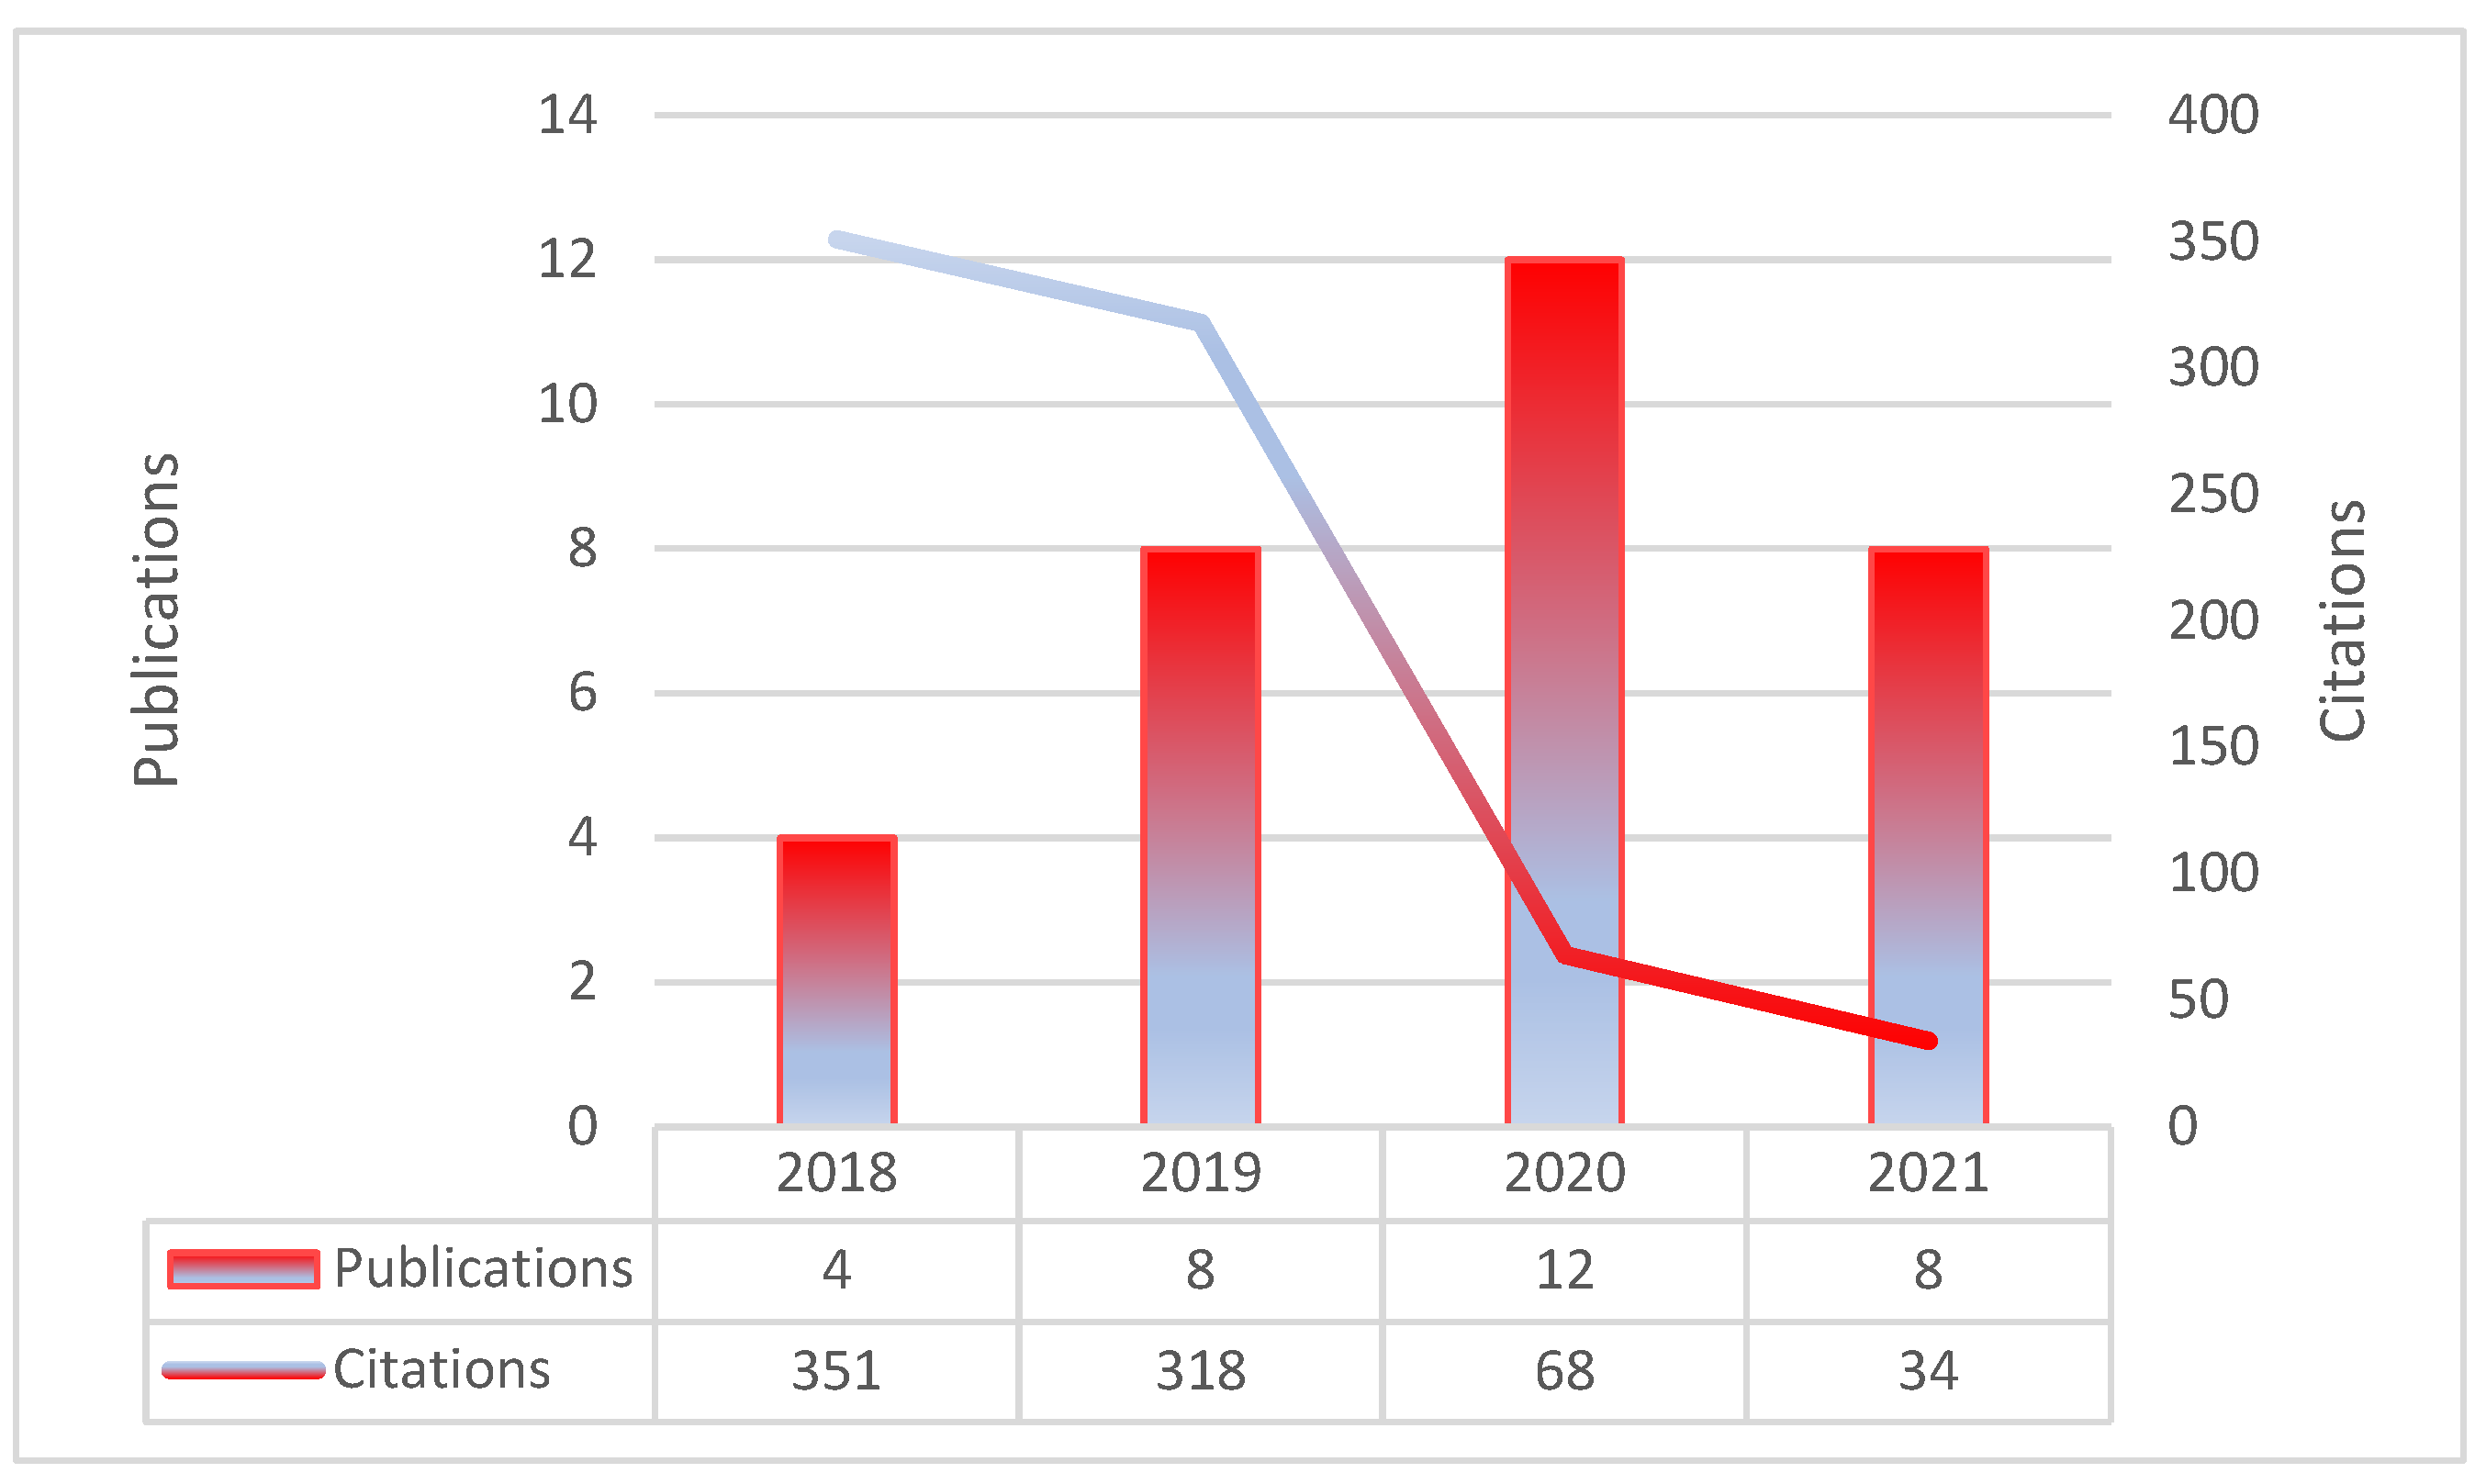
Our first analysis addresses the number of publications related to volatility and risk in the cryptocurrency market. Considering our quality criteria, and through the analysis of Figure 1, we can identify that the publication of papers in this area of research has grown from a publication of 4 articles in 2018 to 12 published articles in 2020. However, it is also evident that there was a decrease in published articles in 2021. The year 2020 was the most productive year in the field of cryptocurrencies’ volatility and risk research.
3.1. Top Articles
In Table 1 we present the top 10 articles that encompass several issues related to volatility and risk management in cryptocurrency investment. In this way, we can point out that the most cited article was Klein et al. (2018), followed by Baur and Dimpfl (2018), and Peng et al. (2018). Thus, showing that the three most cited articles are from the first year of our dataset (2018), a fact that potentially justifies their higher citation rate.
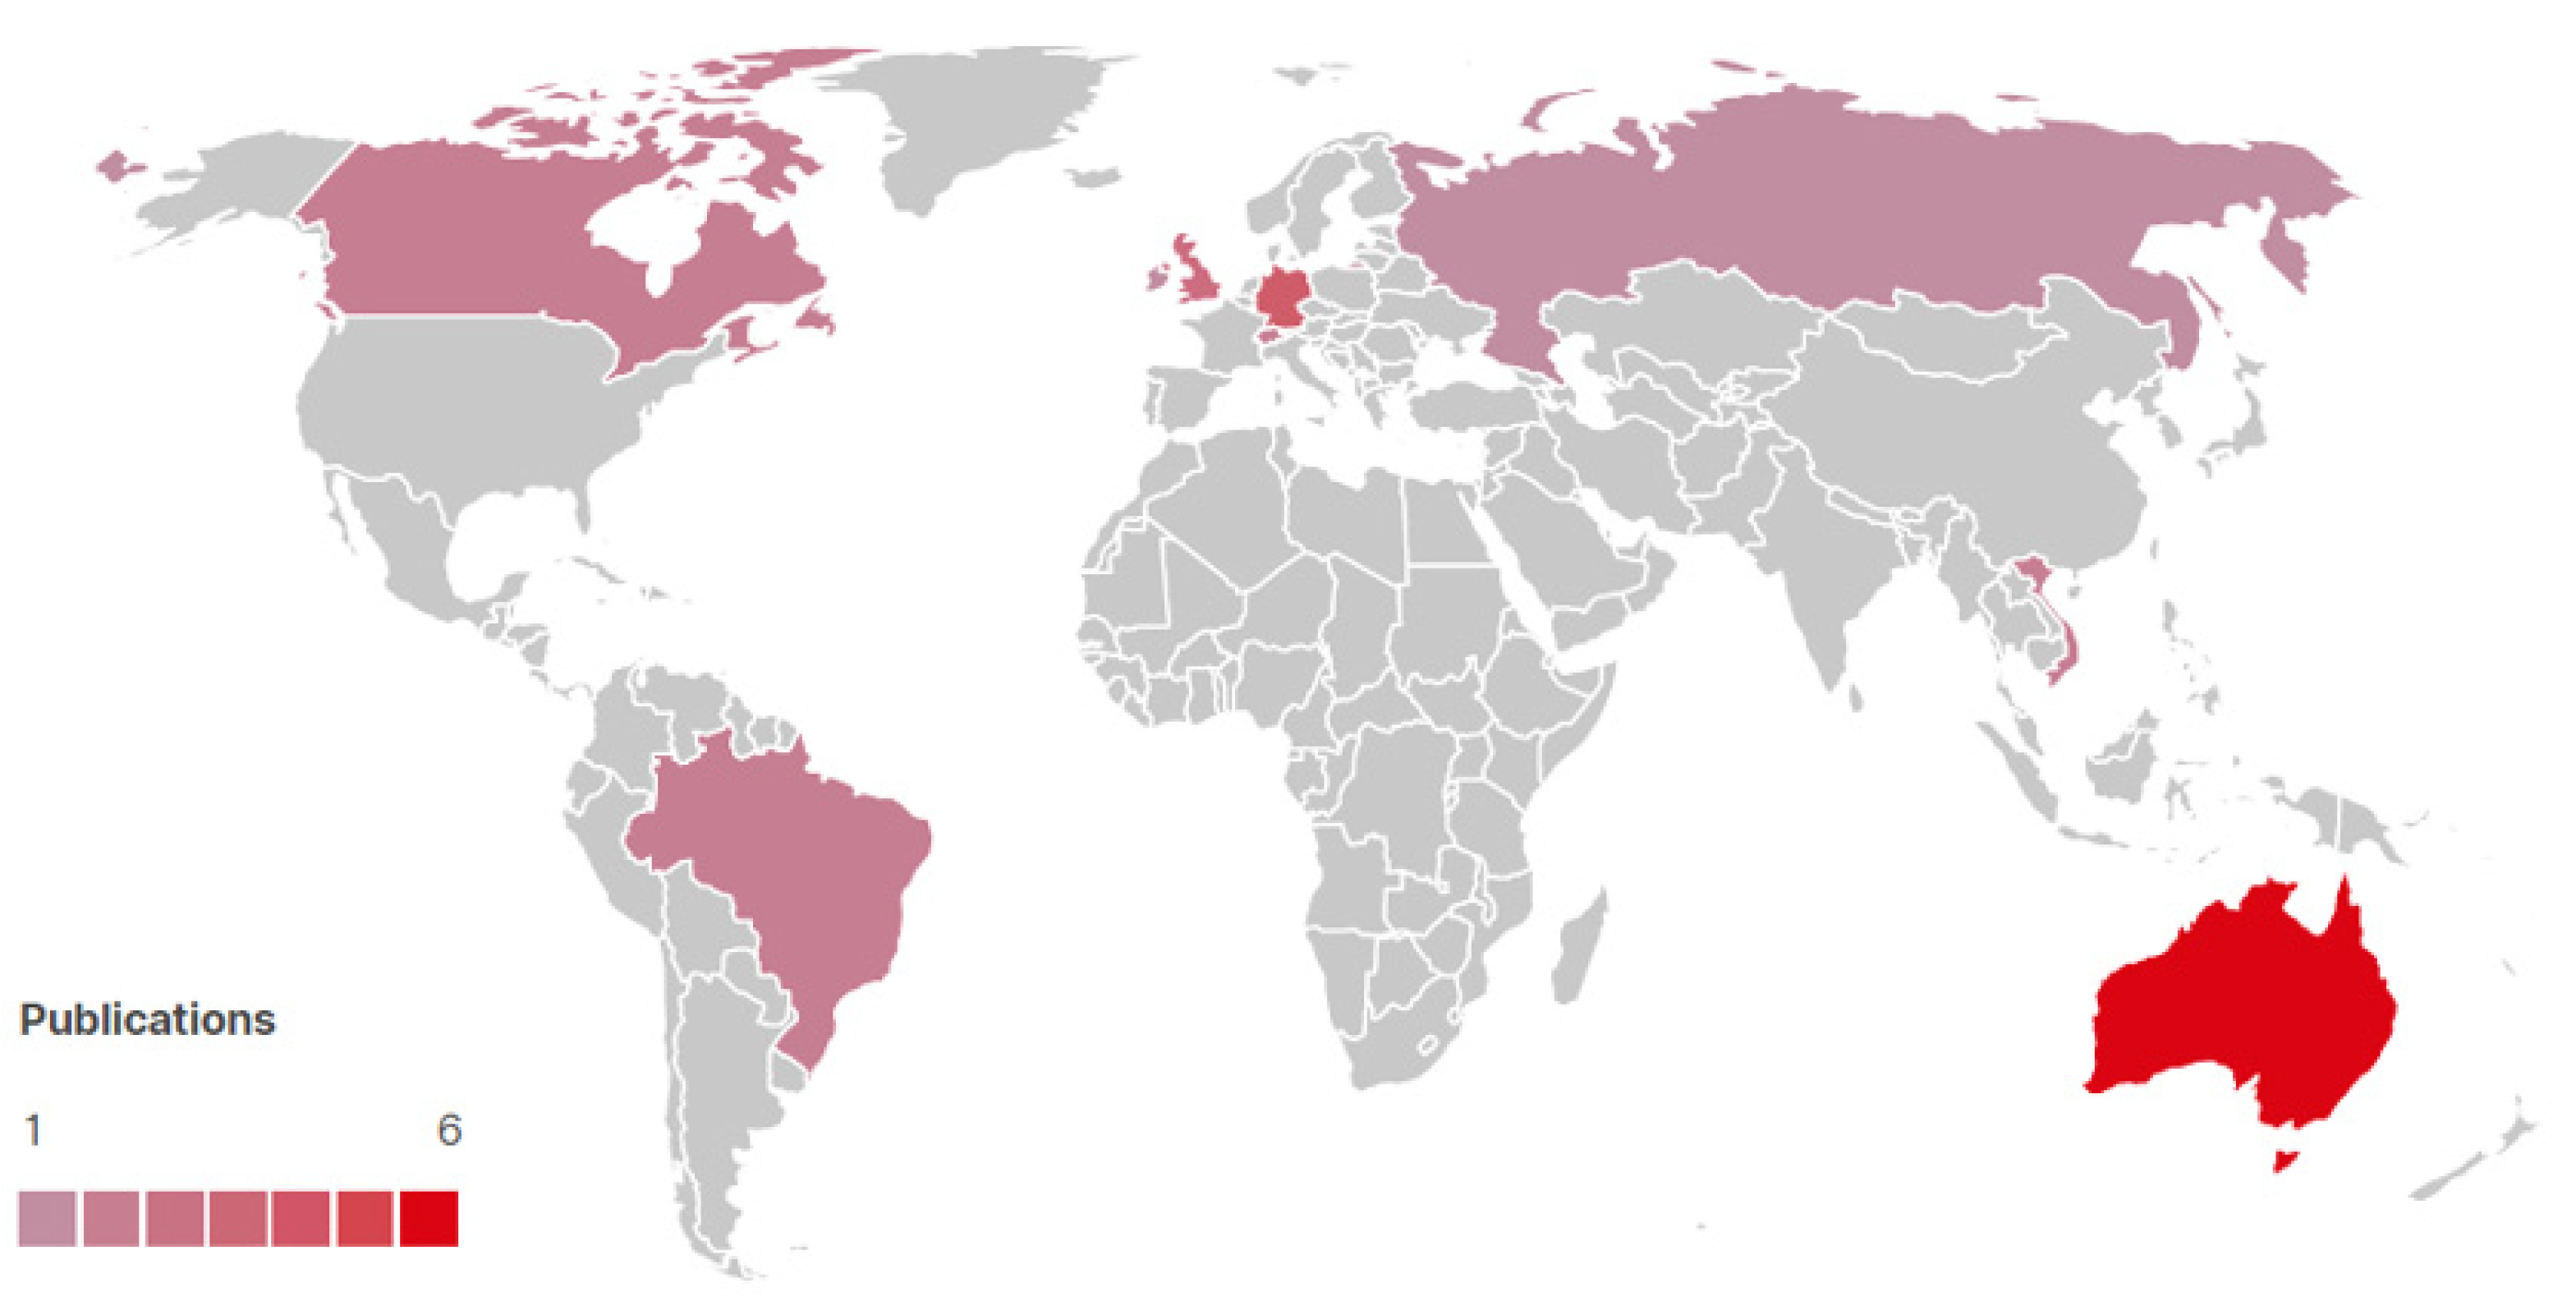
3.2. Countries
Table 2 shows countries’ contributions to our research field. Germany stands out as the most cited country with 318 citations, Northern Ireland comes in second with 226 citations, and Switzerland in third, also with 226 citations. Australia is the country with more publications on cryptocurrencies’ volatility and risk research. However, the citations per publication ratio is one of the lowest in the top ten countries.
Regarding the citations per publication ratio both Northern Ireland and Switzerland have the highest ratio (226) with two publications each (Figure 2).
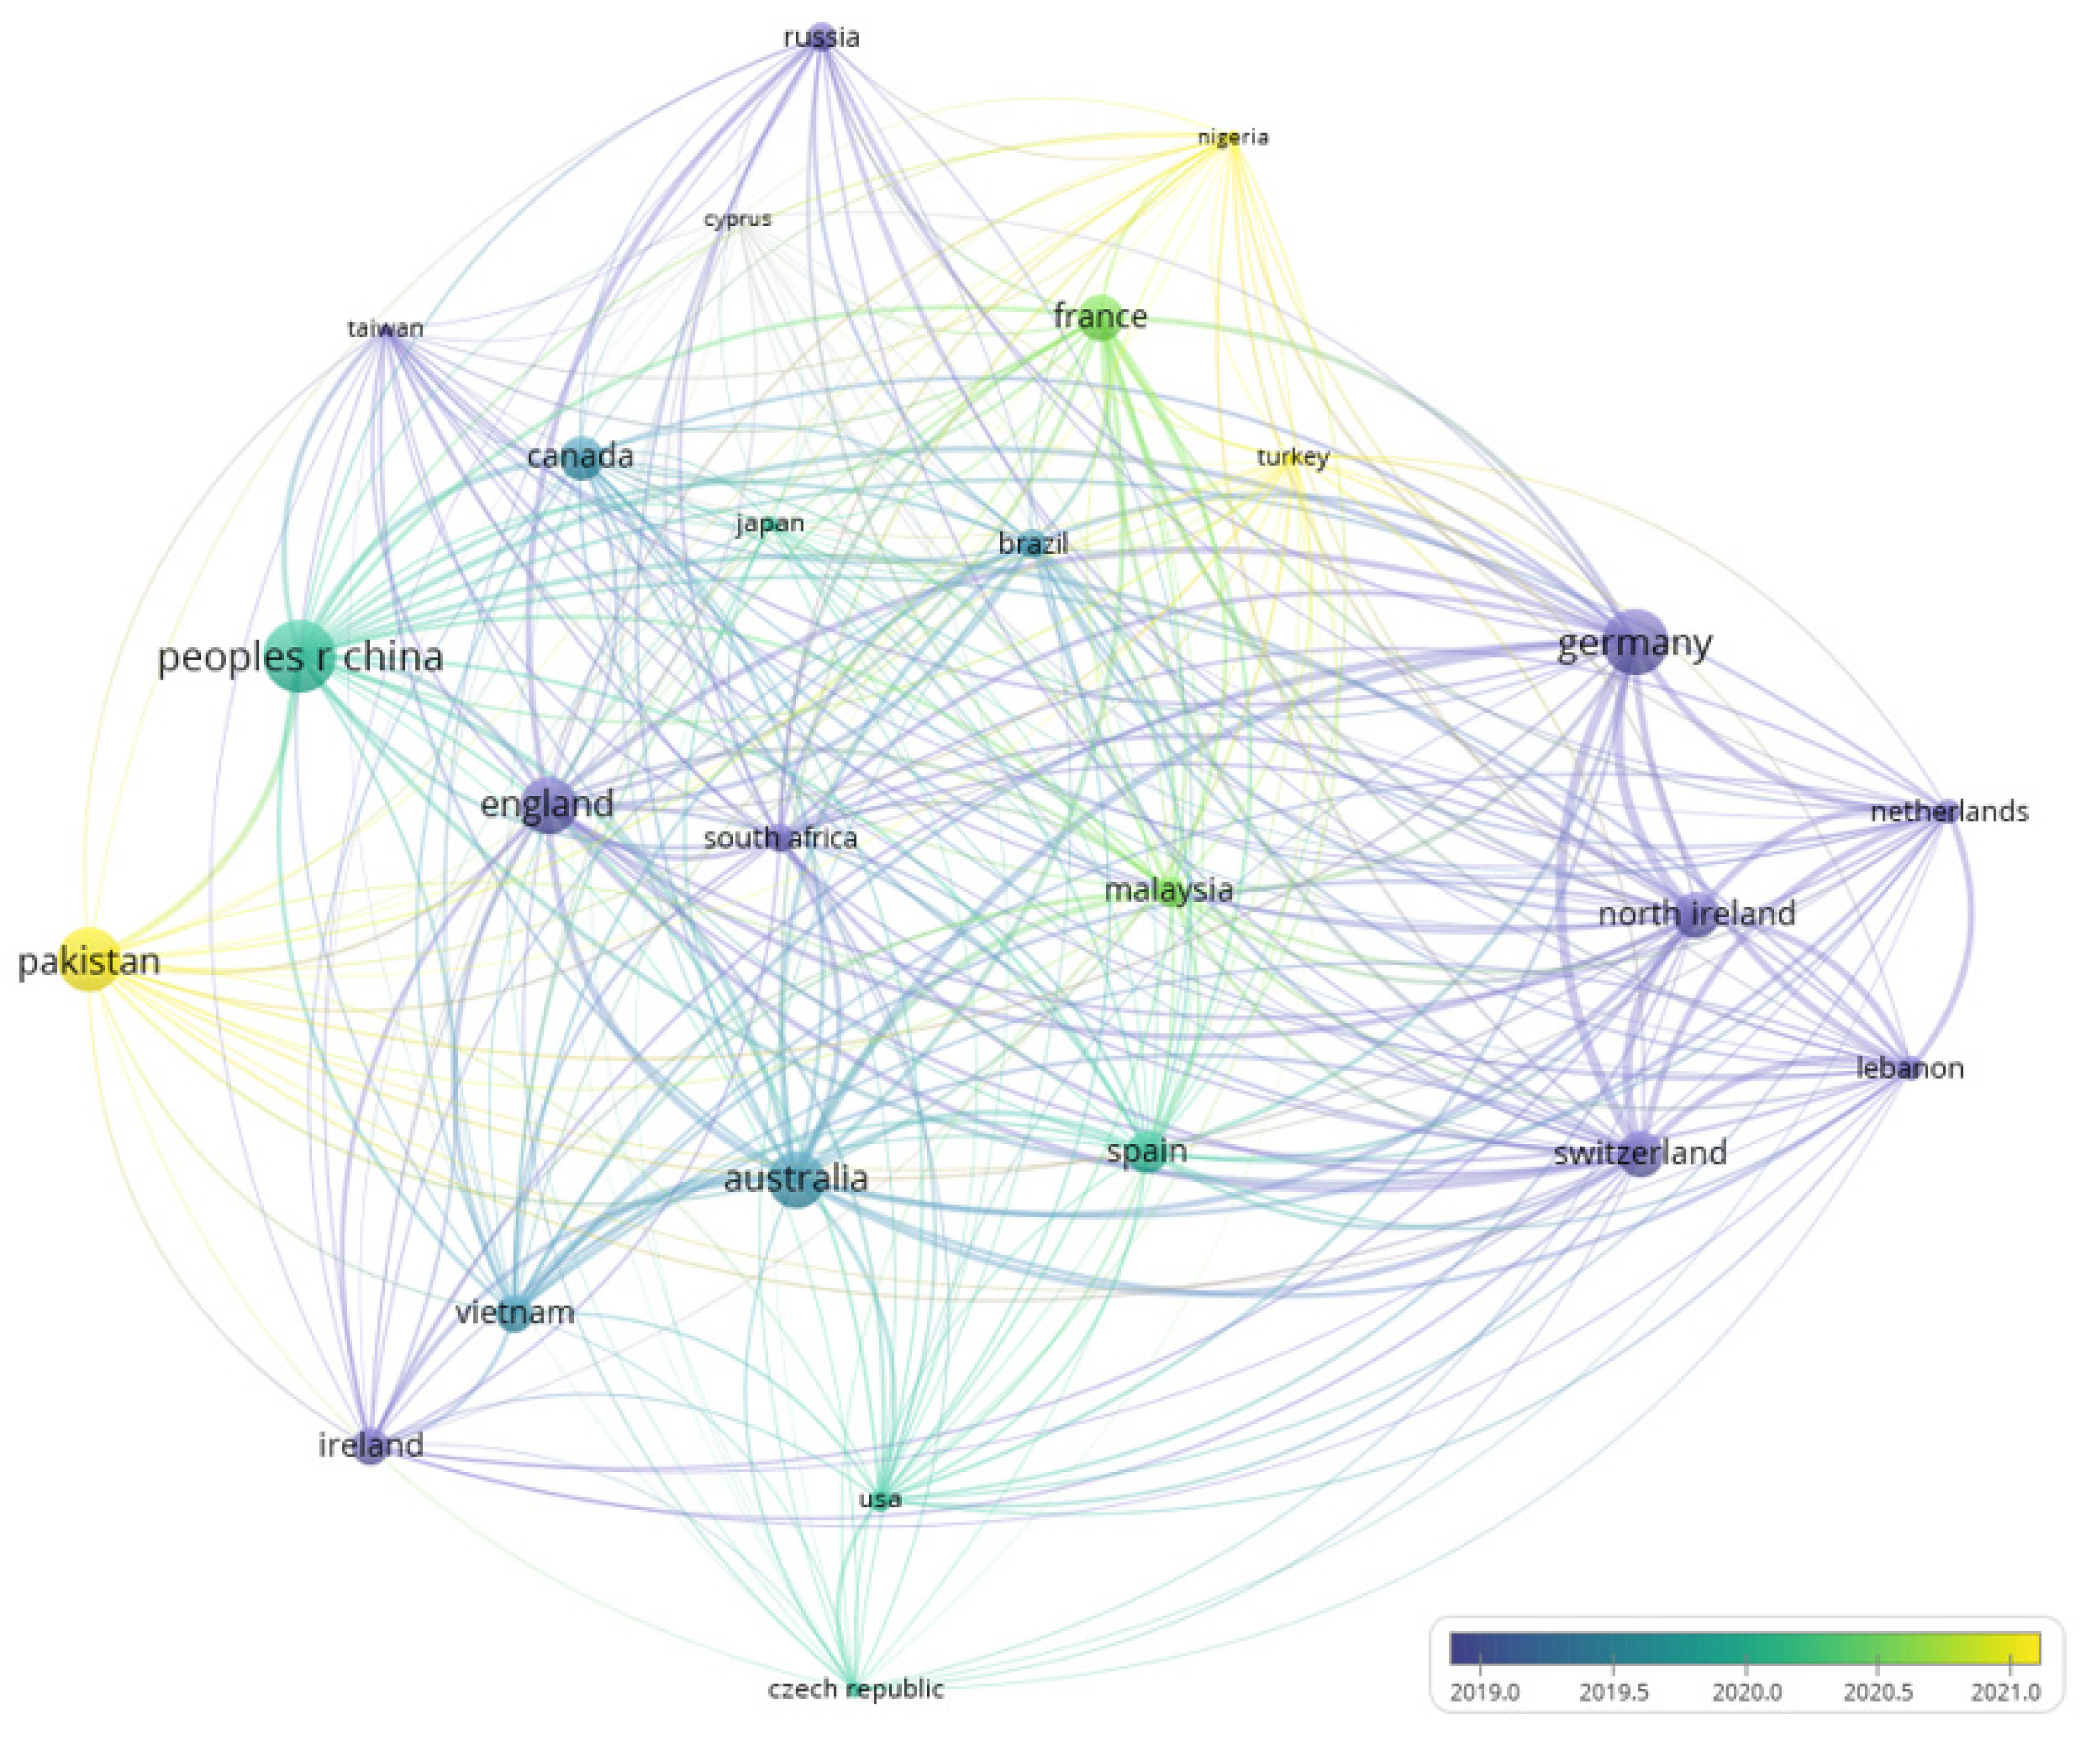
Figure 3 illustrates that, regarding normalized citations, the most cited countries are China, Germany, Australia, England, and Pakistan. However, their contributions vary across the time period between 2019 and 2021. Germany and England had more citations in the year 2019. China and Australia are the most cited countries in 2020. Pakistan is the country that contributes the most to our research field in 2021.
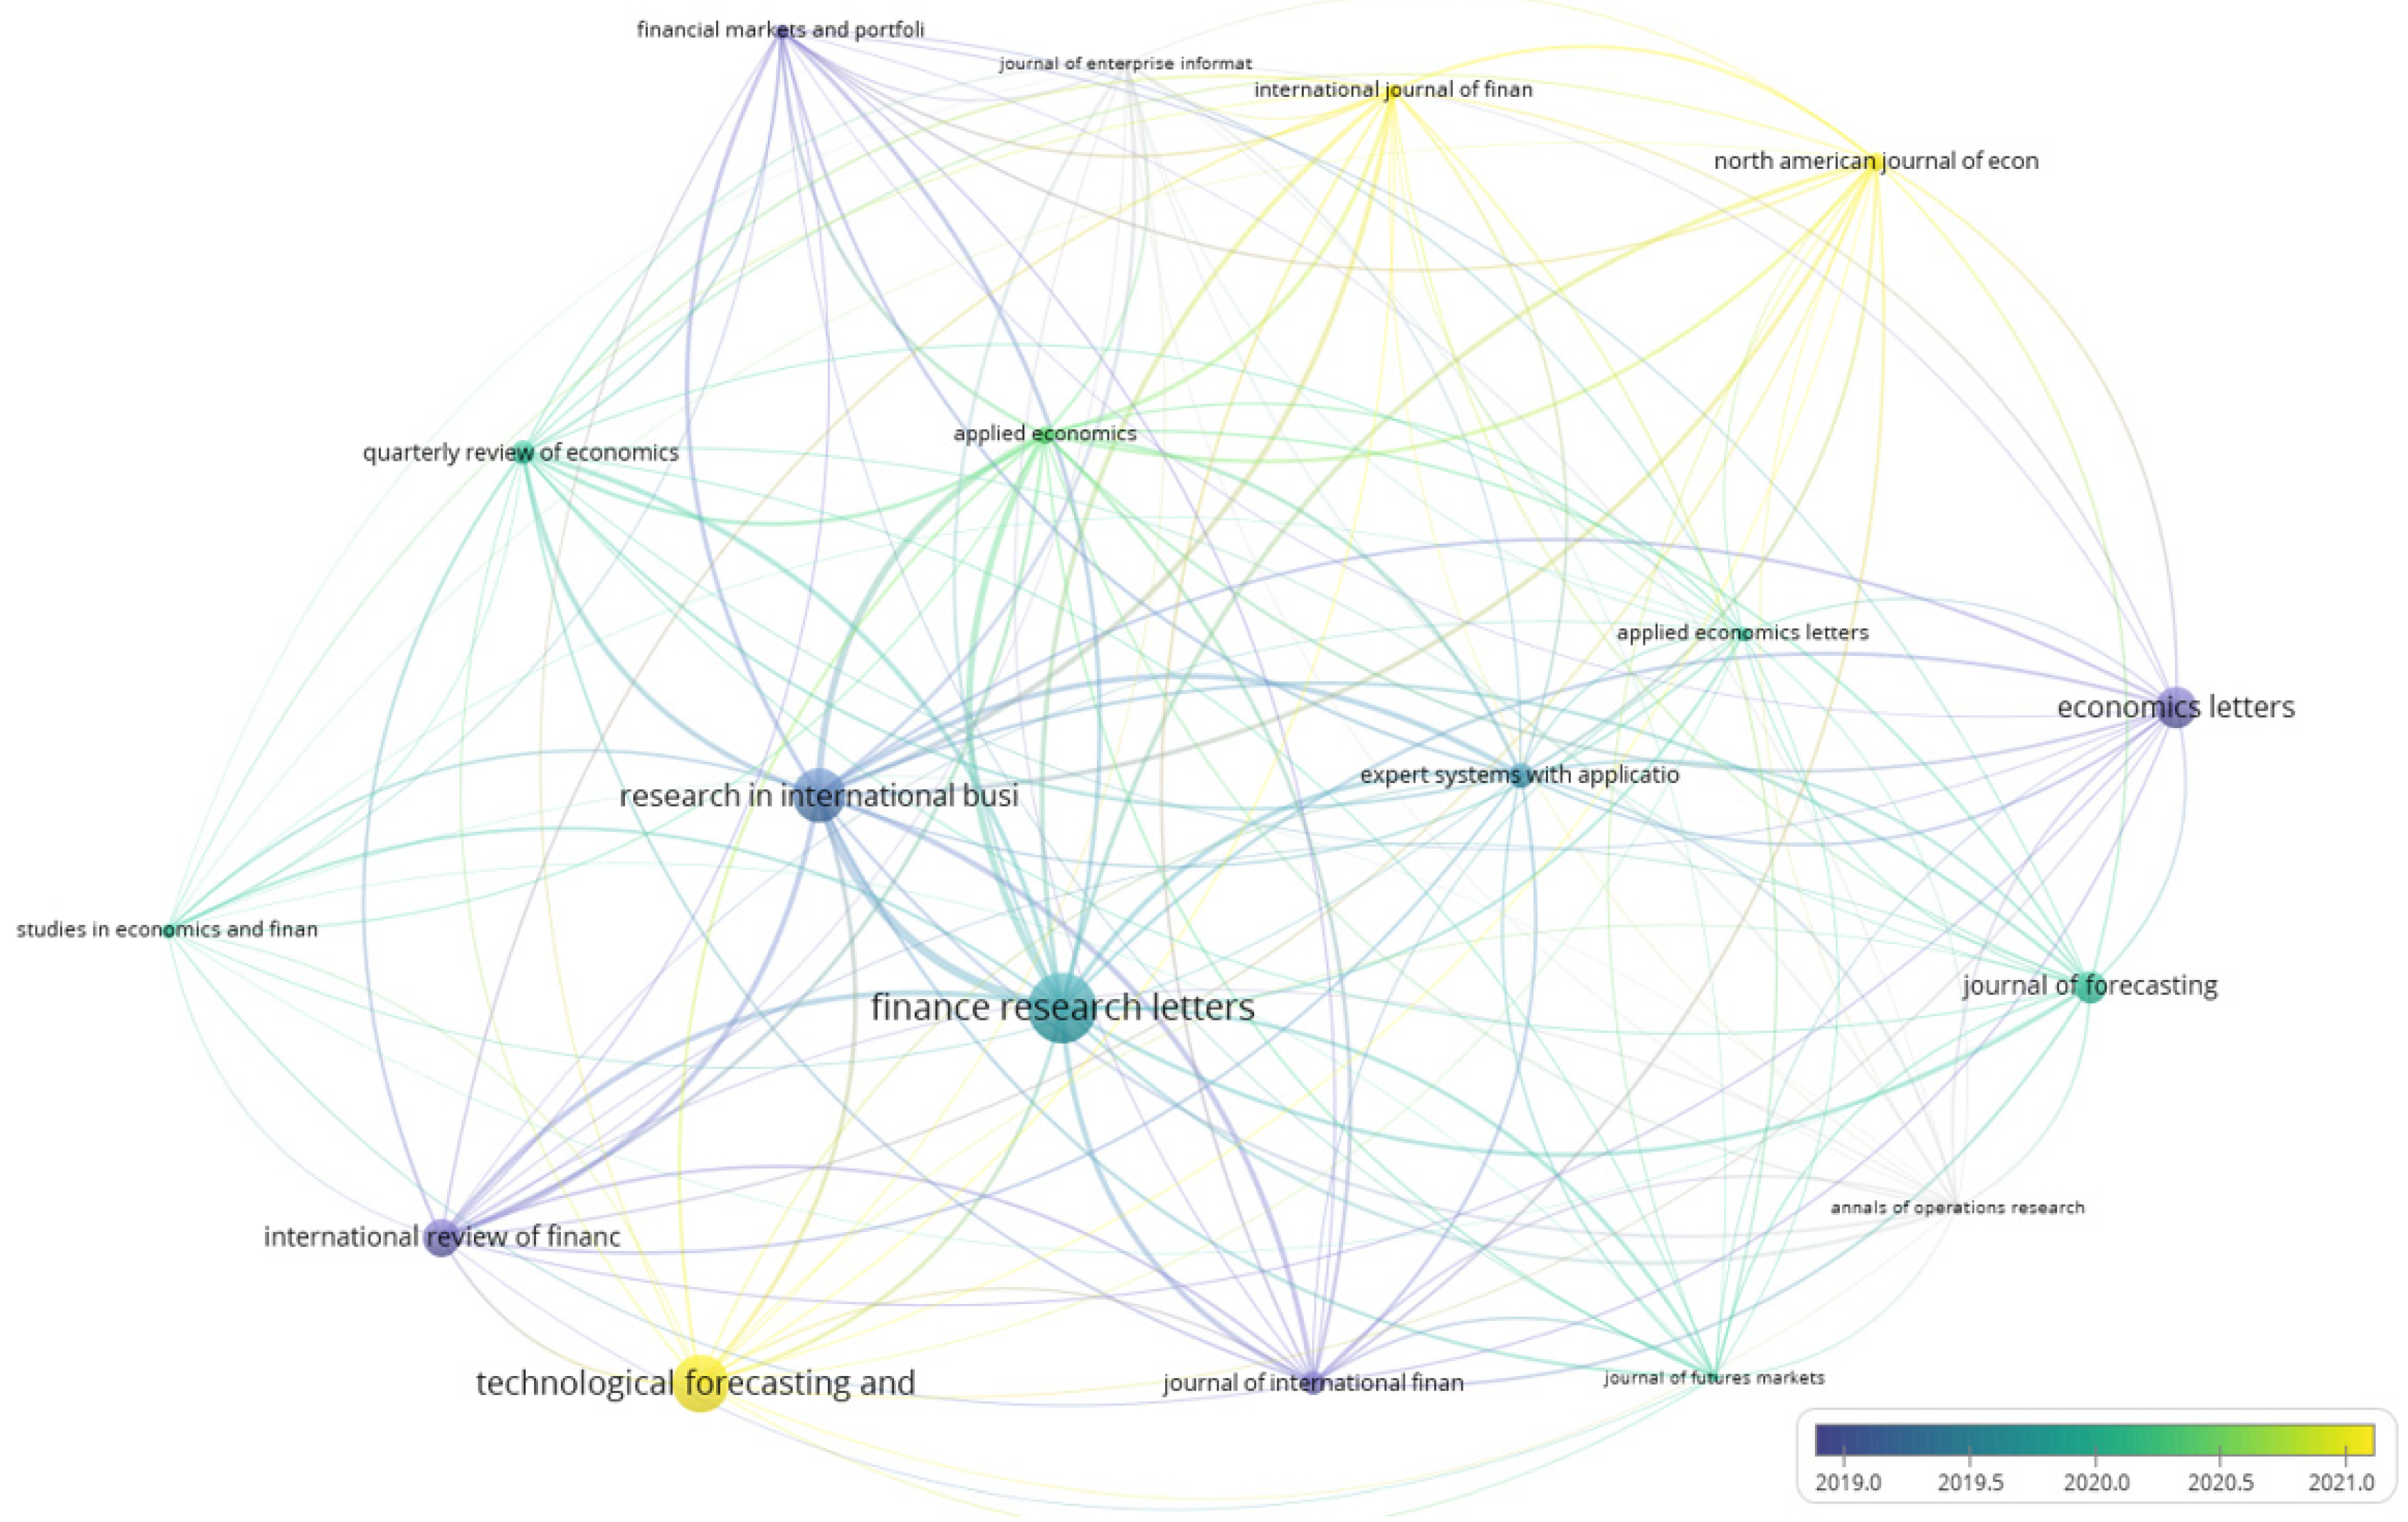
3.3. Journals
Table 3 presents the analysis of the journals that contributed the most to the volatility and risk research field. International Review of Financial Analysis is the most cited journal in our dataset with 192 citations. However, the journal with more publications is Finance Research Letters (6). Ranked in second place is Research in International Business and Finance with 145 citations, followed by Finance Research Letters with 135 citations.
Regarding the citations per publication ratio, the International Review of Financial Analysis is again the journal that stands out with the highest ratio (192) and just only one contribution to the volatility and risk research field.
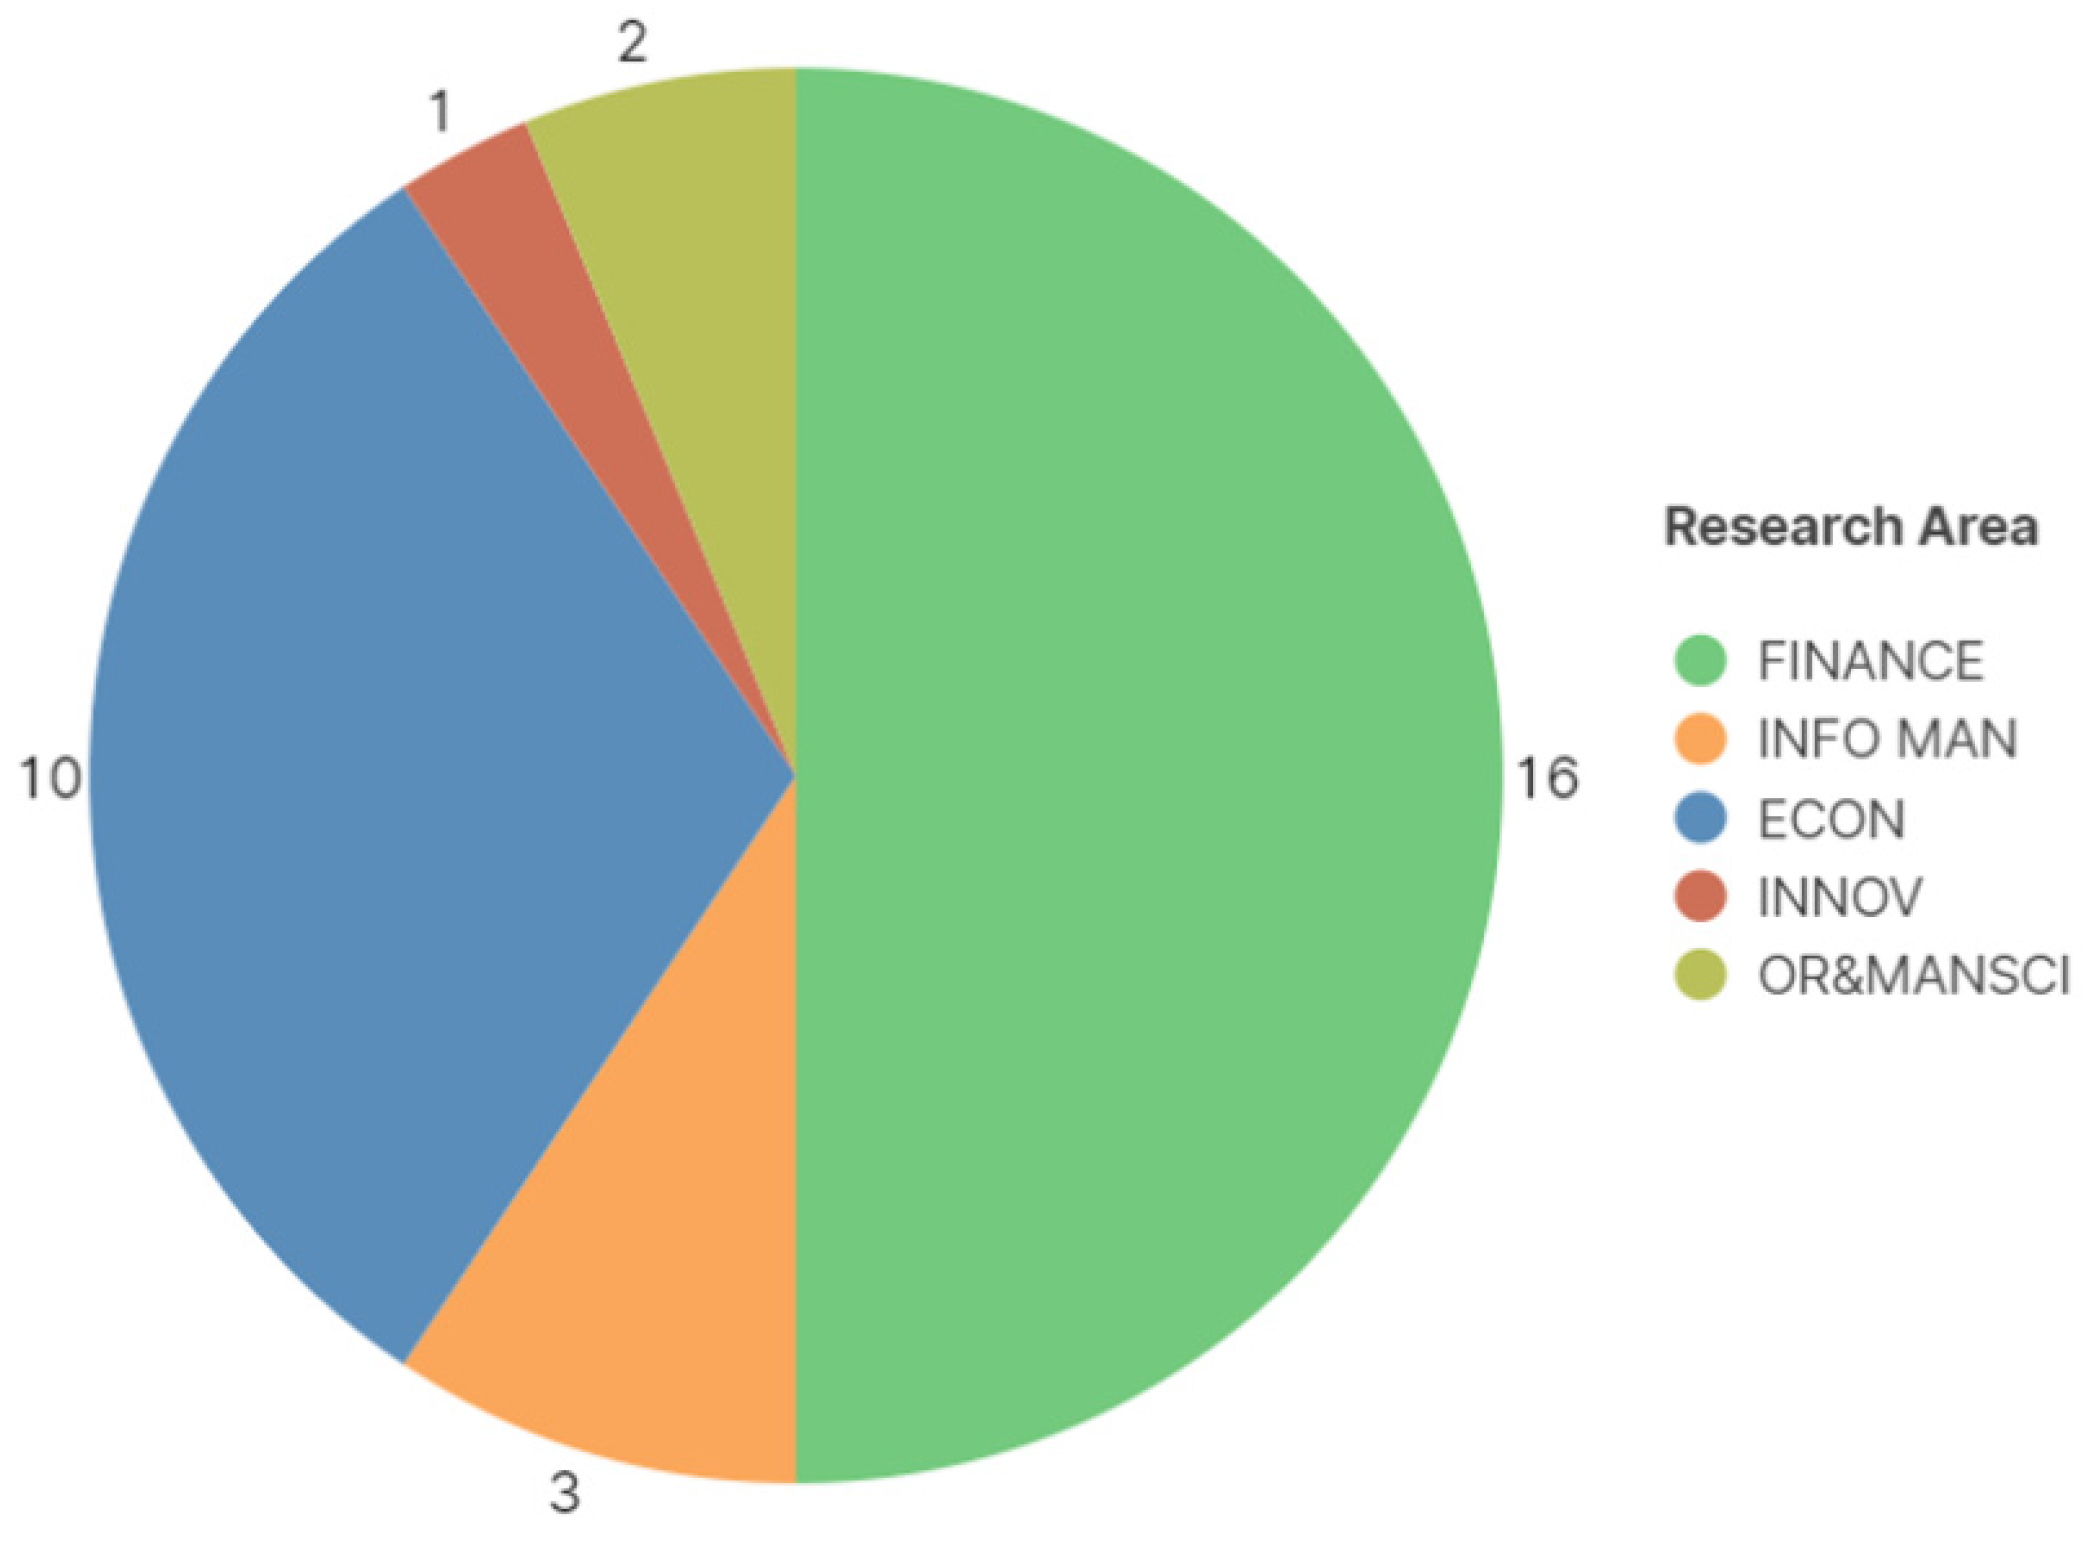
Analyzing research areas that contribute to volatility and risk management in cryptocurrencies (Figure 4) we find, as expected, that finance and economy are the most contributing ones, with 16 and 10 publications, respectively.
Figure 5 highlights, regarding normalized citations, that Finance Research Letters is the most cited journal around the year 2020. Economic Letters and International Review of Financial Analysis were the most cited journals in the year 2019. The Technological Forecasting and Social Change is the most cited journal that contributed to our research field in 2021.
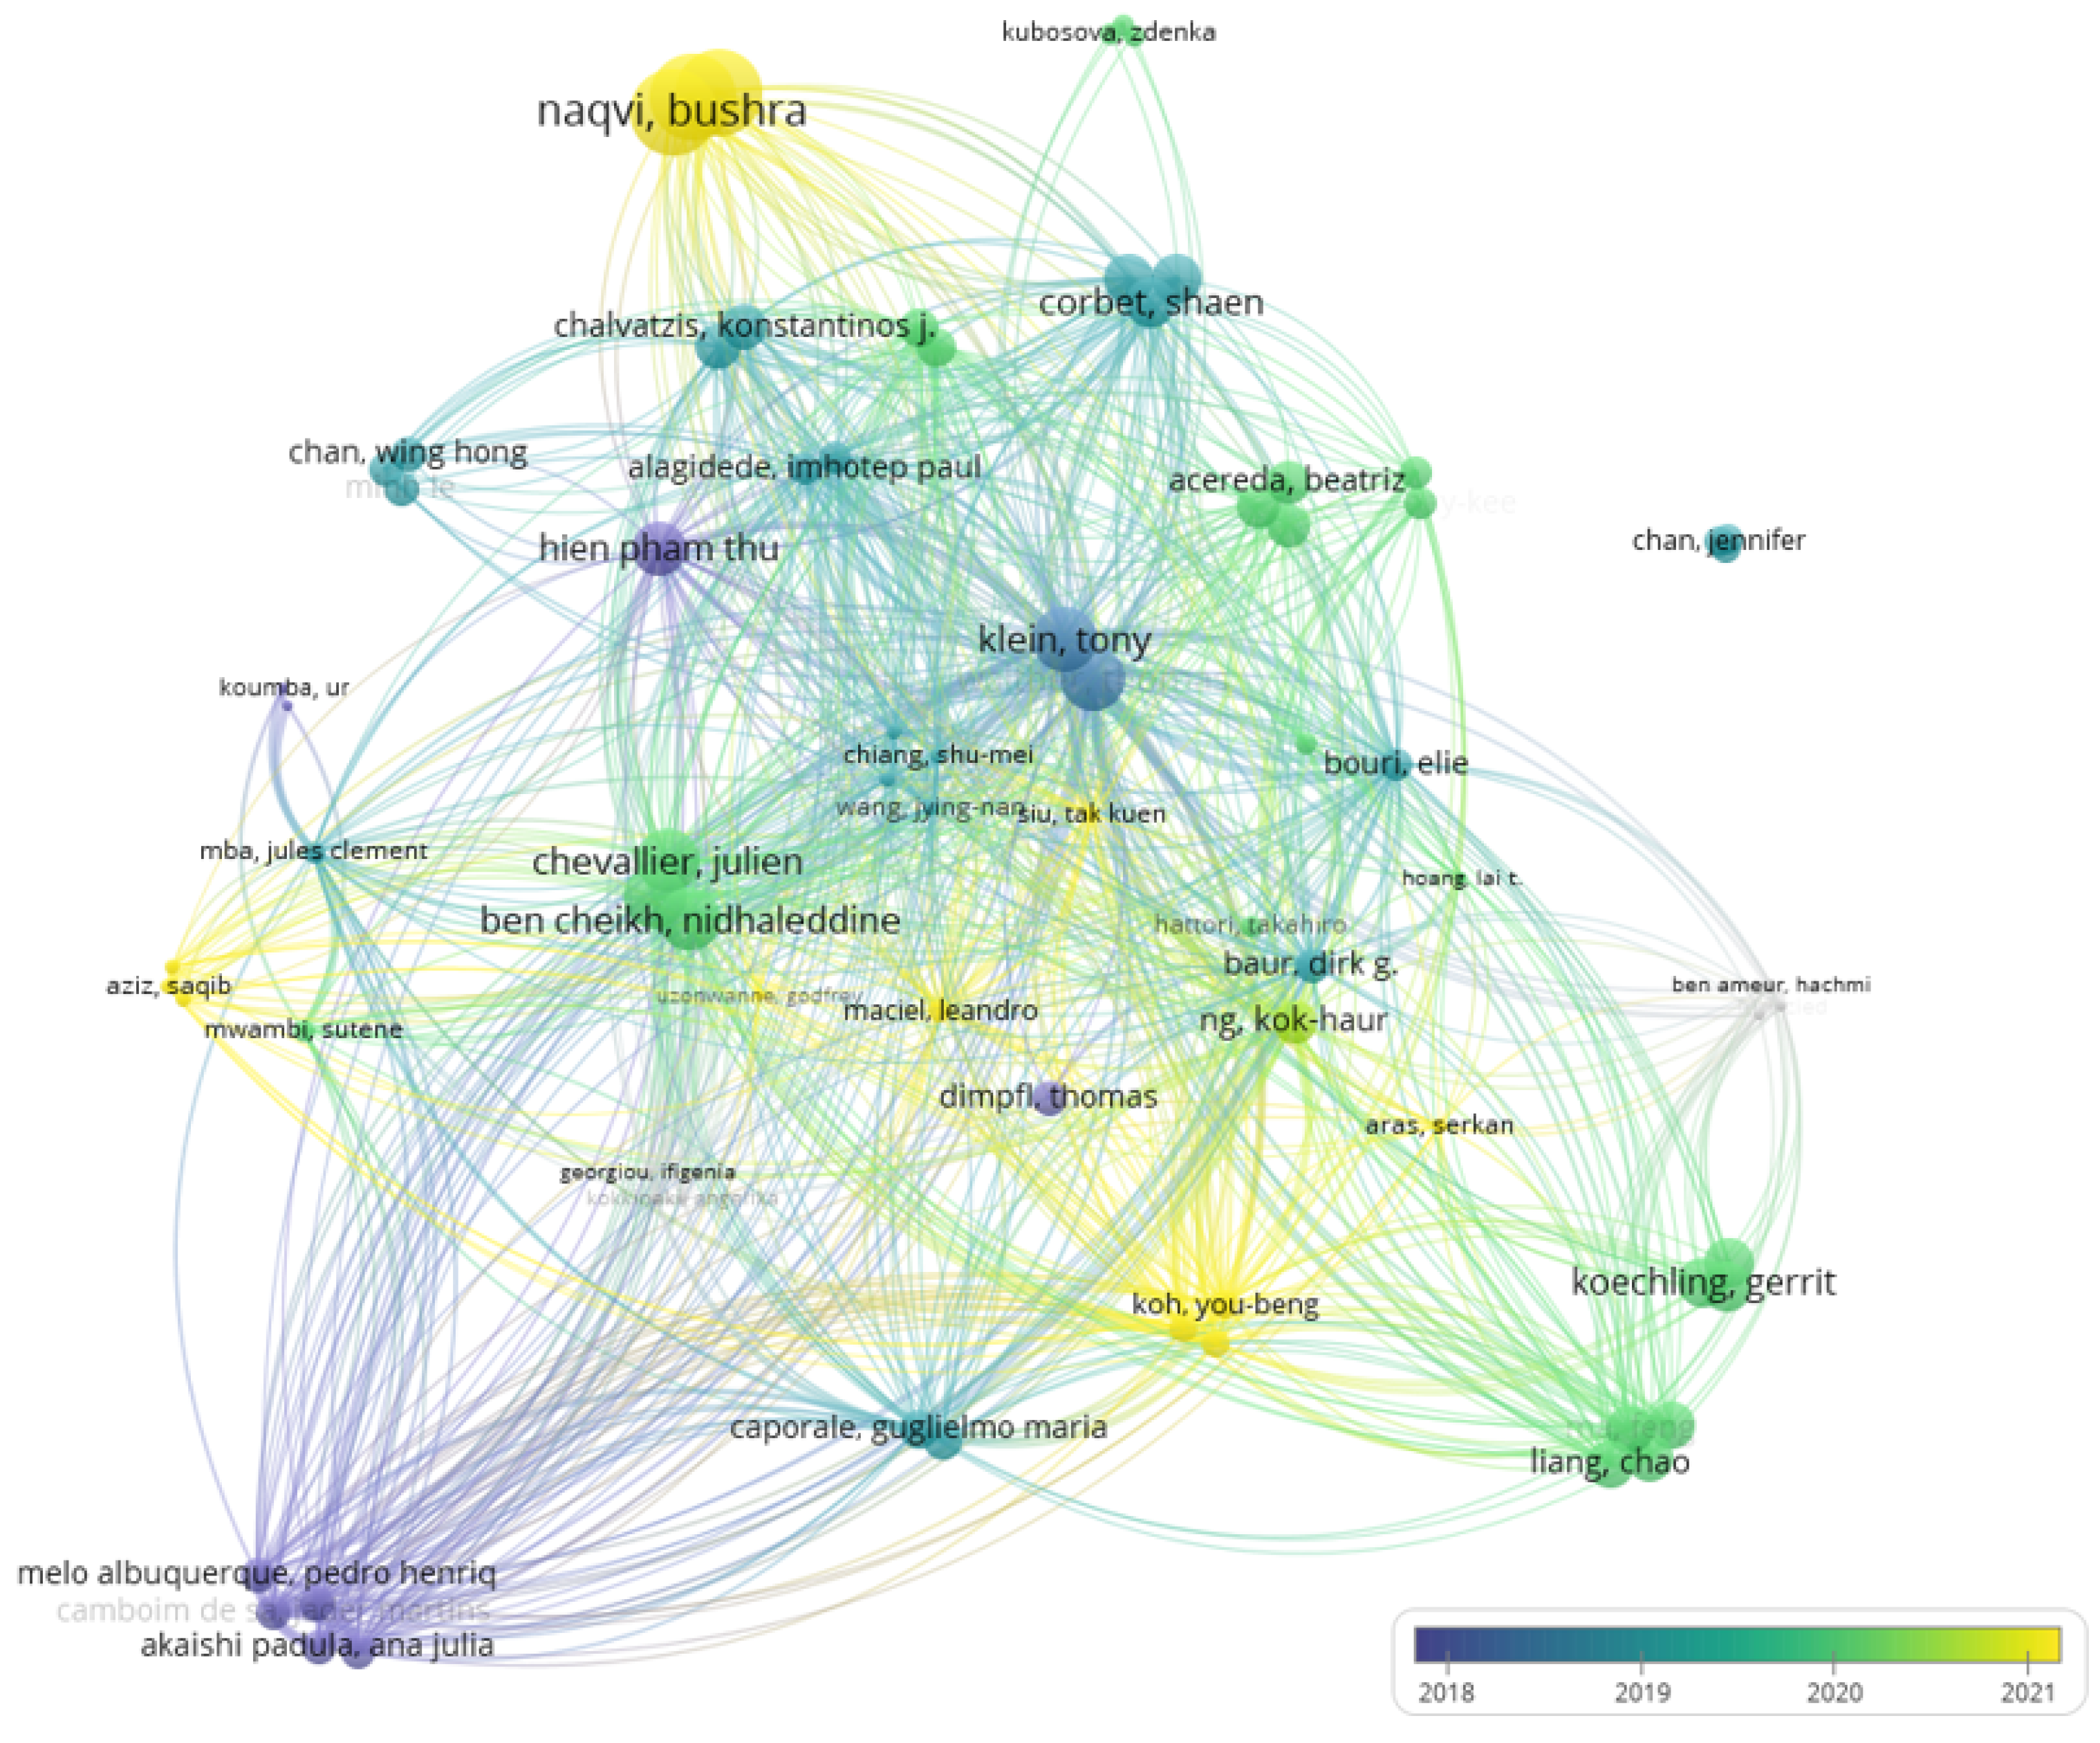
3.4. Authors
In Table 4 we present the most cited authors in cryptocurrencies’ volatility and risk research field. Appearing up top Klein, Tony and Walther, Thomas, as the most cited two authors in the dataset, with 226 citations each. In the third position appears Hien Pham Thu with the highest citation per publication ratio of 192, having only one published article.
In the analysis of Table 4, we can also see that Klein, Tony and Walther, Thomas are the authors that have contributed the most with two articles each.
Figure 6 evidences, regarding normalized citations, that Pham Thu, Ana Julia, and Pedro Henrique were the most cited authors in the year 2018, Julien, Nidhaleddine, and Gerrit in 2020, and in 2021 Bushra, Muhammad, and Abbas are the most cited authors.
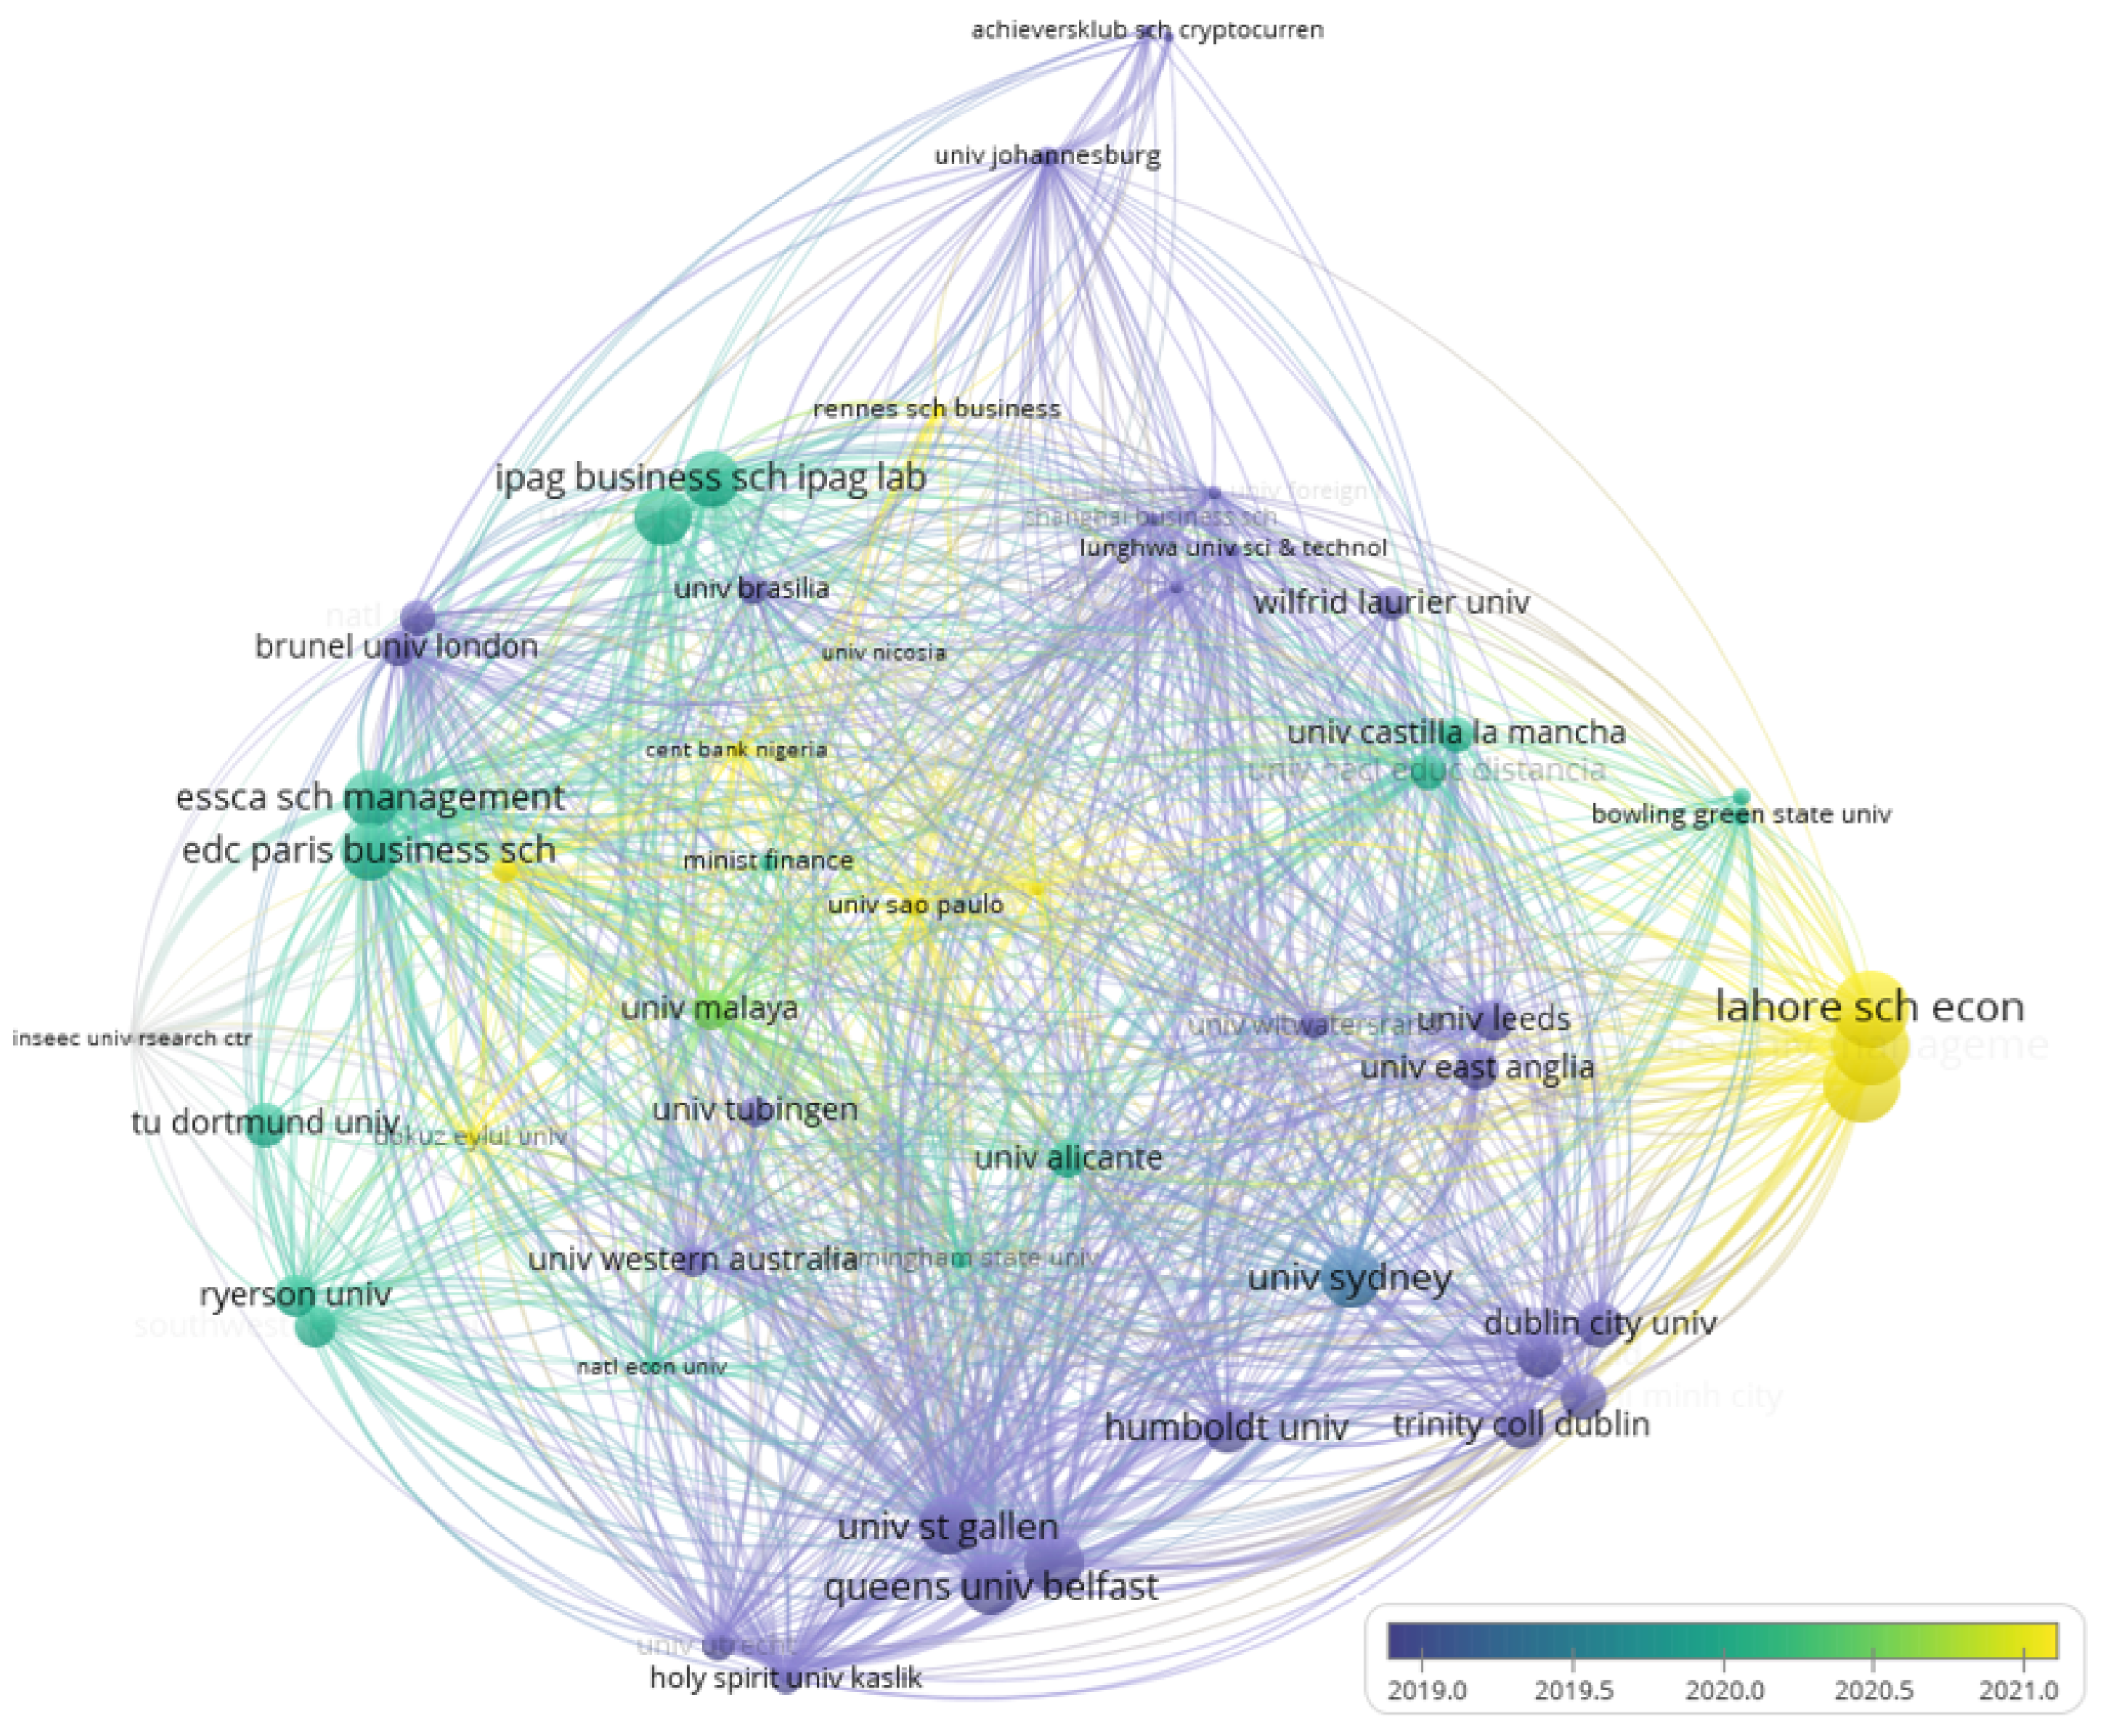
3.5. Institutions
Table 5 presents the analysis of the institutions that contributed the most to our research field. Sydney University is one of the institutions in the dataset that has contributed the most, with three publications. The institutions that have more citations are Queens University Belfast, the Technical University of Dresden, and the University of St Gallen with 226 citations each. those that we can relate to our previous analysis of the most cited author, and most cited country. Therefore, in our literature sample, we identify Klein, Tony and Walther, Thomas as the only authors that contributed for these universities. Additionally, that Walther, Thomas is the sole contributor for Switzerland.
We can also highlight that Hien Pham Thu is the sole representative of the Humboldt University rank place in this dataset and that has also contributed with more than one-third of Germany’s citations.
Figure 7 shows that regarding normalized citations Queens University Belfast, Technical University of Dresden, and the University of St Gallen were the most cited institutions in the year 2019. However, in 2020 the IPAG Business School, EDC Paris Business School, and the ESSCA Scholl of Management were the most cited. In 2021 the Lahore University of Management Sciences, Lahore School of economics, and the Quigdao University are the most cited institutions.
4. Literature Analysis
In this chapter of our study, we highlight the methodological findings as well as the main conclusions of the literature concerning volatility and risk management in cryptocurrencies.
4.1. Methodological Findings
The comparison of econometric models used for cryptocurrency’s volatility is addressed in studies such as Hattori (2020) which evaluates the volatility modelling in the Bitcoin market considering realized volatility, and models such as the GARCH, GJR-GARCH, EGARCH, APARCH, and IGARCH, using their error terms modified by normal, t and skewed t distributions. Extant literature has used extensively these models to analyze cryptocurrencies markets (e.g., Vidal-Tomás and Ibañez 2018).
The MSE and the QLIKE loss functions with the RV, are also considered, as volatility proxy. The results reveal that compared with the other models the EGARCH and the APARCH are highly ranked, and that they perform better with the normal distribution. If we consider QLIKE, the EGARCH with normal distribution has the best predictability, however, if we consider MSE, the APARCH with normal distribution is the best predictor model. The author concludes that concerning the Bitcoin data, the normal distribution is the better fit, and that the EGARCH and the APARCH models have the highest predictive power.
On the other hand, Peng et al. (2018) in a study to examine cryptocurrencies’ volatility predictive performance, shows evidence that compared to GARCH, EGARCH, and GJR-GARCH models with student-t, skewed student-t, and even with normal distributions, the SVR-GARCH model outperforms its benchmarks for all variables and time frames. Furthermore, according to Acereda et al. (2020), who examined the importance of conditional variance and error distribution in the parametric models when estimating the Expected Shortfall (ES) of cryptocurrency returns. It is crucial to estimate the Expected Shortfall (ES) of Bitcoin return series using a non-normal error distribution with two parameters and the NGARCH or the CGARCH models. For other cryptocurrencies, the results are not clear. However, the authors indicate that the heavy-tailed distribution produces better results than the normal distribution.
Additionally, in the study conducted by Wang et al. (2019), who used realized volatility from high-frequency data to evaluate ARJI, GARCH, EGARCH, and CGARCH models’ performance, it is shown that the ARJI model, which is a model that allows for jump dynamics, in comparison to the other models under study, reveals to be the ideal model to predict Bitcoin’s price volatility dynamics. The model also reveals superior sample goodness of fit, as well as out-of-sample predictive performance, compared to the other models. The authors also indicate that through the MZ regression, the GARCH-type models explain about 15% of the latent Bitcoin price volatility.
In another study, Aras (2021) investigated the different hybrid GARCH models that forecast performance using machine learning techniques. The author opted to use as models, the support vector machines (SVM) model, the artificial neural networks (ANN) model, the random forest (RF) model, and the K-nearest neighbors (KNN) model. The author also considered the GARCH (2,2) model, and a stacking assemble methodology. LASSO was chosen as the feature selection technique, and as the feature extraction technique PCA is used. The results indicate that the stacking assemble methodology with LASSO outperforms the base models, and therefore it can be reached better volatility forecasts than in those hybrid GARCH models often used in the literature. Furthermore, the best hybrid model performances are related to the models that consider the SVM.
On the other hand, Köchling et al. (2020), to better forecast Bitcoin’s volatility using GARCH-type models, applied different volatility proxies and loss functions. In their study, the authors highlight that through a model confidence set (MCS), the ARCH (1) and IGARCH (1,2) are the more promising models. However, the ARCH (1) model forecasts seem to be stable, whereas the IGARCH (1,2) model forecasts vary. In this sense, through the fact that a simple ARCH (1) model performs comparatively well, the authors conclude that the Bitcoin dynamics can be hard to predict even in sophisticated models.
Several studies apply a Markov-switching regime model such as Maciel (2021) that compares the performance of prediction on MS-GARCH against traditional single-regime GARCH methods for volatility forecasts. The results indicate that there are regime changes in daily log-returns’ volatility, with low and high regimes. Furthermore, when skewed distributions are considered, and when the scedastic function takes into consideration the leverage effects, the MS-GARCH models are better specified. Finally, compared with the standard single-regime GARCH models, and according to the economic criterion (VaR and ES) the MS-GARCH model is more accurate in predicting the short-, medium- and long-term horizons. Therefore, Markov-switching volatility models can help cryptoinvestors.
In the same line, Tan et al. (2021) considered tree GRACH model specifications such as the GARCH (1,1) model; the GJR-GARCH (1,1) model, where there is a degree of asymmetry effect that corresponds to the past shock in the conditional variance; and the TGARCH (1,1) model, that takes into account the leverage effect. In order to enable dynamic parameters, the authors also considered the MS-GARCH (1,1) model, allowing to analyse the regime change impact on volatility and mean levels. Allowing more flexibility, they also adopted the TVTP specification resulting in a TV-MS-GARCH (1,1) model. The results revealed improving performances for Bitcoin volatility forecasting by the TV-MS-GARCH (1,1) model with the skewed and fat tail error distributions, outperforming the other models. Furthermore, the authors highlight that it is crucial to incorporate exogenous variables into the TV-MS-GARCH model. Mba and Mwambi (2020) present a two-state Markov-switching COGARCH-R-vine (MS-COGARCH) model for cryptocurrencies portfolio selection and compare its performance to the single-regime COGARCH-R-vine (COGARCH). The authors use the vine copula models that overcome the problem of lack of flexibility of multivariate copulas, by using bivariate conditional copulas as a building block, therefore making these models more flexible in caching the underlying dependence and tail dependence structure. The results reveal that the single-regime optimal portfolio presents a higher level of risk compared to the Markov-switching. Furthermore, the Markov-switching has a greater ability to model cryptocurrencies volatility and portfolio risk. However, it has little influence on the returns of a cryptocurrency portfolio. The authors conclude that the MS-COGARCH outperforms the single-regime COGARCH. Additionally, the flexibility of the R-vine copula allows a proper bivariate copula selection for each pair of cryptocurrencies in order to have a proper dependence structure through pair-copula construction architecture.
These results are in line with the research conducted by Caporale and Zekokh (2019) who investigated the best methodology to model cryptocurrencies’ volatility (Bitcoin, Ethereum, Ripple, and Litecoin) between 2010 and 2018. The authors considered the MS-GRACH, SGARCH, EGARCH, GJR-GARCH, and the TGARCH models, to estimate one step ahead prediction of VaR and ES through a rolling window analysis. To choose the best models, the authors used the model confidence set (MCS), which is a sequential test that removes the worst model in each step and builds a “set of superior models” (SSM), where the hypothesis of equal predictive ability is not rejected. The authors tested more than 1176 GARCH-type models for each cryptocurrency, with a maximum likelihood procedure. The results indicate that VaR and ES better predictions are made by the two-regime GRACH. Therefore, the authors concluded that incorrect Value-at-Risk (VaR) and Expected Shortfall (ES) predictions can be presented by using standard GARCH models, which leads to ineffective portfolio optimization and risk management. However, to improve this, the authors suggest the use of model specifications that allow for asymmetries and regime-switching. In the same line, Ma et al. (2020) also gave a contribution through their research by proposing a novel Markov regime-switching mixed data sampling (MRS-MIADS) model in order to improve the accuracy prediction of Bitcoins’ realized variance (RV). The authors compared the various types of models, which indicated that the TVTP-MRS-MIDAS-CJL model exhibits a significant improvement for two weeks and one-month horizons. However, the FTP-MRS-MIDAS-CJL model presents better forecasting performance for 5 days and 66 days horizons. Moreover, the TVTP-MRS-MIDAS-CJL model reveals that jumps have different predictive power for Bitcoin’s RV, showing high and low volatility regimes.
Similar to Ma et al. (2020), there are also other studies that employ novel models, such as the one conducted by Mba et al. (2018) who proposed as new approaches the GARCH-differential evolution (GARCH-DE) and the GARCH-differential evolution t-copula (GARCH-DE-t-copula). The traditional differential evolution (DE) is contrasted with those new models in a single and multiperiod optimization, under the coherent risk measure CVaR constraint. The authors also use t-copula due to its ability to better capture the dependency of fat tails displayed by financial data. Under the single period optimization analysis, the authors found that the GARCH-DE-t-copula outperforms the GARCH-DE in terms of returns and as well as risk control. Under the multiperiod optimizations analysis, the GARCH-DE-t-copula outperforms both the DE and the GARCH-DE, having the highest returns. Therefore, the authors highlight that in portfolio optimization the DE power increases when combined with t-copula. Phillip et al. (2019) argue that cryptocurrencies require specific modelling, since they present challenges that fiat currencies do not. Therefore, they opted to analyze cryptocurrencies’ volatility using a novel model. First, and in order to account for occasional jumps, the authors selected the Buffered Autoregressive (BAR) model. Then, to use long-run autocorrelation with structural changes, they added the time-varying SV model. Due to the oscillatory behavior of cryptocurrencies, the authors also incorporated the Gegenbauer long-run autocorrelation filter. Therefore, the authors used a Jump BAR SV Gegenbauer Log Range (JBAR-SV-GLR) model. The results reveal that oscillatory long run autocorrelations are better filters to model the log daily return range instead of the standard long run autocorrelations. Consequently, the authors state that cryptocurrencies’ volatility can be better analyzed through fast moving autocorrelation functions, instead of smoothly decaying functions used for fiat currencies.
Finally, there are also other studies such as the one conducted by Cheikh et al. (2020) that used a Smooth Transition GARCH (ST-GARCH) model to investigate the presence of asymmetric volatility dynamics in Bitcoin, Ethereum, Ripple, and Litecoin. By choosing the ST-GARCH model, the authors allow for continuum intermediate states between two extreme volatility regimes. For comparison purposes, the authors also used other models along with the ST-GARCH model, such as the standard GARCH model, exponential GARCH (EGARCH) model, threshold GJR-GARCH model, and the threshold GARCH (ZARCH) model. The results reveal through the log-likelihood values that the ST-GARCH provides the best fit for Bitcoin, Ripple, and Litecoin. However, according to the AIC and BIC information criteria, Ethereum is the only exception where the ZARCH model has a better specification than the ST-GARCH model.
In a study conducted by Ftiti et al. (2021), they examine the modelling and forecasting of volatility in the cryptocurrency market, based on high-frequency data, with special regard for periods of crisis. The authors opted to consider an intraday volatility measure of the RV. They then decompose the RV into continuous and discontinuous components, and into positive and negative semi-variances. The paper also decomposed the realized semi-variance into continuous and jump components. They use five models to forecast volatility, namely the HAR-RV model, as the benchmark model, since it considers the investors’ heterogeneity; the HAR-CV-J model, in which the continuous and the discontinuous components are used to replace the RV; the HAR-SRV model, which considers the decomposition of positive and negative volatility; the HAR-RV-ΔJ2 model, which analyses the effect of a signed jump; and the HAR-RV- ΔJ2+-ΔJ2- model, which is an extension of the previous models. The model confidence set (MCS) method was used to evaluate the best model. The findings reveal that in either crisis or non-crisis periods, the best model for predicting future volatility seems to be an extended HAR model that includes positive and negative semi-variances.
Regarding future indications or improvements on the methodologies used, the authors indicate that the heterogeneous autoregressive regression (HAR) model is better suited to improve Bitcoin’s realized volatility prediction, and, thus, it should be considered in future research (Hattori 2020). Furthermore, the great variety of GARCH models should be further explored from the staking ensemble perspective (Aras 2021), and that it would be interesting to further explore the linkages between Bitcoin and other altcoins through multivariate Generalized Autoregressive Conditional Heteroskedasticity (GARCH) models (Caporale and Zekokh 2019).
There are also indications for future works to compare the Markov-switching GARCH (MS-GARCH) models to other volatility methods based on realized variance, as well as to consider conditional’s variance long memory property when conducting a cryptocurrencies’ volatility forecast (Maciel 2021). It is also highlighted the need to adopt heterogeneous autoregressive regression—mixed data sampling (HAR-MIDAS) model and use intraday data to build daily realized volatility measures (Walther et al. 2019), as well as the inclusion of Support Vector Regression (SVR) estimation in order to improve volatility’s predictions (Peng et al. 2018).
Through the summary of the models proposed to model cryptocurrency volatility, presented in Table 6, we evidence that though, there are indications of many models that show a good performance to measure and forecast cryptocurrencies’ volatility, the models that consider the Markov-switching regime seem to be more consensual. Regarding machine learning techniques the best hybrid model performances are related to the models that consider the SVM.
4.2. Discussion of Main Findings
In the review of the studies, we identify evidence that Bitcoin in some cases can be considered a hedge, and in others can be considered a diversifier. Specifically, against the Euro-Index, Shanghai A-Share, S&P 500, Nikkei, and the TSX Index, considering monthly returns, Bitcoin can be used as a strong hedge (Chan et al. 2019). The same cannot be said if we consider weekly returns. Thus, evidencing the fact that in these cases investors may have hedging benefits from holding Bitcoin longer (Chan et al. 2019). However, under extreme market conditions, the role of Bitcoin might change from hedge to diversifier (Garcia-Jorcano and Benito 2020). The benefits of Bitcoin diversification can be found if we consider it in a commodities portfolio. There are also diversification benefits from intraweek and monthly scales for BitShares, Litecoin, Stellar, Ripple, Monero, and DASH (Omane-Adjepong and Alagidede 2019). Nonetheless, if investors consider many economic instruments in their portfolios, the inclusion of Bitcoin is off reduced benefits (Symitsi and Chalvatzis 2019).
There is also evidence that Bitcoin and precious metals share an asymmetric response in the same direction to market shocks. However, unlike gold, the case of Bitcoin shows a positive coupling effect, which in situations of shocks and market decline, means that Bitcoin also declines (Klein et al. 2018).
Regarding spillovers between cryptocurrencies and other markets as well as amongst the cryptocurrency market, evidence shows returns and shocks spillovers between the Bitcoin market and stock markets. This implies that rational investors move across markets as a strategy to manage their portfolios in order to prevent the “crystallization” of shocks to their portfolios’ value (Uzonwanne 2021). There is also evidence that, in their pursuit for a hedge in the equity market, investors transmit uncertainty and volatility to the cryptocurrency market (Cheikh et al. 2020). On the other hand, considering not only Bitcoin but also other cryptocurrencies there is evidence that a spillover effect of an initial shock in the cryptocurrency market is felt by the financial markets. However, the high-yield hedged bond and equity markets show persistence in the subsequent volatility spillovers originating in the cryptocurrency market (Omane-Adjepong and Alagidede 2019). Nonetheless, their levels of connection and volatility linkages are sensitive to trading scales (Omane-Adjepong and Alagidede 2019). There is also evidence of spillovers between cryptocurrencies, specifically bidirectional volatility spillover effects, between Bitcoin and Ethereum, between Bitcoin and Litecoin, and between Ethereum and Litecoin. Thus, supporting the idea of an integrated cryptomarket (Katsiampa et al. 2019).
Regarding news effects, evidence shows that good news has more impact than bad news on cryptocurrency’s volatility. This asymmetric effect is a feature of assets that can suit as a safe haven (such as Gold) (Baur and Dimpfl 2018; Cheikh et al. 2020). In this regard, it is more likely that optimistic investors buy when the news is good than pessimistic investors sell when the news is bad (Sapuric et al. 2020). Bad news volatility during crisis periods, means that cryptocurrency investors are stressed and overreact to negative news (Ftiti et al. 2021). In this way, due to the “fear of missing out” (FOMO) by uninformed investors on high cryptocurrency valuations, the volatility response to positive shocks increases. On the other hand, the behavior of informed investors explains the negative shocks’ asymmetric volatility response (Baur and Dimpfl 2018). Despite being considered an alternative asset class, cryptocurrencies are leading investors’ sentiment in the financial markets (Umar et al. 2021).
Regarding volatility predictability in the cryptomarket, evidence points out that exogenous variables such as the Global Real Economic Activity, Global Financial Stress Index, and Chinese Policy Uncertainty Index, contain useful information for cryptocurrencies’ volatility forecast. Thus, emphasizing that there is a network of factors that interact with each other, instead of a single factor (Walther et al. 2019).
There is also evidence that options may play a significant role for Bitcoin investors, providing important information (Hoang and Baur 2020). In this way, results show that for one percentual point change in the implied volatility, the premium seems to show increasing sensitivity and that in different expirations dates for a one percentual point change in the risk-free rate the premium remains largely stable (Jalan et al. 2021). Regarding longer maturities, the prices of Bitcoin options seem to be less sensitive to changes in the value of the underlying (Bitcoin) (Jalan et al. 2021). Finally, Bitcoin, Ethereum, and Ripple volatilities can be used for trend-trending strategies. For instance, a straddle trading strategy that implements Bitcoins’ long position volatility by the purchase of a Bitcoin put option and a Bitcoin call option with the same expiration and strike (Siu 2021).
Regarding cryptocurrencies as a medium of exchange, evidence indicates that the ones that are faster transacted are preferable because of their lower liquidity risk (Phillip et al. 2019). It also found a connection between the number of new crypto accepting venues and volatility. In this way, cryptocurrency volatility decreases when firms withdraw crypto payment options and increases when firms introduce these crypto payment options. Thus, the number of new venues that accept cryptocurrencies as a form of payment can predict cryptocurrency volatility (Sabah 2020).
It can also be learned from the analysis of studies accommodated in our review that between the years 2014 and 2017, both Litecoin and Bitcoin were more volatile than the Euro (Miglietti et al. 2020). Furthermore, the oldest, least volatile, and most persistent coins are Bitcoin and Litecoin, and on the other hand, Ethereum presents a moderate level of volatility and persistence, and Ripple presents zero leverage strong autoregression (Tan et al. 2020). There is also evidence of positive and significant relationships between volume and returns before the Mt. Gox hack, as well as between volume and volatility after the year 2013 (Sapuric et al. 2020). The predictability of volatility, risk reduction, and level of speculation in the cryptocurrency market is improved by the leverage effects and the volatility persistence (Tan et al. 2020).
As far as future avenues of research are concerned, we find indications for a reanalysis of Bitcoin’s ability to be a hedge against equity investments, in more mature cryptocurrency markets (Klein et al. 2018), and also a reanalysis of the relationships between Bitcoin’s returns, volatility, and volume, since the relationships between these variables may change over time (Sapuric et al. 2020). Additionally, it is encouraged the construction of portfolio optimization strategies since cryptocurrency investors stress and overreact to negative news during periods of crises (Ftiti et al. 2021). It is also encouraged to understand cryptocurrencies’ returns and volatility spillovers magnitude, in normal as well as in crisis periods (Umar et al. 2021), and to quantify leading shock transmitters, or receivers, for the cryptocurrency markets, regarding different time horizons (Omane-Adjepong and Alagidede 2019). As well as to analyze the volatility dynamics concerning cryptocurrencies’ market speculation (Tan et al. 2021) and a multi-regime analysis concerning dynamic changes in Bitcoin prices (Tan et al. 2021).
Additionally, it is argued the need to explore the behavioral anomalies and market efficiency or inefficiency impacts on cryptocurrencies risk and portfolio allocation, using acceptability indexes and market cones (Siu 2021), as well as the need for further analysis on the stylized facts of cryptocurrencies, such as the leverage effect (Phillip et al. 2019) and their behavior during the COVID-19 pandemic (Garcia-Jorcano and Benito 2020). Moreover, there is the need to study if cryptocurrency realized volatility or its trading volume drives the long-term volatility, and to examine the add-value of exogenous drivers in trading strategies, portfolio allocation, and risk management (Walther et al. 2019).
Finally, we point to the importance of further comparing volatility prediction of Bitcoin’s call and put option returns to the commodity options (Jalan et al. 2021), and to analyze the influence of options trading on the volatility of cryptocurrencies, as well as to understand whether investors prefer an unregulated exchange over a regulated one (Hoang and Baur 2020).
5. Conclusions
To help clarify the complexity of cryptocurrency markets, we analyze extant literature in a bibliometric analysis as well as a literature review on volatility and risk management in cryptocurrencies. For that, we searched the WoS database from 2009 to 2021, filtered by 2021 ABS journals list.
In our bibliometric analysis, we highlight that the International Review of Financial Analysis is the most cited journal in our dataset unlike Aysan et al. (2021). However, in line with Aysan et al. (2021) the Finance Research Letters is the journal with more contributions to our research field. Moreover, Europe is a host for the institutions that have contributed the most, as we see in the findings of Jiang et al. (2021); Yue et al. (2021); García-Corral et al. (2022). We can identify that past literature, although still very focused on Bitcoin, already shows openness to other cryptocurrencies, confirming the finding by Jalal et al. (2021).
On the other hand, in our literature review, we found evidence that: (1) in low frequencies Bitcoin can be a strong hedge against stock indexes; (2) the number of new venues that accept cryptocurrencies as a form of payment can predict cryptocurrency’s volatility; (3) Bitcoin’s price volatility presents an “anti-leverage effect” since good news have more impact than bad news on volatility; (4) bidirectional volatility spillovers in the cryptomarket, indicating market integration; (5) diversification benefits from intraweek and monthly scales for several cryptocurrencies; and that (6) Bitcoin should be incorporated in long-term portfolios. Our findings are in line with and complement does of other reviews on cryptocurrency (Corbet et al. 2019; Flori 2019; Angerer et al. 2020; Kyriazis et al. 2020; Bariviera and Merediz-Solà 2021; Haq et al. 2021). However, we caveat that the results obtained depend on both the analysis period and the methodology used.
To the best of our knowledge, this is the first study that aggregates in a systematic manner the different methodologies used to model cryptocurrency volatility. We highlight that the models that consider the Markov-switching regime seem to be more consensual among the authors, and that the best machine learning technique performances are hybrid models that consider the SVM.
We highlight that the use of ABS journal ranking may be considered a limitation since it limits the volume of information surveyed, nonetheless, it offers quality to our research. Additionally, we acknowledge that a transparent and strict application of an SLR protocol might lead to potential missing papers for which search criteria are misaligned (one example is Dyhrberg (2016)).
Author Contributions
Conceptualization, J.A.; methodology, J.A. and T.C.G.; software, J.A.; validation, J.A. and T.C.G.; formal analysis, J.A.; investigation, J.A.; resources, J.A.; data curation, J.A.; writing—original draft preparation, J.A.; writing—review and editing, J.A. and T.C.G.; visualization, J.A. and T.G; supervision, T.C.G.; project administration, J.A. and T.C.G. All authors have read and agreed to the published version of the manuscript.
Funding
The authors acknowledge financial support from Fundação para a Ciência e a Tecnologia (grant UI/BD/151446/2021 and grant UID/SOC/04521/2020, respectively).
Data Availability Statement
The data to conduct our review were sourced from the Clarivate Web of Science.
Conflicts of Interest
The authors declare that there are no conflicts of interest regarding the publication of this paper.
References
- Acereda, Beatriz, Angel Leon, and Juan Mora. 2020. Estimating the expected shortfall of cryptocurrencies: An evaluation based on backtesting. Finance Research Letters 33: 101181. [Google Scholar] [CrossRef]
- Angerer, Martin, Christian Hugo Hoffmann, Florian Neitzert, and Sascha Kraus. 2020. Objective and subjective risks of investing into cryptocurrencies. Finance Research Letters 40: 101737. [Google Scholar] [CrossRef]
- Aras, Serkan. 2021. Stacking hybrid GARCH models for forecasting Bitcoin volatility. Expert Systems with Applications 174: 114747. [Google Scholar] [CrossRef]
- Aysan, Ahmet Faruk, Hüseyin Bedir Demirtaş, and Mustafa Saraç. 2021. The Ascent of Bitcoin: Bibliometric Analysis of Bitcoin Research. Journal of Risk and Financial Management 14: 427. [Google Scholar] [CrossRef]
- Bariviera, Aurelio F., and Ignasi Merediz-Solà. 2021. Where Do We Stand in Cryptocurrencies Economic Research? A Survey Based on Hybrid Analysis. Journal of Economic Surveys 35: 377–407. [Google Scholar] [CrossRef]
- Bartolacci, Francesca, Andrea Caputo, and Michela Soverchia. 2020. Sustainability and financial performance of small and medium sized enterprises: A bibliometric and systematic literature review. Business Strategy and the Environment 29: 1297–309. [Google Scholar] [CrossRef]
- Baur, Dirk G., and Thomas Dimpfl. 2018. Asymmetric volatility in cryptocurrencies. Economics Letters 173: 148–51. [Google Scholar] [CrossRef]
- Baur, Dirk G., Thomas Dimpfl, and Konstantin Kuck. 2018. Bitcoin, gold and the US dollar—A replication and extension. Finance Research Letters 25: 103–10. [Google Scholar] [CrossRef]
- Caporale, Guglielmo Maria, and Timur Zekokh. 2019. Modelling volatility of cryptocurrencies using Markov-Switching GARCH models. Research in International Business and Finance 48: 143–55. [Google Scholar] [CrossRef]
- Caputo, Andrea, Giacomo Marzi, Jane Maley, and Mario Silic. 2019. Ten years of conflict management research 2007–17: An update on themes, concepts and relationships. International Journal of Conflict Management 30: 87–110. [Google Scholar] [CrossRef]
- Chan, Wing Hong, Minh Le, and Yan Wendy Wu. 2019. Holding Bitcoin longer: The dynamic hedging abilities of Bitcoin. Quarterly Review of Economics and Finance 71: 107–13. [Google Scholar] [CrossRef]
- Cheikh, Nidhaleddine Ben, Younes Ben Zaied, and Julien Chevallier. 2020. Asymmetric volatility in cryptocurrency markets: New evidence from smooth transition GARCH models. Finance Research Letters 35: 101293. [Google Scholar] [CrossRef]
- Ciaian, Pavel, Miroslava Rajcaniova, and d’Artis Kancs. 2017. Virtual relationships: Short- and long-run evidence from BitCoin and altcoin markets. Journal of International Financial Markets, Institutions and Money 52: 173–95. [Google Scholar] [CrossRef]
- Corbet, Shaen, Brian Lucey, Andrew Urquhart, and Larisa Yarovaya. 2019. Cryptocurrencies as a financial asset: A systematic analysis. International Review of Financial Analysis 62: 182–99. [Google Scholar] [CrossRef] [Green Version]
- Ding, Ying, Ronald Rousseau, and Dietmar Wolfram. 2014. Measuring Scholarly Impact. Cham: Springer. [Google Scholar] [CrossRef]
- Dyhrberg, Anne Haubo. 2016. Bitcoin, gold and the dollar—A GARCH volatility analysis. Finance Research Letters 16: 85–92. [Google Scholar] [CrossRef] [Green Version]
- Fang, Fan, Waichung Chung, Carmine Ventre, Michail Basios, Leslie Kanthan, Lingbo Li, and Fan Wu. 2021. Ascertaining price formation in cryptocurrency markets with machine learning. European Journal of Finance, 1–23. [Google Scholar] [CrossRef]
- Flori, Andrea. 2019. Cryptocurrencies in finance: Review and applications. International Journal of Theoretical and Applied Finance 22: 1950020. [Google Scholar] [CrossRef]
- Ftiti, Zied, Wael Louhichi, and Hachmi Ben Ameur. 2021. Cryptocurrency volatility forecasting: What can we learn from the first wave of the COVID-19 outbreak? Annals of Operations Research, 0123456789. [Google Scholar] [CrossRef]
- Galvao, Anderson, Carla Mascarenhas, Carla Marques, João Ferreira, and Vanessa Ratten. 2019. Triple helix and its evolution: A systematic literature review. Journal of Science and Technology Policy Management 10: 812–33. [Google Scholar] [CrossRef]
- García-Corral, Francisco Javier, José Antonio Cordero-Garcí, Jaime de Pablo-Valenciano, and Juan Uribe-Toril. 2022. A bibliometric review of cryptocurrencies: How have they grown? Financial Innovation 8: 1–31. [Google Scholar] [CrossRef]
- Garcia-Jorcano, Laura, and Sonia Benito. 2020. Studying the properties of the Bitcoin as a diversifying and hedging asset through a copula analysis: Constant and time-varying. Research in International Business and Finance 54: 101300. [Google Scholar] [CrossRef] [PubMed]
- Gil-Alana, Luis Alberiko, Emmanuel Joel Aikins Abakah, and María Fátima Romero Rojo. 2020. Cryptocurrencies and stock market indices. Are they related? Research in International Business and Finance 51: 101063. [Google Scholar] [CrossRef]
- Haq, Inzamam Ul, Apichit Maneengam, Supat Chupradit, Wanich Suksatan, and Chunhui Huo. 2021. Economic policy uncertainty and cryptocurrency market as a risk management avenue: A systematic review. Risks 9: 163. [Google Scholar] [CrossRef]
- Hattori, Takahiro. 2020. A forecast comparison of volatility models using realized volatility: Evidence from the Bitcoin market. Applied Economics Letters 27: 591–95. [Google Scholar] [CrossRef]
- Hoang, Lai T., and Dirk G. Baur. 2020. Forecasting bitcoin volatility: Evidence from the options market. Journal of Futures Markets 40: 1584–602. [Google Scholar] [CrossRef]
- Jalal, Raja Nabeel-Ud-Din, Ilan Alon, and Andrea Paltrinieri. 2021. A bibliometric review of cryptocurrencies as a financial asset. Technology Analysis and Strategic Management, 1–16. [Google Scholar] [CrossRef]
- Jalan, Akanksha, Roman Matkovskyy, and Saqib Aziz. 2021. The Bitcoin options market: A first look at pricing and risk. Applied Economics 53: 2026–41. [Google Scholar] [CrossRef]
- Jiang, Shangrong, Xuerong Li, and Shouyang Wang. 2021. Exploring evolution trends in cryptocurrency study: From underlying technology to economic applications. Finance Research Letters 38: 101532. [Google Scholar] [CrossRef]
- Katsiampa, Paraskevi, Shaen Corbet, and Brian Lucey. 2019. Volatility spillover effects in leading cryptocurrencies: A BEKK-MGARCH analysis. Finance Research Letters 29: 68–74. [Google Scholar] [CrossRef] [Green Version]
- Klein, Tony, Hien Pham Thu, and Thomas Walther. 2018. Bitcoin is not the New Gold—A comparison of volatility, correlation, and portfolio performance. International Review of Financial Analysis 59: 105–16. [Google Scholar] [CrossRef]
- Köchling, Gerrit, Philipp Schmidtke, and Peter N. Posch. 2020. Volatility forecasting accuracy for Bitcoin. Economics Letters 191: 108836. [Google Scholar] [CrossRef]
- Kyriazis, Nikolaos, Stephanos Papadamou, and Shaen Corbet. 2020. A systematic review of the bubble dynamics of cryptocurrency prices. Research in International Business and Finance 54: 101254. [Google Scholar] [CrossRef]
- Lansky, Jan. 2018. Possible State Approaches to Cryptocurrencies. Journal of Systems Integration 9: 19–31. [Google Scholar] [CrossRef]
- Li, Rong, Sufang Li, Di Yuan, and Huiming Zhu. 2021. Investor attention and cryptocurrency: Evidence from wavelet-based quantile Granger causality analysis. Research in International Business and Finance 56: 101389. [Google Scholar] [CrossRef]
- Liang, Xiaobei, Yibo Yang, and Jiani Wang. 2016. Internet finance: A systematic literature review and bibliometric analysis. Paper presented at the International Conference on Electronic Business (ICEB), Xiamen, China, December 4–8; pp. 386–98. [Google Scholar]
- Linnenluecke, Martina K., Mauricio Marrone, and Abhay K. Singh. 2020. Conducting systematic literature reviews and bibliometric analyses. Australian Journal of Management 45: 175–94. [Google Scholar] [CrossRef]
- Ma, Feng, Chao Liang, Yuanhui Ma, and Mohamed Ismail Mohamed Wahab. 2020. Cryptocurrency volatility forecasting: A Markov regime-switching MIDAS approach. Journal of Forecasting 39: 1277–90. [Google Scholar] [CrossRef]
- Maciel, Leandro. 2021. Cryptocurrencies value-at-risk and expected shortfall: Do regime-switching volatility models improve forecasting? International Journal of Finance and Economics 26: 4840–55. [Google Scholar] [CrossRef]
- Mba, Jules Clement, and Sutene Mwambi. 2020. A Markov-switching COGARCH approach to cryptocurrency portfolio selection and optimization. Financial Markets and Portfolio Management 34: 199–214. [Google Scholar] [CrossRef]
- Mba, Jules Clement, Edson Pindza, and Ur Koumba. 2018. A differential evolution copula-based approach for a multi-period cryptocurrency portfolio optimization. Financial Markets and Portfolio Management 32: 399–418. [Google Scholar] [CrossRef]
- Miglietti, Cynthia, Zdenka Kubosova, and Nicole Skulanova. 2020. Bitcoin, Litecoin, and the Euro: An annualized volatility analysis. Studies in Economics and Finance 37: 229–42. [Google Scholar] [CrossRef]
- Omane-Adjepong, Maurice, and Imhotep Paul Alagidede. 2019. Multiresolution analysis and spillovers of major cryptocurrency markets. Research in International Business and Finance 49: 191–206. [Google Scholar] [CrossRef]
- Peng, Yaohao, Pedro Henrique Melo Albuquerque, Jader Martins Camboim de Sá, Ana Julia Akaishi Padula, and Mariana Rosa Montenegro. 2018. The best of two worlds: Forecasting high frequency volatility for cryptocurrencies and traditional currencies with Support Vector Regression. Expert Systems with Applications 97: 177–92. [Google Scholar] [CrossRef]
- Phillip, Andrew, Jennifer Chan, and Shelton Peiris. 2019. On long memory effects in the volatility measure of Cryptocurrencies. Finance Research Letters 28: 95–100. [Google Scholar] [CrossRef]
- Rialti, Riccardo, Giacomo Marzi, Cristiano Ciappei, and Donatella Busso. 2019. Big data and dynamic capabilities: A bibliometric analysis and systematic literature review. Management Decision 57: 2052–68. [Google Scholar] [CrossRef]
- Sabah, Nasim. 2020. Cryptocurrency accepting venues, investor attention, and volatility. Finance Research Letters 36: 101339. [Google Scholar] [CrossRef]
- Sadeghi Moghadam, Mohammad Reza, Hossein Safari, and Narjes Yousefi. 2021. Clustering quality management models and methods: Systematic literature review and text-mining analysis approach. Total Quality Management and Business Excellence 32: 241–64. [Google Scholar] [CrossRef]
- Sapuric, Svetlana, Angelika Kokkinaki, and Ifigenia Georgiou. 2020. The relationship between Bitcoin returns, volatility and volume: Asymmetric GARCH modeling. Journal of Enterprise Information Management. [Google Scholar] [CrossRef]
- Siu, Tak Kuen. 2021. The risks of cryptocurrencies with long memory in volatility, non-normality and behavioural insights. Applied Economics 53: 1991–2014. [Google Scholar] [CrossRef]
- Symitsi, Efthymia, and Konstantinos J. Chalvatzis. 2019. The economic value of Bitcoin: A portfolio analysis of currencies, gold, oil and stocks. Research in International Business and Finance 48: 97–110. [Google Scholar] [CrossRef] [Green Version]
- Tan, Chia-Yen Tan, You-Beng Koh, Kok-Haur Ng, and Kooi-Huat Ng. 2021. Dynamic volatility modelling of Bitcoin using time-varying transition probability Markov-switching GARCH model. North American Journal of Economics and Finance 56: 101377. [Google Scholar] [CrossRef]
- Tan, Shay-Kee, Jennifer So-Kuen Chan, and Kok-Haur Ng. 2020. On the speculative nature of cryptocurrencies: A study on Garman and Klass volatility measure. Finance Research Letters 32: 101075. [Google Scholar] [CrossRef]
- Umar, Muhammad, Syed Kumail Abbas Rizvi, and Bushra Naqvi. 2021. Dance with the devil? The nexus of fourth industrial revolution, technological financial products and volatility spillovers in global financial system. Technological Forecasting and Social Change 163: 120450. [Google Scholar] [CrossRef]
- Uzonwanne, Godfrey. 2021. Volatility and return spillovers between stock markets and cryptocurrencies. Quarterly Review of Economics and Finance 82: 30–36. [Google Scholar] [CrossRef]
- van Eck, Nees Jan, and Ludo Waltman. 2017. Citation-based clustering of publications using CitNetExplorer and VOSviewer. Scientometrics 111: 1053–70. [Google Scholar] [CrossRef] [Green Version]
- Vidal-Tomás, David, and Ana Ibañez Ibañez. 2018. Semi-strong efficiency of Bitcoin. Finance Research Letters 27: 259–65. [Google Scholar] [CrossRef]
- Walther, Thomas, Tony Klein, and Elie Bouri Bouri. 2019. Exogenous drivers of Bitcoin and Cryptocurrency volatility—A mixed data sampling approach to forecasting. Journal of International Financial Markets, Institutions and Money 63: 101133. [Google Scholar] [CrossRef]
- Wang, Jying-Nan, Hung-Chun Liu, Shu-Mei Chiang, and Yuan-Teng Hsu. 2019. On the predictive power of ARJI volatility forecasts for Bitcoin. Applied Economics 51: 4849–55. [Google Scholar] [CrossRef]
- Wang, Junpeng, Yubo Xue, and Minghao Liu. 2016. An Analysis of Bitcoin Price Based on VEC Model. In International Conference on Economics and Management Innovations (ICEMI 2016). Beijing: Atlantis Press, pp. 146–52. [Google Scholar] [CrossRef] [Green Version]
- Yue, Yao, Xuerong Li, Dingxuan Zhang, and Shouyang Wang. 2021. How cryptocurrency affects economy? A network analysis using bibliometric methods. International Review of Financial Analysis 77: 101869. [Google Scholar] [CrossRef]
Figure 1.
Citations and publications over time.

Figure 2.
Publications by country world map.

Figure 3.
Normalized citations of countries by year.

Figure 4.
Most contributive research areas.

Figure 5.
Normalized citations of journals by year.

Figure 6.
Normalized citations of authors by year.

Figure 7.
Normalized citations of institutions by year.


Table 1.
Shows the top 10 articles by number of citations (771 citations and 32 publications).
| Rank | Article | Citations |
|---|---|---|
| 1 | Klein et al. (2018) | 192 |
| 2 | Baur and Dimpfl (2018) | 81 |
| 3 | Peng et al. (2018) | 75 |
| 4 | Katsiampa et al. (2019) | 74 |
| 5 | Symitsi and Chalvatzis (2019) | 61 |
| 6 | Caporale and Zekokh (2019) | 46 |
| 7 | Chan et al. (2019) | 36 |
| 8 | Walther et al. (2019) | 34 |
| 9 | Omane-Adjepong and Alagidede (2019) | 31 |
| 10 | Phillip et al. (2019) | 29 |
Table 2.
Shows the top 10 countries by number of citations.
| Rank | Country | Publications | Citations | Citations per Publications |
|---|---|---|---|---|
| 1 | Germany | 4 | 318 | 79.5 |
| 2 | North Ireland | 2 | 226 | 113 |
| 3 | Switzerland | 2 | 226 | 113 |
| 4 | Australia | 6 | 190 | 31.67 |
| 5 | England | 3 | 181 | 60.33 |
| 6 | Brazil | 2 | 77 | 38.5 |
| 7 | Ireland | 1 | 74 | 74 |
| 8 | Vietnam | 2 | 74 | 37 |
| 9 | Canada | 2 | 46 | 23 |
| 10 | Russia | 1 | 46 | 46 |
Table 3.
Shows the top 10 journals by number of citations.
| Rank | Journal | Publications | Citations | Citations per Publications |
|---|---|---|---|---|
| 1 | International review of financial analysis | 1 | 192 | 192 |
| 2 | Research in international business and finance | 4 | 145 | 36.25 |
| 3 | Finance research letters | 6 | 135 | 22.5 |
| 4 | Economics letters | 2 | 92 | 46 |
| 5 | Expert systems with applications | 2 | 76 | 38 |
| 6 | Quarterly review of economics and finance | 2 | 36 | 18 |
| 7 | Journal of international financial markets institutions and money | 1 | 34 | 34 |
| 8 | Technological forecasting and social change | 1 | 26 | 26 |
| 9 | Journal of forecasting | 1 | 10 | 10 |
| 10 | Applied economics | 3 | 9 | 3 |
Table 4.
Shows the top 10 authors by number of citations.
| Rank | Author | Publications | Citations | Citations per Publications |
|---|---|---|---|---|
| 1 | Klein, Tony | 2 | 226 | 113 |
| 2 | Walther, Thomas | 2 | 226 | 113 |
| 3 | Hien Pham Thu | 1 | 192 | 192 |
| 4 | Baur, Dirk G. | 2 | 81 | 40.5 |
| 5 | Dimpfl, Thomas | 1 | 81 | 81 |
| 6 | Akaishi Padula, Ana Julia | 1 | 75 | 75 |
| 7 | Camboim De Sa, Jader Martins | 1 | 75 | 75 |
| 8 | Melo Albuquerque, Pedro Henrique | 1 | 75 | 75 |
| 9 | Montenegro, Mariana Rosa | 1 | 75 | 75 |
| 10 | Peng, Yaohao | 1 | 75 | 75 |
Table 5.
Shows the top 10 institutions by number of citations.
| Rank | Institution | Publications | Citations | Citations per Publications |
|---|---|---|---|---|
| 1 | Queens University Belfast | 2 | 226 | 113 |
| 2 | Technical University of Dresden | 2 | 226 | 113 |
| 3 | University of St Gallen | 2 | 226 | 113 |
| 4 | Humboldt University | 1 | 192 | 192 |
| 5 | Sydney University | 3 | 108 | 36 |
| 6 | Tubingen University | 1 | 81 | 81 |
| 7 | University of Western Australia | 2 | 81 | 40.5 |
| 8 | University Brasilia | 1 | 75 | 75 |
| 9 | Dublin City University | 1 | 74 | 74 |
| 10 | Trinity College Dublin | 1 | 74 | 74 |
Table 6.
Methodologies used in modelling cryptocurrencies’ volatility and risk management.
| Paper | Time Horizon | Models Used | Best Model |
|---|---|---|---|
| Acereda et al. (2020) | 2010–2018 | GARCH/ NGARCH/CGARCH/TGARCH | NGARCH/CGARCH |
| Aras (2021) | 2013–2020 | ANN/SVM/KNN/GARCH (2,2)/LASSO | SVM/LASSO |
| Baur and Dimpfl (2018) | 2013–2018 | T-GARCH | |
| Caporale and Zekokh (2019) | 2010–2018 | MS-GRACH/SGARCH/EGARCH/GJR-GARCH/TGARCH | MS-GRACH |
| Chan et al. (2019) | 2010–2017 | GARCH/CCC/Frequency dependence model | GARCH/CCC/Frequency dependence model |
| Cheikh et al. (2020) | 2013–2018 | ST-GARCH/GARCH/EGARCH/GJR-GARCH/ZARCH | ST-GARCH |
| Ftiti et al. (2021) | 2018–2020 | HAR-RV/HAR-CV-J/HAR-SRV/HAR-RV-ΔJ2 /HAR-RV- ΔJ2+-ΔJ2- | HAR-SRV |
| Garcia-Jorcano and Benito (2020) | 2011–2019 | Copula models such as Gaussian, Student-t, Clayton, Gumbel, and Frank. | Copula Student-t |
| Hattori (2020) | 2016–2018 | GARCH/GJR-GARCH/EGARCH/APARCH/IGARCH | EGARCH/APARCH |
| Hoang and Baur (2020) | 2015–2020 | Black–Scholes–IV/GARCH/TGARCH/HARQ-F-J/ARMA/AFIRMA | Black–Scholes–IV/ARMA/GARCH |
| Jalan et al. (2021) | 2018–2020 | Black–Scholes–Merton/two-regime Heston–Nandi GARCH | Heston–Nandi model |
| Katsiampa et al. (2019) | 2015–2018 | Unrestricted BEKK-MGRACH | |
| Klein et al. (2018) | 2011–2017 | APARCH/FIAPARCH/BEKK-GARCH | FIAPARCH |
| Köchling et al. (2020) | 2015–2018 | ARCH/IGARCH(1,2) | ARCH |
| Ma et al. (2020) | 2013–2018 | MIDAS-RV/MIDAS-CJ MRS-MIDAS/MIDAS-CJL/HAR-CJ/FTP-MRS-MIDAS-RV/FTP-MRS-MIDAS-CJL/TVTP-MRS-MIDAS-CJL | FTP-MRS-MIDAS-CJL/TVTP-MRS-MIDAS-CJL |
| Maciel (2021) | 2013–2018 | MS-GARCH/GARCH/EGARCH/TGARCH | MS-GARCH |
| Mba and Mwambi (2020) | 2017–2019 | MS-COGARCH/COGARCH | MS-COGARCH |
| Mba et al. (2018) | 2014–2018 | GARCH-DE/DE/GARCH-DE-t-copula | GARCH-DE-t-copula |
| Miglietti et al. (2020) | 2014–2017 | GARCH/ARCH | |
| Omane-Adjepong and Alagidede (2019) | 2014–2018 | WMCC/VAR/GJR-GARCH/GARCH | GJR-GARCH/GARCH |
| Peng et al. (2018) | 2016–2017 | GARCH/EGARCH/GJR-GARCH/SVR-GARCH | SVR-GARCH |
| Phillip et al. (2019) | Varry-2017 | JBAR-SV-GLR | |
| Sabah (2020) | 2013–2018 | VAR | |
| Sapuric et al. (2020) | 2010–2017 | EGARCH | |
| Siu (2021) | 2013–2019 | GRACH/FIGARCH/AR-GARCH/AR-FIGARCH/MS-GRACH/EVT | EVT/MS-GRACH |
| Symitsi and Chalvatzis (2019) | 2011–2017 | EW/GMV/CGMV/CGMV-DDC | EW/GMV |
| Tan et al. (2021) | 2010–2018 | GARCH/GJR-GARCH/TGARCH/MS-GARCH/TV-MS-GARCH | TV-MS-GARCH |
| Tan et al. (2020) | 2013–2018 | ABL-CARR | |
| Umar et al. (2021) | 2018–2020 | VAR/BEKK-GARCH | |
| Uzonwanne (2021) | 2013–2018 | VARMA-AGARCH | |
| Walther et al. (2019) | Varry-2019 | GARCH/GARCH-MIDAS | GARCH-MIDAS |
| Wang et al. (2019) | 2013–2018 | ARJI/GARCH/EGARCH/CGARCH | ARJI |
Publisher’s Note: MDPI stays neutral with regard to jurisdictional claims in published maps and institutional affiliations. |
© 2022 by the authors. Licensee MDPI, Basel, Switzerland. This article is an open access article distributed under the terms and conditions of the Creative Commons Attribution (CC BY) license (https://creativecommons.org/licenses/by/4.0/).
Share and Cite
MDPI and ACS Style
Almeida, J.; Gonçalves, T.C. A Systematic Literature Review of Volatility and Risk Management on Cryptocurrency Investment: A Methodological Point of View. Risks 2022, 10, 107. https://0-doi-org.brum.beds.ac.uk/10.3390/risks10050107
AMA Style
Almeida J, Gonçalves TC. A Systematic Literature Review of Volatility and Risk Management on Cryptocurrency Investment: A Methodological Point of View. Risks. 2022; 10(5):107. https://0-doi-org.brum.beds.ac.uk/10.3390/risks10050107
Chicago/Turabian StyleAlmeida, José, and Tiago Cruz Gonçalves. 2022. "A Systematic Literature Review of Volatility and Risk Management on Cryptocurrency Investment: A Methodological Point of View" Risks 10, no. 5: 107. https://0-doi-org.brum.beds.ac.uk/10.3390/risks10050107
Note that from the first issue of 2016, this journal uses article numbers instead of page numbers. See further details here.