
BRICS Capital Markets Co-Movement Analysis and Forecasting


1
Department of Finance, National Research University Higher School of Economics, 194100 Saint Petersburg, Russia
2
International Laboratory for Finance and Financial Markets, Faculty of Economics, People’s Friendship University of Russia (RUDN University), Miklukho-Maklaya Str. 6, 117198 Moscow, Russia
3
Geographical Institute “Jovan Cvijic” SASA, Djure Jaksica 9, 11000 Belgrade, Serbia
4
Artificial Intelligence System Department, Lviv Polytechnic National University, Kniazia Romana Str. 5, 79013 Lviv, Ukraine
5
Faculty for Banking, Insurance and Finance, Belgrade Banking Academy, 11000 Belgrade, Serbia
*
Author to whom correspondence should be addressed.
Risks 2022, 10(5), 88; https://0-doi-org.brum.beds.ac.uk/10.3390/risks10050088
Submission received: 8 March 2022
/
Revised: 12 April 2022
/
Accepted: 18 April 2022
/
Published: 19 April 2022
Abstract
:The present study analyses BRICS (Brazil, Russia, India, China, South Africa) capital markets in both time and frequency domain using wavelets. We used artificial neural network techniques to forecast the co-movement among BRICS capital markets. Wavelet coherence and clustering estimates uncover the interesting dynamics among the BRICS capital markets co-movement. A wavelet coherence diagram shows a clear contagion effect among BRICS nations, and it favors short period investments over longer period investments. Overall study estimates indicate that co-movement among BRICS nations significantly differs statistically at different levels. Except for China during the great financial crisis period, significant levels of co-movement were observed between other BRICS nations and that lasted for a longer period of time. A wavelet clustering diagram demonstrates that investors would not get any substantial benefits of diversification by investing only in the ‘Russia and China’ or ‘India and South Africa’ capital markets. Lastly, the study attempts to forecast the BRICS capital market co-movement using two different types of neural networks. Further, RMSE (Root Mean Square Error) values confirm the correctness of the forecasting model. The present study answers the key question, “What kind of integration and globalization framework do we need for sustainable development?”.
1. Introduction
Finance literature in the last few decades witnessed a series of developments both in the developed and the developing capital markets across the globe. Due to globalisation, today’s capital markets are inter-linked and that makes capital markets more unpredictable due to the presence of several known & unknown risk factors. Different levels of integration among the global capital markets made investor jobs more challenging in calculating expected returns for a specific market. Unforeseen risks are everywhere and any unforeseen event in the capital market can cause serious damage, especially in the tail data of distribution (Maiti 2021). To avoid such damage, investors used to diversify their investment in different assets and capital markets (Vukovic et al. 2019). Seminal work by Markowitz (1952) also suggests that investors can diversify their investment risk by investing in the negatively correlated international capital markets, followed by Grubel’s (1968) work on “Internationally diversified portfolios: welfare gains and capital flows,” which opens up the discussion on the importance of international capital markets on investment diversification among researchers. Further, Levy and Sarnat (1970); Kasa (1992); Forbes and Rigobon (2002); Johnson and Soenen (2003); Brooks and Del Negro (2004); Syriopoulos (2007) and the studies of others augmented the importance of international portfolio diversifications and linkages among the capital markets across the globe.
Previous studies deployed different methods to study the linkages between the capital markets across the globe as discussed below. Seminal work by Granger and Morgenstern (1970) used simple correlations to study the inter linkage between the stock markets and thereafter more advanced techniques like cointegration, rolling window correlations, VAR (vector autoregression) models, VEC (vector error correction) models, and GARCH (generalized auto regressive conditional heteroskedasticity). These models are used by a notable number of studies. Arshanapalli and Doukas (1993); Ratanapakorn and Sharma (2002); Ahlgren and Antell (2002); Chan et al. (1997); Chaudhuri (1997); Patel (2017), and others used cointegration to study linkages between stock markets. Some studies, such as Raisul (2014), use VAR models and Kang and Yoon (2011) used the GARCH model to study linkages between the stock markets. As mentioned above, all of the studies used time series data setup either in the time or the frequency domain. Financial markets deal with several interacting agents and to understand such complex interacting systems a single aspect provides incomplete information. Wavelet analysis made it possible to study the time series in the time frequency domain. Wavelets made it possible to see the hidden interactions among the two time series, which are difficult to observe through any other possible available advanced econometric tools; and, moreover, wavelet analysis is a model free approach. These properties make wavelet analysis special and superior over other available advanced econometric tools. In the last few decades, wavelet analysis has been extensible in different scientific fields like image processing, DNA analysis, optics research, and signal processing, etc., but recently its application equally gained importance in finance literature.
The present study is not the first study that applies wavelets to analyze capital market co-movement. Earlier studies by Shik Lee (2004); Rua and Nunes (2009); Dima et al. (2015); Maiti et al. (2020a); Qureshi et al. (2020); Vukovic et al. (2021); Karim et al. (2021), and others, used wavelet analysis in finance research. Presently, the economies of BRICS nations are leveraging their financial sector and capital markets. Additionally, according to the IMF (International Monetary Fund), the BRICS capital market has the potential to double by 2020. That justifies the importance of the BRICS nations as a potential market for investment in the coming future by international investors, and at the same time it is important to understand the market dynamics of each of these markets due to the presence of different specific risk factors (Maiti and Balakrishnan 2018, 2020). Before making investment decisions on BRICS capital markets, investors must understand the complete dynamics behind these BRICS capital markets. The present study on BRICS capital market co-movement is unique in at least four ways: first, it uses longer time period data and in daily frequency; and second, to analyze BRICS capital market co-movement, the present study uses both discrete and continuous wavelet transform. Thirdly, this study uses wavelet clustering to identify, discriminate, and localize clusters in multidimensional space. Finally, the study made an attempt to forecast the BRICS capital market co-movement nature using the nonlinear techniques such as artificial neural networks. Overall, the present study answers the key question, “What kind of integration and globalization framework do we need for sustainable development?” This has a significant public policy content.
The rest of the paper is structured as follows: Review of Literature, Data and Methodology, Main Results, and Conclusion.
2. Review of Literature
Capital and stock market interdependence has been studied as an essential subject in international finance from numerous authors (Granger and Morgenstern 1970; Malliaris and Urrutia 1992; Wang et al. 2003; Shik Lee 2004; Kang and Yoon 2011; Aloui and Hkiri 2014; Aggarwal and Raja 2019; Ramos-Requena et al. 2020). Xu and Hamori (2012) studied capital dynamic linkages between the BRICS countries and the US pre and post crisis in 2008. The authors used an autoregressive model for the conditional mean and the exponential generalized autoregressive conditional heteroskedasticity (EGARCH) model to study the underlying relationships in the mean and in the variance. They found that during the crisis capital international transmission (stock prices) between the BRICS and the US weakened in both the mean and the variance. Previously, similar studies (Malliaris and Urrutia 1992; Wang et al. 2003) used the generalized impulse response analysis to examine the dynamic causal linkages and relationships of stock markets developed countries (Malliaris and Urrutia 1992) and emerging countries (Wang et al. 2003). In recent years, Hung (2019) used wavelet coherence to analyze the short-term and the long-term dynamics between equity market integration of China and of Southeast Asia. He found a positive linkage between variables and frequency changes in the pattern of the co-movements after the 2008 crisis between these countries. Similar issues in the same region are already analyzed by Sznajderska (2019) and Lau and Sheng (2018), confirming strong market impacts and connections. For the case of BRICS countries, such studies were previously conducted by Kao et al. (2018) and Aggarwal and Raja (2019). All authors found a stable long-run underlying relationship between the variables (Aggarwal and Raja 2019) and interdependence between emerging markets (Kao et al. 2018). However, the research of Mensi et al. (2018) did not find a positive linkage between all tested variables in the BRICS case (for example, for the gold prices). It indicates that not all capital variables behave the same in the underlying relationships. Even more, the global financial crisis influence made a decoupling effect for most BRICS markets for the period of the early stages of the crises Dimitriou et al. (2013). Mensi et al. (2017) finds a decoupling effect just for Russia (compared to other BRICS members).
Measuring of the stock market co-movement has increasingly become the subject of scholars’ analysis in recent years due to the important practical implication for the portfolio’s allocation and hedging strategies (Aloui and Hkiri 2014). Popularization of wavelet coherence contributes to the fact that the mathematical model can give simple insight into co-movement among international stock markets by previously used decomposition of the time series (Aloui and Hkiri 2014; Yang et al. 2017; Hung 2019; Maiti et al. 2020a). In the last few years, numerous studies have used wavelet coherence in their research of co-movements and frequency changes in international markets (e.g., Maiti et al. 2020a; Hung 2019; Raza et al. 2019; Mensi et al. 2018; Yang et al. 2017). Mensi et al. (2018) analyzed BRICS countries’ capital co-movements. They used the wavelet approach to test the strengths of co-movement commodity prices between these countries and the influence of the global financial crisis. They also found that portfolio risk is affected by co-movements between stock and oil markets. In some other studies, authors analyzed the differences in the asset return co-movement of the BRICS and of developed economies (Lehkonen and Heimonen 2014). The study used wavelet analysis as inputs for the dynamic conditional correlation framework. They found that the return level of stock market co-movement depends on regional aspects (not only the whole country), level of development, and the timescale of returns. Also, not all BRICS members showed the same co-movement and the dynamic conditional correlations. In addition to this evidence, Lehkonen and Heimonen (2014); Rua and Nunes (2009); and De Jong and De Roon (2005) found that the degree of stock return co-movement varies across different return frequencies.
For the last 30 years, there has been growing attention from researchers to use neural network models in financial forecasting (Vukovic et al. 2020; Vyklyuk et al. 2013). According to Ko and Lin (2008), this growing attention is due to their attribute to imitate elastic nonlinear modeling relationship capabilities. Majhi et al. (2007) argue that attribute is commercial applications and attractive benefits for financial players. Neural network models are most often used in analyses and predictions in finance for portfolio optimization and for forecasting financial performance (Forti et al. 2004; Liu and Wang 2006; Fernández and Gómez 2007; Zhang and Wu 2009; Vukovic et al. 2020), financial ratio analysis and forecasting (Eakins and Stansell 2003; Ko and Lin 2006, 2008), capital (cryptocurrency and stocks) markets forecasting (Maiti et al. 2020b; Maake and Van Zyl 2020; Dai et al. 2012). Maake and Van Zyl (2020) analyzed and forecasted BRICS financial markets. They used artificial neural networks (ANN) to forecast individual stocks across BRICS studied markets. Their study implies ANN is the recommended tool to uncover hidden orders in BRICS markets data. Dai et al. (2012) forecast Asian stock markets with neural network models. The authors found that the stock index prediction model was a good alternative for Asian stock market indices. For the variables affecting broad international markets, we will single out the analysis of Maiti et al. (2020b). The study used neural networks to forecast crypto-currency co-movement. They found that linear models are inadequate on the test set for ANN and LSTM (long short-term memory). According to their findings, neural networks have a much lower error in calculations and forecasting on the test data and LSTM offers even better forecasted results. Previously, (in a similar study, but with different variables) LSTM and ANN techniques were used to forecast Sharpe ratios and investor portfolio positions for the European Union debt market (Vukovic et al. 2020). The authors found that neural networks are appropriate in forecasting nonlinear time lag series with an accuracy of 82% in test cases.
Based on the previously discussed literature, our goal is to apply the artificial neural network technique to forecast co-movement among BRICS capital markets. Before forecasting, we will use wavelet coherence to analyze the dynamics among the BRICS capital markets. There is a big gap in literacy with ANN models based on wavelet coherence data. With this study, we contribute to encouraging future similar research.
3. Data and Methodology
This study uses daily data for a period from 10 December 1999 to 17 January 2019 for Brazil (Brazil Sao Paulo Stock Exchange Index-IBOV), Russia (MOEX Russia Index-INDEXCF), India (Sensex), China (Shanghai Composite Index—SHCOMP), and South Africa (JALSH Index). From this, daily returns are calculated and used in the analysis.
- Methodology
- Wavelet Analysis
To critically analyze the co-movement among the BRICS nations, the study used wavelet coherence and wavelet clustering diagrams. The entire wavelet analysis is conducted by using the “biwavelet1“ package in R programming.
- Wavelet Coherence
In this study, wavelet coherence is used to analyze the continuous co-movement between the pairs at different time and frequency domains (see Torrence and Webster 1999). The wavelet coherence could be perceived as a measure of local correlation of the two time series both in time and in scale. This procedure is analogous to coherence in a Fourier analysis. It is defined as the squared absolute value of the smoothed cross wavelet spectra normalized by the product of the smoothed individual wavelet power spectra of each series as shown in Equation (1).
The study defines the cross wavelet transform of two time series and with the continuous wavelet transforms and , respectively. Then, cross wavelet power as and is a smoothing operator. Without smoothing, the wavelet coherence is equal to one at all scales. The squared wavelet coherence coefficient is in the range .
- Wavelet Clustering
The study uses wavelet clustering to identify, discriminate, and localize clusters in multidimensional space. It uses Ward’s like hierarchical clustering algorithm as explained in Chavent et al. (2018) and as shown in Equation (2).
where dij is the Euclidean distance between the data points.
- Forecasting
- Artificial Neural Network Forecasting
Our previous calculations on these and similar data have shown that classical forecasting methods show poor results due to the existing nonlinear dependence. Nonlinear analytical methods, such as neural networks, work best for such data.
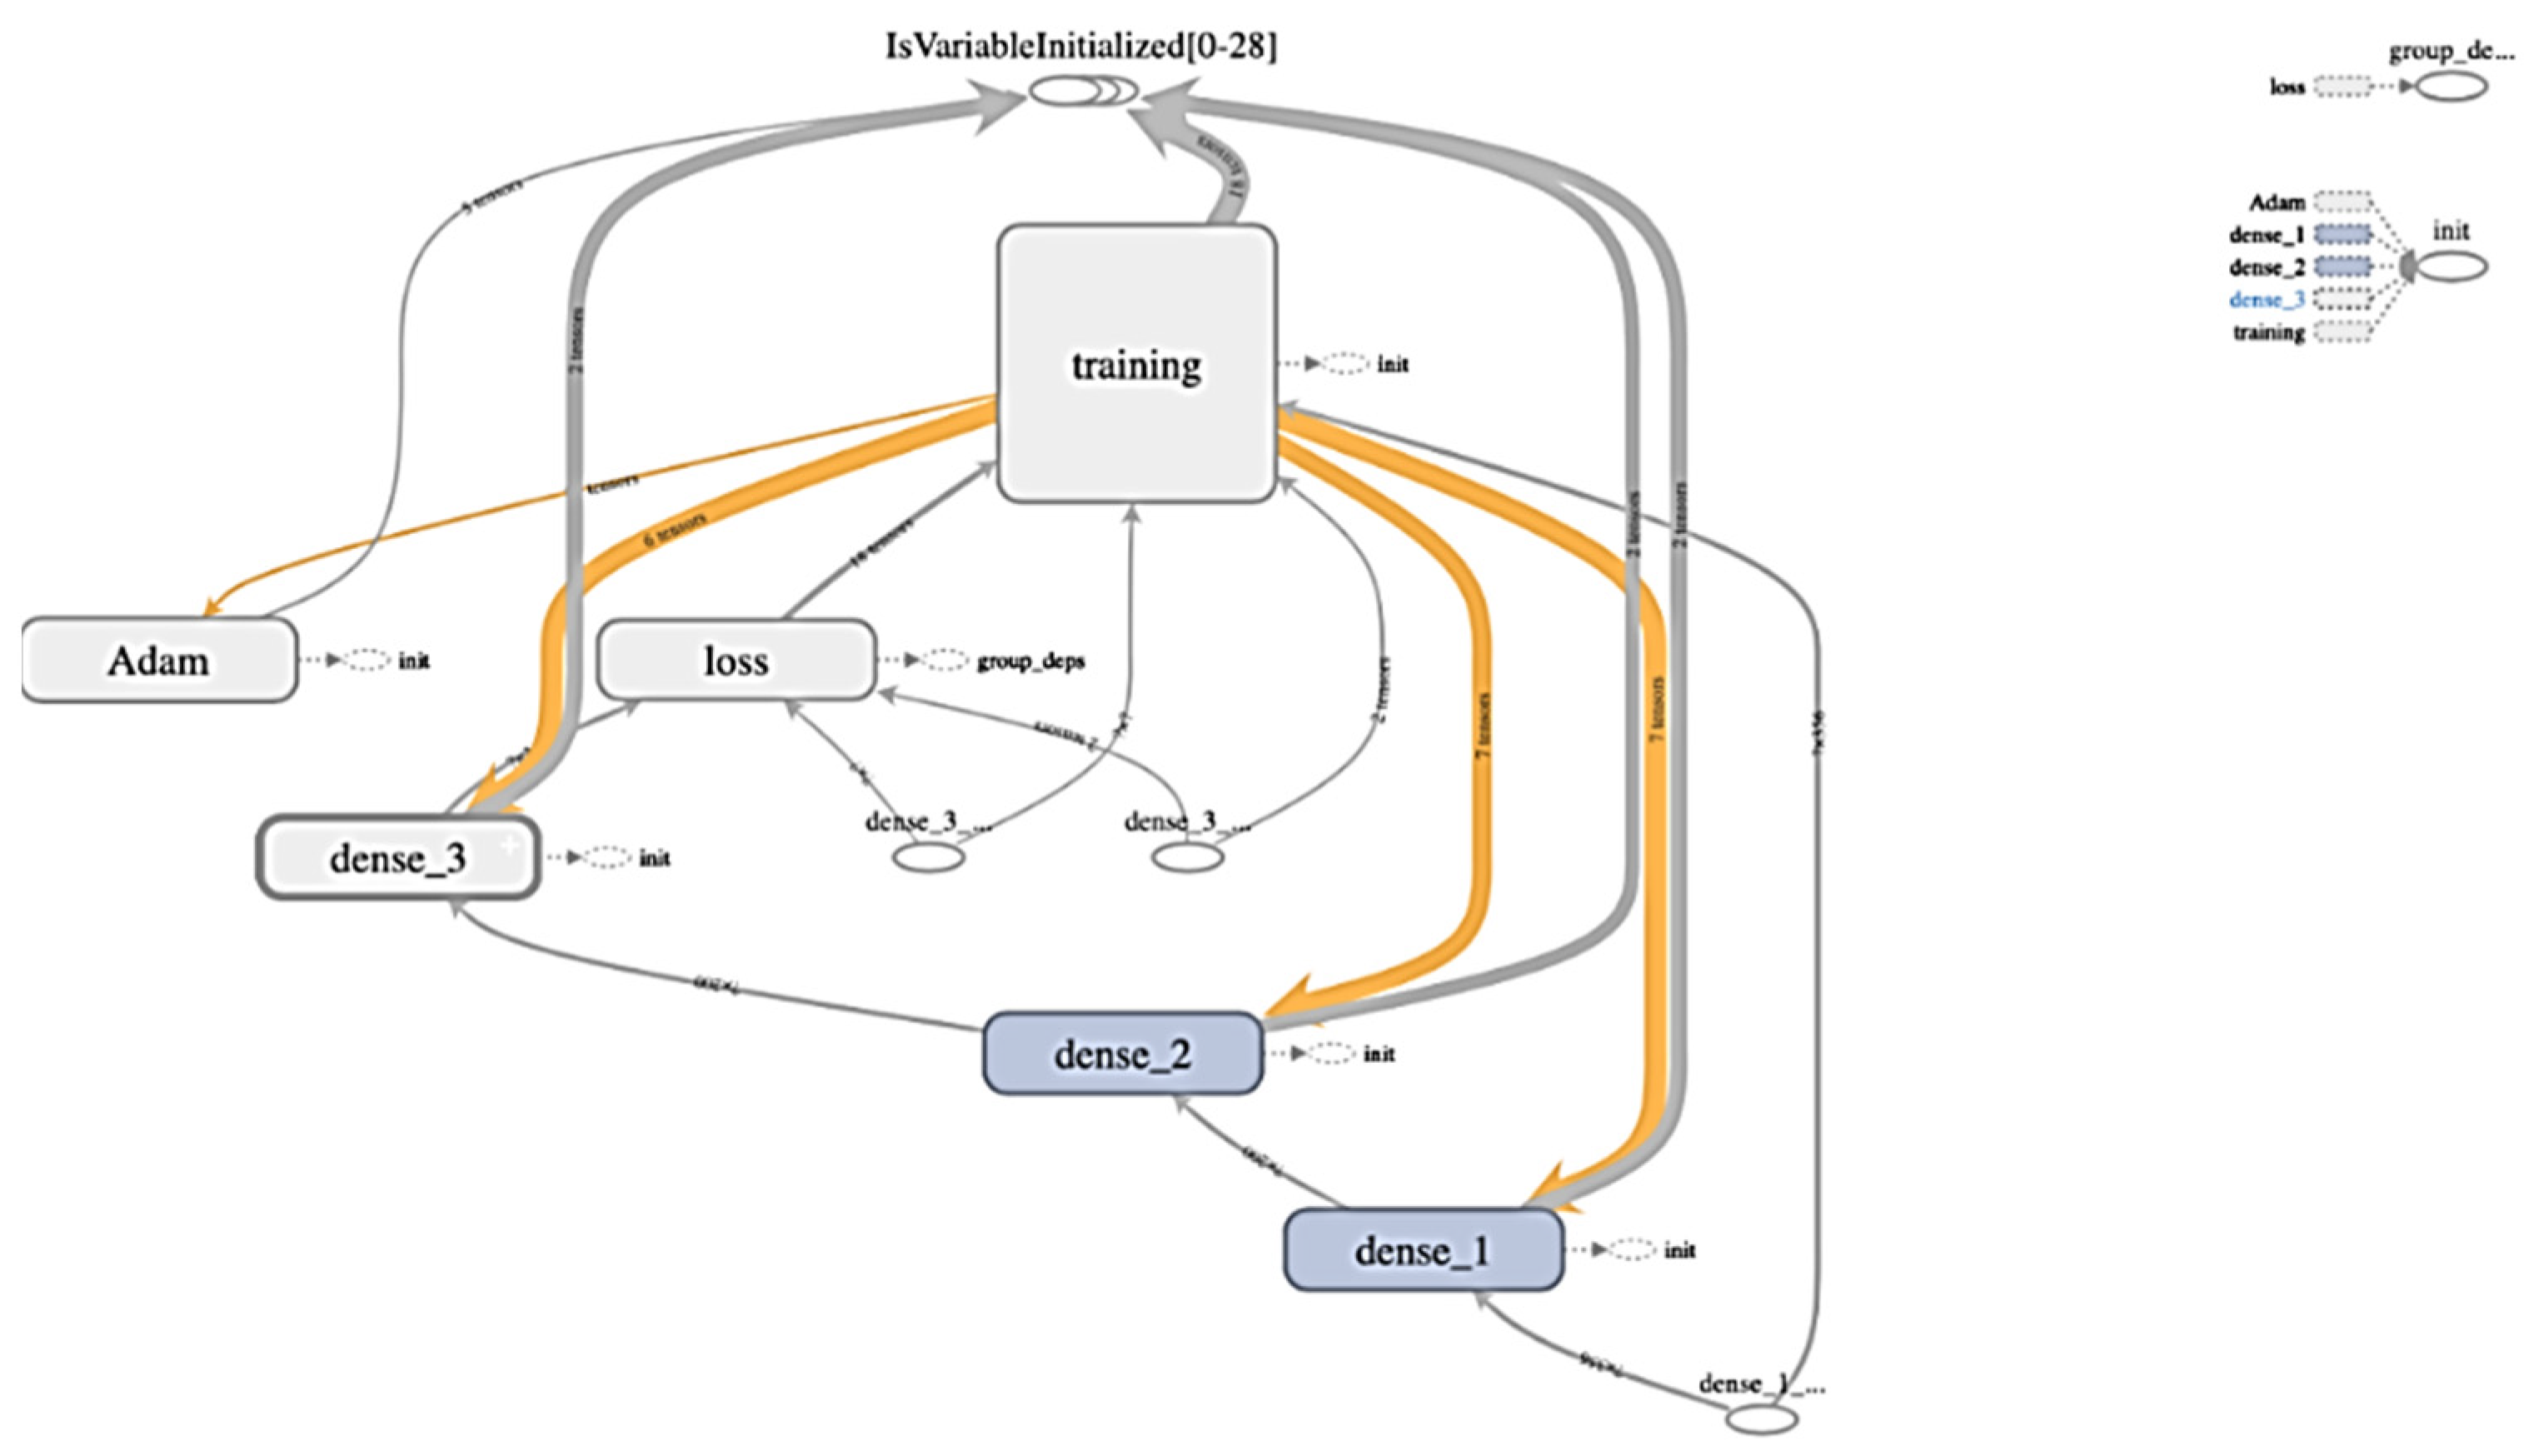
Therefore, the study deploys two types of neural networks (see Vukovic et al. 2020; Maiti et al. 2020b): classical multilayer back-propagation perceptron and modern LSTM recurrent neural network for forecasting BRICS capital market co-movement. Python was chosen as the programming language. TensorFlow from Google was used as a library for deep learning for the neural network. The structure of the neural network is presented in Figure 1.
4. Main Results
- Explanatory Variables
Descriptive statistics of the explanatory variables is shown in Table 1. Russia’s MOEX Index-INDEXCF mean daily return (0.059%) is high among the BRICS (Brazil, Russia, India, China, South Africa) nations. Similarly, China’s Shanghai Composite Index—SHCOMP has low mean daily returns (0.013%) among the BRICS nations. All the time series have high kurtosis similar to Karim et al. (2021).
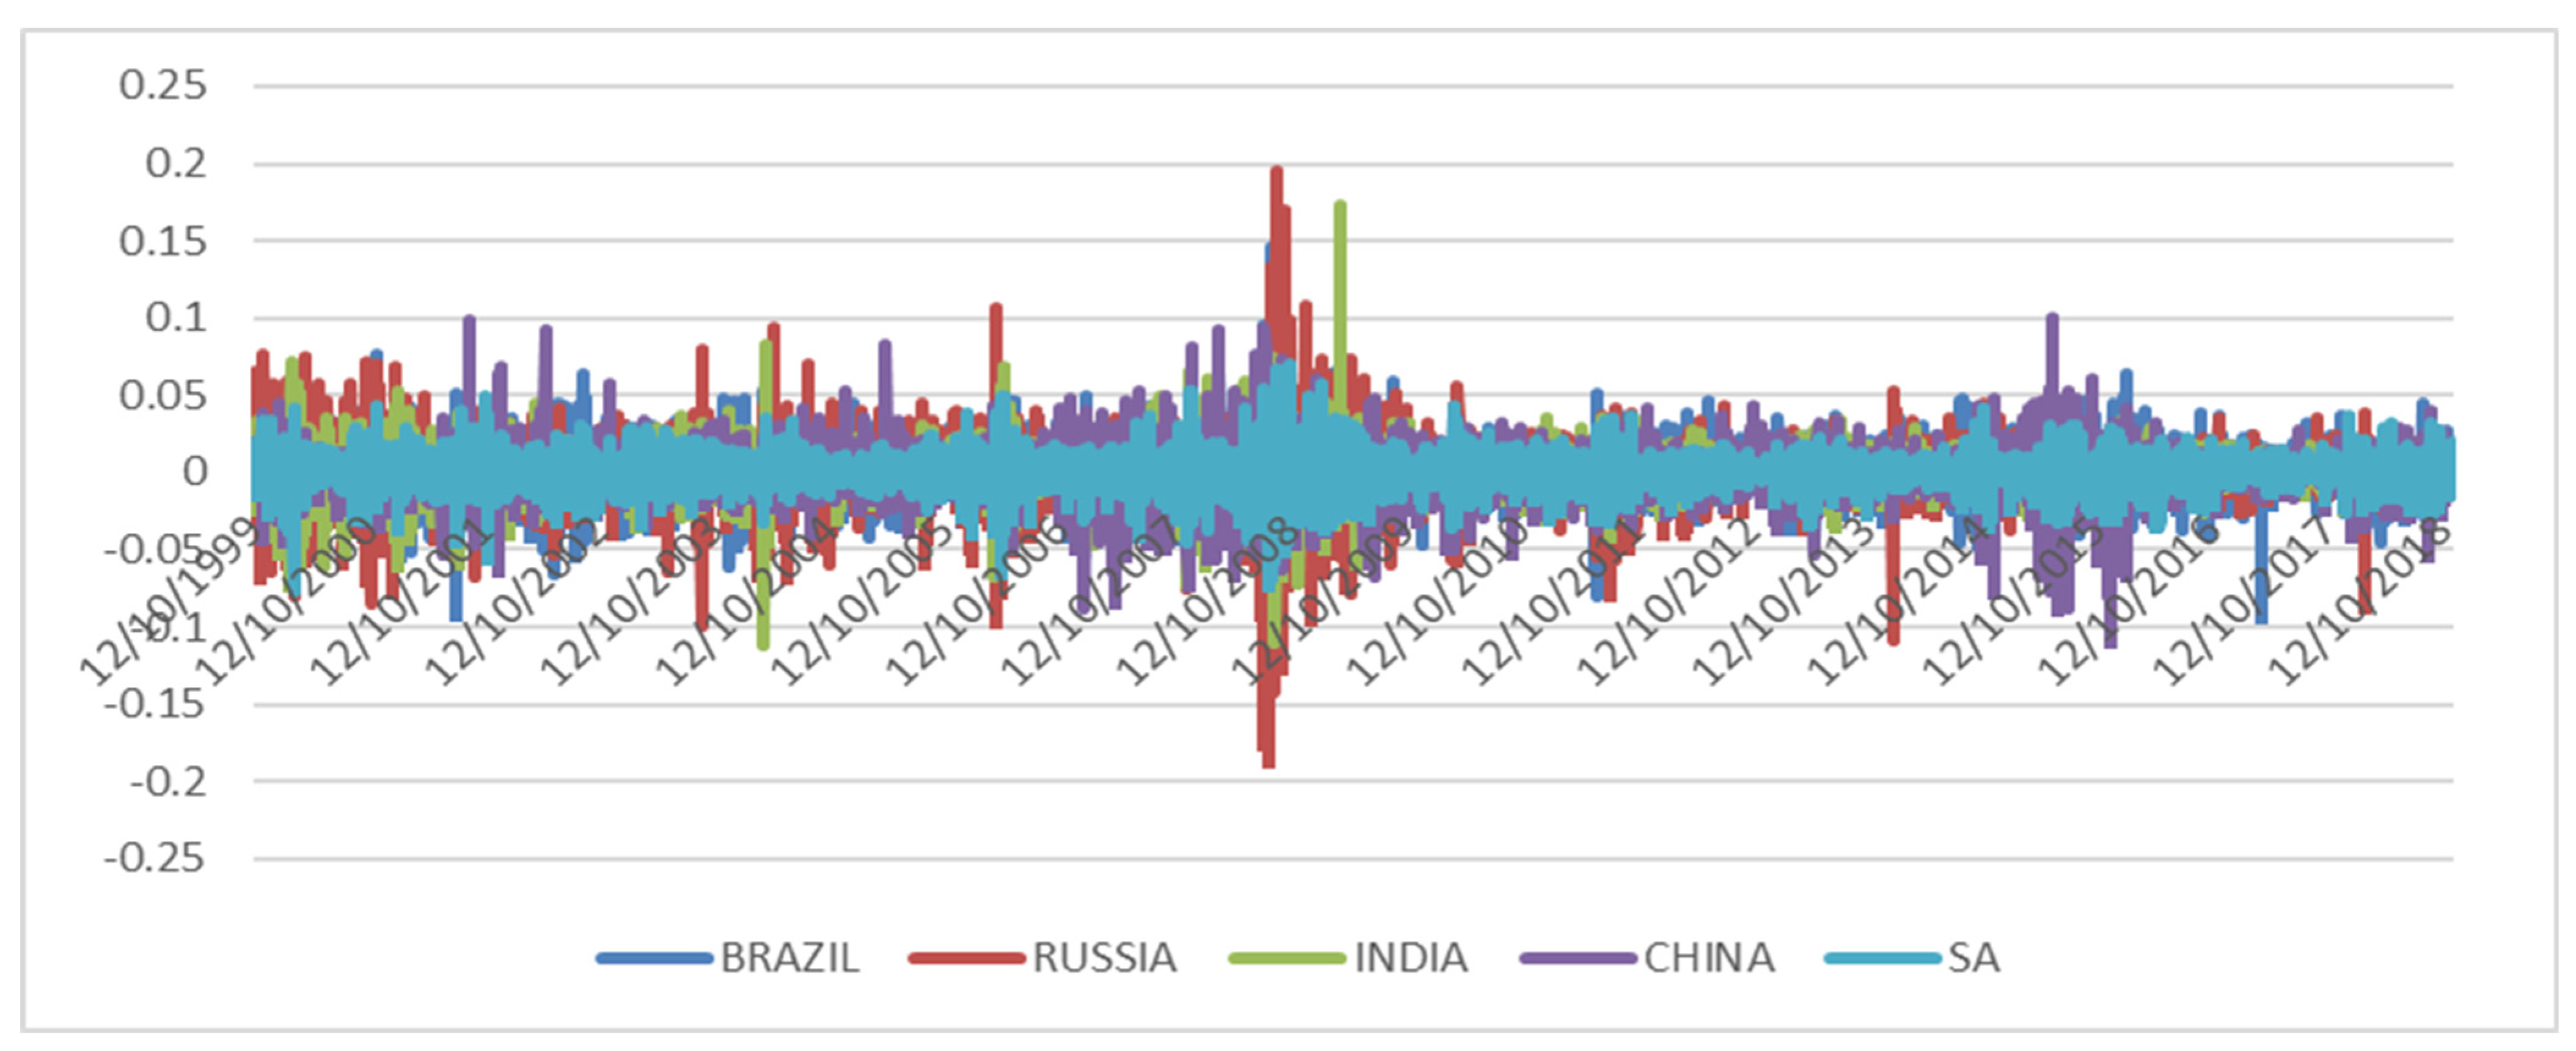
Figure 2 shows Russia’s MOEX Russia Index-INDEXCF has a higher volatility and standard deviation in mean daily returns pattern, whereas Brazil has a lower volatility.
- Wavelet Analysis
- Wavelet Coherence
Wavelet coherence (see Figure 3) is used to locate the time localized common pattern between the two time series. These common patterns of behavior between the two time series may arise due to two reasons. In situation one, one time series is responsible for influencing the other and the other is affected by an unobserved mechanism that influences both time series. Many time series are non-stationary which implies that such series frequency changes over time. Wavelet coherence provides an important coherence measure to study such times series. Situations where one time series is responsible for influencing the other is further interpreted by the phase of the wavelet cross spectrum to identify the relative lead or lag between the two time series. The wavelet cross spectrum defines the relative lead or lag between coherent components where coherence exceeds 0.5 in the regions of the time–frequency plane. The direction of the arrows in the regions of the time–frequency plane indicates the phase difference between the two time series. The direction of the phase arrows indicates the following: right oriented: in-phase; left oriented: anti-phase; down oriented: X leading Y by 90 degrees; similarly, up oriented: Y leading X by 90 degrees. A white dashed line in the regions of the time–frequency plane indicates the cone of influence boundary. White marks the locations of wavefield decomposition where the series is significantly coherent. The horizontal axis in the diagrams represents daily data points from 10 December 1999 to 17 January 2019 and the vertical axis represents different scales.
Figure 3 shows a clear contagion effect among BRICS nations. The Brazil–Russia pair wavelet coherence appears to be significant for (8–16 scale) and onward level during the great financial crisis period. The phase arrow toward right up indicates that Russia leads Brazil for the Brazil–Russia pair. Analogous estimates are obtained for Brazil–India, Brazil–South Africa, Russia–South Africa, India–South Africa (India leads) and Russia–India pairs. Except for China during the great financial crisis period, significant levels of co-movement were observed between other BRICS nations, which lasted for a long period of time. The study findings are in line with the previous findings that support global contagion may be of longer duration due to the ripple effect of several regional crashes. During the great financial crisis, some levels of co-movement were observed between China and other BRICS nations but it lasted for a shorter period of time similar to Forbes and Rigobon (2002).
- Wavelet Clustering
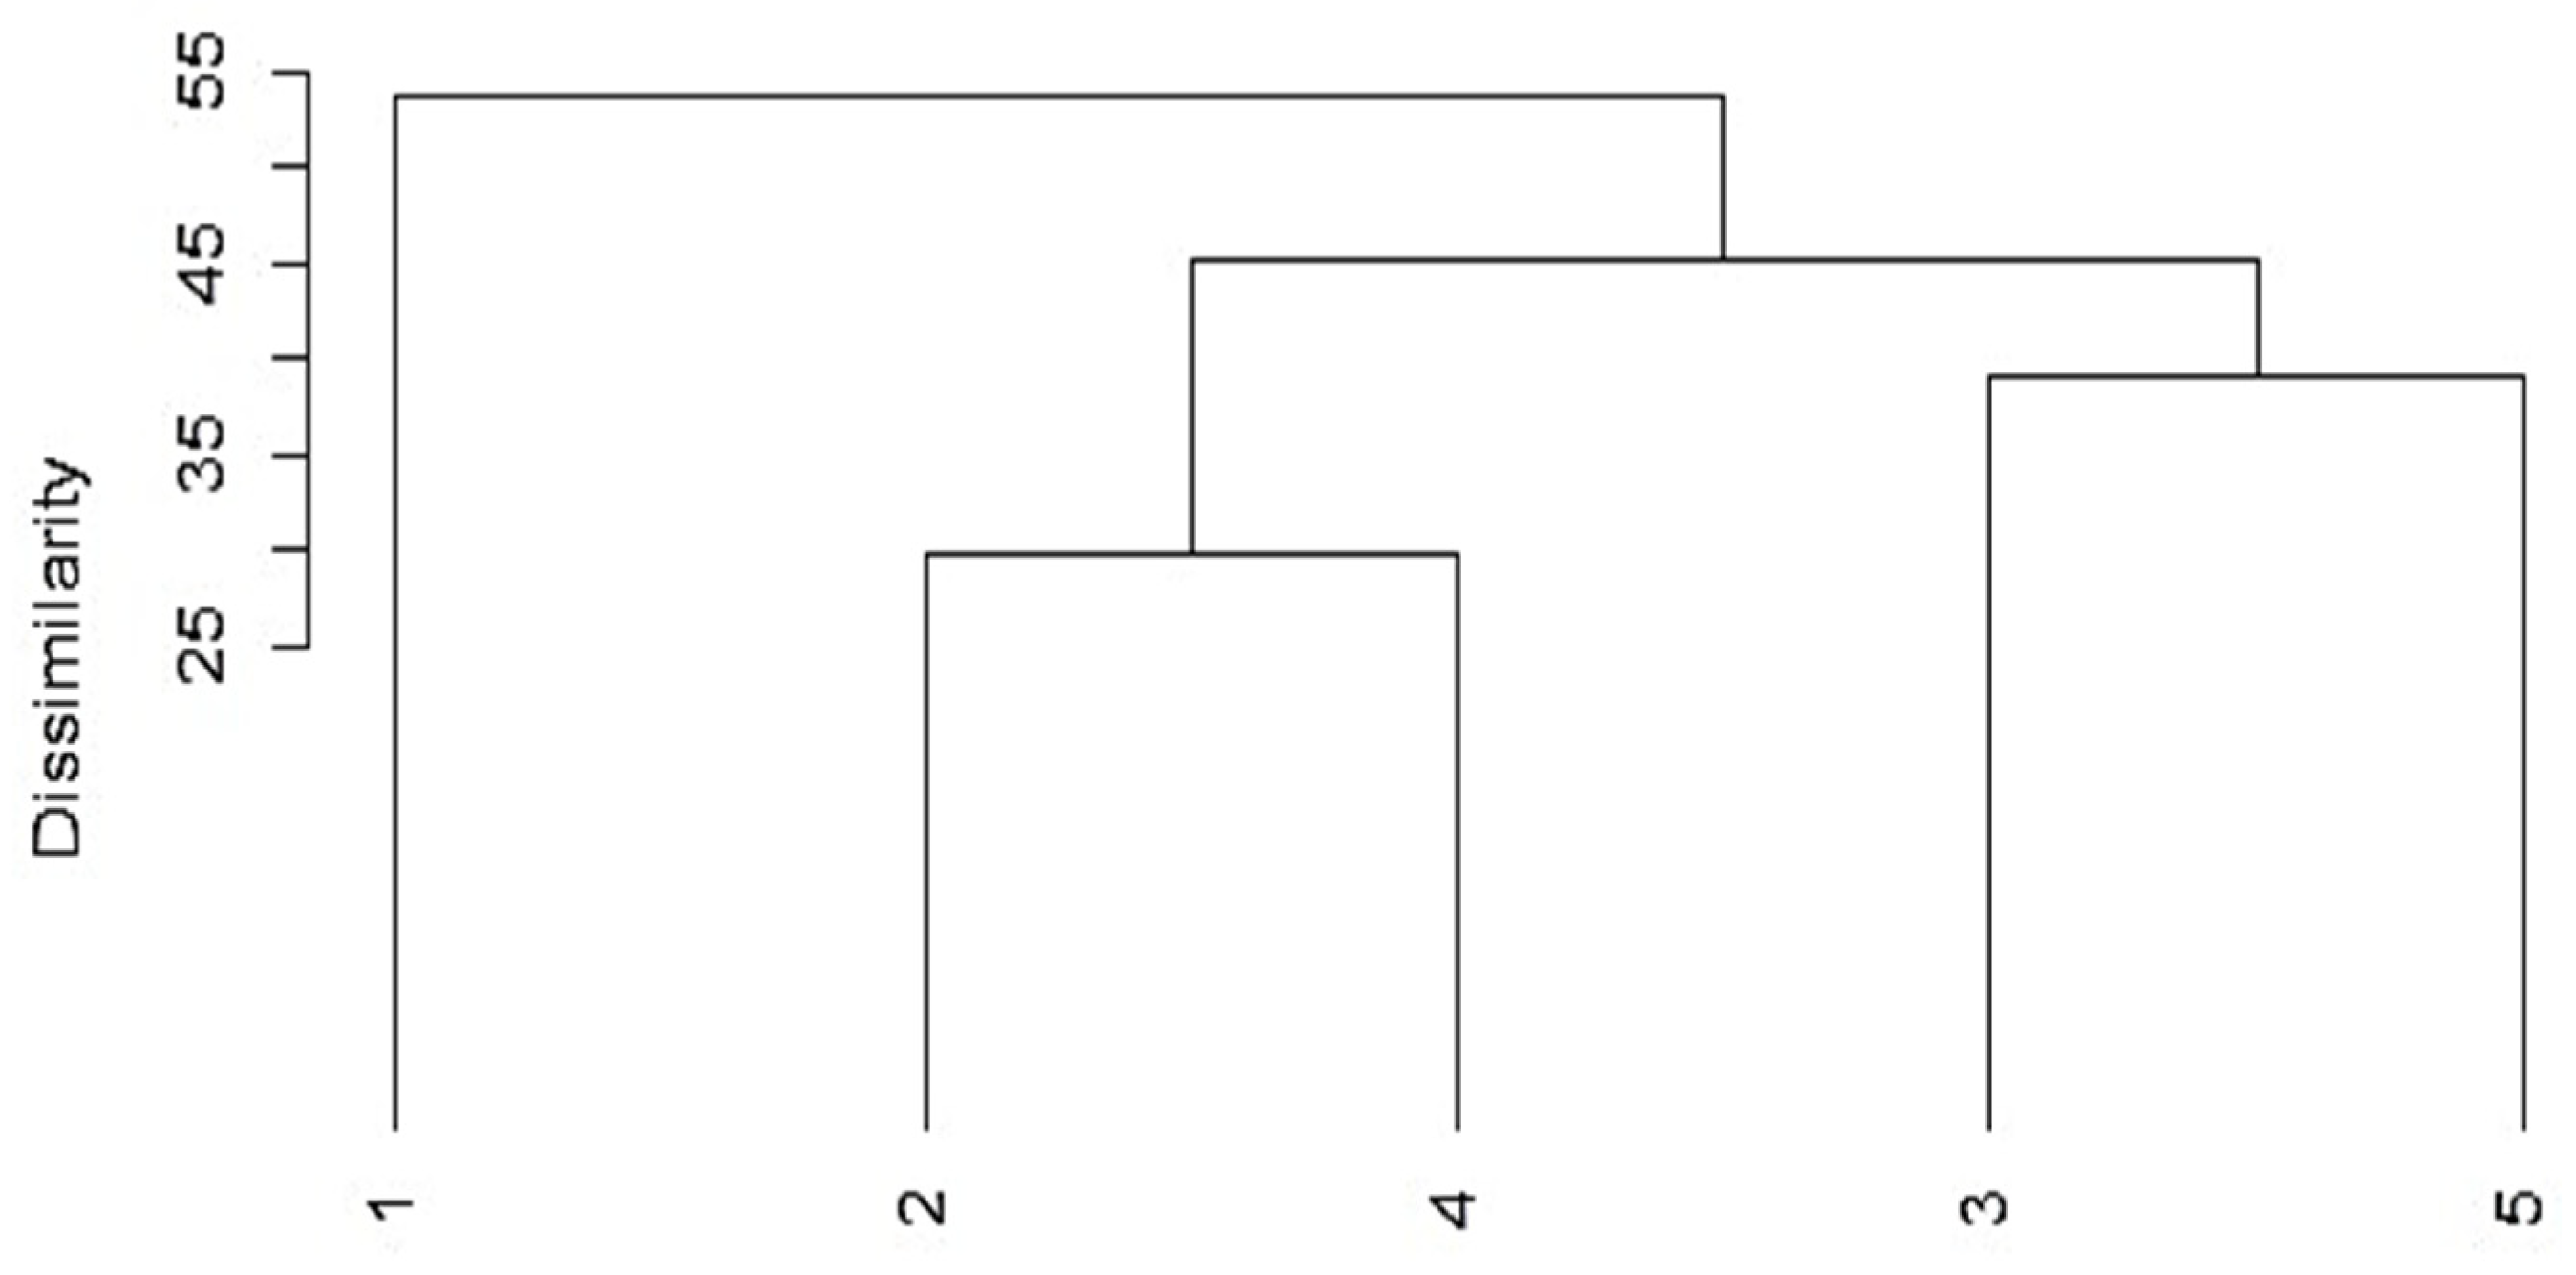
Figure 4 shows the wavelet clustering of BRICS capital markets. In Figure 4, the vertical line shows the dissimilarity and the horizontal line shows the countries (BRICS). The dissimilarity is less significant than the correlation between the clusters. Two clusters consist of ‘Russia and China’ and ‘India and South Africa’. Among these two clusters: the ‘India and South Africa’ dissimilarity distance is slightly higher than the ‘Russia and China’ cluster. It indicates that portfolio diversification is not possible by investing exclusively in the ‘Russia and China’ or the ‘India and South Africa markets’. Brazil’s dissimilarity distance is higher among all the BRICS nations, and it is in line with Rikhotso and Simo-Kengne (2022).
- Forecasting
Wavelet estimates confirm that there are co-movements among the BRICS nations. To forecast such co-movements, the present study used neural networks. The objective was to construct a forecast for seven days and for one year as a variation of data in one country is affected by another .
The study employed data for five different countries. So, there are only 20 different combinations. Considering that for the weekly and the annual forecast, it is necessary to build 2 different models, and the number of different models increases to 40. The database consists of 4765 records. In the next step, it is necessary to transform time series into the next training sample consisting of tuples of shifted data to take into account the influence of one time series on another:
where n—number of time lags (days) that are taken into account in the input time series for forecasting, m—time forecast lag.
Since each field represents a vertical downward shift of the initial time series and —a vertical upward shift of the field , the total number of entries will be reduced by the value n + m so as with such a transformation fields containing NULL values appear, and they should be deleted. Thus, the fields are considered as inputs and —output fields. Forecasting for a week was taken into account as the data for the two previous weeks affecting the next week in another country: n = 14, m = 7. The annual dynamics of the input time series data was considered: n = 355, m = 355.
Two types of neural networks were tested for forecasting: multilayer back-propagation perceptron and LSTM recurrent neural network. As test calculations showed, these two neural networks showed similar results, but LSTM training lasted an order of magnitude longer. Therefore, ANN was used to study 40 different data sets. The best results were obtained for the following configuration: the number of hidden layers—2, the number of neurons in each hidden layer—200, the activation function—the “relu”, the initialization of weight factors—random in normal distribution, optimizer—”adam”, loss coefficient—mean squared error, number of epochs—10,000, and the criterion for stopping learning was the stopping of a decrease in the root-mean-square error (RMSE) of the test set during 10 epochs of training.
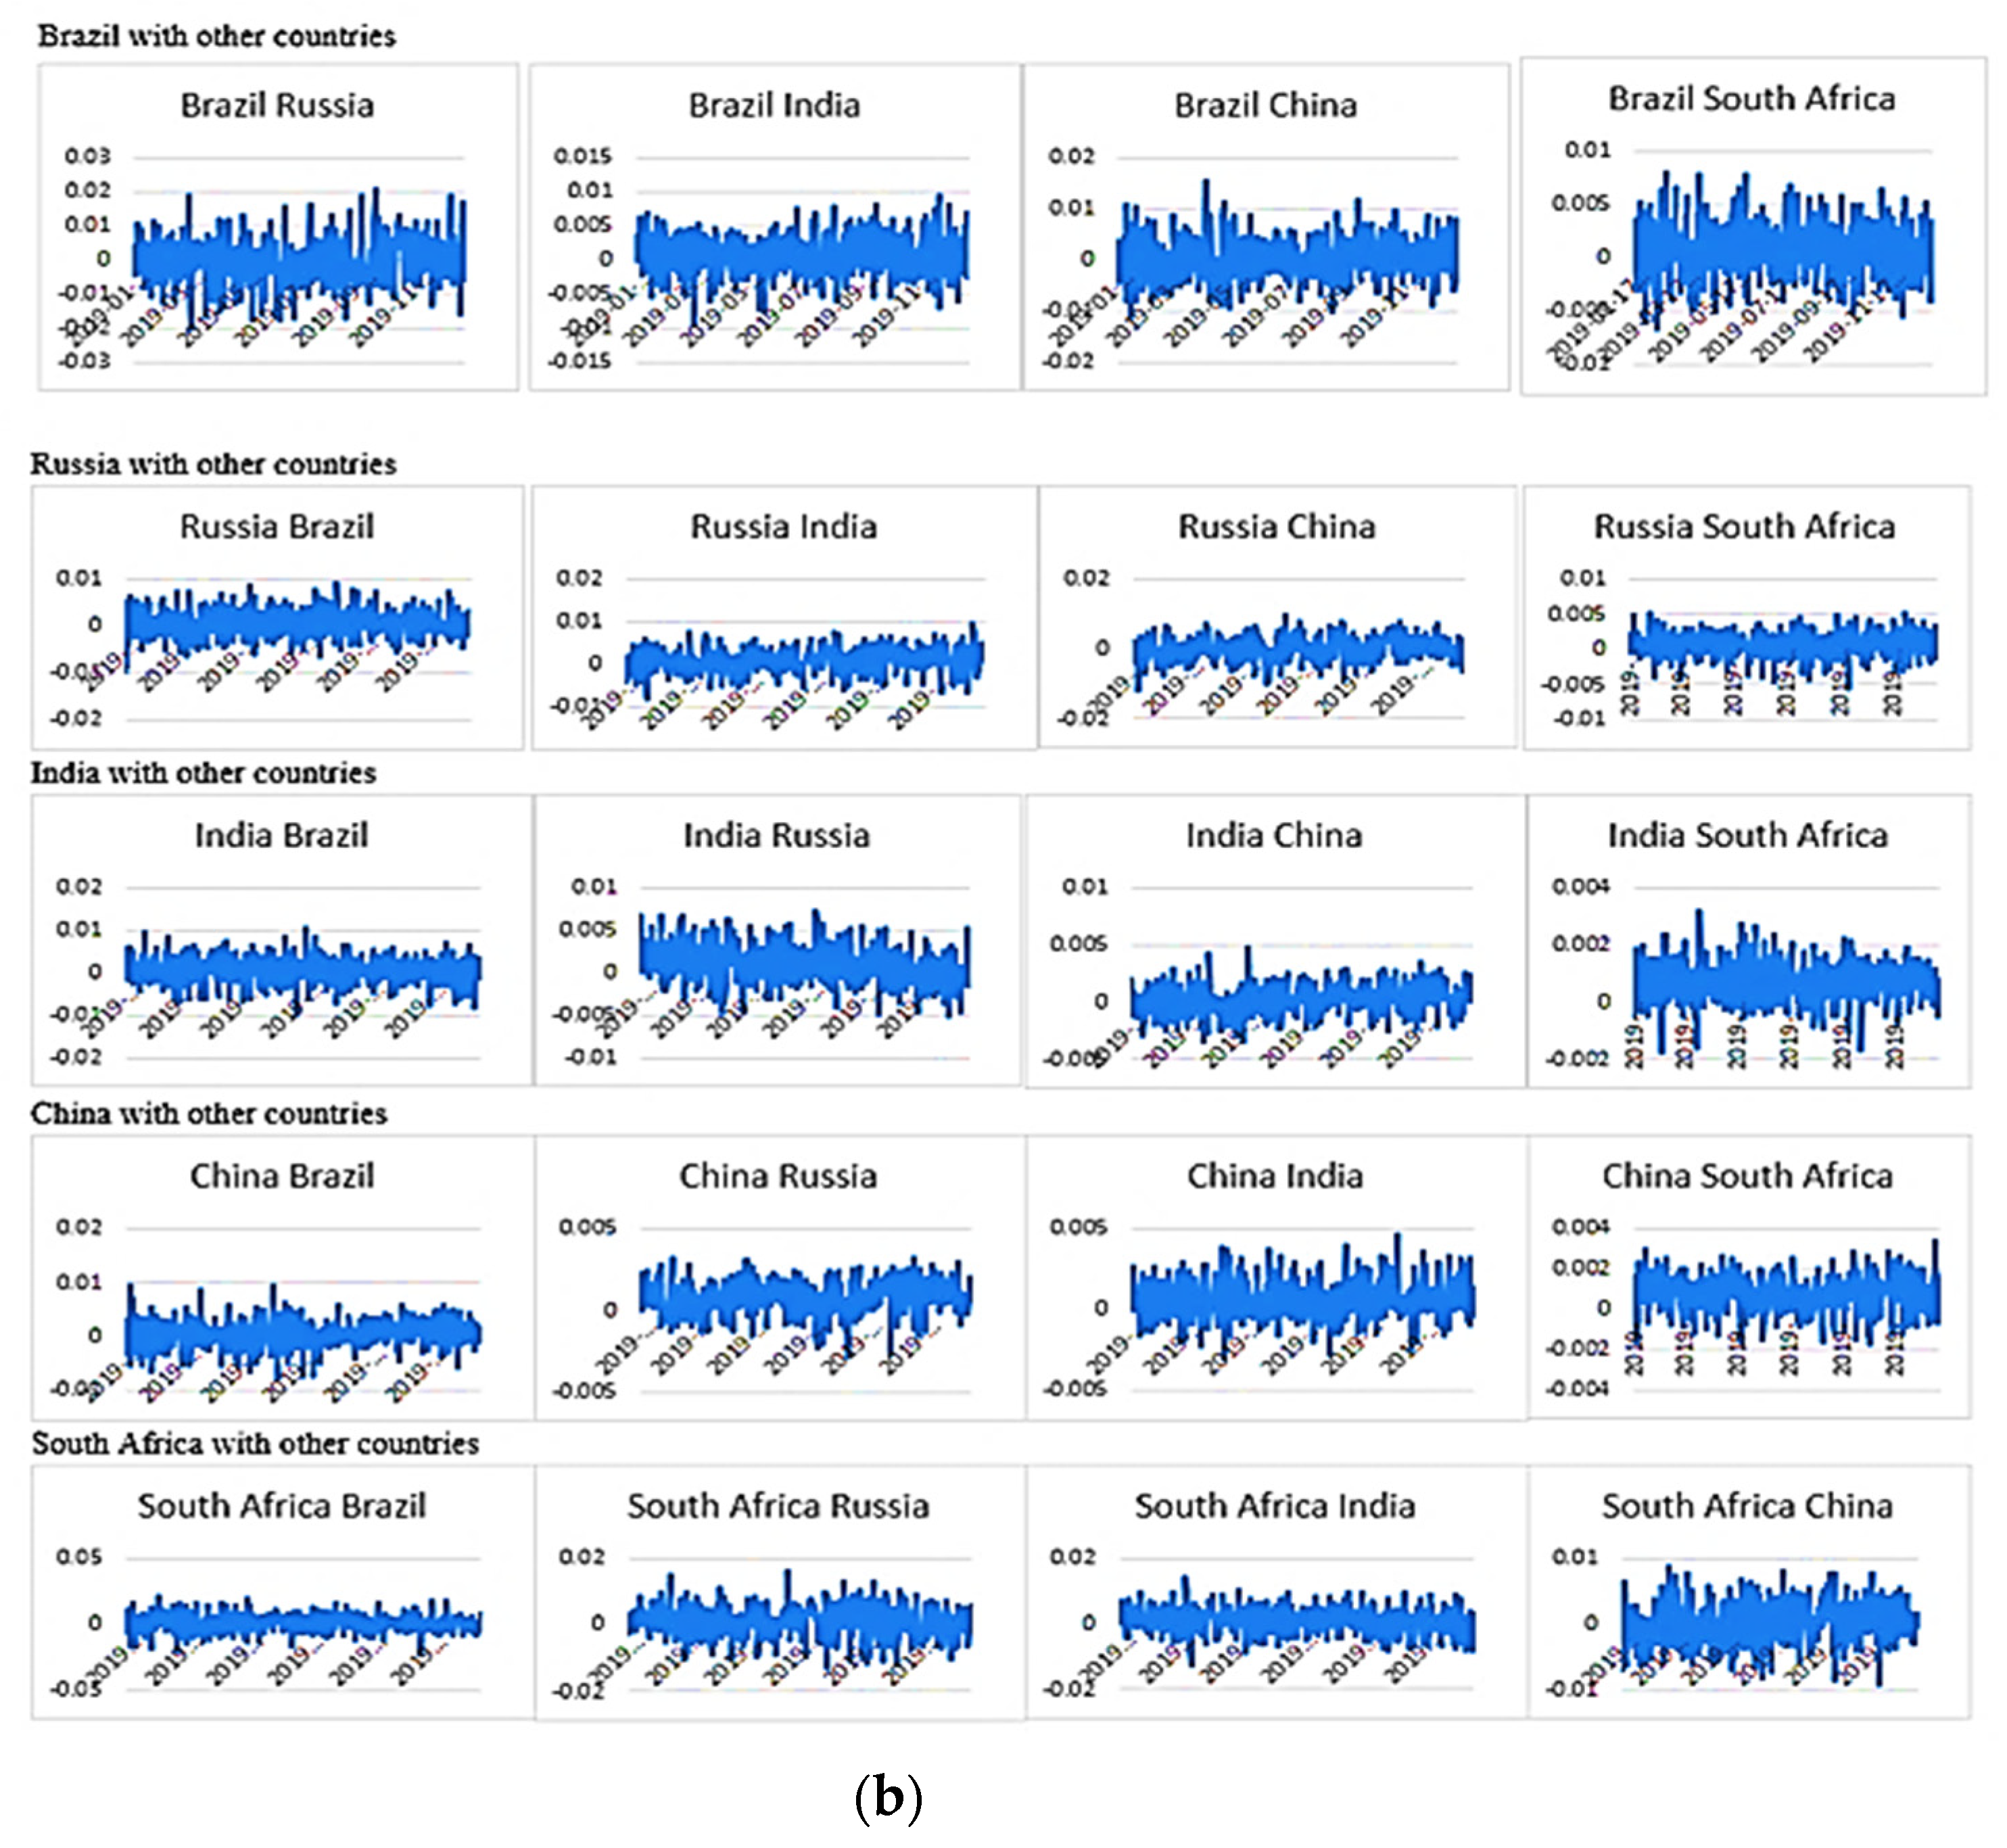
The data set was divided into training and tests in a proportion of 80/20. Where the last 20% rows of the data set were considered to be a test. There were dense—hidden layers, training—data set for learning, loss—coefficients of learning error, and adam—learning optimization function. The accuracy of training can be estimated by comparing the test data with the prediction according to the neural network (Figure 1). Figure 5 shows the annual comparison of forecast data with real data between the country pairs, respectively. It also shows that in most of the cases our neural network model was found to be accurate, especially in the case of Brazil with other countries as compared to the other cases. ANN forecasting for the following pairs was found to be closer to accurate for the following pairs: Russia–Brazil, Russia–India, China–India, and South Africa–Brazil. Then, for weekly and annual forecasting, the data set was transformed into a next set of tuples:
That is, each row was a tuple of input data. The last record of this sample was applied to the input of the neural network. The output received a forecast for a week and a year depending on the structure of the neural network. The resulting one year forecasts are presented in Figure 5a,b. The obtained RMSE for these calculations are represented in Table 2. One can see from Table 2, RMSE for the week forecasting are a little less than for the year in most cases. The calculation impact SA on other countries showed a smaller yearly RMSE than for the weekly. It also confirms the robustness of the forecasting model as the RMSE values are less and closer to zero.
5. Conclusions
Capital markets are often termed as the barometer of a country’s economy as they are directly related to the country’s economic performance. Currently, due to openness and globalization, most capital markets are interrelated so that any event in one market will affect the other markets. So, it is important for policy makers and market participants to know the degree or level to which capital markets are interrelated with each other. To diversify risk, investors always try to invest in the markets which are less correlated or that have low correlations. Against this backdrop, the present study analyzes BRICS capital market co-movement using both discrete and continuous wavelet transform in a time frequency domain. The wavelet coherence diagram shows a clear contagion effect among BRICS nations, and it favors short period investments over longer period investments. Except for China during the great financial crisis period, a significant level of coherence was observed between other BRICS nations, which lasted for a longer period. A wavelet clustering diagram shows that the ‘India and South Africa’ dissimilarity distance is slightly higher than that of ‘Russia and China’. Wavelet clustering also suggests that portfolio diversification benefits are not possible by investing exclusively in the ‘Russia and China’ or in the ‘India and South Africa’ markets. Brazil’s dissimilarity distance is higher among all the BRICS nations. Overall study implications are that co-movement among BRICS nations differs at different time frequency domains. The study findings are in a similar line with Bekaert and Harvey (1995); Goetzmann et al. (2005), etc., whose findings in a global context support co-movement among BRICS nations that differs at different time frequency domains. Hence, it is advisable that global investors who are interested in investing in BRICS nations should include Brazil in the portfolio to gain maximum benefits from the diversification (Qureshi et al. 2020). The present study further tested two types of neural networks for forecasting: multilayer back-propagation perceptron and LSTM recurrent neural network. Study test calculations show these two neural networks showed similar results, but LSTM training lasted an order of magnitude longer. Therefore, ANN was used to study 40 different data sets. The study results show that in most cases, our neural network model was found to be significantly closer to accurate as RMSE values confirm the robustness of the forecasting model.
Further research could use tick data or real time data to examine BRICS integrations. Future studies could quantify the information flow between BRICS and different macroeconomic variables.
Author Contributions
Conceptualization, M.M.; methodology, M.M., D.V. and Y.V.; validation, M.M., D.V. and Y.V.; formal analysis, M.M., D.V., Y.V. and Z.G.; writing—original draft preparation, M.M., D.V. and Y.V.; writing—review and editing, M.M., D.V., Y.V. and Z.G.; visualization, M.M., D.V., Y.V. and Z.G.; supervision, M.M.; Project administration, M.M. All authors have read and agreed to the published version of the manuscript.
Funding
The manuscript was supported by the Russian Science Foundation, project no. 22-28-01553.
Data Availability Statement
Publicly Available from the official websites or Yahoo or others.
Acknowledgments
This manuscript is the result of the research Making Smart Decisions in the Face of Uncertainty in Russia: Investing and Forecasting in a Crisis (project no. 22-28-01553).
Conflicts of Interest
The authors declare no conflict of interest.
| 1 | https://cran.r-project.org/web/packages/biwavelet/biwavelet.pdf (accessed on 1 March 2022). |
References
- Aggarwal, Shalini, and Abhay Raja. 2019. Stock market interlinkages among the BRIC economies. International Journal of Ethics and Systems 35: 59–74. [Google Scholar] [CrossRef]
- Ahlgren, Niklas, and Jan Antell. 2002. Testing For Cointegration Between International Stock Prices. Applied Financial Economics 12: 851–61. [Google Scholar] [CrossRef]
- Aloui, Chaker, and Besma Hkiri. 2014. Co-movements of GCC emerging stock markets: New evidence from wavelet coherence analysis. Economic Modelling 36: 421–31. [Google Scholar] [CrossRef]
- Arshanapalli, Bala, and John Doukas. 1993. International stock market linkages: Evidence from the pre- and post-1987 period. Journal of Banking and Finance 17: 193–208. [Google Scholar] [CrossRef]
- Bekaert, Geert, and Campbell R. Harvey. 1995. Time-varying world market integration. Journal of Finance 50: 403–44. [Google Scholar] [CrossRef]
- Brooks, Robin, and Marco Del Negro. 2004. The rise in co-movement across national stock markets: Market integration or IT bubble. Journal of Empirical Finance 11: 659–80. [Google Scholar] [CrossRef] [Green Version]
- Chan, Kam C., Benton E. Gup, and Ming-Shiun Pan. 1997. International Stock Market Efficiency And Integration: A Study of Eighteen Nations. Journal of Business Finance and Accounting 24: 803–13. [Google Scholar] [CrossRef]
- Chaudhuri, Kausik. 1997. Cointegration, Error Correction And Granger Causality: An Application with Latin American Stock Markets. Applied Economics Letters 4: 469–71. [Google Scholar] [CrossRef]
- Chavent, Marie, Vanessa Kuentz-Simonet, Amaury Labenne, and Jérôme Saracco. 2018. ClustGeo: An R package for hierarchical clustering with spatial constraints. Computational Statistics 33: 1799–822. [Google Scholar] [CrossRef] [Green Version]
- Dai, Wensheng, Jui-Yu Wu, and Chi-Jie Lu. 2012. Combining nonlinear independent component analysis and neural network for the prediction of Asian stock market indexes. Expert Systems with Applications 39: 4444–52. [Google Scholar] [CrossRef]
- De Jong, Frank, and Frans A. De Roon. 2005. Time-varying market integration and expected returns in emerging markets. Journal of Financial Economics 78: 583–613. [Google Scholar] [CrossRef] [Green Version]
- Dima, B., Ş. M. Dima, and Flavia Barna. 2015. A wavelet analysis of capital markets’ integration in Latin America. Applied Economics 47: 1019–36. [Google Scholar] [CrossRef]
- Dimitriou, Dimitrios, Dimitris Kenourgios, and Theodore Simos. 2013. Global financial crisis and emerging stock market contagion: A multivariate FIAPARCH–DCC approach. International Review of Financial Analysis 30: 46–56. [Google Scholar] [CrossRef]
- Eakins, Stanley G., and Stanley R. Stansell. 2003. Can value-based stock selection criteria yield superior risk-adjusted returns: An application of neural networks. International Review of Financial Analysis 12: 83–97. [Google Scholar] [CrossRef]
- Fernández, Alberto, and Sergio Gómez. 2007. Portfolio selection using neural networks. Computers & Operations Research 34: 1177–91. [Google Scholar] [CrossRef] [Green Version]
- Forbes, Kristin J., and Roberto Rigobon. 2002. No contagion, only interdependence: Measuring stock market comovements. Journal of Finance 57: 2223–61. [Google Scholar] [CrossRef]
- Forti, Mauro, Paolo Nistri, and Marc Quincampoix. 2004. Generalized neural network for nonsmooth nonlinear programming problems. IEEE Transactions on Circuits and Systems-I 51: 1741–54. [Google Scholar] [CrossRef]
- Goetzmann, William N., Lingfeng Li, and K. Geert Rouwenhorst. 2005. Long-term global market correlations. Journal of Business 78: 1–38. [Google Scholar] [CrossRef] [Green Version]
- Granger, Clive William John, and Oskar Morgenstern. 1970. The Predictability of Stock Market Prices. Lexington: Heath Lexington Books, Heath & Co. [Google Scholar]
- Grubel, Herbert G. 1968. Internationally diversified portfolios: Welfare gains and capital flows. American Economic Review 58: 1299–314. [Google Scholar]
- Hung, Ngo Thai. 2019. Equity market integration of China and Southeast Asian countries: Further evidence from MGARCH-ADCC and wavelet coherence analysis. Quantitative Finance and Economics 3: 201–20. [Google Scholar] [CrossRef]
- Johnson, Robert, and Luc Soenen. 2003. Economic integration and stock market co-movement in the Americas. Journal of Multinational Financial Management 13: 85–100. [Google Scholar] [CrossRef]
- Kang, Sang Hoon, and Seong-Min Yoon. 2011. The global financial crises and the integartion of emerging stock markets in Asia. Journal of East Asian Economic Integration 15: 49–73. [Google Scholar]
- Kao, Wei-Shun, Tzu-Chuan Kao, Chang-Cheng Changchien, Li-Hsun Wang, and Kuei-Tzu Yeh. 2018. Contagion in International Stock Markets After the Subprime Mortgage Crisis. The Chinese Economy 51: 130–53. [Google Scholar] [CrossRef]
- Karim, Muhammad Mahmudul, Mohammad Ashraful Ferdous Chowdhury, and Mansur Masih. 2021. Re-examining oil and BRICS’stock markets: New evidence from wavelet and MGARCH-DCC. Macroeconomics and Finance in Emerging Market Economies, 1–19. [Google Scholar] [CrossRef]
- Kasa, Kenneth. 1992. Common stochastic trends in international stock markets. Journal of Monetary Economics 29: 95–124. [Google Scholar] [CrossRef]
- Ko, Po-Chang, and Ping-Chen Lin. 2006. An evolution-based approach with modularized evaluations to forecast financial distress. Knowledge Based Systems 19: 84–91. [Google Scholar] [CrossRef]
- Ko, Po-Chang, and Ping-Chen Lin. 2008. Resource allocation neural network in portfolio selection. Expert Systems with Applications 35: 330–37. [Google Scholar] [CrossRef]
- Lau, Chi Keung Marco, and Xin Sheng. 2018. Inter-and intra-regional analysis on spillover effects across international stock markets. Research in International Business and Finance 46: 420–29. [Google Scholar] [CrossRef] [Green Version]
- Lehkonen, Heikki, and Kari Heimonen. 2014. Timescale-dependent stock market comovement: BRICs vs. developed markets. Journal of Empirical Finance 28: 90–103. [Google Scholar] [CrossRef] [Green Version]
- Levy, Haim, and Marshall Sarnat. 1970. International diversification of investment portfolios. American Economic Review 60: 668–75. [Google Scholar]
- Liu, Qingshan, and Jun Wang. 2006. A recurrent neural network for non-smooth convex programming subject to linear equality and bound constraints. In LNCS: Processing 13th International Conference on Neural Information Processing. Berlin and Heidelberg: Springer, vol. 4233, pp. 1004–13. [Google Scholar]
- Maake, Witness, and Terence Van Zyl. 2020. Applications of Machine Learning to Estimating the Sizes and Market Impact of Hidden Orders in the BRICS Financial Markets. Journal Financial Economics 11: 223–49. [Google Scholar] [CrossRef]
- Maiti, Moinak. 2021. Quantile regression, asset pricing and investment decision. IIMB Management Review 33: 28–37. [Google Scholar] [CrossRef]
- Maiti, Moinak, and A. Balakrishnan. 2018. Is human capital the sixth factor? Journal of Economic Studies 45: 710–37. [Google Scholar] [CrossRef]
- Maiti, Moinak, and A. Balakrishnan. 2020. Can leverage effect coexist with value effect? IIMB Management Review 32: 7–23. [Google Scholar] [CrossRef]
- Maiti, Moinak, Darko Vukovic, Viktor Krakovich, and Maneesh Kumar Pandey. 2020a. How integrated are cryptocurrencies. International Journal of Big Data Management 1: 64–80. [Google Scholar] [CrossRef]
- Maiti, Moinak, Yaroslav Vyklyuk, and Darko Vuković. 2020b. Cryptocurrencies Co-movement Forecasting with Neural Networks. Internet Technology Letters 3: e157. [Google Scholar] [CrossRef]
- Majhi, Ritanjah, Ganapati Panda, Gadadhar Sahoo, Pradipta K. Dash, and Debi Prasad Das. 2007. Stock market prediction of S&P 500 and DJIA using bacterial foraging optimization technique. Paper presented at the 2007 IEEE Congress on Evolutionary Computation (CEC 2007), Singapore, September 25–28; pp. 2569–75. [Google Scholar]
- Malliaris, Anastasios G., and Jorge L. Urrutia. 1992. The international crash of October 1987: Causality tests. Journal of Financial and Quantitative Analysis 27: 353–63. [Google Scholar] [CrossRef] [Green Version]
- Markowitz, Harry M. 1952. Portfolio selection. The Journal of Finance 7: 77–91. [Google Scholar]
- Mensi, Walid, Shawkat Hammoudeh, and Sang Hoon Kang. 2017. Dynamic linkages between developed and BRICS stock markets: Portfolio risk analysis. Finance Research Letters 21: 26–33. [Google Scholar] [CrossRef]
- Mensi, Walid, Besma Hkiri, Khamis H. Al-Yahyaee, and Sang Hoon Kang. 2018. Analyzing time–frequency co-movements across gold and oil prices with BRICS stock markets: A VaR based on wavelet approach. International Review of Economics and Finance 54: 74–102. [Google Scholar] [CrossRef]
- Patel, Ritesh J. 2017. Co-movement and integration among stock markets: A study of 14 countries. Indian Journal of Finance 11: 53–66. [Google Scholar] [CrossRef]
- Qureshi, Fiza, Saba Qureshi, Sobia Shafaq Shah, Ijaz Ur Rehman, and Faisal Shahzad. 2020. Further evidence on co-movement between equity funds and business cycle variables in BRICS: A Wavelet analysis. Borsa Istanbul Review 20: S93–S102. [Google Scholar] [CrossRef]
- Islam, Raisul. 2014. A comparison of the long term interdependence of Southeast Asian equity markets. Journal of East Asian Economic Integration 18: 187–221. [Google Scholar] [CrossRef]
- Ramos-Requena, José Pedro, Juan Evangelista Trinidad-Segovia, and Miguel Ángel Sánchez-Granero. 2020. An Alternative Approach to Measure Co-Movement between Two Time Series. Mathematics 8: 261. [Google Scholar] [CrossRef] [Green Version]
- Ratanapakorn, Orawan, and Subhash C. Sharma. 2002. Interrelationships among regional stock indices. Review of Financial Economics 11: 91–108. [Google Scholar] [CrossRef]
- Raza, Syed Ali, Nida Shah, and Arshian Sharif. 2019. Time frequency relationship between energy consumption, economic growth and environmental degradation in the United States: Evidence from transportation sector. Energy 173: 706–20. [Google Scholar] [CrossRef]
- Rikhotso, Prayer M., and Beatrice D. Simo-Kengne. 2022. Dependence structures between Sovereign credit default swaps and global risk factors in BRICS countries. Journal of Risk and Financial Management 15: 109. [Google Scholar] [CrossRef]
- Rua, António, and Luís C. Nunes. 2009. International co-movement of stock market returns: A wavelet analysis. Journal of Empirical Finance 16: 632–39. [Google Scholar] [CrossRef] [Green Version]
- Shik Lee, Hahn. 2004. International transmission of stock market movements: A wavelet analysis. Applied Economics Letters 11: 197–201. [Google Scholar] [CrossRef]
- Syriopoulos, Theodore. 2007. Dynamic linkages between emerging European and developed stock markets: Has the EMU any impact? International Review of Financial Analysis 16: 41–60. [Google Scholar] [CrossRef]
- Sznajderska, Anna. 2019. The role of China in the world economy: Evidence from a global VAR model. Applied Economics 51: 1574–87. [Google Scholar] [CrossRef]
- Torrence, Christopher, and Peter J. Webster. 1999. Interdecadal changes in the ESNO—Monsoon system. Journal of Climate 12: 2679–90. [Google Scholar] [CrossRef] [Green Version]
- Vukovic, Darko B., Kseniya A. Lapshina, and Moinak Maiti. 2019. European Monetary Union bond market dynamics: Pre & post crisis. Research in International Business and Finance 50: 369–80. [Google Scholar]
- Vukovic, Darko, Yaroslav Vyklyuk, Natalia Matsiuk, and Moinak Maiti. 2020. Neural network forecasting in prediction Sharpe ratio: Evidence from EU debt market. Physica A: Statistical Mechanics and Its Applications 542: 123331. [Google Scholar] [CrossRef]
- Vukovic, Darko B., Kseniya A. Lapshina, and Moinak Maiti. 2021. Wavelet Coherence Analysis of Returns, Volatility and Interdependence of the US and the EU Money markets: Pre & Post Crisis. The North American Journal of Economics and Finance 58: 101457. [Google Scholar] [CrossRef]
- Vyklyuk, Yaroslav, Darko Vukovic, and Ana Jovanovic. 2013. Forex prediction with neural network: Usd/eur currency pair. Actual Problem of Economics 10: 251–61. [Google Scholar]
- Wang, Z., Jian Yang, and David A. Bessler. 2003. Financial crisis and African stock market integration. Applied Economics Letters 10: 527–33. [Google Scholar] [CrossRef]
- Xu, Haifeng, and Shigeyuki Hamori. 2012. Dynamic linkages of stock prices between the BRICs and the United States: Effects of the 2008–2009 financial crisis. Journal of Asian Economics 23: 344–52. [Google Scholar] [CrossRef]
- Yang, Lu, Xiao Jing Cai, and Shigeyuki Hamori. 2017. Does the crude oil price influence the exchange rates of oil-importing and oil-exporting countries differently? A wavelet coherence analysis. International Review of Economics & Finance 49: 536–47. [Google Scholar]
- Zhang, Yudong, and Lenan Wu. 2009. Stock market prediction of S&P 500 via combination of improved BCO approach and BP neural network. Expert Systems with Applications 36: 8849–54. [Google Scholar]
Figure 1.
Structure of the neural network.

Figure 2.
BRICS time series plot for the daily returns.

Figure 3.
Wavelet coherence plot between the pairs (co-movement between the pairs).

Figure 4.
Wavelet clustering of BRICS capital markets.

Figure 5.
(a) Comparison of annual forecast data with real. (b) Forecast how one country influences another for year ahead.
Figure 5.
(a) Comparison of annual forecast data with real. (b) Forecast how one country influences another for year ahead.


Table 1.
Descriptive statics.
| Brazil | Russia | India | China | SA | |
|---|---|---|---|---|---|
| Mean | 0.0005 | 0.00059 | 0.00039 | 0.00013 | 0.00036 |
| Standard Deviation | 0.01723 | 0.01931 | 0.01401 | 0.01514 | 0.01168 |
| Sample Variance | 0.0003 | 0.00037 | 0.0002 | 0.00023 | 0.00014 |
| Kurtosis | 4.5916 | 12.044 | 9.70844 | 6.29822 | 3.81758 |
| Skewness | 0.02419 | −0.2957 | 0.00564 | −0.2399 | −0.0968 |
| Range | 0.26051 | 0.38127 | 0.28478 | 0.20878 | 0.14713 |
| Minimum | −0.1139 | −0.1866 | −0.1114 | −0.1083 | −0.0764 |
| Maximum | 0.14658 | 0.19464 | 0.17339 | 0.10045 | 0.07073 |
| Sum | 2.38308 | 2.8248 | 1.86007 | 0.6203 | 1.72307 |
| Count | 4765 | 4765 | 4765 | 4765 | 4765 |
Table 2.
RMSE.
| Countries | Weekly | Yearly | Countries | Weekly | Yearly |
|---|---|---|---|---|---|
| BRAZIL->RUSSIA | 0.0098 | 0.0133 | INDIA->CHINA | 0.0098 | 0.0103 |
| BRAZIL->INDIA | 0.0074 | 0.0105 | INDIA->SA | 0.0092 | 0.0096 |
| BRAZIL->CHINA | 0.0097 | 0.0134 | CHINA->BRAZIL | 0.0124 | 0.0128 |
| BRAZIL->SA | 0.0081 | 0.0127 | CHINA->RUSSIA | 0.0103 | 0.0101 |
| RUSSIA->BRAZIL | 0.0078 | 0.0134 | CHINA->INDIA | 0.0112 | 0.008 |
| RUSSIA->INDIA | 0.0066 | 0.009 | CHINA->SA | 0.0087 | 0.0095 |
| RUSSIA->CHINA | 0.0081 | 0.0105 | SA->BRAZIL | 0.0143 | 0.0141 |
| RUSSIA->SA | 0.0094 | 0.0098 | SA->RUSSIA | 0.0168 | 0.01 |
| INDIA->BRAZIL | 0.0082 | 0.0126 | SA->INDIA | 0.009 | 0.0078 |
| INDIA->RUSSIA | 0.0086 | 0.0102 | SA->CHINA | 0.0084 | 0.0107 |
Publisher’s Note: MDPI stays neutral with regard to jurisdictional claims in published maps and institutional affiliations. |
© 2022 by the authors. Licensee MDPI, Basel, Switzerland. This article is an open access article distributed under the terms and conditions of the Creative Commons Attribution (CC BY) license (https://creativecommons.org/licenses/by/4.0/).
Share and Cite
MDPI and ACS Style
Maiti, M.; Vukovic, D.; Vyklyuk, Y.; Grubisic, Z. BRICS Capital Markets Co-Movement Analysis and Forecasting. Risks 2022, 10, 88. https://0-doi-org.brum.beds.ac.uk/10.3390/risks10050088
AMA Style
Maiti M, Vukovic D, Vyklyuk Y, Grubisic Z. BRICS Capital Markets Co-Movement Analysis and Forecasting. Risks. 2022; 10(5):88. https://0-doi-org.brum.beds.ac.uk/10.3390/risks10050088
Chicago/Turabian StyleMaiti, Moinak, Darko Vukovic, Yaroslav Vyklyuk, and Zoran Grubisic. 2022. "BRICS Capital Markets Co-Movement Analysis and Forecasting" Risks 10, no. 5: 88. https://0-doi-org.brum.beds.ac.uk/10.3390/risks10050088
Note that from the first issue of 2016, this journal uses article numbers instead of page numbers. See further details here.