
Is the Financial Report Quality Important in the Default Prediction? SME Portuguese Construction Sector Evidence


1
Center for Advanced Studies in Management and Economics (CEFAGE), School of Management and Technology, Polytechnic of Leiria, 2411-901 Leiria, Portugal
2
CARME—Centre of Applied Research in Management and Economics, School of Management and Technology, Polytechnic of Leiria, 2411-901 Leiria, Portugal
3
School of Management and Technology, Polytechnic of Leiria, 2411-901 Leiria, Portugal
*
Author to whom correspondence should be addressed.
Risks 2022, 10(5), 98; https://0-doi-org.brum.beds.ac.uk/10.3390/risks10050098
Submission received: 1 April 2022
/
Revised: 27 April 2022
/
Accepted: 3 May 2022
/
Published: 5 May 2022
(This article belongs to the Special Issue Financial Risk Management in SMEs)
Abstract
:This work analyses whether financial information quality is relevant to explaining firms’ probability of default. A financial default prediction model for SMEs (Small and Medium Enterprises) is presented, which includes not only traditional measures but also financial reporting quality (FRQ) measures. FRQ influences the decision-making due to its impact on financial information, which has repercussions on the accounting ratios’ informativeness. A panel data of 1560 Portuguese SMEs in the construction sector, from 2012 to 2018, is analysed. First, firms are classified as default or compliant using an ex-ante criterion which allows us to identify signs of financial constraints in advance. Then, the stepwise method is employed to identify which variables are more relevant to explain the default probability. Results show that FRQ measures, namely accruals quality and timeliness, impact firms’ defaulting, supporting their relevance in predicting financial difficulties. Finally, using a logit approach, the accuracy of the model increased when FRQ variables were included. Results are confirmed using “new age” classifiers, namely the random forest methodology. This work is not only relevant to the extant financial distress literature but has also relevant implications for practice since stakeholders can understand the impact of financial reporting quality to prevent additional risks.
1. Introduction
Financial scandals in the U.S. and Europe (e.g., Enron, WorldCom, and Lehman and Brothers in the U.S.; Parmalat in Italy; Banco Português de Negócios, Banco Privado Português, and Banco Espírito Santo in Portugal) have demonstrated the relevance of the quality of financial reports (Gaio and Raposo 2011). The lack of financial information quality can lead to a misunderstanding about the firms’ financial performance and sustainability (Huynh 2019).
In moments of financial distress, managers tend to use earnings management or other practices to change financial reporting. Such behaviour aims to hide financial problems from stakeholders, meet financial investors’ expectations, reduce the cost of financial debt, access to new loans, maintain managers’ own bonuses, avoid the loss of reputation, and/or comply with legislation or other obligations (Healy and Wahlen 1999; Habib et al. 2013; Dimitras et al. 2015). Therefore, this work intends to understand whether financial report quality impacts firms’ probabilities of default.
Beaver et al. (2012) argue that financial reporting attributes are relevant to predicting a firm’s bankruptcy. Accounting-based models have been presented with a high predictive power of firms’ default and bankruptcy. However, if the indicators listed in the financial statements are not of high quality, this may compromise not only the financial informativeness but also may deteriorate the models’ predictive power. However, most studies on financial distress use accounting and market-based indicators (e.g., Altman 1968; Lin 2009; Mselmi et al. 2017; Pacheco et al. 2019) without including financial reporting quality. In this work, this gap in the literature is filled as FRQ proxies are included to explain firms’ probabilities of default. The inclusion of FRQ proxies in the default prediction model allows us to consider the fluctuations between two reporting periods that can be masked in the financial statements that are annually reported. Financial ratios, which are included as determinants of firms’ probabilities of default, are determined at the end of the year with the available financial information which can lack quality. Therefore, financial ratios may not show all the relevant financial information of the company (Du et al. 2020).
Studies which link financial reporting quality and probability of distress are limited but they are consensual on the impact of FRQ on financial distress. To the best of our knowledge, the few existing studies only address one of the FRQ characteristics—earnings management which is related to accruals quality (e.g., Beaver et al. 2012; Diegues and Alves 2016; Lin et al. 2016; Nagar and Sen 2018; Wu et al. 2018). Except for the above, Ashraf et al. (2020) analyse the impact of accruals quality and the earnings quality on firms’ probabilities of bankruptcy focusing on the listed firms. Nevertheless, financial information quality is not directly observable, and it is a multidimensional concept that can be evaluated using several proxies, such as accruals quality smoothness, value relevance, timeliness, and conservatism (Gaio and Raposo 2011; Perotti and Wagenhofer 2014; Huynh 2019). The different proxies try to capture the desirable characteristics of financial information: relevance, faithful representation, understandability, comparability, verifiability, and timeliness. In this way, the different proxies end up capturing different characteristics and can affect different realities in different ways.
Despite the vast literature on financial distress, this study has four important contributions that will be explained: (i) it analyses various FRQ measures; (ii) it focuses on the SMEs; (iii) a specific country and sector are studied; and (iv) the methodology used presents particularities not previously applied.
Different financial information quality characteristics can impact SME’s default probability, namely accruals quality (related to earnings management), smoothing, and timeliness (the three proxies that can be analysed for SMEs). By including several proxies of financial information quality, this study aims not only to enlarge the literature review on this theme but also to give a deeper understanding of the impact of different characteristics of FRQ on firms’ probabilities of default. Managers can engage in earnings management practices, but can also smooth earnings, present less timely earnings, and not report information that is relevant to financial investors.
This paper intends to understand if FRQ helps to predict SMEs’ financial default. Previous works mostly focus on listed companies (e.g., Beaver et al. 2012; Lin et al. 2016; Wu et al. 2018; Ashraf et al. 2020). The main reason for using listed companies is due to the easiest information availability. However, SMEs present a higher probability of default since their financial situation is less stable and they have more financial constraints (Pacheco et al. 2019). Additionally, firms’ data quality depends on the type of firm (Du et al. 2020). The regulation regarding the information quality of listed firms is different from unlisted ones (Campa and Camacho-Miñamo 2014). Private firm financial reporting is of lower quality due to different market demands, regulation notwithstanding (Ball and Shivakumar 2005). However, it is important to refer that the financial information of listed firms may suffer from information asymmetries and the need for managers to meet financial investors’ expectations (Healy and Wahlen 1999). On the other hand, the users of financial information are also different (e.g., as listed firms are to financial investors, as SMEs are to banks). Such differences may compromise the generalization of the results obtained for large firms when applied to the SME unlisted firms. Nonetheless, SMEs are most firms all over the world and play an important role, as they have a relevant contribution not only to gross domestic product but also to job generation, which proves the need to understand this group of firms and gives support to this study.
A sample of Portuguese SMEs for the construction sector from 2012 to 2018 is analysed. Portugal is a small-size country almost unexplored, with singularities regarding large-size countries such as the U.S. (e.g., Charitou et al. 2007; Nagar and Sen 2018) and China (e.g., Lin et al. 2016; Wu et al. 2018; Shen et al. 2020), where most works in the area were conducted. Moreover, it is a code-law country, with great financial asymmetries, which increases managers’ incentives to engage in earnings management practices (Dimitras et al. 2015), reinforcing the need to understand the impact of these practices. Finally, in Portugal loans are the more relevant financial source of firms’ financing, so understanding firms’ probabilities of defaulting helps to promote the sustainability of the financial systems (Bhimani et al. 2010). This work also focuses on a specific sector: the construction industry. Each sector has singularities regarding financial ratios and the quality of financial information differs by sector (Kinnunen et al. 1995). Thus, analysing a unique sector avoids biased results. Regarding the importance of the construction industry, it is an industry with a fundamental role in the country’s development and citizens’ well-being. It drives productivity, employment, and wealth directly and indirectly through other subsectors (Abdullahi and Bala 2018). According to PORDATA (2021), it is the fourth industry at the European level to create more wealth for the country. Additionally, Choi et al. (2018) argue that the construction sector is one of the more sensitive industries to economic cycles due to the long duration of the projects which causes liquidity problems and increases the financial risk (Muscettola 2014). In fact, in Portugal, this sector not only has significant relevance to the economy (Baganha et al. 2002) but it has also been characterized by high mortality rates in recent years (Kapelko et al. 2015). The failure of a construction company is pressing for governments and economies because of the unfinished projects and covenants established (Assaad and El-Adaway 2020). Therefore, understanding signs of default in advance in this industry allows to avoid (or at least reduce) situations of bankruptcy which can impact the whole country (directly or indirectly).
To analyse the impact of FRQ on the probability of default, firms are classified as compliant (firms with a healthy financial situation) or default (firms with a probability of not meeting debt responsibilities). For that, the ex-ante criteria proposed by Lisboa et al. (2021) are followed since they can be used for SMEs. Most studies about default’s probability and the impact of earnings management (a characteristic of FRQ) on default use an ex-post criterion or a mix classification (considering both in simultaneous: ex-post and ex-ante criterion) of default (e.g., García-Lara et al. 2009; Diegues and Alves 2016; Dutzi and Rausch 2016; Ashraf et al. 2020). In both cases, firms are already in bankruptcy or insolvent, which is a severe financial situation that cannot be surpassed. Moreover, the legal criterion is country-specific which limits the comparison since laws, which are the base of ex-post classification, are singular, and can also depend on the macroeconomic environment (Bhimani et al. 2010). An ex-ante criterion allows us not only to detect the warning signs of financial difficulties and solve them in time, but also facilitates generalization to other contexts. Considering the study’s aim, it will also be important to understand the signs of financial problems in advance. Dutzi and Rausch (2016), who analyse the impact of earnings management periods before bankruptcy, found that the impact of the quality of financial information is different depending on the level of default. Firms that seem healthier before bankruptcy engage more in earnings management practices than the ones that look unhealthier before bankruptcy. Therefore, when considering the ex-ante criterion, we will be analysing the impact of the FRQ before this motivation as defended by Dutzi and Rausch (2016).
Given the extensive list of predictive variables of default and the particularities of the sector studied the stepwise regression approach was used, following Mselmi et al. (2017), and Ashraf et al. (2020). Adopting a backward elimination method, we surpass the bias problem of including a large set of ratios. This methodology was also used by Ashraf et al. (2020), who also analysed the impact of earnings quality on the probability of default, but they applied it only to the accounting ratios. This work goes a step further by including simultaneously both accounting and FQR measures. In this way, we analysed the relevance of all the variables introduced, demonstrating the relevance of FQR measures, namely accruals quality and timeliness. The fact that more than one proxy is statistically relevant confirms the need to analyse more than one FQR characteristic beyond the impact of earnings management. These variables are included not only because the study aims to understand FRQ’s impact on default, but also because its significant relevance is confirmed a priori by the stepwise method.
A logit model is then used to present a financial distress prediction model. This model presents an accuracy of 85% and is more efficient in the classification of compliant firms. Without FRQ, the accuracy of the model decreases, and error type I (classifying a firm as compliant when it is in default) is more evident. Additionally, a robustness analysis is done through the random forest methodology. New age classifier models were proposed (Jones et al. 2015) to improve the predictive power of traditional models, such as logit. However, these techniques are still unexplored due to their complexity and time consumption (Giriūniene et al. 2019). In both analyses, results confirm the relevance of FRQ proxies, especially in correctly classifying default firms. Few studies focus on the financial distress prediction of SMEs in the Portuguese context, and as far as we know, none used the random forest methodology.
Besides the several contributions in the literature, this work also contributes to practice. Firms’ bankruptcy affects stakeholders’ welfare such as shareholders, employees, creditors, and the government, among others (Beaver et al. 2011). The results also give insights to managers, especially construction sector managers, to understand how they can detect financial problems in advance to avoid default. Moreover, it helps to understand the impact of financial reporting quality to prevent additional risks, and which factors can lead to financial distress.
This paper is organized into six sections. After this first introductory section, Section 2 presents a theoretical context, followed by the sample characterization and the description of the methodology and variables to be used in the analysis of default risk. In Section 4, the results are discussed. The next section presents a discussion. Finally, the main conclusions, as well as limitations and suggestions for future research, are presented in the last section.
2. Theoretical Background
2.1. Financial Distress
Since the beginning of the 20th century, the issue of financial distress has been a topic of intense study by researchers (Ashraf et al. 2020) given its strong negative impact on firms (Beaver 1966; Beaver et al. 2011). The 2008 world crisis disguised the research in the area, given not only the strong impact it had on the firms’ performance but also the economic and social consequences that this situation brought (Jones et al. 2017). There are two trends in the vast literature on the subject: studies that aim to detect the signs of default and studies that aim to compare the accuracy in the classification of companies using different methods (Tseng and Hu 2010). This study falls under the first category.
The analysis of the plethora of literature on financial distress is divided into two parts. The first part covers the criteria used to distinguish distressed and compliant firms and the second part analyses the prediction distress models.
2.1.1. Criteria
Financial distress is not a concept that is clearly defined in the literature. Some studies end up using the concepts of financial distress or default risk and bankruptcy similarly; however, they are two distinct realities. Default risk is defined as the probability of the firm not meeting its debt responsibilities (Ashraf et al. 2019). According to the Insolvency and Corporate Restructuring Code (CIRE (Código da Insolvência e da Recuperação de Empresas) 2019), default is a temporary situation that may be related to a lack of liquidity or to the difficulty in obtaining credit. On the other hand, bankruptcy is a permanent or irreparable situation, and, in this case, a firm will be unable to comply with its obligations, which are already past due, or reach a point where its total liability exceeds the total assets (Pindado et al. 2008; Tinoco and Wilson 2013). Although the existence of financial difficulties does not necessarily lead to bankruptcy, this has serious consequences for investors and creditors (Habib et al. 2020). Therefore, several studies consider various stages between a more delicate financial situation and effective bankruptcy (Lau 1987; Cheng et al. 2006; Wang and Deng 2006; Ashraf et al. 2019). For instance, Lau (1987) and Cheng et al. (2006), established five stages of default: stage 0—financial stability (compliant companies); stage 1—omission or reduction of dividend payments by more than 40% over the previous year; stage 2—technic default and default on loan repayments; stage 3—protection under bankruptcy law; and stage 4—bankruptcy and liquidation.
Focusing on the financial distress, the literature uses different criteria to classify a firm as default or compliant, which can be subdivided into three main groups: (1) studies using the legal classification (also called ex-post classification); (2) studies using signs that may lead to default (ex-ante classification); (3) studies using mix-classifications, which means analysing signs of default’s probability and, at the same time, considering legal classification. While the ex-ante classification uses a set of financial indicators to classify a firm as compliant or non-compliant, and ex-post classification is based on the use of legal criteria, depending on the legislation. Thus, the ex-post criterion does not allow a generalization and comparison between firms from different countries (Bhimani et al. 2010). Moreover, it also depends on the period analysed since legislation can change over the years (Tinoco and Wilson 2013). There are several studies that use the ex-post classification, such as Altman (1968), Altman et al. (1977), Zięba et al. (2016), Altman et al. (2017), and Jones et al. (2017).
Some studies use a mixed classification criterion, for instance, Rosner (2003), Pindado et al. (2008), and Nagar and Sen (2018). As these studies consider default firms those which are already in bankruptcy and those with signs of default, the conclusions of the studies may not help firms to recover from financial difficulties as results can be biased due to firms already being in bankruptcy (a more severe financial situation). Two lines of analysis can be detected in studies that consider bankruptcy firms and firms with warning signs of distress (e.g., Pindado et al. 2008) and studies that consider bankruptcy firms and analyse periods before bankruptcy (e.g., Rosner 2003).
Pindado et al. (2008) suggest that listed firms are in financial distress not only when they are in bankruptcy but also when they cumulatively meet the following criteria for two consecutive years: (i) earnings before interests, taxes, depreciation, and amortizations (EBITDA) lower than financial expenses; (ii) a decrease in the firm’s market value. These criteria were also used by Tinoco and Wilson (2013). According to Tinoco et al. (2018), distressed firms are the ones suspended, in liquidation, or with quotations suspended for more than three years. To Ashraf et al. (2020), firms that are inactive, suspended, in liquidation, bankrupt, or with negative net income for three consecutive years are in default.
Rosner (2003), for instance, analyses firms already in bankruptcy and argues that firms with financial problems have one of the following financial characteristics: (i) negative working capital in the current year; (ii) negative operating results in any of the three years before bankruptcy; (iii) negative retained earnings in the third year prior to default; or (iv) a negative net income in any of the three years prior to default. Nagar and Sen (2018), in line with Rosner (2003), also indicate that a firm is in default if it has had negative operating results in the last two consecutive years.
Contrary to ex-post and mix classifications criteria, which are based on firms that are already in a difficult financial situation, and the ex-ante criterion detects the default signs, enabling timely decisions. This criterion keeps the focus on the firm’s financial problems and not on the legal consequences—bankruptcy (Pindado and Rodrigues 2005). The use of an ex-ante classification allows an analysis of different firms, belonging to different countries since it uses a set of financial information. More recent studies have used this ex-ante classification (e.g., Wang and Deng 2006; Salloum et al. 2012; Sun et al. 2017; Shen et al. 2020; Du et al. 2020).
Wang and Deng (2006) consider a firm in the default state when: (1) net profits were negative in the last two years; (2) net worth per share was less than the face value of the stock in the last year; (3) the auditor presents an adverse opinion or a disclaimer opinion on the financial report of the last year; (4) the value of the equity ownership recognized by the auditor and the departments concerned was less than the value of registered capital in the last year; (5) other financial situation abnormality judged by CSRC or SHSE and SZSE. Salloum et al. (2012) classify a firm to be in financial difficulty when it presents an interest coverage ratio lower than 0.8. Sun et al. (2017) and Shen et al. (2020) consider default companies the ones with negative net profit or with net assets per share lower than stock book value for two successive years. In addition to the negative net profit, Du et al. (2020) consider that a firm is in financial difficulty when two other possible anomalies are verified: the net assets were negative in the last year and the operating income was less than 10 million yuan in the last year. Lisboa et al. (2021) classify a firm as compliant when three conditions are met cumulatively: (i) the financial capital ratio is higher than 5%; (ii) earnings before depreciation, amortization, interest, and taxes (EBITDA) are higher than 1.3 of financial expenses; (iii) a net debt ratio between 0 and 10, with each indicator being met at least once in the previous three years and at least 50% of the indicators, considering all possible combinations. All the other firms are in a default situation.
2.1.2. Models
The models used to predict bankruptcy risk are commonly used to predict financial distress since they allow for early detection of financial problems (Pindado et al. 2008). There is still no consensus in the literature on the best financial distress model. However, we can divide them into traditional models and data-driven models.
Traditional models, such as univariate analysis, multivariate discriminant analysis, logit models, probit models, and hazard models, are still the most used and empirically tested since they do not use advanced statistical methods. Alternatively, they focus on comparing the characteristics of compliant and default firms.
One of the first authors to use ratios to predict bankruptcy was Beaver (1966). Using a univariate analysis, in a universe of thirty financial ratios, six were selected considering the lowest percentage of error for a period of five years. Beaver (1966) shows the importance of using certain ratios and introduces important generalizations regarding the performance of accounting data. However, the individual analysis of each ratio can lead to confusing and misread interpretations.
Given the Beaver model’s (Beaver 1966) limitations, Altman (1968) developed a model using Multiple Discriminant Analysis (MDA) and the Z-Score model, which aims to analyse listed companies using a multivariate analysis. In this model, six variables were selected taking into account an initial list of twenty-two variables divided into five categories: liquidity, profitability, leverage, solvency, and efficiency. Note that the selection of variables to be included in the model was through statistical significance, correlations between variables, and the judgment of the analyst. Later, two versions of Altman’s (1968) model were developed: Z’ Score (Altman 1983) and Z’’ Score (Altman 1983), adapting the model to carry out the analysis of unlisted and non-manufactured companies, respectively.
Ohlson (1980) uses a logit approach to estimate the bankruptcy probability. Contrary to the MDA methodology, the logit model allows the probability of default to be estimated without requiring the use of so many restrictive assumptions and allowing the analysis of non-proportional samples.
Zmijewski (1984) studies default using the probit model. The author concludes that the probit and logit models present similar results with a high degree of prediction. However, it is empirically less used since it presents a more difficult interpretation.
The hazard model was proposed by Shumway (2001). According to the author, the hazard model is appropriate because it does not provide estimates that can be biased and inconsistent due to the changes in the companies’ characteristics over time. Furthermore, it is not necessary to choose the explanatory variables for each company or period to be analysed.
Recent studies, which compare traditional models, indicate that the logit methodology is the most appropriate for predicting distress. The logit model allows for any time-varying covariates and adjusts any unobservable heterogeneity (Ashraf et al. 2020).
Traditional models have been criticized for assuming limiting assumptions, namely linearity, normality, and independence between predictor and input variables. The data-driven models aim to overcome these limiting assumptions, namely with the use of non-parametric techniques. Despite the advantages and disadvantages inherent to different models, according to Jones et al. (2015), there is a trade-off between traditional models and data-driven models, namely between interpretability and accuracy in forecasting.
The attempt to improve forecasting models is broad, highlighting the use of Support Vector Machine (SVM), Artificial Neural Network (ANN), Decisions Trees, Case Base Reasoning, and the so-called new age models, for instance, the Ada Boost Model, Generalised Boosting model and Random Forest model (Jones et al. 2017; Du et al. 2020; Zizi et al. 2021). According to Zięba et al. (2016) artificial intelligence and machine learning techniques (e.g., SVM) have become an important instrument for default analysis since it presents similar classification standard problems and, in this way, the algorithms can be used in the classification.
One of the most used nonlinear methodologies is the Artificial Neural Networks (ANN). This method establishes an analogy with the human neural process. It allows for the analysis of complex non-linear relationships (Jones et al. 2017). Nevertheless, despite the general network definition, the researcher has an inactive role when they apply this methodology, and this approach may fail in the case of multimodal data (Zięba et al. 2016; Jones et al. 2017). Although data normalization can overcome this issue, it reduces the predictive power of the model (Zięba et al. 2016).
In addition to the ANN, one of the most recent methodologies used in the default field is the Support Vector Machine (Shin et al. 2005). It differs from linear models (e.g., logit) since the classifiers are not probabilistic and strictly linear binaries. It is based on the concept of separate hyperplanes according to a kernel function (Jones et al. 2017). Although the researcher has a more active role with this methodology, particularly through the kernel function definition, it presents some limitations. The difficulty of interpreting the model and the calibration of the kernel function should be highlighted. Similar to NN, SVM has less predictive capacity for samples with a high number of irrelevant inputs and with data with different characteristics. Despite the limitations, the SVM presents better performance than ANN (Kim and Kang 2010).
Researchers have been trying to apply and compare other methodologies to improve the prediction of default risk, namely the limitations of traditional models, and the difficulties in applying and interpreting the most advanced models (e.g., Barboza et al. 2017; Jones et al. 2017; Zizi et al. 2021).
For instance, Barboza et al. (2017) compare bagging, boosting, random forest, neural networks, SVMs with ADM, and logit. They concluded that machine learning models are more precise than traditional models. Furthermore, the “new age” classifiers, including generalized boosting, AdaBoost, and random forest, have a reasonably good level of interpretability.
Jones et al. (2017), in line with Barboza et al. (2017), conclude that the use of new age classifiers presents a higher accuracy, and they are relatively easy to estimate, implement and interpret when compared with SVM and NN. They compare 16 classifiers, such as logit, probit, ADM, NN, SVM, and “new age” models including Generalised Boosting, AdaBoost, and random forests.
However, Zizi et al. (2021), who uses the logit and ANN model in their analysis, conclude that logistic regression is of superior performance to ANN.
2.2. FRQ and Financial Distress
Stakeholders use financial reports to collect information about the firm and to support their decisions (Cascino et al. 2014). The information in financial reports must have quality, which means it should provide useful information to managers and investors, it should be clear and relevant to sustain decision-making, and it should be reliable and comparable to avoid information asymmetries among investors (Gaio and Raposo 2014). The lack of quality can bias decisions, lead to misallocation of resources, decrease firms’ performance, and increase their risks (Ashraf et al. 2020).
Moreover, managers can have incentives to adjust financial information, leading to earnings management practices (Healy and Wahlen 1999). Managers can change reported earnings without compromising the generally accepted accounting principles to satisfy their own benefits—personal or the firm’s (Rosner 2003). One reason is to meet stakeholders’ expectations concerning the company’s performance (Hogan et al. 2008). Managers are afraid of being replaced or losing their reputation when these expectations are not met, and the financial investors can lose interest in the firm (Habib et al. 2013). Earnings management practices can also be applied to influence contractual relationships both with banks and managers (Cascino et al. 2014). On one hand, managers aim to attract external financing, namely new bank loans, and/or meet financial ratios to continue ensuring debt financing at low financial cost (Dechow et al. 1996). Managers adopt income-decreasing practices through accruals during debt negotiation (Saleh and Ahmed 2005) and apply income-increasing practices and cash flow manipulation when they have a higher probability of distress (Habib et al. 2020). On the other hand, managers intend to increase their salary when it is based on a compensation scheme. Finally, firms want to meet regulations and legislation (e.g., reduce income tax, maintain listing classification, avoid unqualified audit opinion, among others) to avoid additional costs or penalties for the firm (Healy and Wahlen 1999; Rosner 2003; Charitou et al. 2007). Moreover, code-law countries have higher earnings management practices due to low investor protection. Non-listed firms have higher earnings management than listed firms since are less monitored (Dutzi and Rausch 2016).
Managers can engage in other practices rather than earnings management to adjust companies’ financial information. Examples are earnings smoothness when managers intentionally apply practices to reduce variation of earnings; value relevance, which shows the ability of financial information to show the company’s share price; earnings timeliness, when earnings rapidly reflect cash flow information; and accounting conservatism practices, which result when bad news is rapidly recognized by the market (Gaio and Raposo 2011; Perotti and Wagenhofer 2014; Huynh 2019).
Research which links financial information quality and probability of distress is limited, but Beaver et al. (2012), analysing companies listed on NYSE/AMEX and NASDAQ, argue that financial reporting attributes, mainly earnings quality measured through accruals and real activities, are relevant to predict firms’ bankruptcy.
The existent studies analysing the relationship between both topics usually focus only on one characteristic of FRQ—accruals quality, measured through earnings management. Campa and Camacho-Miñamo (2015), using an ex-post classification of default, found that financially distressed firms engage more in earnings management practice (through accruals) than solvent firms in the years before entering bankruptcy. Lin et al. (2016) suggest that earnings management should be used to predict default since the distortion of earnings management may increase financial distress. The authors analysed a sample of listed Chinese companies and used an ex-post classification of distress firms. By adapting the Altman Z-score with dummy variables to measure earnings management through real activities, the authors found that the new model is well-specified and has greater predictive power. Later, Wu et al. (2018) carried out a similar analysis using the Ohlson model and came to similar conclusions. Nagar and Sen (2018), analysing US non-financial companies, found that financial distress increases with increasing income earnings management, measured using accruals and earnings management measures. These authors suggest that distressed companies hide financial problems to obtain financing or to reduce the probability of bankruptcy, acquisition, or hostile takeover.
Recently, Ashraf et al. (2020), studying a sample of listed firms from the UK and Pakistan, analysed accruals quality and earnings quality (related to timeliness) and found that an increase in both FRQ measures decreases the firm’s probability of bankruptcy. Analysing another characteristic of financial reporting quality—accounting conservatism—Biddle et al. (2022) found that accounting conservatism helps to lower firms’ bankruptcy risks by mitigating earnings management practices and enhancing cash holdings.
From another perspective, some studies found a link between the impact of bankruptcy on financial reporting quality. For example, Campa and Camacho-Miñamo (2015) showed that the level of financial distress affects the way earnings are managed.
Rosner (2003) concluded that firms that are not perceived to have financial problems but that later go into bankruptcy (non-stressed/bankrupt firms) are more motivated to increase earnings in their financial reports to influence stakeholders’ perceptions about the firm’s performance. The authors compare the mean values of several variables to compliant and distressed firms using a mixed classification of distress. Charitou et al. (2007) concluded that managers engage in downturn earnings practices in the years before bankruptcy and adopted more conservative earnings. They also found that top-management turnover in distressed firms leads new managers to show poor results in a year, making future results appear better. Habib et al. (2013) found that distressed firms (classified through an ex-ante classification) engage more in income-decreasing earnings management practices to favour their financial statements, especially during financial crises. Dutzi and Rausch (2016) found a decrease in earnings management before a firm goes into bankruptcy.
Moreover, García-Lara et al. (2009), using an ex-post classification of default, found that default firms engage in earnings management through accruals and real activities four years prior to bankruptcy. Initially, firms engage in accruals practices, and then in real activity practices since it implies more costs. Failed firms engage in aggressive accounting practices, recognizing slower losses in earnings than gains. Diegues and Alves (2016) also argue that the impact of earnings management on firms’ probabilities of default depends on the year before bankruptcy. One year before going into default, bankrupt firms decrease earnings management (increase FRQ), but two to four years before default, these firms increase accruals to show a better performance of the firm and mislead stakeholders.
As shown, the previous literature demonstrates the influence of FRQ characteristics on distress probability, although most previous research focuses on the impact of default on financial reporting quality or earnings management (e.g., Charitou et al. 2007; Dutzi and Rausch 2016; Tarighi et al. 2022), and the few works that explore the relationship in the opposite way include one or two proxies of FRQ proxies in financial distress models, which show the need to deeply understand this relation.
3. Materials and Methods
3.1. Sample Description
This paper aims to understand the impact of financial reporting quality on firms’ financial default predictions. For this, a sample of Portuguese SMEs in the construction sector from 2012 to 2018 is studied.
Accounting data was collected from the SABI (Sistema de Análise de Balanços Ibéricos—Iberian Balance Sheet Analysis System) database from Bureau Van Dijk, while macroeconomic information was collected from the Pordata database from Fundação Francisco Manuel dos Santos.
Portugal is a small-size country almost unexplored, with singularities regarding large-size countries such as U.S. and China, where most works in the area were conducted. Moreover, it is a code-law country, with great financial asymmetries. For this reason, managers have more incentive to engage in earnings management practices (Dimitras et al. 2015), reinforcing the need to understand the impact of these practices. Portugal is also characterized as a bank system since financial credit is the more relevant financial source of firms’ financing. For these reasons, understanding Portuguese firms’ probabilities of default helps to promote the sustainability of the Portuguese economy (Bhimani et al. 2010). We focus on SMEs, which are firms with less than 250 but more than 10 employees and with total assets between 2 million and 43 million euros and/or a total turnover greater than 2 million and less than 50 million euros (Law Decree n. 81/2017 da Economia 2017). This type of firm is less explored due to the difficulty of data access (Campa and Camacho-Miñamo 2014). However, these firms make a great contribution to job generation and wealth creation, and there is a need for a better understanding of these firms for the sustainability of the Portuguese economy. Moreover, SMEs have difficulties in obtaining funds, since having no access to financial markets and, due to their unstable financial situation and higher financial risk, have greater difficulties in obtaining financial credit (Pacheco et al. 2019). Moreover, especially during financial crises, SMEs’ financial problems are more critical (Campa and Camacho-Miñamo 2014). SMEs are also an interesting case study as financial reporting is of lower quality compared to listed firms, due to different market demands and regulations (Ball and Shivakumar 2005). Additionally, the construction sector has a fundamental role in the country’s development and citizens’ well-being as it is an industry that drives productivity, employment, and wealth directly and indirectly through other subsectors (Abdullahi and Bala 2018). It is the fourth sector at the European level to create more wealth for the country (Portugal in 2021). In Portugal, its contribution is also evident; in 2012, this sector represented around 12% of Portuguese firms and contributed 7% to turnover and 11% to the total number of employees (Bank of Portugal 2015). The evolution of this sector also depends on the amount invested in other industries (Maślanka 2017). Moreover, the construction sector is especially vulnerable to financial crises, as it is sensitive to economic cycles due to the long duration of the projects (Choi et al. 2018). From 2007 to 2014, the mortality rate of firms in this sector was higher than the natality rate, and it was one of the highest in Portugal. Even today, the situation is not stable (PORDATA 2020), showing the connection of this sector with macroeconomic factors. Finally, the failure of a construction company causes a significant impact on governments and economies because of unfinished projects and covenants established (Assaad and El-Adaway 2020). These facts encourage the need to understand the financial distress of this specific sample. Data were collected from 2010 to 2018 and the final sample comprises data from 2012 to 2018. To classify firms as default or compliant we need 3 years of data, and the current Portuguese accounting standards were applied in 2010. The last year with available data at the time of data collection was 2018.
The final sample is an unbalanced panel data of 1560 SMEs in the construction of buildings industry in Portugal with a total of 7790 observations.
3.2. Financial Distress Definition
In this work, we use an ex-ante classification of default. This classification not only allows firms to detect financial difficulties in time to solve them, but it is especially relevant for the sector analysed—construction. The firms in this sector are characterized by the long duration of projects and their bankruptcy can have a great impact on individuals, other companies, and the economy. We follow the criteria proposed by Lisboa et al. (2021) since it can be applied to SMEs, as only accounting information is needed. One of the three criteria used, namely earnings before depreciation, amortization, interest, and taxes (EBITDA) 1.3-fold higher than financial expenses, which turns out to be more demanding than the criteria used previously for listed firms (e.g., Pindado et al. 2008; Salloum et al. 2012; Campa and Camacho-Miñamo 2015).
A solvent firm is one with: (i) a capital ratio higher than 5%; (ii) earnings before depreciation, amortizations, interest, and taxes (EBITDA) 1.3-fold higher than financial expenses; (iii) and net debt ratio between 0 and 10. Each ratio must be met at least once in the previous three years, and at least 50% of all possible combinations. All the others are default firms. A dummy variable was created, and it is 1 when a firm is in default, and zero otherwise.
3.3. Financial Report Quality Measures
The previous literature presents several ways to measure financial report quality, namely: accruals quality by Jones (1991); earnings smoothness by Eckel (1981); value relevance by Basu (1997); earnings timeliness by Ball and Shivakumar (2005); and accounting conservatism by Holthausen and Watts (2001). However, value relevance and accounting conservatism can only be applied to listed firms due to the market values needed.
Accrual’s quality is related to earnings management when managers change financial information or the structure of transactions to accomplish a specific aim and to mislead stakeholders about the firm’s financial position (Healy and Wahlen 1999). It is measured through the absolute value of discretionary accruals (|DA|), the abnormal change of earnings since earnings can be managed either in a positive or a negative direction. A higher value of |DA| represents earnings management practices and thus reflects lower quality in financial reporting (see, for instance, Ashraf et al. 2020). Several models can be used to estimate accruals. Jones (1991) argues that normal accruals are a function of change in revenues and property, plant, and equipment. Dechow et al. (1995) adapt the previous model, deducting receivables from revenues. Kothari et al. (2005) add the variable return on assets to the Jones model to deal with performance differences. From another perspective, Dechow and Dichev (2002) present a model where total accruals are a function of the present, past, and future cash flows. McNichols (2002) joined the model of Jones (1991) with Dechow and Dichev (2002). Larcker and Richardson (2004) add the book-to-market ratio and the operating cash flow to the model of Dechow et al. (1995).
In this work, the model proposed by Kothari et al. (2005) will be used since cash flow items are not always available to SMEs, making it difficult to use Dechow and Dichev’s (2002) and McNichols’ (2002) models; market-based indicators are also not possible to calculate, so Larcker and Richardson’s (2004) model cannot be used. The Kothari et al. (2005) model is adapted from the Jones (1991) model, considering return on assets to control measurement errors. Thus, the following model in Equation (1) is estimated:
where TA is total accruals measured as ∆current assets−∆cash−∆current liabilities−short-term debt−∆taxes payable−depreciation and amortization expense; ∆Rev is the annual change in revenues; PPE is the value of the property, plant, and equipment; EBIT is the earnings before interests and taxes; A is the total assets.
Earnings smoothness is a practice to reduce earnings fluctuations by shifting earnings from peak periods to years with less positive results (Prencipe et al. 2011). It can be natural or intentional, and the latter can be divided into real or artificial (Eckel 1981). To measure financial reporting quality, it is necessary to isolate intentional smoothness. Eckel (1981) was the first researcher to propose a way to understand smoothness, which exists when the coefficient of variation (CV) for the change in sales (∆Sales) is greater than the coefficient variation for the change in income ( (). Prencipe et al. (2011) proposed the income smooth ratio (IS ratio):
When the IS ratio is lower than 1, the observation is classified as smoother, so the financial information quality is lower.
Earnings timeliness is related to the moment financial information is available. Financial information should be available to users in due time to be relevant (Brown et al. 2011). However, managers can adopt practices to delay or advance information, which can lead to the loss of quality. Basu (1997) proposes a model to estimate timeliness in listed firms, which was later adapted by Ball and Shivakumar (2005) to be used in unlisted firms. The model to identify transitory gains or loss components in accounting income is the following:
where is the annual change in income scaled by total assets of the previous period; is a dummy variable which is 1 if prior-year change is negative.
Ball and Shivakumar (2005) explain that = 0 means that gains are recognized as “persistent” positive components of income and usually did not revert, while < 0 means that gains are recognized as a transitory increase in earnings that tend to change, less financial information quality. When < 0, economic losses are recognized to be timelier than gains.
3.4. Financial Ratios
For this study, an initial set of 16 financial ratios (see Appendix A) was selected from the previous literature. These ratios were classified into seven categories: leverage, liquidity, size, profitability, efficiency, financial charges, and cash flow, covering a wide range of the firm’s financial characteristics and performance.
We adopted a backward elimination method with all variables: FRQ proxies and accounting-based to select the most relevant ones to maximize the accuracy of financial distress, as Mselmi et al. (2017) did. The stepwise regression method was used to identify the ratios which are more accurate for this specific sample and analysis. Then, the correlation matrix was analysed to delete high correlated variables. Highly correlated variables (correlation coefficient greater than 70%) and those which were correlated with more than one variable were eliminated. The variables Equity to Assets (E/A) and Equity to Liabilities (E/L) as well as Earnings Before Interests and Taxes to Assets (EBIT/A) and Cash Flow to Liabilities (CF/L) have a high correlation. E/A and E/L are capital and solvency ratios, respectively. EBIT/A and CF/L capture different dimensions, profitability, and cash flow, respectively. Since the exclusion of one of the variables is not completely linear, we decided to analyse the alternative impact (present in Section 4.3). The final list is presented in Table 1.
3.5. Model
For this study, an initial set of 16 financial ratios (see Appendix A) were selected from the previous literature. These ratios were classified into seven categories: leverage, liquidity, size, profitability, efficiency, financial charges, and cash flow, covering a wide range of the firm’s financial characteristics and performance.
We adopted a backward elimination method.
4. Results
4.1. Sample Characterization
Table 2 presents the number and percentage of default and compliant firms per year.
The data are an unbalanced sample of 1560 firms. The number of observations increased through the period analysed. Moreover, Table 2 shows that there are more compliant than default firms. However, from 2012 to 2013 and from 2017 to 2018, the number of default firms increased. PORDATA (2020) shows that the percentage of the mortality rate of firms in the construction sector decreased from 2012 to 2014 and the number of new firms increased (but these new firms are not in the sample as at least three years of the firm’s data are needed).
4.2. Descriptive Statistics
Table 3 shows the descriptive statistics (mean, median, standard deviation, minimum, and maximum) for the variables selected by the stepwise method and the correlation matrix, for both groups (default and compliant). Additionally, the Mann–Whitney nonparametric test (MW) was performed to test if the medians for both groups of firms are statistically equal (we compare median values since the Kolmogorov–Smirnov analysis shows that the data are not normally distributed).
When analysing discretionary accruals (DA), the median is higher for compliant firms compared to default ones, and it is statistically significant. This fact suggests that compliant firms engage more in earnings management practices and present less information quality than default firms. Diegues and Alves (2016) concluded that one year before going into bankruptcy firms decrease earnings management practices. Rosner (2003) also found that firms that are not perceived to have financial problems are motivated to engage in earnings to mislead stakeholders about their real financial situation.
Regarding the variables that analyse earnings timeliness, the variation of net income of the previous period (ΔNIt−1) is not statistically different (in median) to compliant and default firms, and the results are around zero. According to Ball and Shivakumar (2005), this suggests that gains are recognized as a positive persistent component of accounting and the results do not tend to reverse. The variable DΔNIt−1 × ΔNIt−1 is also similar (in median) in both groups, meaning that compliant and default firms present similar practices of recognition of losses. García-Lara et al. (2009) suggest that distressed firms recognize losses in earnings slower than in gains, but the results obtained do not indicate it.
Compliant firms have a greater weight of short-term debt ratio (current liabilities by total liabilities), and higher capital and solvency ratios (equity divided by total assets and equity divided by total liabilities) compared to default firms. This means that firms with financial distress are more indebted, and have more long-term debt, suggesting that they are more dependent on bank loans. The difference in the median of the two groups is statistically significant. Pacheco (2015), analysing Portuguese SMEs in the hospitality sector, also found that “active” firms present higher capital ratios and lower levels of debt.
Regarding liquidity, measured by WC/A, compliant firms present higher values and the differences in medians between the two groups are significant. Bryan et al. (2002) argue that fewer liquidity firms are more likely to go into bankruptcy.
At a size level (log(A)) default firms are smaller than compliant ones. Levratto (2013) explains that smaller firms have lower resources and therefore a greater probability of default.
When analysing profitability (ROE and EBIT/A), compliant firms present higher returns than default firms and the difference between both groups is significant. Less profitable firms have more difficulties in generating profits which impacts the ability to meet obligations. Therefore, these firms have a higher probability of distress. Similar results were found by Pacheco (2015) and Lisboa et al. (2021).
Compliant firms present higher cash flows measured by CF/L. According to Tinoco and Wilson (2013) the lower the cash flows, the greater the firm’s difficulty in meeting its obligations, as they are unable to obtain internal funds.
Finally, compliant firms are more efficient, concerning asset turnover (S/A), meaning that have more profitable investments.
4.3. Panel Model Results
The result of the proposed model to predict default probability is shown in Table 4. In Model 1, the capital ratio (E/A) and the cash flow ratio (CF/L) are used; in Model 2, the capital ratio is replaced by the solvency ratio (E/L) and the cash flow ratio by the profitability ratio (EBIT/A). In Models 1b and 2b, the variables associated with the FRQ were removed to analyse their impact on the model and classification accuracy.
In Model 1, McFadden R2 and Adjusted R2 are around 15%, a smaller value than that obtained by Pacheco et al. (2019) (38%) and Lisboa et al. (2021) (32%), who also analyse Portuguese SMEs but different industries and/or period, but higher than the one found by Pacheco (2015) (8%). In Model 2, McFadden R2 and Adjusted R2 decrease significantly and are approximately 8%. We can conclude that the consideration of capital ratio (E/A) and cash flow ratio (CF/L) improve the quality of the model.
Discretionary accruals (DA) negatively impact default probability, suggesting that firms that engage less in earnings management practices are the ones with a greater probability of distress. In Model 1a, earnings timeliness variables are not significant, which is in line with the Mann–Whitney test that showed no difference between the two groups. Nonetheless, in Model 2a, when considering the EBIT/A and the E/L, the timeliness, namely the ∆NI(t−1) coefficient is positive and significant. The higher the annual change in net income, the greater the firm’s probability of default. This is related to the difficulty of forecasting future profits since earnings have greater variation every year. Earnings persistence is desirable since it is easier to estimate future earnings when they present stability and it does not have a one-off character, which can be a result of earnings management (Schipper and Vincent 2003). The variable DΔNIt−1 × ΔNIt−1 is not significant, meaning that compliant and default firms present similar practices of recognition of losses.
The greater the weight of current liabilities over total liabilities (CL/L), the smaller the probability of default. Liabilities are divided into current and non-current liabilities. Current liabilities include operational items that result from the firm’s normal activity, while non-current liabilities are more related to bank loans or non-operational sources of finance. Thus, the greater the weight of current liabilities over total liabilities, the less dependent on financial debt the firm is. Moreover, capital ratio (E/A) has a negative relationship with the probability of distress (Model 1a) since firms with more equity are less indebted and thus are more able to meet financial commitments. Similar results were found by Pacheco et al. (2019). E/L is not statistically significant, although it is negative. Concerning liquidity, measured by WC/A, it is not significant in Model 1a, and presents a negative impact in Model 2 (2a and 2b) as expected, suggesting that firms with more working capital have more free cash flow, and thus less probability of default. Similar results were obtained by Ohlson (1980), Bryan et al. (2002), and Pacheco et al. (2019). Smaller firms are more able to default since these firms have no safety margin to surpass financial problems and are more exposed to financial difficulties. Moreover, large-size firms have more collateral that can be used in case of financial difficulties. This result is in line with those of Altman et al. (1977), Ohlson (1980), and Pacheco et al. (2019).
Return on equity (ROE) does not have a significant impact on default probability; however, analysing the ratio EBIT/A (Model 2), we can conclude that firms less profitable have more probability of default since if firms are not efficient in generating earnings, they have more difficulties in fulfilling financial commitments. This relation is also confirmed by the ratio of asset turnover (S/A). Moreover, less profitable firms are not increasing self-funding and are more dependent on third-party capital. Similar results were found by Altman (1968) and Lisboa et al. (2021).
Finally, the inflation rate shows a negative sign and statistical significance at the level of 1%. In the variable analysis, the inflation rate is positively and significantly correlated with the dummy variable which identifies default firms. However, through multivariate analysis, this relationship is contrary to the expected and obtained one by Antunes and Mucharreira (2015), who indicate that the higher the inflation, the lower the purchasing power and higher the probability of default. The results obtained suggest that with the decrease in the inflation rate, the purchasing power of customers increases, and thus more consumers can acquire a new house or improve their existing house, which can deal with an increase in the construction sector firms’ turnover and thus reduce firms’ probabilities of default.
When the FRQ variables are excluded from the models (Model 1b and Model 2b), we can observe that the model accuracy as well as McFadden R2 and Adjusted R2 decrease, showing the relevance of including FRQ variables to predicting firms’ probabilities of default. Moreover, the significance of the other determinants is similar, but the variable of efficiency loses statistical significance. Finally, in Model 1b, the variables WC/A and CF/L are now both significant in a positive way, which can suggest that their impact is related to financial information quality.
Finally, to understand the accuracy of the model and the errors in classification accuracy (Type 1 and Type 2), Table 5 is presented:
The estimated Model 1a has a success rate of 84.8%, lower than the original model of Altman Z-score model (Altman 1968)—95%, Ohlson O-score (Ohlson 1980)—96%, and Zmijewski (1984) model—97%, but higher than that of Ashraf et al. (2020)—77%. Model 2a has a slightly lower success rate. Models classify better compliant firms—81.5%, but only 18.5% of default firms are well classified. This results in higher error type 1 which means that the model presents higher decision costs (Tinoco and Wilson 2013). Moreover, without FRQ proxies (Model 1b and Model 2b) the success rate of the model decreases and error type I increase, which proves the relevance of these proxies for predicting firms’ default.
4.4. Robustness Test
To analyse the robustness of the obtained results, i.e., the importance of FRQ variables in predicting the default of the construction sector in Portuguese SMEs, the model was estimated using the random forest model. It is intended to verify the accuracy of the model by a comparative approach (Tinoco and Wilson 2013; Jones et al. 2017; Ashraf et al. 2020) between the logit model and data-driven models, namely between interpretability and accuracy in forecasting. The analysis is made using Model 1 (Model 1a and Model 1b) which is the presented model with the best success rate.
The random forest methodology is an ensemble methodology, which is a technique that has been acquiring increasing relevance since it combines several learning algorithms to improve the accuracy of classification (Kumar et al. 2013). The random forest aims to create a stable and strong classifier by combining the results obtained by several decision-making trees.
For each bootstrap sample, the best split (70/30) among the variables is selected. Of the 11 variables used in Model 1a and 8 variables used in Model 1b, 7 variables were used for decision-making. Table 6 shows the results obtained using the FRQ variables (Model 1a) and without using the FRQ variables (Model 1b). The variables are presented in order of importance in the prediction of default.
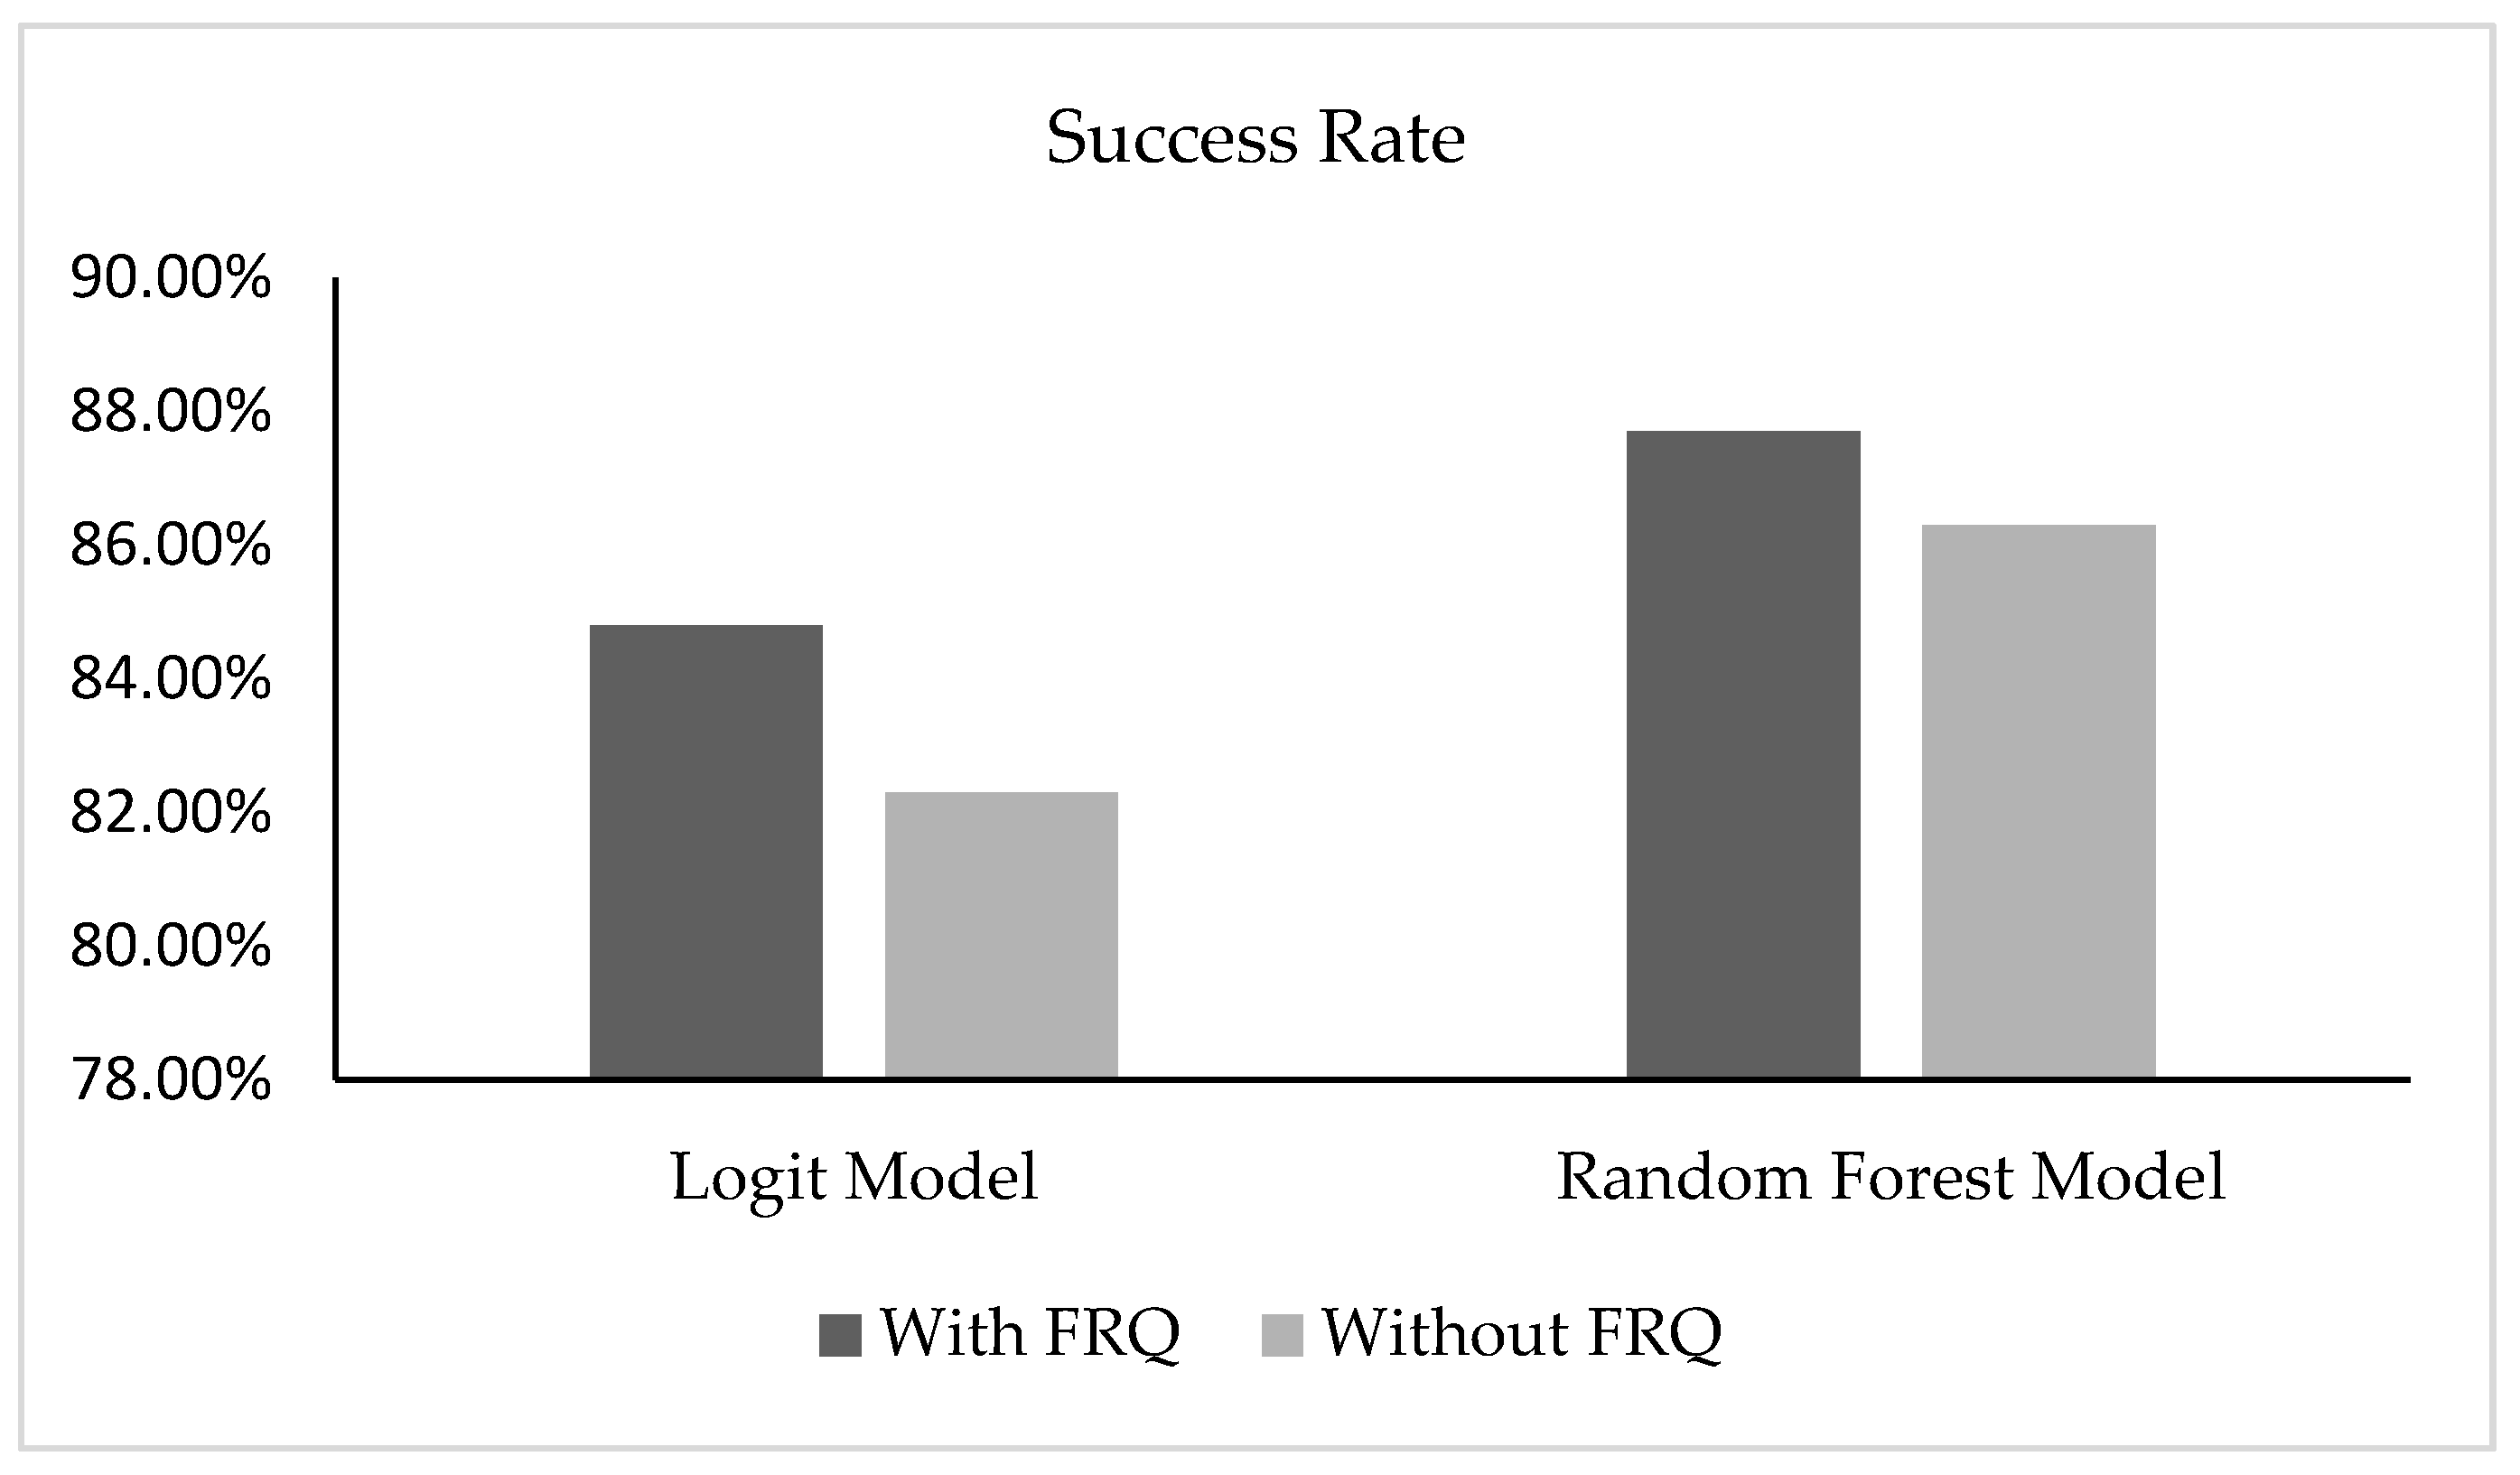
The results confirm that the FRQ proxy (earnings timeliness) is significant in predicting default as it is the second variable with greater predictive power (Table 6, Model 1a). The consideration of the FRQ variable improves (from 86% to about 88%) the success rate of the random forest model corroborating the results obtained with the logit model (Figure 1). There is an improvement in the forecast of default firms, leading to a decrease in type 1 error, one of the errors that entails more costs when committed.
5. Discussion
Results show that FRQ is relevant to explaining firms’ probabilities of default in line with previous work (e.g., Beaver et al. 2012; Diegues and Alves 2016; Lin et al. 2016; Nagar and Sen 2018; Wu et al. 2018; Ashraf et al. 2020). As suggested in this work, results confirm that financial distress depends on more than one characteristic of the FRQ, more specifically, accruals quality (which is mainly analysed by researchers in this thematic) and timeliness.
Accruals’ quality negatively impacts firms’ probabilities of default. This fact proposes that firms who tend to mislead investors know their financial situation and want to meet stakeholders’ interests or continue to access bank loans at lower costs to survive in the future. However, based on Rosner (2003), this conclusion does not mean that later these firms go into bankruptcy. When the probability of financial distress increases, firms show their real situation, increasing financial report quality. Results are singular when compared with the literature that analyses listed companies (e.g., Beaver et al. 2012; Lin et al. 2016; Nagar and Sen 2018; Wu et al. 2018; Ashraf et al. 2020). SMEs’ financial reporting quality is different compared to listed companies as well as the users of this information which can support the results obtained (Campa and Camacho-Miñamo 2014). SMEs have different motivations to engage in earnings management practices (usually to have benefits in their relationship with banks). Diegues and Alves (2016), who analysed Portuguese firms (with total assets higher than one million euros) already in bankruptcy (ex-post criterion), found that one year before bankruptcy, firms’ earnings management increases (less FRQ). These conclusions suggest that this situation is common to SMEs and/or to Portuguese firms with financial problems.
Timeliness also contributes to explaining firms’ probabilities of default. Firms’ financial information should be rapidly available to users, but sometimes managers delay or advance information to influence stakeholders’ perceptions. Firms with previous losses (bad news) tend to change earnings due to the need to access bank loans or to meet their covenants, as suggested by García-Lara et al. (2009). Results show that when net income has a significant variation from one year to the other, firms’ probabilities of default increase. This is also related to predictability as less constant earnings are less predictable, which is not desirable for stakeholders who prefer more stable firms. Therefore, when financial information is of quality and is reported in a timely fashion, firms’ probabilities of default decrease.
This work also aimed to develop a model with an optimal set of variables to predict the probability of default. To fulfil this, the stepwise method was used following Mselmi et al. (2017) and Ashraf et al. (2020). FRQ and accounting measures were simultaneously included, and the results show the relevance of FRQ. Nevertheless, three FRQ proxies were included, and only two were significant for this specific sample, necessitating replication of this approach in different countries and/or sectors.
Additionally, to FRQ variables, results show that smaller, less profitable, and less efficient more indebted firms, with more working capital, are more likely to present financial problems. Less efficient firms usually do less profitable investments and so are less profitable. Therefore, self-funding is not sufficient to cover financial needs and firms tend to increase debt, especially when working capital needs to increase. With the increase of liabilities, firms’ obligations also increase, which can lead to financial problems. This situation is more common for smaller firms as these firms usually do not have the financial capacity to surpass financial difficulties. The conclusions are mainly in line with research on default (e.g., Altman 1968; Lin 2009; Mselmi et al. 2017; Pacheco et al. 2019). The exception is regarding the CL/L impact, which can be justified by the specificities of this sector. The greater the weight of current liabilities over total liabilities, the lower the probability of default. The construction sector is characterized by a long duration of projects that cause liquidity problems and increase its financial risk (Muscettola 2014). Therefore, firms that are able to negotiate higher credits with suppliers will need less financial debt and thus face fewer financial difficulties. This conclusion highlights the need to explore each sector separately due to its specificities.
The results also show that the construction sector highly depends on macroeconomic factors, mainly on the inflation rate. When inflation decreases, the firms’ probabilities of default increase. This conclusion contradicts the expectations and results of Antunes and Mucharreira (2015) who analysed Portuguese SMEs. Therefore, this result can be specific to this sample.
The proposed model presents an accuracy of 85%, which is higher than those of Ashraf et al. (2020). The model classifies better compliant firms. Moreover, results are confirmed through the random forest methodology, which is a new age classifier less used due to its complexity and time-consuming. In both analyses, the results confirm the relevance of FRQ proxies, especially in correctly classifying default firms.
Besides the several contributions in the literature, the conclusions necessitate that firms make efficient investments that promote more sales and profits, which will decrease external financial needs and increase financial wealth. Moreover, firms should present high-quality earnings and financial reports in a timely manner.
6. Conclusions
A firm’s probability of default is not a new research theme but is gaining prominence in recent years since it helps to avoid firms’ bankruptcy. Several sets of variables, models, and methodologies have been discussed in the literature to define a more accurate way to predict distress. However, few studies have analysed the impact of financial reporting quality in this relation, and the ones which take it into account focus mainly on earnings management (or accruals quality), which is only one characteristic. This study aims to understand if FRQ proxies impact firms’ probabilities of default. Three measures of FRQ that can be used by SMEs are included: accruals quality (related to earnings management), earnings timeliness, and earnings smoothness.
A panel of data of Portuguese SMEs in the construction sector from 2012 to 2018 was analysed for this purpose. First, we classify firms in default or compliant using an ex-ante classification. Using signs to predict firms’ financial problems in advance will allow a firm to make timely decisions to avoid bankruptcy. This is of greater relevance, especially in the construction sector which is characterized by a long duration of projects that last more than one year. The results show the prevalence of compliant firms over the period analysed.
Second, we use the stepwise methodology to identify the most accurate set of variables, both financial reporting quality and accounting variables, to predict firms’ probabilities of default. Findings show the relevance of FRQ proxies, namely accruals quality and earnings timeliness to financial distress. This finding shows not only that FRQ should be included to predict default, but also that earnings management (proxy of accruals quality) is not sufficient to explain it. Moreover, the variables group of leverage, liquidity, size, profitability, efficiency, and cash flow are also relevant to discriminate between default and compliant firms.
Third, using a logit model to predict financial distress, our results prove that by including FRQ proxies, the success prediction rate of the model increases, suggesting that financial information quality is relevant to explaining firms’ default and especially to correctly classifying distress firms (avoiding error type I, which is more costly to firms). Finally, results were confirmed using a new age classifier model: the random forest.
This study makes several contributions to the literature, practice, and society. First, the literature about financial distress is enlarged since results prove the relevance of FRQ to predict default. Studies analysing this relation are scarce and the existing ones focus on earnings management, one characteristic of FRQ (accruals quality), and/or on listed firms. By including more proxies of FRQ, which are relevant to predicting distress, we add new knowledge to the literature. Moreover, when using the stepwise methodology to understand the best set of variables to predict the financial distress of the specific sample, we have included FRQ proxies as well as financial determinants and the results prove the relevance of both types of variables. Previous studies such as Ashraf et al. (2020) use the stepwise methodology only for financial determinants and then include FRQ proxies in the final model. Finally, not only traditional models of financial distress are used, such as the logit model, but also a new age classifier, the random forest methodology, which, to our knowledge, has not been used in a Portuguese sample before.
Moreover, in practice, managers of the construction sector can understand the firms’ financial situation in advance by understanding the signs of financial problems and which variables help to predict default situations. The impact of financial information quality to prevent additional risks is also explained. This helps managers to make timely decisions to avoid firms’ bankruptcy. Stakeholders of the construction firms can understand firms’ financial sustainability and whether to believe (or not) in the financial information provided by firms. Finally, the government can understand how regulations can be adapted or created to both promote financial information quality and transparency and help firms to recover from financial constraints. This will help to promote the well-being of society as SMEs are an important driver of economic development.
The work fulfilled the proposed aims. However, all works have some limitations. First, the analysis is based on construction firms of a single country, which does not allow for the generalization of results. Future research could be done using different samples to validate results. This work only takes into account accruals quality of the year, although it can have medium-term effects as earnings management usually have reputational impacts one or more years after, so this lag effect could be also addressed in future analysis. Ex-ante and ex-post classifications of default may also be addressed to verify the potential differences.
Author Contributions
Conceptualization, M.C., I.L. and A.G.; methodology, M.C., I.L. and A.G.; software, M.C., I.L. and A.G.; validation, M.C., I.L. and A.G.; formal analysis, M.C., I.L. and A.G.; investigation, M.C., I.L. and A.G.; resources, M.C, I.L. and A.G.; data curation, M.C., I.L. and A.G.; writing—original draft preparation, M.C, and I.L.; writing—review and editing, M.C., and I.L.; visualization, M.C, I.L. and A.G.; supervision, M.C.; project administration, M.C. and I.L.; funding acquisition, I.L. All authors have read and agreed to the published version of the manuscript.
Funding
This research was supported by National Funds of the FCT—Portuguese Foundation for Science and Technology within the project [UIDB/04928/2020] and the project [UIDB/04007/2020].
Institutional Review Board Statement
Not applicable.
Informed Consent Statement
Not applicable.
Data Availability Statement
Data was obtained from SABI available online https://0-sabi-bvdinfo-com.brum.beds.ac.uk/ (accessed on 17 June 2021), and Pordata database available online https://www.pordata.pt/ (accessed on 17 June 2021).
Conflicts of Interest
The authors declare no conflict of interest.
Appendix A

Table A1.
Variable Definitions.
| Group | Proxies | Formula | Main References |
|---|---|---|---|
| Liquidity | WC/A | Working Capital/Total Assets | Altman (1968), Altman et al. (1977), Beaver (1966), Lin (2009), Ohlson (1980), Mselmi et al. (2017), Pacheco et al. (2019), Zmijewski (1984) |
| CA/CL | Current Assets/Current Liabilities | ||
| CL/CA | Current Liabilities/Current Assets | ||
| Profitability | NI/A | Net income/Total Assets | Altman (1968), Altman et al. (1977), Altman and Sabato (2007), Beaver (1966), Lisboa et al. (2021), Muscettola (2014), Ohlson (1980), Pacheco et al. (2019), Pindado et al. (2008) |
| RE/A | Retained Earnings/Total Assets | ||
| EBIT/A | Earnings Before Interest and Taxes/Total Assets | ||
| EBITDA/S | Earnings Before Interest, Taxes, Depreciations, and Amortizations/Sales | ||
| ROE | Net income/Total Equity | ||
| Size | Log (A) | Logarithm of total assets | Altman et al. (1977), Lisboa et al. (2021) |
| Leverage | L/A | Total Liabilities/Total Assets | Altman (1983), Beaver (1966), Lin (2009), Ohlson (1980), Lisboa et al. (2021), Pacheco et al. (2019), Mselmi et al. (2017), Tinoco and Wilson (2013), Zmijewski (1984) |
| E/L | Total Equity/Total Liabilities | ||
| CL/L | Current Liabilities/Total Liabilities | ||
| E/A | Equity/Total Assets | ||
| Efficiency | S/A | Sales/Total Assets | Altman (1968), Lin (2009), Lisboa et al. (2021), Pacheco et al. (2019) |
| Interest Expenses | EBIT/IE | Earnings Before Interest and Taxes/Interest Expenses | Altman et al. (1977), Altman and Sabato (2007), Muscettola (2014), Pindado et al. (2008), Salloum et al. (2012), Tinoco and Wilson (2013) |
| Cash Flow | CF/L | Cash Flow/ Total Liabilities | Beaver (1966), Lisboa et al. (2021), Ohlson (1980), Tinoco and Wilson (2013) |
References
- Abdullahi, Muhammad, and Kabir Bala. 2018. Analysis of the Causality Links between the Growth of the Construction Industry and the Growth of the Nigerian Economy. Journal of Construction in Developing Countries 23: 103–13. [Google Scholar] [CrossRef]
- Altman, Edward I. 1968. Financial Ratios, Discriminant Analysis and the Prediction of Corporate Bankruptcy. The Journal of Finance 23: 589–609. [Google Scholar] [CrossRef]
- Altman, Edward I. 1983. Corporate Financial Distress: A Complete Guide to Predicting, Avoiding, and Dealing with Bankruptcy. New York: Wiley Interscience, John Wiley and Sons. [Google Scholar]
- Altman, Edward I., and Gabriele Sabato. 2007. Modelling credit risk for SMEs: Evidence from the U.S. market. Abacus 43: 332–57. [Google Scholar] [CrossRef]
- Altman, Edward I., Małgorzata Iwanicz-Drozdowska, Erkki K. Laitinen, and Arto Suvas. 2017. Financial distress prediction in an international context: A review and empirical analysis of Altman’s Z-score model. Journal of International Financial Management & Accounting 28: 131–71. [Google Scholar] [CrossRef]
- Altman, Edward I., Robert G. Haldeman, and Paul Narayanan. 1977. ZETA Analysis—A new model to identify bankruptcy risk corporations. Journal of Banking and Finance 1: 29–54. [Google Scholar] [CrossRef]
- Antunes, Marina G., and Pedro R. Mucharreira. 2015. Os efeitos das variáveis macroeconómicas no desempenho das organizações: Evidência das pequenas e médias empresas em Portugal. Contabilidade & Gestão 17: 115–43. [Google Scholar]
- Ashraf, Sumaira, Elisabete G. S. Félix, and Zélia Serrasqueiro. 2019. Do traditional financial distress prediction models predict the early warning signs of financial distress? Journal of Risk and Financial Management 12: 55. [Google Scholar] [CrossRef] [Green Version]
- Ashraf, Sumaira, Elisabete G. S. Félix, and Zélia Serrasqueiro. 2020. Development and testing of an augmented distress prediction model: A comparative study on a developed and an emerging market. Journal of Multinational Financial Management 57– 58: 100659. [Google Scholar] [CrossRef]
- Assaad, Rayan, and Islam H. El-Adaway. 2020. Enhancing the knowledge of construction business failure: A social network analysis approach. Journal of Construction Engineering and Management 146: 04020052. [Google Scholar] [CrossRef]
- Baganha, Maria Ioannis, José Carlos Marques, and Pedro Góis. 2002. O Sector da Construção Civil e Obras Públicas em Portugal: 1990–2000. Pemint, Relatório 1-P European Commission, 5th Framework Programme Improving Human Potential and Socio-Economic Knowledge Base Key Action for Socio-Economic Research (Contract No. HP-CT–2001–00059). pp. 1–35. Available online: http://www.ces.uc.pt/publicacoes/oficina/index.php?id=2485 (accessed on 11 June 2021).
- Ball, Ray, and Lakshmanan Shivakumar. 2005. Earnings quality in UK private firms: Comparative loss recognition timeliness. Journal of Accounting and Economics 39: 83–128. [Google Scholar] [CrossRef]
- Bank of Portugal. 2015. Sectoral Analysis of the Construction Sector. Central Balance Sheets Studies. Lisboa: Banco de Portugal. [Google Scholar]
- Barboza, Flavio, Herbert Kimura, and Edward Altman. 2017. Machine learning models and bankruptcy prediction. Expert Systems with Applications 83: 405–17. [Google Scholar] [CrossRef]
- Basu, Sudipta. 1997. The conservatism principle and the asymmetric timeliness of earnings. Journal of Accounting and Economics 24: 3–37. [Google Scholar] [CrossRef] [Green Version]
- Beaver, William H. 1966. Financial Ratios as Predictors of Failure. Journal of Accounting Research 4: 71–111. [Google Scholar] [CrossRef]
- Beaver, William H., Maria Correia, and Maureen F. McNichols. 2011. Financial statement analysis and the prediction of financial distress. Foundations and Trends® in Accounting 5: 99–173. [Google Scholar] [CrossRef] [Green Version]
- Beaver, William H., Maria Correia, and Maureen F. McNichols. 2012. Do differences in financial reporting attributes impair the predictive ability of financial ratios for bankruptcy? Review of Accounting Studies 17: 969–1010. [Google Scholar] [CrossRef]
- Biddle, Gary C., Mary L. Z. Ma, and Frank M. Song. 2022. Accounting conservatism and bankruptcy risk. Journal of Accounting, Auditing & Finance 37: 295–323. [Google Scholar]
- Bhimani, Alnoor, Mohamed Azzim Gulamhussen, and Samuel Da-Rocha Lopes. 2010. Accounting and non-accounting determinants of default: An analysis of privately-held firms. Journal of Accounting and Public Policy 29: 517–32. [Google Scholar] [CrossRef]
- Brown, Philip, Glen W. Dobbie, and Andrew B. Jackson. 2011. Measures of the Timeliness of Earnings. Australian Accounting Review 21: 222–34. [Google Scholar] [CrossRef]
- Bryan, Daniel M., Samuel L. Tiras, and Clark M. Wheatley. 2002. The interaction of solvency with liquidity and its association with bankruptcy emergence. Journal of Business Finance and Accounting 29: 935–65. [Google Scholar] [CrossRef]
- Campa, Domenico, and María-del-Mar Camacho-Miñamo. 2014. Earnings management among bankrupt non-listed firms: Evidence from Spain. Journal of Finance and Accounting/Revista Espanola de Financiacion y Contabilidad 43: 3–20. [Google Scholar] [CrossRef]
- Campa, Domenico, and María-del-Mar Camacho-Miñamo. 2015. The impact of SME’s pre-bankruptcy financial distress on earnings management tools. International Review of Financial Analysis 42: 222–34. [Google Scholar] [CrossRef]
- Cascino, Stefano, Mark Clatworthy, Beatriz García Osma, Joachim Gassen, Shahed Imam, and Thomas Jeanjean. 2014. Who uses financial reports and for what purpose? Evidence from Capital Providers. Accounting in Europe 11: 185–209. [Google Scholar] [CrossRef] [Green Version]
- Charitou, Andreas, Neophytos Lambertides, and Lenos Trigeorgis. 2007. Earnings behaviour of financially distressed firms: The role of institutional ownership. Abacus 43: 271–96. [Google Scholar] [CrossRef]
- Cheng, Wen Ying, Ender Su, and Sheng Jung Li. 2006. A financial distress pre-warning study by fuzzy regression model of tse-listed companies. Asian Academy of Management Journal of Accounting and Finance 2: 75–93. [Google Scholar]
- Choi, Hyunchul, Hyojoo Son, and Changwan Kim. 2018. Predicting financial distress of contractors in the construction industry using ensemble learning. Expert Systems with Applications 110: 1–10. [Google Scholar] [CrossRef]
- CIRE (Código da Insolvência e da Recuperação de Empresas). 2019. Decreto Lei 53/2004 de 18 de março. Diário da República Nº 66/2004 (last version: DL n.º 84/2019, de 28/06). Available online: https://dre.pt/dre/detalhe/decreto-lei/53-2004-538423 (accessed on 17 April 2021).
- Dechow, Patricia M., and Ilia D. Dichev. 2002. The quality of accruals and earnings: The role of accrual estimation errors. The Accounting Review 77: 35–59. [Google Scholar] [CrossRef]
- Dechow, Patricia M., Richard G. Sloan, and Amy P. Sweeney. 1996. Causes and consequences of earnings manipulation: An analysis of firms subject to enforcement actions by the SEC. Contemporary Accounting Research 13: 1–36. [Google Scholar] [CrossRef]
- Dechow, Patricia M., Richard G. Sloan, and Amy P. Sweeney. 1995. Detecting Earnings Management. The Accounting Review 70: 193–225. [Google Scholar]
- Diegues, Ana Lisa Rodrigues, and Jorge Alves. 2016. A qualidade da informação financeira como indicador da probabilidade de falência da empresa: Revisão de literatura. XVII Ecuentro AECA, 110a. [Google Scholar]
- Dimitras, Augustinos I., Maria I. Kyriakou, and George Iatridis. 2015. Financial crisis, GDP variation and earnings management in Europe. Research in International Business and Finance 34: 338–54. [Google Scholar] [CrossRef]
- Du, Xudong, Wei Li, Sumei Ruan, and Li Li. 2020. CUS-heterogeneous ensemble-based financial distress prediction for imbalanced dataset with ensemble feature selection. Applied Soft Computing 97: 106758. [Google Scholar] [CrossRef]
- Dutzi, Andreas, and Bastian Rausch. 2016. Earnings Management before Bankruptcy: A Review of the Literature. Journal of Accounting and Auditing: Research & Practice 2016: 245891. [Google Scholar] [CrossRef]
- Eckel, Norm. 1981. The Income Smoothing Hypothesis Revisited. Abacus 17: 28–40. [Google Scholar] [CrossRef]
- Gaio, Cristina, and Clara C. Raposo. 2014. Corporate governance and earnings quality: International evidence. Journal of Accounting and Finance 14: 52. [Google Scholar]
- Gaio, Cristina, and Clara C. Raposo. 2011. Earnings quality and firm valuation: International evidence. Accounting & Finance 51: 467–99. [Google Scholar]
- García-Lara, Juan Manuel, Beatriz García Osma, and Evi Neophytou. 2009. Earnings quality in ex-post failed firms. Accounting and Business Research 39: 119–38. [Google Scholar] [CrossRef] [Green Version]
- Giriūniene, Gintare, Lukas Giriūnas, Mangirdas Morkunas, and Laura Brucaite. 2019. A Comparison on Leading Methodologies for Bankruptcy Prediction: The Case of the Construction Sector in Lithuania. Economies 7: 82. [Google Scholar] [CrossRef] [Green Version]
- Habib, Ahsan, Borhan Uddin Bhuiyan, and Ainul Islam. 2013. Financial distress, earnings management and market pricing of accruals during the global financial crisis. Managerial Finance 39: 155–80. [Google Scholar] [CrossRef]
- Habib, Ahsan, Mabel D. Costa, Hedy Jiaying Huang, Md Borhan Uddin Bhuiyan, and Li Sun. 2020. Determinants and consequences of financial distress: Review of the empirical literature. Accounting & Finance 60: 1023–75. [Google Scholar]
- Healy, Paul M., and James M. Wahlen. 1999. A Review of the Earnings Management Literature and its Implications for Standard Setting. Accounting Horizons 13: 365–83. [Google Scholar] [CrossRef]
- Hogan, Chris E., Zabihollah Rezaee, Richard A. Riley Jr., and Uma K. Velury. 2008. Financial statement fraud: Insights from the academic literature. Auditing: A Journal of Practice & Theory 27: 231–52. [Google Scholar]
- Holthausen, Robert W., and Ross L. Watts. 2001. The relevance of the value-relevance literature for financial accounting standard setting. Journal of Accounting and Economics 31: 3–75. [Google Scholar] [CrossRef] [Green Version]
- Huynh, Quang L. 2019. Reputation to the vicious circle of earnings quality and financial performance. Economics and Sociology 12: 361–75. [Google Scholar] [CrossRef] [PubMed] [Green Version]
- Jones, Jennifer J. 1991. Earnings management during import relief investigations. Journal of Accounting Research 29: 193–228. [Google Scholar] [CrossRef]
- Jones, Stewart, David Johnstone, and Roy Wilson. 2015. An empirical evaluation of the performance of binary classifiers in the prediction of credit ratings changes. Journal of Banking & Finance 56: 72–85. [Google Scholar] [CrossRef]
- Jones, Stewart, David Johnstone, and Roy Wilson. 2017. Predicting corporate bankruptcy: An evaluation of alternative statistical frameworks. Journal of Business Finance & Accounting 44: 3–34. [Google Scholar]
- Kapelko, Magdalena, Isabel M. Horta, Ana S. Camanho, and Alfons Oude Lansink. 2015. Measurement of input-specific productivity growth with an application to the construction industry in Spain and Portugal. International Journal of Production Economics 166: 64–71. [Google Scholar] [CrossRef]
- Kinnunen, Juha, Eero Kasanen, and Jyrki Niskanen. 1995. Earnings management and the economy sector hypothesis: Empirical evidence on a converse relationship in the Finnish case. Journal of Business Finance & Accounting 22: 497–520. [Google Scholar] [CrossRef]
- Kim, Myoung-Jong, and Dae-Ki Kang. 2010. Ensemble with neural networks for bankruptcy prediction. Expert Systems with Applications 37: 3373–79. [Google Scholar] [CrossRef]
- Kothari, Sagar P., Andrew J. Leone, and Charles E. Wasley. 2005. Performance matched discretionary accrual measures. Journal of Accounting and Economics 39: 163–97. [Google Scholar] [CrossRef]
- Kumar, G. Ravi, Venkata Sheshanna Kongara, and G. A. Ramachandra. 2013. An efficient ensemble based classification techniques for medical diagnosis. International Journal of Latest Technology in Engeneering, Management & Applied Science II, 5–9. [Google Scholar]
- Larcker, David F., and Scott A. Richardson. 2004. Fees paid to audit firms, accrual choices, and corporate governance. Journal of Accounting Research 42: 625–58. [Google Scholar] [CrossRef]
- Lau, Amy Hing-Ling. 1987. A Five-State Financial Distress Prediction Model. Journal of Accounting Research 25: 127–38. [Google Scholar] [CrossRef]
- Law Decree n. 81/2017 da Economia. 2017. Diário da República: I Série N° 125/2017. Available online: https://dre.pt/dre/detalhe/decreto-lei/81-2017-107596686 (accessed on 17 May 2021).
- Levratto, Nadine. 2013. From failure to corporate bankruptcy: A review. Journal of Innovation and Entrepreneurship 2: 20. [Google Scholar] [CrossRef] [Green Version]
- Lin, Tzong-Huei. 2009. A cross model study of corporate financial distress prediction in Taiwan: Multiple discriminant analysis, logit, probit and neural networks models. Neurocomputing 72: 3507–16. [Google Scholar] [CrossRef]
- Lin, Hsiou-Wei William, Huai-Chun Lo, and Ruei-Shian Wu. 2016. Modeling default prediction with earnings management. Pacific-Basin Finance Journal 40: 306–22. [Google Scholar] [CrossRef]
- Lisboa, Inês, Magali Costa, and Filipa Santos. 2021. Analysis of Family SMEs Default Risk: The Portuguese Case. Australasian Accounting. Business and Finance Journal 15: 76–92. [Google Scholar]
- Maślanka, Tomasz. 2017. Analysis and profitability assessment of polish construction companies threatened with bankruptcy. Financial Internet Quarterly 13: 89–96. [Google Scholar] [CrossRef] [Green Version]
- McNichols, Maureen F. 2002. Discussion of the Quality of Accruals and Earnings: The Role of Accrual Estimation Errors. The Accounting Review 77: 61–69. [Google Scholar] [CrossRef]
- Mselmi, Nada, Amine Lahiani, and Taher Hamza. 2017. Financial distress prediction: The case of French small and medium-sized firms. International Review of Financial Analysis 50: 67–80. [Google Scholar] [CrossRef]
- Muscettola, Marco. 2014. Probability of Default Estimation for Construction Firms. International Business Research 7: 153–64. [Google Scholar] [CrossRef]
- Nagar, Neerav, and Kaustav Sen. 2018. Earnings Management Strategies During Financial Distress. The IUP Journal of Accounting Research and Audit Practices 17: 52–79. [Google Scholar]
- Ohlson, James A. 1980. Financial Ratios and the Probabilistic Prediction of Bankruptcy. Journal of Accounting Research 18: 109–31. [Google Scholar] [CrossRef] [Green Version]
- Pacheco, Luís. 2015. SMEs probability of default: The case of the hospitality sector. Tourism & Management Studies 11: 153–59. [Google Scholar]
- Pacheco, Luís M., Raquel Rosa, and Fernando Oliveira Tavares. 2019. Risco de falência de PME: Evidência no setor da construção em Portugal. Innovar 29: 143–57. [Google Scholar] [CrossRef]
- Perotti, Pietro, and Alfred Wagenhofer. 2014. Earnings quality measures and excess returns. Journal of Business Finance & Accounting 41: 545–71. [Google Scholar]
- Pindado, Julio, and Luis Rodrigues. 2005. Determinants of Financial Distress Costs. Financial Markets and Portfolio Management 19: 343–59. [Google Scholar] [CrossRef]
- Pindado, Julio, Luis Rodrigues, and Chabela de la Torre. 2008. Estimating financial distress likelihood. Journal of Business Research 61: 995–1003. [Google Scholar] [CrossRef]
- PORDATA. 2020. Birth and Death Rate by Economic Activity. Lisboa: PORDATA, Fundação Francisco Manuel dos Santos. [Google Scholar]
- PORDATA. 2021. Production and Value Creation by Industry. Lisboa: PORDATA, Fundação Francisco Manuel dos Santos. [Google Scholar]
- Prencipe, Annalisa, Sasson Bar-Yosef, Pietro Mazzola, and Lorenzo Pozza. 2011. Income smoothing in family-controlled companies: Evidence from Italy. Corporate Governance: An International Review 19: 529–46. [Google Scholar] [CrossRef]
- Rosner, Rebecca L. 2003. Earnings manipulation in failing firms. Contemporary Accounting Research 20: 361–408. [Google Scholar] [CrossRef]
- Saleh, Norman M., and Kamran Ahmed. 2005. Earnings management of distressed firms during debt renegotiation. Accounting and Business Research 35: 69–86. [Google Scholar] [CrossRef]
- Salloum, Charbel, Christophe Schmitt, and Elie Bouri. 2012. Does board structure affect financial distress? A study with reference to family firms in Lebanon. Investment Management and Financial Innovations 9: 113–23. [Google Scholar]
- Schipper, Katherine, and Linda Vincent. 2003. Earnings quality. Accounting Horizons 17: 97–110. [Google Scholar] [CrossRef]
- Shen, Feng, Yongyong Liu, Run Wang, and Wei Zhou. 2020. A dynamic financial distress forecast model with multiple forecast results under unbalanced data environment. Knowledge-Based Systems 192: 105365. [Google Scholar] [CrossRef]
- Shin, Kyung-Shik, Taik Soo Lee, and Hyun-Jung Kim. 2005. An application of support vector machines in the bankruptcy prediction model. Expert Systems with Applications 28: 127–35. [Google Scholar] [CrossRef]
- Shumway, Tyler. 2001. Forecasting Bankruptcy More Accurately: A Simple Hazard Model. The Journal of Business 74: 101–24. [Google Scholar] [CrossRef] [Green Version]
- Sun, Jie, Hamido Fujita, Peng Chen, and Hui Li. 2017. Dynamic financial distress prediction with concept drift based on time weighting combined with Adaboost support vector machine ensemble. Knowledge-Based Systems 120: 4–14. [Google Scholar] [CrossRef]
- Tarighi, Hossein, Zeynab N. Hosseiny, Mohammad R. Abbaszadeh, Grzegorz Zimon, and Darya Haghighat. 2022. How Do Financial Distress Risk and Related Party Transactions Affect Financial Reporting Quality? Empirical Evidence from Iran. Risks 10: 46. [Google Scholar] [CrossRef]
- Tinoco, Mario H., and Nick Wilson. 2013. Financial distress and bankruptcy prediction among listed companies using accounting, market, and macroeconomic variables. International Review of Financial Analysis 30: 394–419. [Google Scholar] [CrossRef]
- Tinoco, Mario H., Phil Holmes, and Nick Wilson. 2018. Polytomous response financial distress models: The role of accounting, market and macroeconomic variables. International Review of Financial Analysis 59: 276–89. [Google Scholar] [CrossRef] [Green Version]
- Tseng, Fang-Mei, and Yi-Chung Hu. 2010. Comparing four bankruptcy prediction models: Logit, quadratic interval logit, neural and fuzzy neural networks. Expert Systems with Applications 37: 1846–53. [Google Scholar] [CrossRef]
- Wang, Zong-Jun, and Xiao-Lan Deng. 2006. Corporate governance and financial distress: Evidence from Chinese listed companies. Chinese Economy 39: 5–27. [Google Scholar] [CrossRef]
- Wu, Ruei-Shian, Hsiou-Wei Lin, and Huai-Chun Lo. 2018. Does Real Earnings Management Matter in Default Prediction? Available online: https://papers.ssrn.com/sol3/papers.cfm?abstract_id=3110862 (accessed on 17 May 2021).
- Zięba, Maciej, Sebastian K. Tomczak, and Jakub M. Tomczak. 2016. Ensemble boosted trees with synthetic features generation in application to bankruptcy prediction. Expert Systems with Applications 58: 93–101. [Google Scholar] [CrossRef]
- Zizi, Youssef, Amine Jamali-Alaoui, Badreddine El Goumi, Mohamed Oudgou, and Abdeslam El Moudden. 2021. An Optimal Model of Financial Distress Prediction: A Comparative Study between Neural Networks and Logistic Regression. Risks 9: 200. [Google Scholar] [CrossRef]
- Zmijewski, Mark E. 1984. Methodological Issues Related to the Estimation of Financial Distress Prediction Models. Journal of Accounting Research 22: 59–82. [Google Scholar] [CrossRef]
Figure 1.
Logit and random forest comparison.

Table 1.
Ratios selected by the stepwise method and Pearson correlation.
| Group | Variable | Acronym | Group | Variable | Acronym |
|---|---|---|---|---|---|
| FRQ | X1 | Size | X7 | Log (A) | |
| X2 | Profitability | X8 | ROE | ||
| X3 | X9a | EBIT/A | |||
| Leverage | X4 | CL/L | Cash Flow | X9a | CF/L |
| X5a | E/A | Efficiency | X10 | S/A | |
| X5a | E/L | Macroeconomic | X11 | Inflation rate | |
| Liquidity | X6 | WC/A |
A—Assets; AQ—accruals quality; CF—cash flow; CL—current liabilities; DΔNIt−1—a dummy variable which is 1 if prior-year change ΔNIt−1 is negative; ΔNIt−1—annual change in income scaled by total assets of the previous period; E—equity; EBIT—Earnings Before Interests and Taxes; L—liabilities; ROE—Return on equity; S—Sales; WC—Working Capital. a means that the variables are alternative.
Table 2.
Firm classification.
| Year | 2012 | 2013 | 2014 | 2015 | 2016 | 2017 | 2018 | Mean | |
|---|---|---|---|---|---|---|---|---|---|
| Default | Number | 299 | 313 | 290 | 291 | 262 | 266 | 280 | 286 |
| % | 26.0% | 27.3% | 25.6% | 24.6% | 22.0% | 22.1% | 23.1% | 24.3% | |
| Compliant | Number | 852 | 832 | 845 | 891 | 929 | 936 | 933 | 888 |
| % | 74.0% | 72.7% | 74.4% | 75.4% | 78.0% | 77.9% | 76.9% | 75.7% |
Table 3.
Descriptive statistics.
| Group | Variables | Type of Firms | Mean | Median | Stnd. Dev. | Min. | Max. | MW Test |
|---|---|---|---|---|---|---|---|---|
| FRQ | DA | Compliant | 0.319 | 0.249 | 0.335 | −5.138 | 5.824 | 0.000 |
| Default | 0.337 | 0.171 | 1.158 | −14.460 | 35.961 | |||
| Compliant | −0.001 | 0.001 | 0.405 | −27.377 | 6.249 | 0.228 | ||
| Default | 0.172 | 0.002 | 14.440 | −145.274 | 567.236 | |||
| Compliant | 0.020 | 0.000 | 0.655 | −0.355 | 51.387 | 0.177 | ||
| Default | 0.049 | 0.000 | 0.338 | −0.902 | 8.827 | |||
| Leverage | CL/L | Compliant | 0.675 | 0.718 | 0.232 | 0.002 | 0.999 | 0.000 |
| Default | 0.589 | 0.618 | 0.286 | 0.000 | 0.999 | |||
| E/A | Compliant | 0.380 | 0.350 | 0.197 | −0.042 | 0.981 | 0.000 | |
| Default | 0.058 | 0.172 | 1.200 | −32.942 | 0.985 | |||
| E/L | Compliant | 1.031 | 0.538 | 2.368 | −0.040 | 52.427 | 0.000 | |
| Default | 0.693 | 0.208 | 2.727 | −0.971 | 64.951 | |||
| Liquidity | WC/A | Compliant | 0.391 | 0.394 | 0.247 | −0.722 | 0.994 | 0.000 |
| Default | 0.287 | 0.362 | 0.702 | −18.129 | 0.998 | |||
| Size | LOG(A) | Compliant | 3.020 | 2.944 | 0.578 | 1.472 | 5.560 | 0.000 |
| Default | 2.858 | 2.682 | 0.778 | 0.033 | 5.508 | |||
| Profitability | ROE | Compliant | 0.045 | 0.034 | 0.080 | −1.025 | 0.772 | 0.000 |
| Default | −0.011 | 0.017 | 0.351 | −5.897 | 8.340 | |||
| EBIT/A | Compliant | 0.045 | 0.032 | 0.080 | −1.025 | 0.772 | 0.000 | |
| Default | −0.011 | 0.017 | 0.351 | −5.897 | 8.340 | |||
| Cash Flow | CF/L | Compliant | 0.111 | 0.063 | 0.284 | −8.833 | 7.209 | 0.000 |
| Default | 0.055 | 0.024 | 0.344 | −2.029 | 6.521 | |||
| Efficiency | S/A | Compliant | 1.268 | 1.140 | 0.807 | 0.000 | 8.880 | 0.001 |
| Default | 1.373 | 1.046 | 1.325 | 0.000 | 9.636 |
A—Assets; AQ—accruals quality; CF—cash flow; CL—current liabilities; DΔNIt−1—a dummy variable which is 1 if prior-year change ΔNIt−1 is negative; ΔNIt−1—annual change in income scaled by total assets of the previous period; E—equity; EBIT—Earnings Before Interests and Taxes; L—liabilities; ROE—Return on equity; S—Sales; WC—Working Capital.
Table 4.
Panel data results.
| Group | Variable | Expected Sign | Model 1a | Model 1b | Model 2a | Model 2b |
|---|---|---|---|---|---|---|
| Constant | 1.852 *** | 1.262 *** | 2.471 *** | 1.735 *** | ||
| FRQ | DA | +/− | −0.834 *** | −0.926 *** | ||
| 0.042 | 0.085 ** | |||||
| −0.018 | 0.060 | |||||
| Leverage | CL/L | + | −1.661 *** | −0.700 *** | −3.128 *** | −2.077 *** |
| E/A | − | −3.958 *** | −3.888 *** | |||
| E/L | − | −0.029 | −0.027 | |||
| Liquidity | WC/A | − | 0.253 | 0.809 *** | −1.985 *** | −1.283 *** |
| Size | LOG(A) | − | −0.234 *** | −0.404 *** | −0.228 *** | −0.394 *** |
| Profitability | ROE | − | −0.004 | −0.004 | −0.004 | −0.004 |
| EBIT/A | − | −2.857 *** | −2.057 *** | |||
| Cash Flow | CF/L | − | 0.103 | 0.348 * | ||
| Efficiency | S/A | − | −0.115 ** | −0.049 | −0.017 ** | 0.041 |
| Macroeconomic | Inflation rate | + | −6.326 *** | −2.779 ** | −6.382 *** | −2.599 ** |
| McFadden R2 | 15.1% | 13.5% | 8.6% | 7.0% | ||
| Adjusted R2 | 14.7% | 13.3% | 8.3% | 6.8% | ||
| Classification accuracy | 84.8% | 82.3% | 83.0% | 80.1% | ||
(1) Dependent variable: Status is a dichotomous variable equal to one for financially distressed firms, and zero otherwise; (2) A—Assets; AQ—accruals quality; CF—Cash Flow; CL—current liabilities; —a dummy variable which is 1 if prior-year change is negative; —annual change in income scaled by total assets of the previous period; E—equity; EBIT—Earnings Before Interests and Taxes; L—liabilities; ROE—Return on equity; S—Sales; WC—Working Capital; (3) statistical significance at the 10%, 5% and 1% levels are denoted *, **, and ***, respectively.
Table 5.
Success rate of the proposed model.
| Model 1a | Model 1b | Model 2a | |
|---|---|---|---|
| Compliant | 81.5% | 78.40% | 81.5% |
| Default | 18.5% | 21.60% | 18.5% |
| Total | 84.8% | 82.3% | 83.0% |
Table 6.
Random forest results.
| Model 1a | |||||
| Group | Variables | Compliant Prevision | Default Prevision | Total Prevision | |
| Leverage | E/A | 1756.137 *** | 86.9% | 13.1% | 57.0% |
| FRQ | 632.074 *** | 89.4% | 10.6% | 51.4% | |
| Cash Flow | CF/L | 105.159 *** | 91.0% | 9.0% | 29.5% |
| Liquidity | WC/A | 45.502 *** | 89.1% | 10.9% | 5.6% |
| Size | LOG(A) | 46.621 *** | 85.7% | 14.3% | 5.4% |
| Efficiency | S/A | 48.374 *** | 87.5% | 12.5% | 5.2% |
| Profitability | ROE | 68.716 *** | 8.8% | 91.2% | 4.6% |
| Success rate | 97.4% | 57.3% | 87.7% | ||
| Model 1b | |||||
| Group | Variables | Compliant Prevision | Default Prevision | Total Prevision | |
| Leverage | E/A | 1831.863 *** | 87.9% | 12.1% | 58.5% |
| Size | LOG(A) | 155.673 *** | 92.9% | 7.1% | 30.4% |
| Cash Flow | CF/L | 85.657 *** | 95.9% | 4.1% | 13.5% |
| Efficiency | S/A | 61.944 *** | 82.4% | 17.6% | 5.9% |
| Leverage | CL/L | 11.070 *** | 83.1% | 16.9% | 4.7% |
| Liquidity | WC/A | 8.291 *** | 80.5% | 19.5% | 3.3% |
| Profitability | ROE | 75.125 *** | 15.7% | 84.3% | 3.3% |
| Success rate | 97.4% | 48.9% | 86.3% | ||
(1) Dependent variable: Status is a dichotomous variable equal to one for financially distressed firms, and zero otherwise; (2) A—Assets; CF—Cash Flow; CL—current liabilities; —a dummy variable which is 1 if prior-year change is negative; —annual change in income scaled by total assets of the previous period; E—equity; L—liabilities; ROE—Return on equity; S—Sales; WC—Working Capital; (3) statistical significance at 1% levels are denoted ***.
Publisher’s Note: MDPI stays neutral with regard to jurisdictional claims in published maps and institutional affiliations. |
© 2022 by the authors. Licensee MDPI, Basel, Switzerland. This article is an open access article distributed under the terms and conditions of the Creative Commons Attribution (CC BY) license (https://creativecommons.org/licenses/by/4.0/).
Share and Cite
MDPI and ACS Style
Costa, M.; Lisboa, I.; Gameiro, A. Is the Financial Report Quality Important in the Default Prediction? SME Portuguese Construction Sector Evidence. Risks 2022, 10, 98. https://0-doi-org.brum.beds.ac.uk/10.3390/risks10050098
AMA Style
Costa M, Lisboa I, Gameiro A. Is the Financial Report Quality Important in the Default Prediction? SME Portuguese Construction Sector Evidence. Risks. 2022; 10(5):98. https://0-doi-org.brum.beds.ac.uk/10.3390/risks10050098
Chicago/Turabian StyleCosta, Magali, Inês Lisboa, and Ana Gameiro. 2022. "Is the Financial Report Quality Important in the Default Prediction? SME Portuguese Construction Sector Evidence" Risks 10, no. 5: 98. https://0-doi-org.brum.beds.ac.uk/10.3390/risks10050098
Note that from the first issue of 2016, this journal uses article numbers instead of page numbers. See further details here.