Heads and Tails of Earnings Management: Quantitative Analysis in Emerging Countries
by
 , and
, and
Pavol Durana
1,*, 
Katarina Valaskova
1,
Darina Chlebikova
1,
Vladislav Krastev
2 and
Irina Atanasova
2 1
Faculty of Operation and Economics of Transport and Communications, Department of Economics, University of Zilina, 010 26 Zilina, Slovakia
2
Department of Economics, South-West University, 2746 Blagoevgrad, Bulgaria
*
Author to whom correspondence should be addressed.
Risks 2020, 8(2), 57; https://0-doi-org.brum.beds.ac.uk/10.3390/risks8020057
Submission received: 29 April 2020
/
Revised: 25 May 2020
/
Accepted: 27 May 2020
/
Published: 1 June 2020
(This article belongs to the Special Issue Quantitative Methods in Economics and Finance)
Abstract
:Earnings management is a globally used tool for long-term profitable enterprises and for the apparatus of reduction of bankruptcy risk in developed countries. This phenomenon belongs to the integral and fundamental part of their business finance. However, this has still been lax in emerging countries. The models of detections of the existence of earnings management are based on discretionary accrual. The goal of this article is to detect the existence of earnings management in emerging countries by times series analysis. This econometric investigation uses the observations of earnings before interest and taxes of 1089 Slovak enterprises and 1421 Bulgarian enterprises in financial modelling. Our findings confirm the significant existence of earnings management in both analyzed countries, based on a quantitative analysis of unit root and stationarity. The managerial activities are purposeful, which is proven by the existence of no stationarity in the time series and a clear occurrence of the unit root. In addition, the results highlight the year 2014 as a significant milestone of change in the development of earnings management in both countries, based on homogeneity analyses. These facts identify significant parallels between Slovak and Bulgarian economics and business finance.
1. Introduction
The issues of risk management have been analyzed and discussed for a long time (Hudakova et al. 2018). The managements of the enterprises must select the best solutions for future development in any conditions (Kral et al. 2019). Spuchlakova and Cug (2015) argue that a structural approach is necessary to reduce and model their business risk. Meyers et al. (2019) highlight big data-driven algorithmic decision-making related to risk management. Vagner (2017) adds that the practical benefits connected with cost controlling and costs optimization and earnings management may be very beneficial for applying to enterprises to risk. Earnings management is an accounting technique to manage financial reports that shows a mostly positive view of business finance and the financial situation. Earnings management means the transformation into a new accounting regime, in a lot of cases (Hoang and Joseph 2019). The reasons for managers to do a manipulation of earnings is good looking for investors and potential investors (Susanto et al. 2019), moreover, Khanh and Thu (2019) declare a positive correlation between earnings management and leverage management. This phenomenon of earnings modification is an increasingly important topic, obviously in the area of the assessment of efficiency—which is a fundamental part of the corporate rational behavior that aims to survive in a challenging competitive environment in the long term (Balcerzak et al. 2017)—as well as in the areas of financial accounting, financial risk and financial modelling. The most relevant researches have been conducted in the developed markets, but this topic is very rarely investigated in emerging countries, as they still adhere to conventional approaches. The European market significantly varies from other global markets (Rahman et al. 2017).
The number of publications concerned with earnings management changes according to the country. From all the countries, earnings management is the most discussed topic in the USA. Almost five thousand research papers have their origins in this country. We may highlight that developed European countries, such as the United Kingdom (Iatridis and Kadorinis 2009; Pina et al. 2012), Spain (Ferrer Garcia and Lainez Gadea 2013; Rodriguez-Perez and van Hemmen 2010), Germany (Christensen et al. 2015; Velte 2019), Italy (Cimini 2015), the Netherlands (Kempen 2010), Belgium (Andries et al. 2017), France (Bzeouich et al. 2019; Ben Amar and Chakroun 2018) and many others, focus on earnings management phenomenon from different perspectives. However, the issue of earnings management is not developed and investigated properly in emerging countries, with various explanations for this. The identified research gap was analyzed in the case of Slovakia (SK) and Bulgaria (BG). Both countries, former Soviet-controlled Eastern bloc countries, have experienced a massive transformation of their economies over the past decades, and their significant development has been emphasized by their participation in the European Union. Following their economic development (Figure 1) using the gross domestic product (GDP) index, it is evident that the same development trend in the 10-year horizon can be indicated.
Moreover, both countries established mutual cooperation in several areas, one of them is focused on the support of local communities and society by the establishment of the Environmental Partnership Association (EPA) Consortium; they expand the bilateral cooperation in the high-tech sector. The development of mutual cooperation in different sectors of economy forced authors to aim the research at these two countries. Slovakia is the largest producer of cars per capita, with highly developed automobile and electronics exports accounting for more than 80 per cent of national gross domestic product. However, Bulgaria changes its sectoral orientation from agricultural to an industrial economy, which makes the situation in the countries easier to compare. Despite the fact that, according to the rating of the World Bank Country and Lending Groups, Bulgaria is an open upper-middle-income market economy, contrary to Slovakia, which is an open high-income market economy, the importance of the research on the earnings management phenomenon is of a vital importance in both countries. The detection and revelation of manipulation with earnings needs to be portrayed, as it is a relevant measure of investors’ and business partners´ protection against risks which may occur if distorted and incomplete information is presented by the enterprises; thus, it is a helpful tool to solve the basic issues of risk management.
It is evident that the earnings management phenomenon plays an important role in financial reports managing and should be properly investigated in conditions of national economies. However, the fact is that this issue has not been explored properly in both countries analyzed. In Slovakia, the first researches on earnings management were published in 2019, highlighting the importance of this issue in unique country samples. Nonetheless, no relevant research has been published yet on the conditions of Bulgaria. Thus, this study investigates earnings management in both countries and determines its presence by quantitative methods of time series.
The main aim and the essence of the study is to investigate the question of earnings management in Bulgarian and Slovak environments, where the motivation is to detect the existence of earnings management by time series analysis, as this topic is only rarely searched for in emerging countries. The investigation of the presence of manipulation with earnings may help to reveal the reasons for earnings management occurrence. As the issue of manipulation with earnings in both countries is unexplored, the significance of the analysis of unique country samples has to be underlined.
The manuscript is structured as follows. In the introduction, the purpose of the study and the significance of the issue of earnings management are provided. Then, the literature review is presented, concentrating on the analyses of different approaches and investigations of the solved topic. The next chapter depicts the materials used and appropriate methods of mathematical statistics to fulfil the aim. These quantitative methods are: the Dixon test, Jarque–Bera test, Box–Pierce test, Dickey–Fuller tests, Kwiatkowski–Phillips–Schmidt–Shin test, Von Neumann’s test, and Standard Normal Homogeneity test. The outcomes of the investigation, as well as the results of the hypotheses, are portrayed in the Results section. This part confirms the existence of the earnings management of Slovak and Bulgarian enterprises and marks the year 2014 as a significant milestone in the development of earnings management in both countries. In the Discussion section, the connection of ease of doing business, annual growth rate of gross domestic product (GDP), long-term unemployment rank and Standard & Poor’s outlook to the results is implicated and previous studies from emerging markets are compared. The limitations and weaknesses of our study are noted, and possible avenues of future research are determined in the conclusions of the research.
1.1. Literature Review
1.1.1. Graphic Modelling of Specific Accruals
The first mention of earnings management is captured in a study of Hepworth (1953), which was focused on balancing periodic income. The author captured several tactics, e.g., methods of balancing income through specific accruals that can be used to move net profit to subsequent accounting periods. Hepworth (1953) did not capture a way to identify the transfer of profits itself.
The initial disclosure of corporate earnings management is based on graphical methods based on data set in the time series. Gordon (1964) examines whether managers choose accounting principles and reporting rules that allow them to balance reported earnings. For each of the enterprises examined, he establishes a curve showing the profit calculated in two ways—excluding and including the dependent variables. If the discrepancies in the observations are smaller in the latter case, the earnings adjustment is due to movements in the account. Dopuch and Drake (1966) create a group of enterprises. For each enterprise, they record the total income and income from the given investment shares. The authors argue that adjusting the earnings with this approach does not pose a serious problem for the enterprise in the group, a certain part of the observed enterprise apparently acts purposefully. Archibald (1967) investigates how and why the set of enterprises has shifted from accelerated depreciation of fixed assets to straight-line depreciation for financial and tax reasons.
1.1.2. Mathematical Modelling of Specific Accruals
Gordon et al. (1966) use mathematical modelling to test the profit equalization. The authors choose the investment credit as a variable to test whether enterprises are trying to balance profits. Copeland (1968) empirically tests the use of more than one variable in revealing the existence of earnings management through additional scrutiny of government financial statements. White (1970) applies other tests, using profits from a decade. He includes several dependent variables in the tests and, for the first time, uses regression as a method to detect enterprises that balance earnings. Dascher and Malcom (1970) perform a test applying data from a six- and eleven-year time interval and draw conclusions about the reduction in semi-logarithmic trend variability attributable to discretionary balance variables. Barefield and Comiskey (1972) use data from a ten-year time series to identify variability and average absolute profit increase in enterprises that may use earnings from non-consolidated subsidiaries to balance.
1.1.3. Modelling of Total Discretionary Accruals with Application of Cross-Sectional Data
Burgstahler and Dichev (1997) detect earnings management on a cross-sectional analysis. In their research, they verify whether the managers of the tested enterprises are trying to avoid a decline in profits or losses. They choose binomial tests to verify the hypotheses in their research and present the results graphically using histograms. Degeorge et al. (1999) focus on exceeding threshold values. The authors conclude that thresholds artificially evoke specific forms of earnings management, with positive thresholds being the most dominant.
1.1.4. Modelling Using Manipulation Score
Beneish (1997) proposes a model detecting earnings manipulation similar to the Altman’s bankruptcy model. Variables called M-score capture both the distortion of financial statements and the factors that can stimulate enterprises to manipulate. Beneish (1997) and Young (1999) independently express doubts about the involvement of depreciation in the measurement of total accruals.
1.1.5. Cross-Sectional Earnings Analysis and Accrual Modelling
Peasnell et al. (2000) provide a new approach for approximation of abnormal accruals, labelled as the Margin model, which applied cross-sectional data to mitigate the weaknesses of the Jones model (Jones 1991). The authors take a two-step approach from previous models but use the working capital accrual and different explanatory variables—sales and cash from customers—as an estimate of the total accrual. The authors are criticized for assuming a linear relationship between cash flow and accruals.
1.1.6. Detection of Real Earnings Management
Burgstahler and Dichev (1997) find that enterprises often use cash flow gained by operating activities and working capital to earnings management. Headquarters pursuing specific goals thus change their economic performance and their decisions in order to make a profit. Dechow and Skinner (2000) point out that head officers can modify earnings by shifting revenue differentiation, changing the timing of deliveries, or postponing research and development to keep costs at the desired level. Graham et al. (2005) note that the most commonly used earnings management method is the modification of discretionary accruals thanks to its simplicity, inexpensiveness and difficulty to identify by recipients of financial statements. Roychwdhury (2006) finds that many enterprises stop earnings management through discretionary accruals. The author proves that the modification of discretionary accruals is no more the core way of earnings management. Penman and Zhang (2002) argue that enterprises increase earnings by reducing capital investment. Gunny (2010) states that real earnings management involves changes in the underlying operations and activities of the enterprises to increase earnings in the current period. Eldenburg et al. (2011) run their study in the environment of non-profit organizations, proving the existence of real operational decisions in order to manage earnings.
1.1.7. Modelling Using Neural Networks
1.1.8. Modelling of Total Discretionary Accruals with Application of Time Series
Healy (1985) applies average total accruals as an estimate of discretionary accruals, and thus an estimate of earnings management. Healy’s model clearly assumes the non-existence of non-discretionary accruals during estimation periods. The author concludes that the accrual policy of managers is related to incentive bonuses, which are enshrined in their contracts, and thus the shift in accounting practices is related to changes of the extra payment schedule. Kaplan (1985) criticized Healy (1985). DeAngelo (1986) supplemented Healy’s model with an accrual from the previous period. The model does not assume the existence of non-discretionary accruals in the present interval and uses the non-discretionary accruals from the previous period to estimate them. McNichols and Wilson (1988) add to the DeAngelo model capturing discretionary accruals as measures of earnings management, replacing the total accruals applied by Healy (1985) and DeAngelo (1986).
Jones (1991) investigates earnings management using two-step models during a government investigation of import relief in the United States. It is used an enterprise-specific model, based on data from at least fourteen-year time series. Discretionary accrual, which represents the remainder, prediction error, calculated as the difference among the current total accruals found in the financial statements and the expected non-discretionary accruals. Dechow et al. (1995) modified the original Jones model by supplementing the year-on-year change in receivables, thus eliminating the error of the discretionary accrual estimate. Guay et al. (1996) criticize both the original and the modified Jones model but does not suggest any other alternatives.
Our study also continues in approaches of detecting of earnings management with application of time series. We consider the new gap to disclose the earnings manipulation of the enterprises through unit root and stationarity analysis, supported by homogeneity analyses. The time series analysis allows us to formulate the following hypotheses:
- HA.There is a unit root for the series of EBIT. There is a significant existence of the earnings management.
- HB.The series of EBIT is not stationary. There is a significant existence of the earnings management.
- HC.The series of EBIT is heterogeneous. There is a significant change in the earnings management.
- HD.The series of EBIT is heterogeneous. There is a year of a significant change in the earnings management.
2. Materials and Methods
The secondary sources are observations of earnings before interest and taxes (EBIT) of the enterprises from the chosen emerging countries (Slovakia and Bulgaria). In the context of historical development, we may add Slovakia to the Soviet-controlled Eastern bloc countries and Bulgaria to the Soviet-controlled Balkans countries. In total, 1347 Slovak enterprises and 1839 Bulgarian enterprises were extracted from the Amadeus database over the period 2010 to 2018 and involved in the analysis. The variable earnings before interests and taxes (EBIT) is selected to eliminate different tax and interest policies of these countries. We require three conditions to be met by the analyzed business units:
- (a)
- The amount of total assets is at least EUR 3,000,000;
- (b)
- The amount of total sales is at least EUR 2,000,000;
- (c)
- The amount of net income is minimally EUR 100,000.
These criteria were used to analyze only the companies with stable financial situation and the same financial and economic background to mitigate the problems of the classification of enterprises by their size or the years of their operation.
Following methodological steps were used:
1. The elimination of missing cases.
The database Amadeus provides a large sample of data, but there are some missing cases involved. If we have a sufficiently large data file, we may afford a simple solution in the form of removing those units from the file that have missing values (Svabova and Michalkova 2018). Thus, these observations are necessary to be found and eliminated.
2. The removal of inconsistent cases.
An outlier in a sample is an observation far away from most or all other observations (Ghosh and Vogt 2012). Different methods and tests are used to determine the existence of outliers in raw samples. Svabova and Michalkova (2018) recommend in pre-processing of data in earnings management to use Dixon or Grubbs test. Both tests provide satisfying results in identification of the outlying values (Garcia 2012). “Masking phenomenon” (several observations are close together, but the group of observations is still outlying from the rest of data (Berti-Équille et al. 2015) could occur in our case that is why the Dixon statistics is chosen. This test is designed to be used in situations where additional outliers may occur to minimize the effect of these outliers arise because of masking (Garcia 2012). An avoiding of additional outliers allows using conventional Dickey–Fuller tests in further analysis and prevents the spurious rejection of Ho of these tests (Leybourne et al. 1998). The test statistic of Dixon is defined as:
where y is an analyzed variable and numbers mean the places in the order.
Nagy (2016) highlights the possibilities after the detection of outliers: do not consider/ignore outliers, exclude outliers or exclude only extreme values (far outliers). We decide to apply the possibility of removal of all inconsistent cases to robust statistics and results insensitive to the outliers which is also supported by the study of Svabova and Durica (2019). They argue that it may be useful to eliminate outlined enterprises from the analyzed group because of the fact that outliers may generate discrepancies of conclusions of statistical tests and procedures. We run test and its p-values are estimated with a Monte Carlo simulation using 1,000,000 replicates.
3. The verification of normal distribution.
Normally distributed sample is a required assumption in the estimation of attributes of the times series (Bai and Ng 2005). There are nearly 40 tests of normality in the statistical literature (Dufour et al. 1998). Bai and Ng (2005) recommend testing the normality of time series of financial data by the Jarque–Bera test. Jarque and Bera (1980) and Bera and Jarque (1981) show their test statistics as follows:
where y is an analyzed variable, means all amount of observations, and mean the approximations of third and fourth central moments, means the average of the sample, is the approximation of the second central moment, the variance. Jarque–Bera is asymptotically χ2 distributed with two degrees of freedom because test statistics of Jarque–Bera test is just the sum of squares of two asymptotically independent standardized normals (Bowman and Shenton 1975).
4. The proof of no serial correlation.
The occurrence of no serial correlation means that the data are independently distributed, and it is a recommended assumption for financial time series after testing normality. The Box–Pierce and Ljung–Box tests are generally run to test the required independence in time series. Box and Pierce (1970) perform the test of the randomness at each distinct lag in their study. Ljung and Box (1978) modify this test to overall randomness. We prefer the robustness of the Box–Pierce Q statistic to test if the analyzed sample of financial data is uncorrelated without assuming statistical independence.
Q is the Box–Pierce test statistic, which is compared with the χ2 distribution; n means all amount of observations; h is the maximum lag we are considering (Box and Pierce 1970).
5. The determination of unit root and disproof of stationarity.
A time series is stationary if its statistical properties do not change in the process of time. A stationary time series means that the mean and variance are constant over time. The white noise is an example of a stationary time series. The determination that a series is not stationary enables to study where the non-stationarity comes from. Stationarity tests may determine whether a series is stationary or not. There are different approaches on how to test stationarity (unit root or stationarity tests). Unit root tests, as the Dickey–Fuller test and its augmented version, for which H0 is that the series possesses a unit root and thus is not stationary. On the other hand, there are stationarity tests as the parametric Kwiatkowski–Phillips–Schmidt–Shin test or nonparametric Phillips–Perron test, for which H0 is that the series is stationary. Standard Dickey–Fuller tests can have very low power and can lead to a very serious problem of spurious rejection of the unit root H0 (Leybourne et al. 1998) and thus we support the tests by Kwiatkowski–Phillips–Schmidt–Shin test. Dickey and Fuller (1979) show three different equations to test the occurrence of unit root:
where is first order linear differential of equation, is unit root, is white noise. The difference between these deterministic elements is and . Under the null hypothesis, Equation (6) represents a pure model of random walk, Equation (7) adds the intercept , and Equation (8) contains both the as well as linear time trend . Hacker and Hatemi-J (2010) argue that it is difficult to choose from the three Dickey–Fuller equations for unit root testing. According to Elder and Kennedy (2001), if the trend is mistakenly included, the strength of the test drops. On the contrary, if the trend is not included, there is only one way to capture the trend—to use the intercept to detect the trend. All three tests are computed to compare their results and strength in our analysis.
The Kwiatkowski–Phillips–Schmidt–Shin test verifies if a time series is stationary around a mean or linear trend or is non-stationary due to a unit root (Kwiatowski et al. 1992). Time series is divided into the sum of the random walk , deterministic trend , and stationary errors :
where is random walk:
where are independent and identically distributed random variables .
It is used statistics for testing:
where
and is the estimate of long-term variance :
6. The determination of heterogeneity.
Homogeneity tests allow detecting if time series may be considered as homogeneous during the analyzed time period, or if there is any date at which significant change in a mean of data occurred. Kanovsky (2018) and Agha et al. (2017) recommend selecting from von Neumann test, standard normal homogeneity test, Buishand tests, and Pettitt’s test. We apply the von Neumann test to detect the existence of significant changepoint in the earnings management and parametric standard normal homogeneity test to determine a year when a significant change occurs. Von Neumann’s test is a test using the ratio of mean square successive (year to year) difference to the variance (Von Neumann 1941). The test statistic is shown as follows:
The null hypothesis is that the data are dependent. If the value of N is equal to 2, it means that the sample is homogeneous while the values of N less than 2 indicate that the sample has a breakpoint (Buishand 1982). This test gives no information about the break point.
The standard normal homogeneity test is a method created by Alexandersson (1986) and assumes if a times series is normally distributed (Kang and Yusof 2012). Then the following model with a single change can be proposed according to Pohlert (2016) as:
ε ≈ N (0, σ). The null hypothesis is tested against the alternative hypothesis . The test statistic is:
where
The critical value is:
The p-value is estimated by a Monte Carlo simulation using m replicates. We run test and its p-values are estimated with a Monte Carlo simulation using 1,000,000 replicates.
3. Results
This part consists of pre-processing data, testing of assumptions and processing results.
3.1. Pre-Processing of Data
The samples were very wide but consisted of significant amount of missing values. These values of EBIT were found and eliminated from the Slovak sample of enterprises as well as the Bulgarian one. Table 1 involves the number of missing values.
The detection of inconsistent data (outliers) follows the identification of missing values. Dixon test is used in the analysis. Testing is run for every observation for each year from the analyzed nine-year period. The outlying cases are detected for every year. The enterprise is removed from the analysis for all periods if only one value is detected as an outlier. The Dixon test is created for small sample despite this fact we use it for its robustness. The p-value was computed using 1,000,000 Monte Carlo simulations. The existence of minimal one outlying value of EBIT for Slovak and Bulgarian samples in every analyzed year is confirmed based on p-value computed in Table 2, which portrays the amount of outlying cases of enterprises for both sides and the final sample as well.
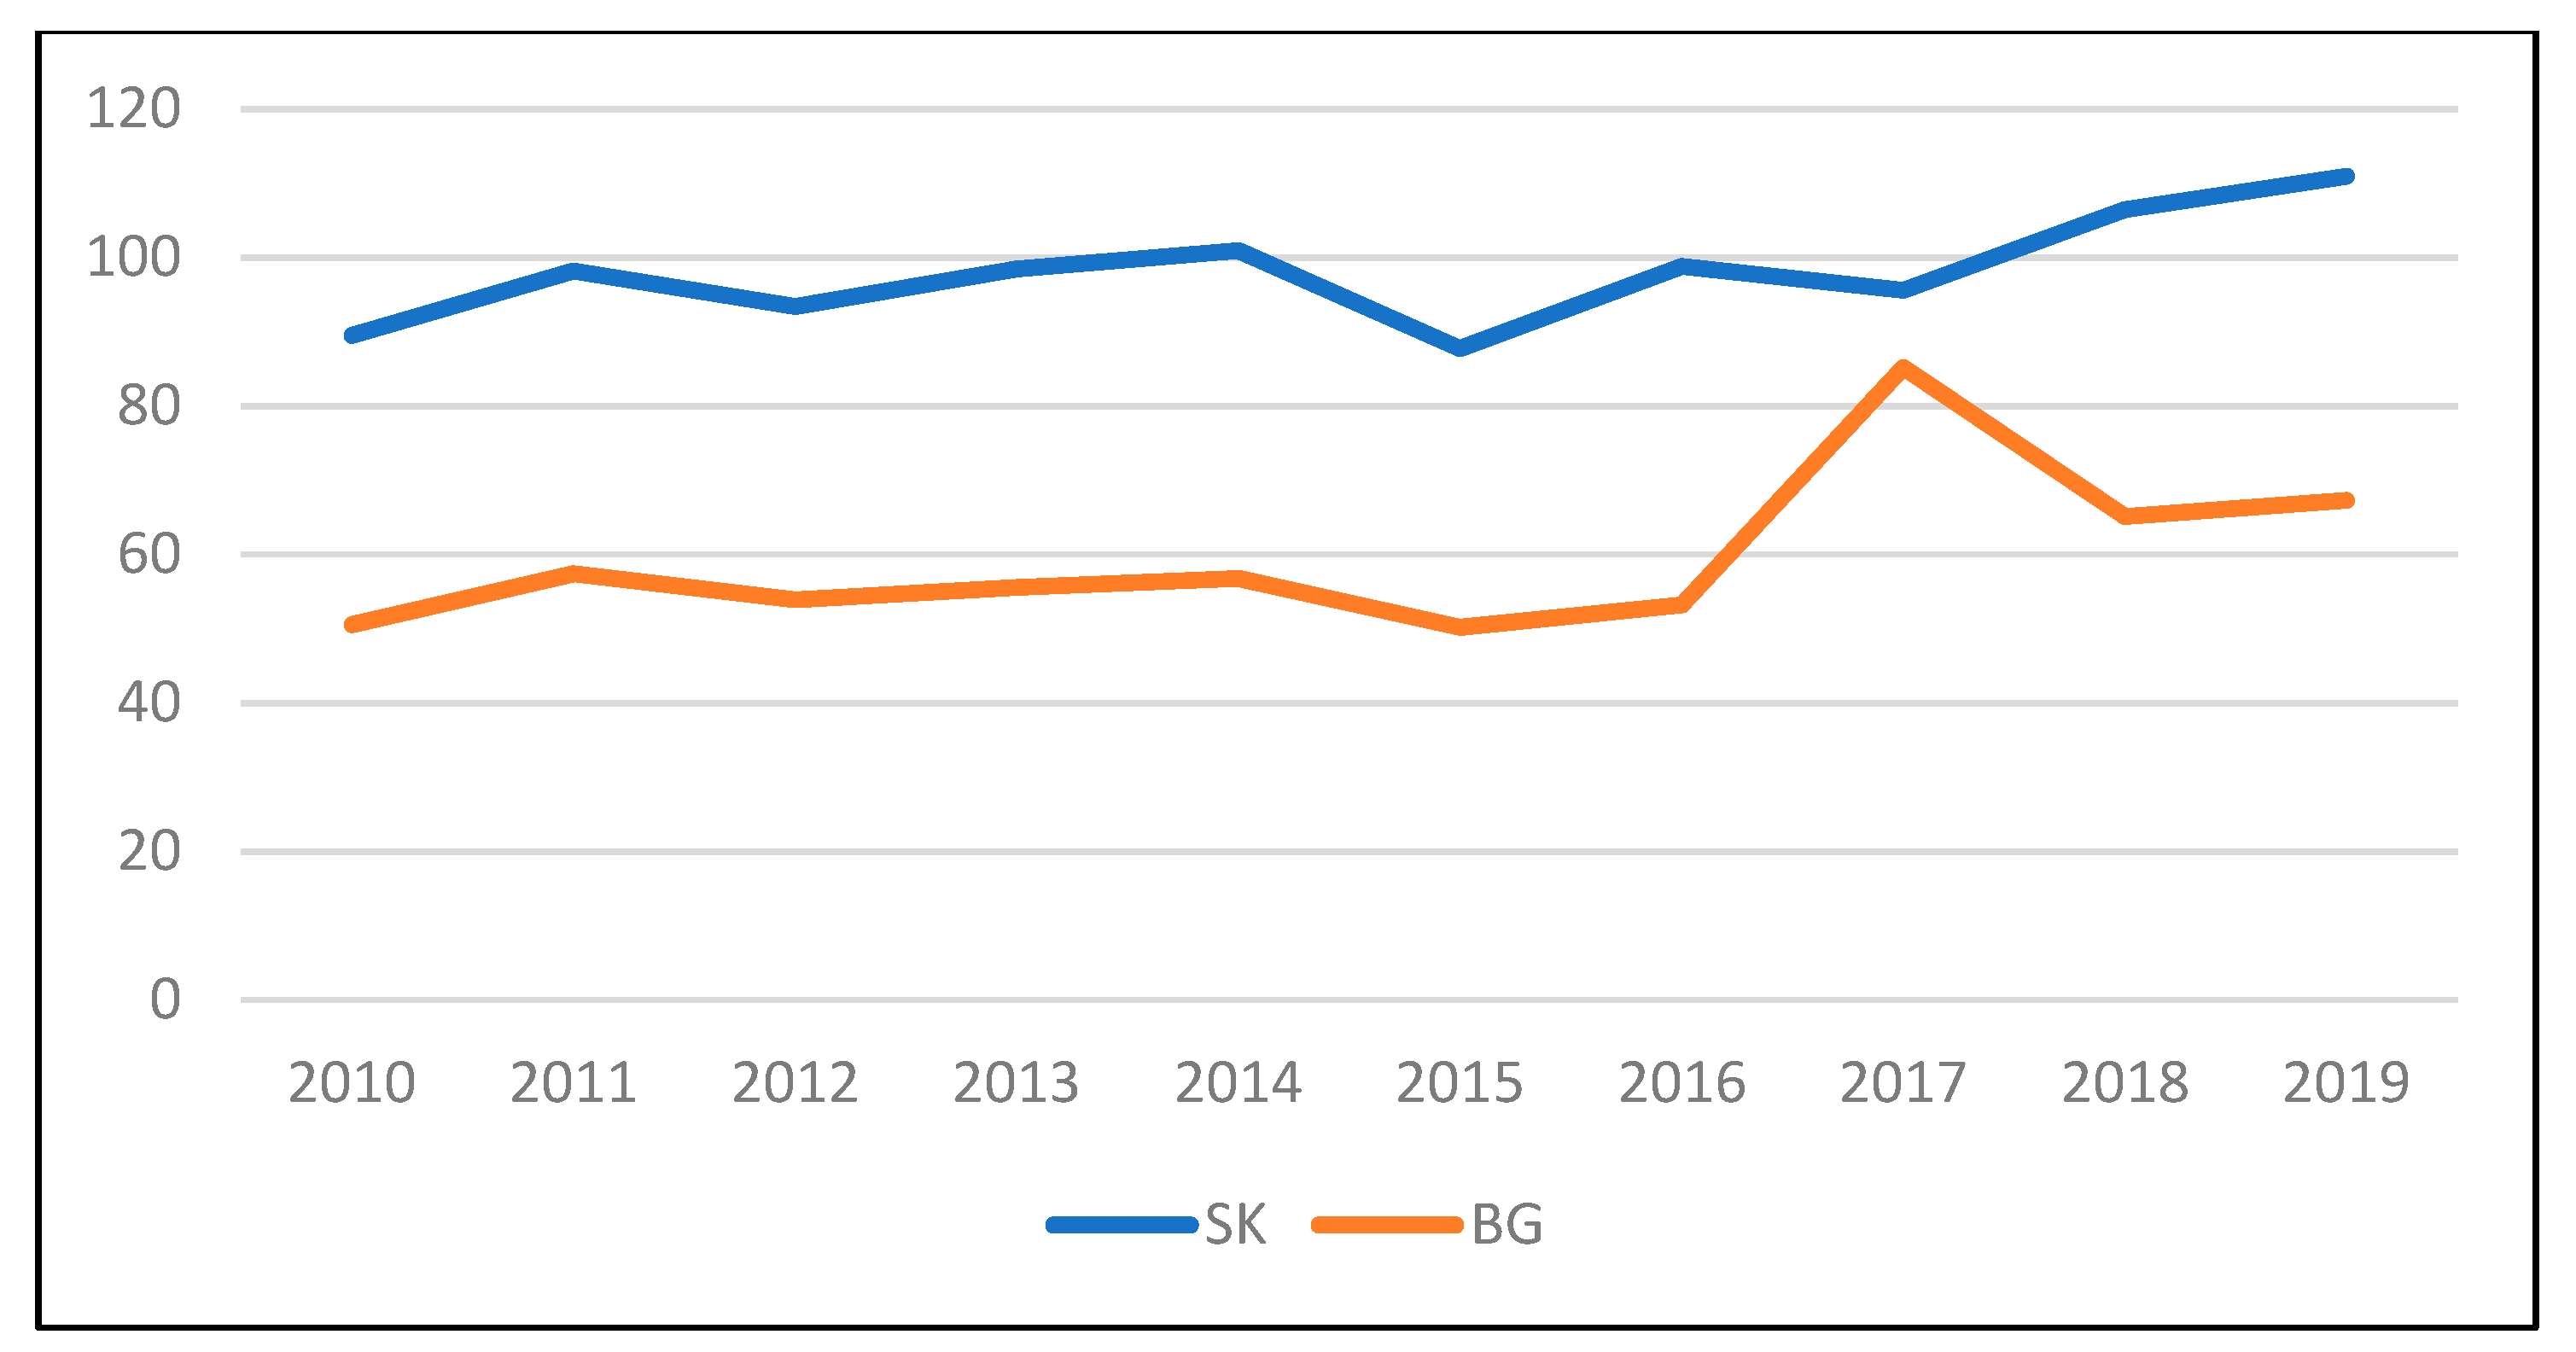
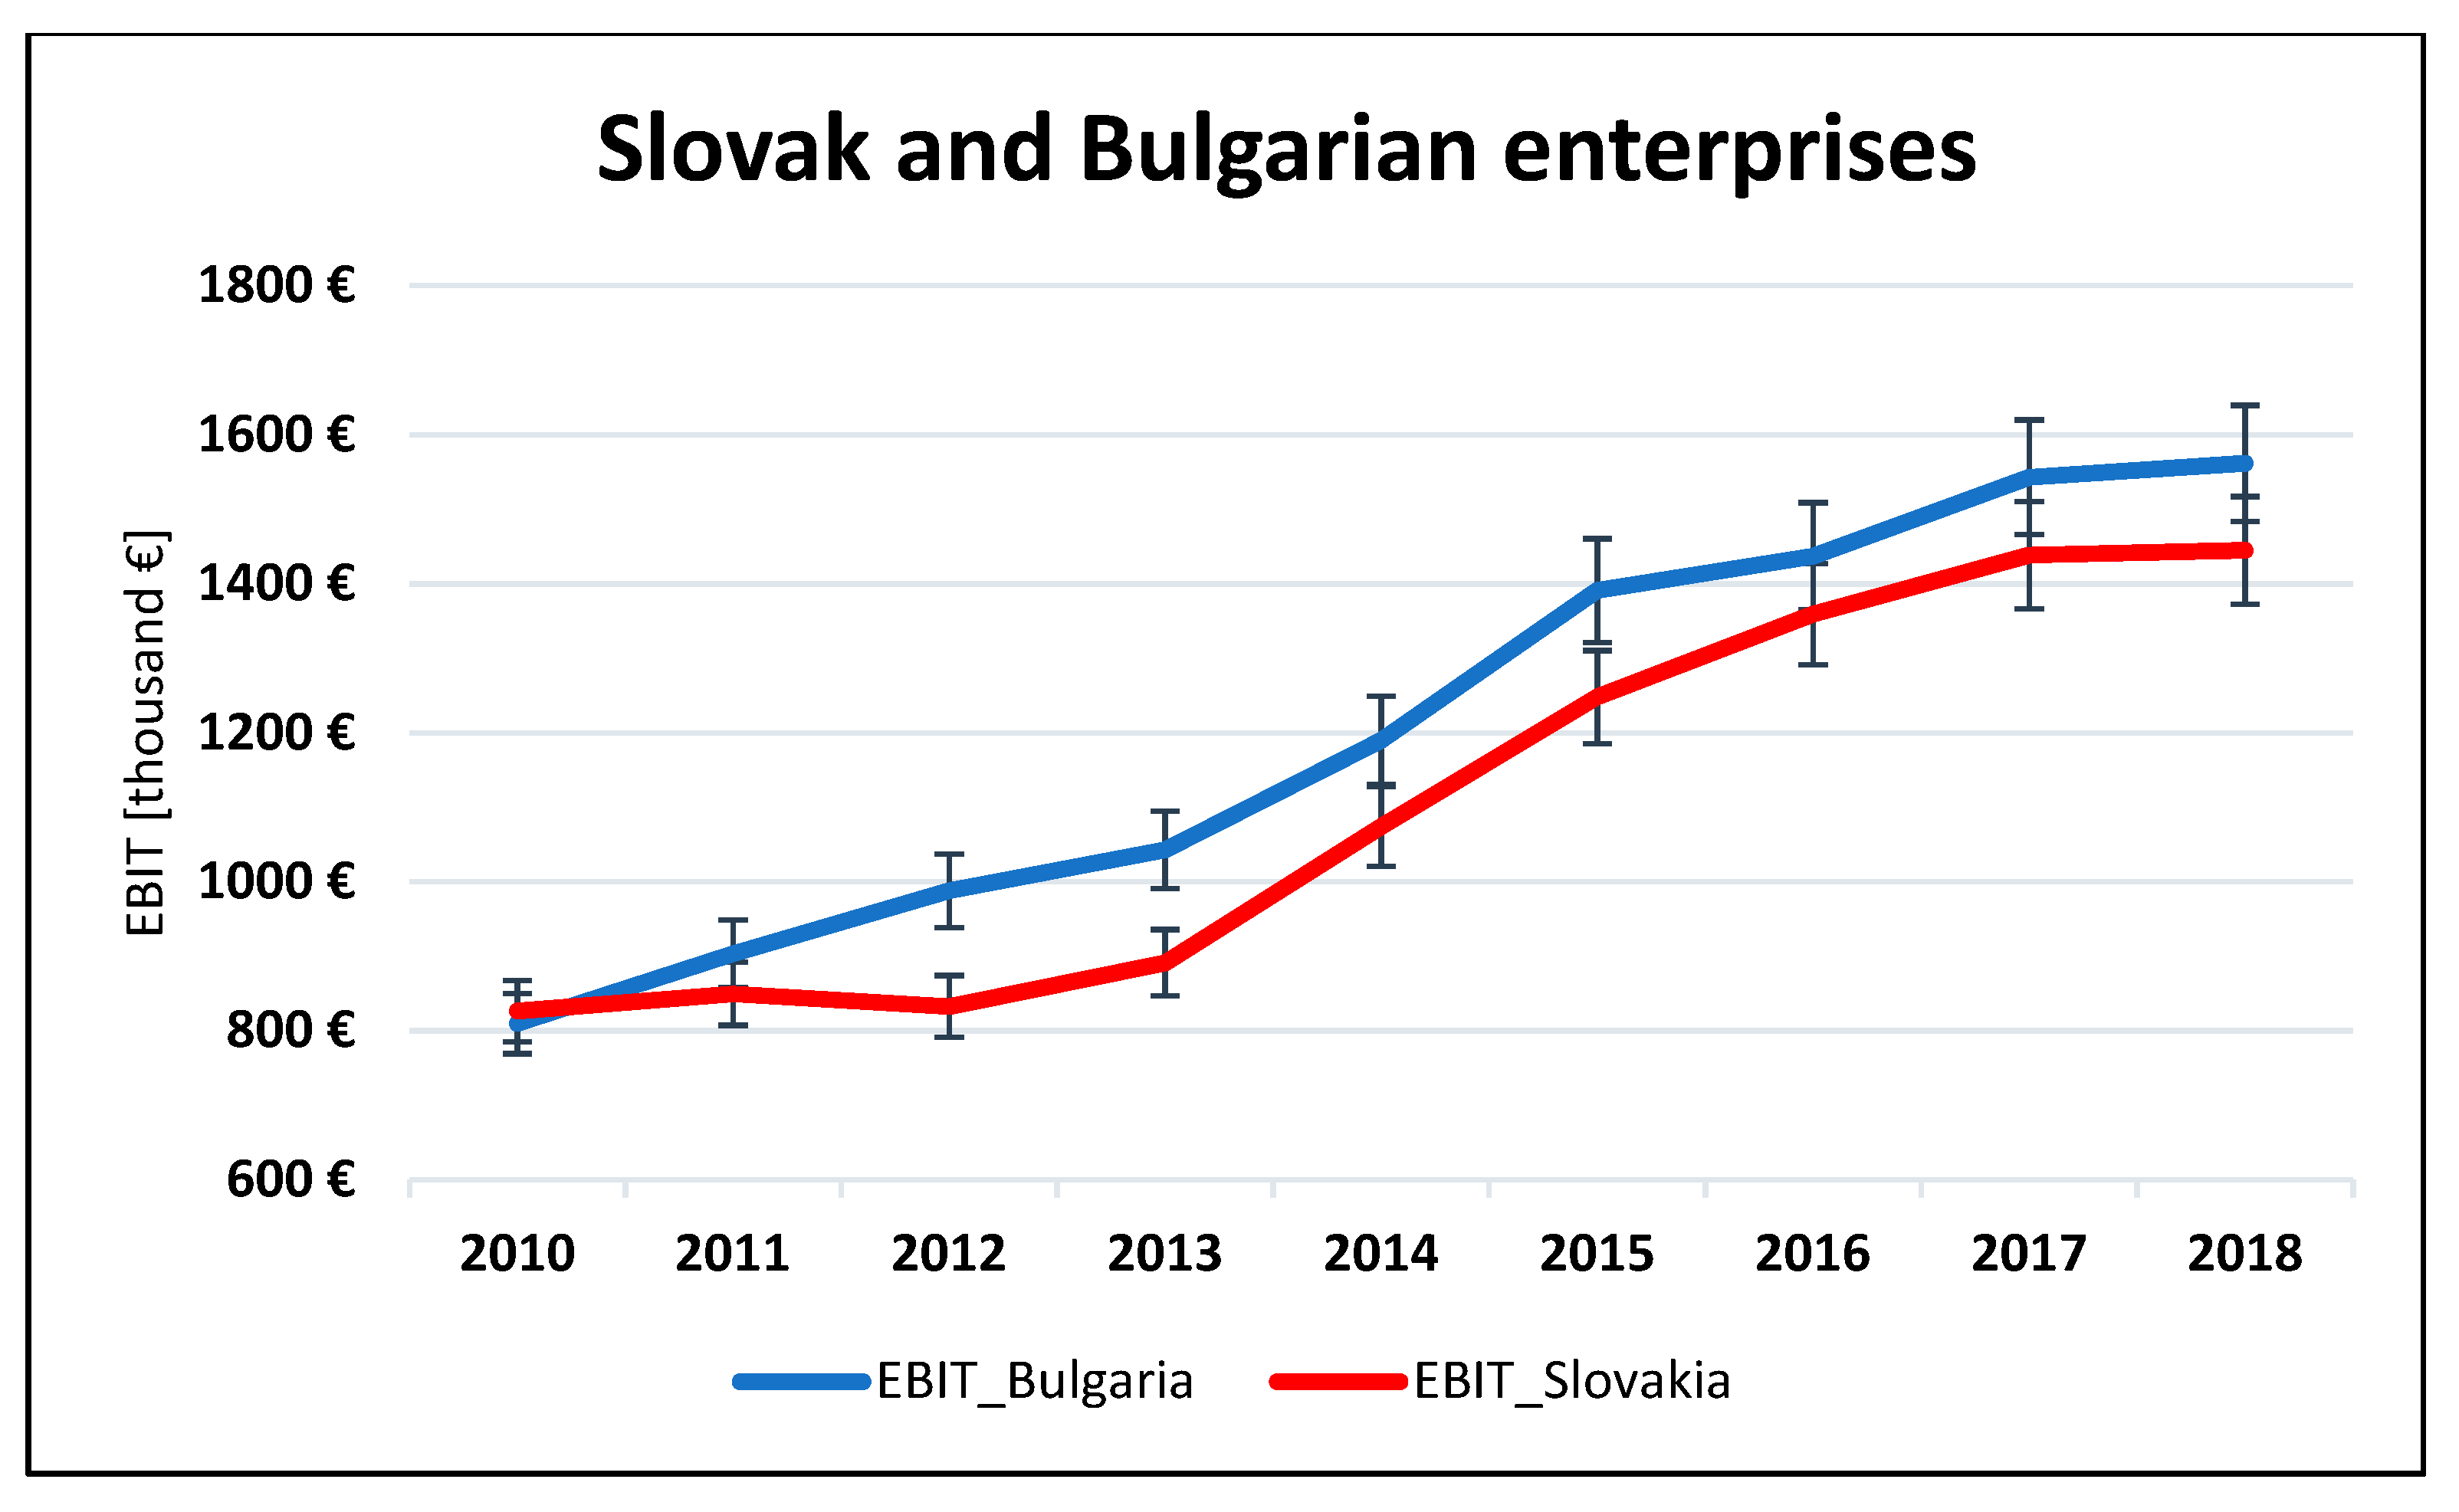
Based on annual values of EBIT of 1089 Slovak enterprises and 1421 Bulgarian enterprises, annual average EBIT is calculated for the analyzed period from 2010 to 2019 (Table 3). The development of both countries in time is very similar, which is shown in Figure 2. The similarities of the development of EBIT is also supported by 5% error bars (calculated based on standard deviation) which show almost identical coverage of EBIT development in seven years from the nine-year analyzed period.
3.2. Testing of Assumptions
It is necessary to prove the assumption concerned with the normality (Jarque–Bera test) on the one hand and on the other hand to prove the assumption of serial correlation (Box–Pierce test). These tests are run for the series of EBIT of enterprises before testing any significant occurrence of earnings management or occurrence of the significant year of the change in the earnings management in Slovak or Bulgarian enterprises.
As the computed p-value is greater than the significance level alpha, one cannot reject the null hypothesis H0 in Slovak case as well as in Bulgarian case, based on Table 4. It is not rejected based on Jarque–Bera test that the sample of EBIT of extracted Slovak and Bulgarian enterprises follows a normal distribution. The test of the randomness of the sampling process is running after proving the normality.
As the computed p-value is greater than the significance level alpha, one cannot reject the null hypothesis H0, based on Table 5. It is not rejected based on Box–Pierce test that the data of EBIT of Slovak enterprises, as well as Bulgarian enterprises, exhibit no serial correlation.
3.3. Processing of Results
After proving normality and confirmation of no serial correlation significant, the occurrence of earnings management and significant year of the change in the earnings management in Slovak or Bulgarian enterprises are testing. These investigations are realized by stationarity tests and homogeneity tests.
Firstly, Dickey–Fuller test of unit root for No intercept, Intercept, and lastly Intercept + Trend is used. Null hypothesis indicates that the series possesses a unit root and hence it is not stationary. It means, statistical properties of EBIT of Slovak and Bulgarian enterprises vary with time. The earnings management exists, the managerial activities are not random, but the managers of the enterprises purposefully manipulate earnings within the legal barriers.
- H1A.There is no unit root for the series of EBIT. There is no significant existence of the earnings management.
As the computed p-value is greater than the significance level alpha, one cannot reject the null hypothesis H0A, based on Table 6. It is not rejected following the Dickey–Fuller test of unit root for No intercept, Intercept, and Intercept + Trend, that there is a unit root for the series of EBIT. There is significant existence of the earnings management of Slovak and Bulgarian enterprises.
Secondly, the result of the Dickey–Fuller test of unit root is recommended to be supported by the Kwiatkowski–Phillips–Schmidt–Shin test of stationarity for Level and Trend. The null hypothesis is, on the contrary to Dickey–Fuller test, that the verification of series of EBIT is stationary.
- H1B.The series of EBIT is not stationary. There is significant existence of the earnings management.
As the computed p-value is lower than the significance level alpha, one should reject the null hypothesis H0B, and accept the alternative hypothesis H1B, based on Table 7. It is rejected following the KPSS test of stationarity for Level and Trend that the series of EBIT is stationary. These results confirm the conclusions of previous tests of no stationarity in managerial activities but significant managing earnings in Slovak and Bulgarian enterprises.
Thirdly the existence of a significant change in the earnings management is detected. After the identification of significant occurrence of earnings management in both countries, it is required to determine if the mean of the development is homogenous all the time or if the heterogeneity exists (significant change of mean). Von Neumann’s test is run to detect the homogeneity of the series of EBIT.
- H1C.The series of EBIT is heterogeneous. There is a significant change in the earnings management.
The p-value of von Neumann’s test was computed using 1,000,000 Monte Carlo simulations. As the computed p-value is lower than the significance level alpha, one should reject the null hypothesis H0C, and accept the alternative hypothesis H1C, based on Table 8. It is rejected following the von Neumann test of homogeneities of EBIT. Thus, there is a significant change in the earnings management of Slovak and Bulgarian enterprises.
4. Discussion
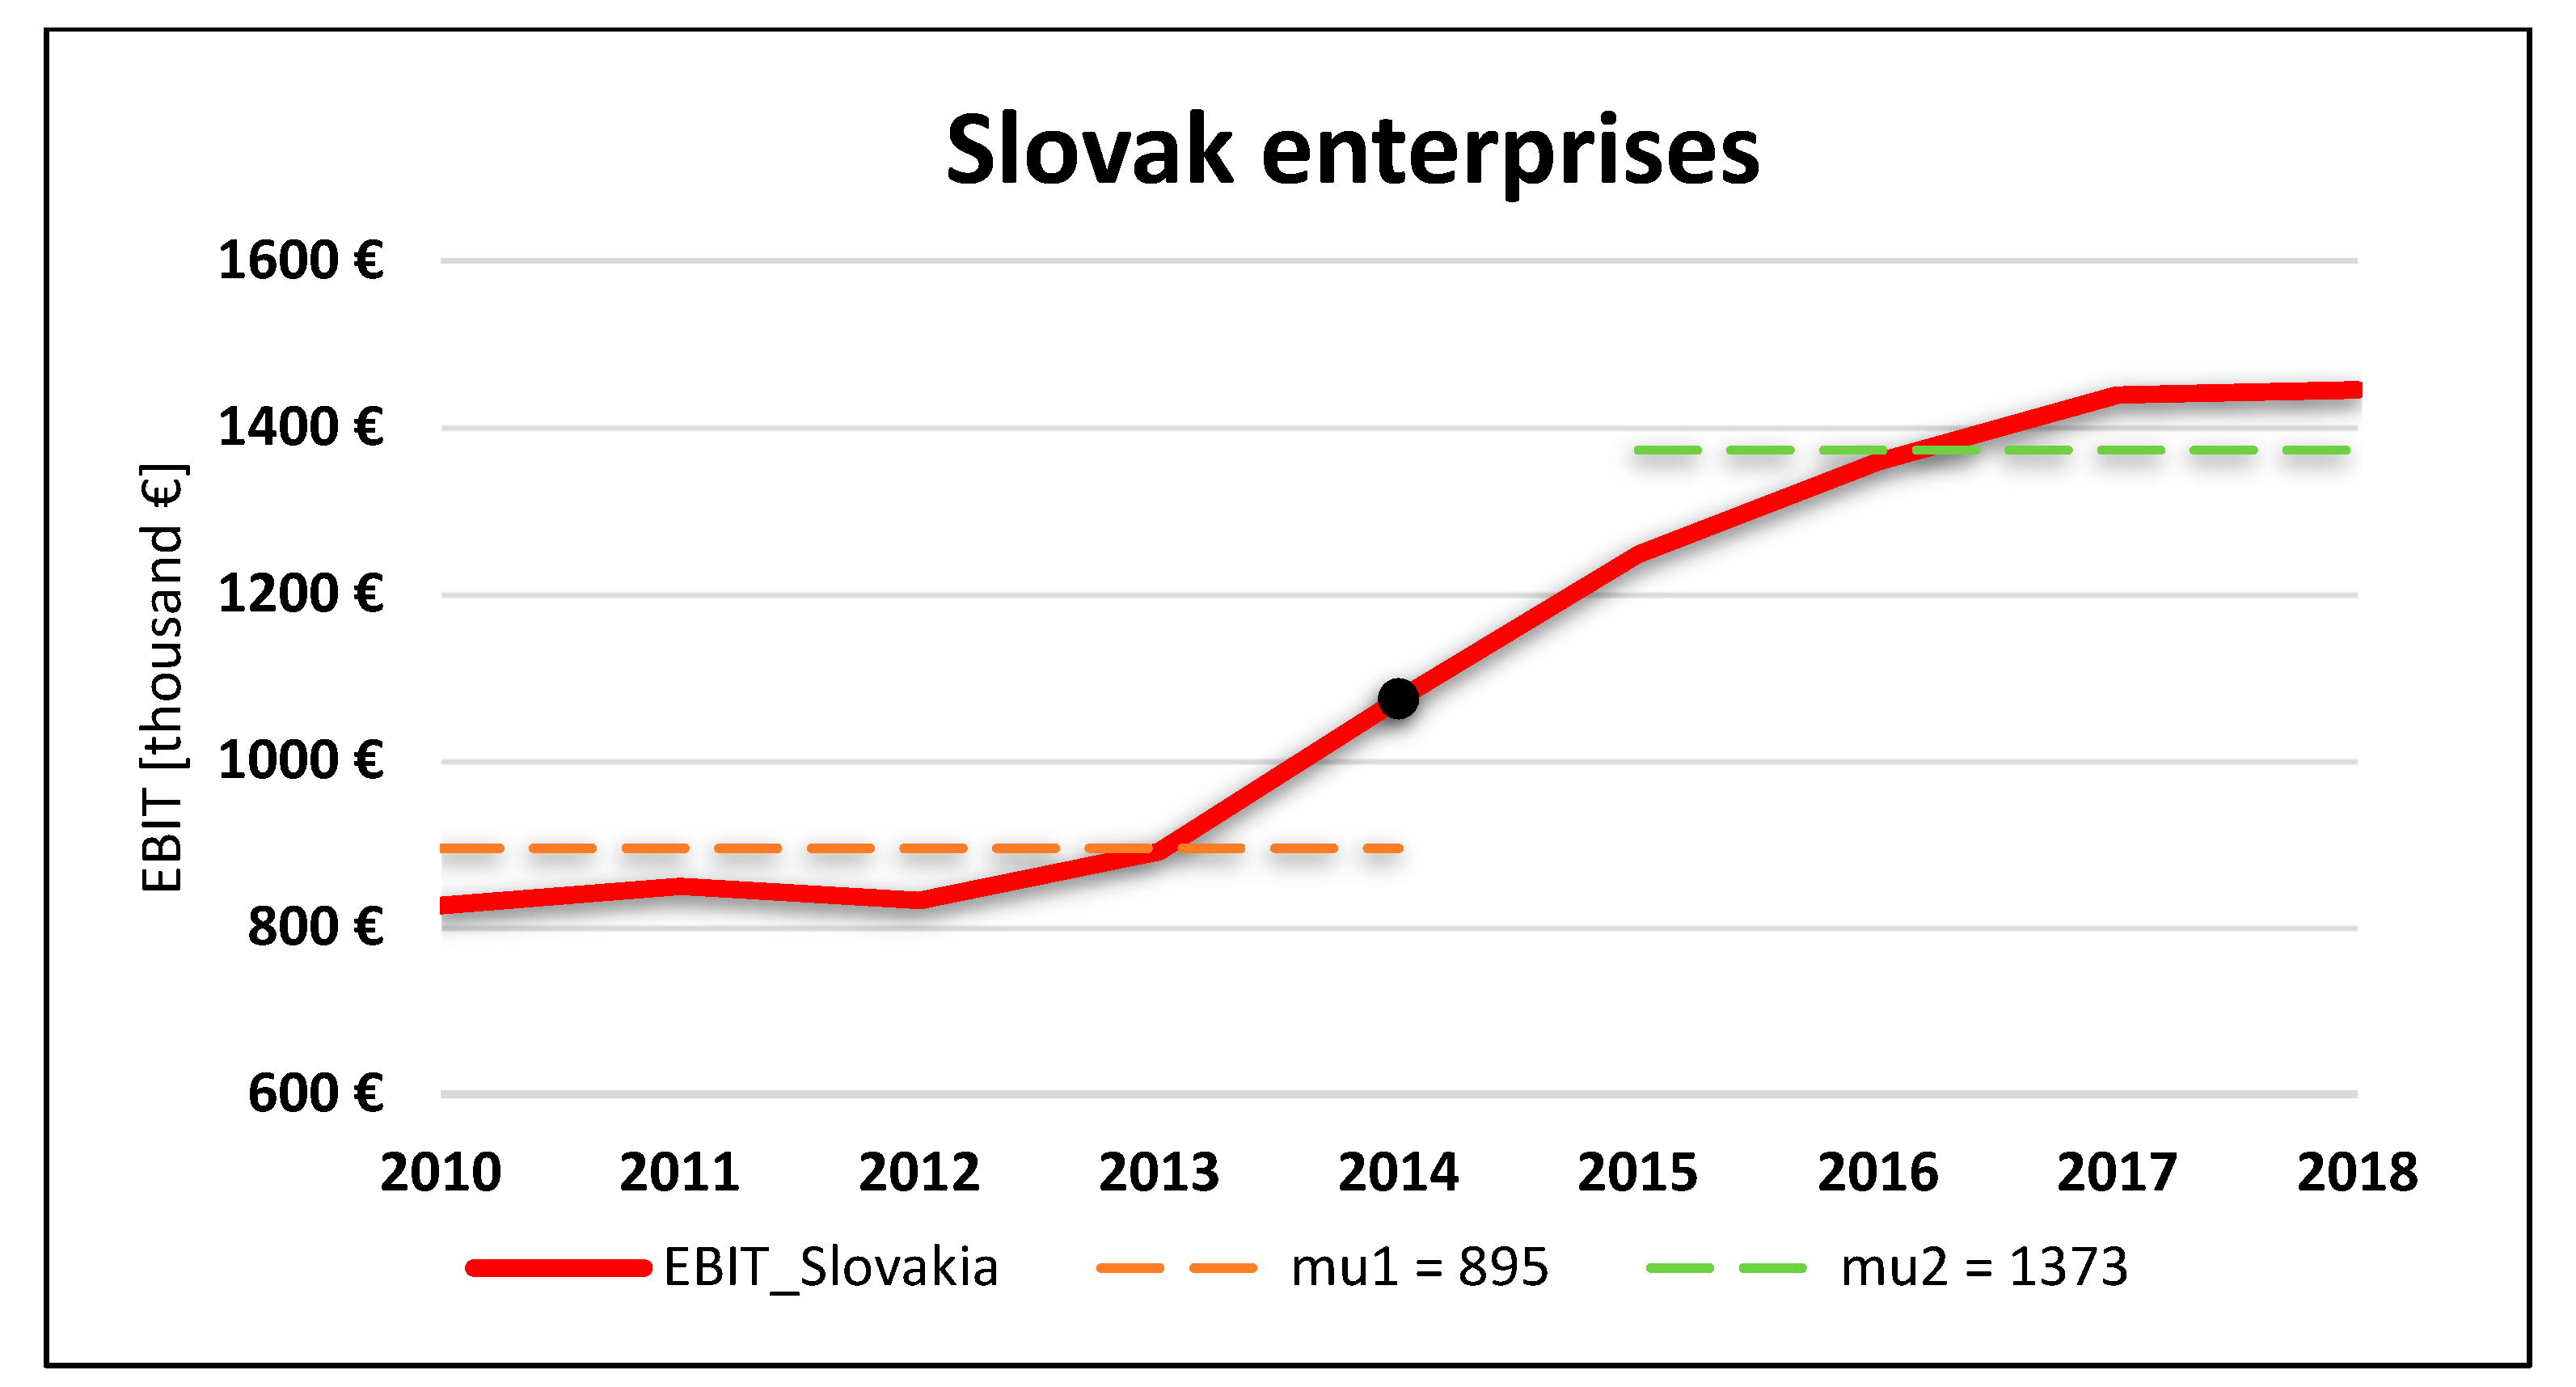
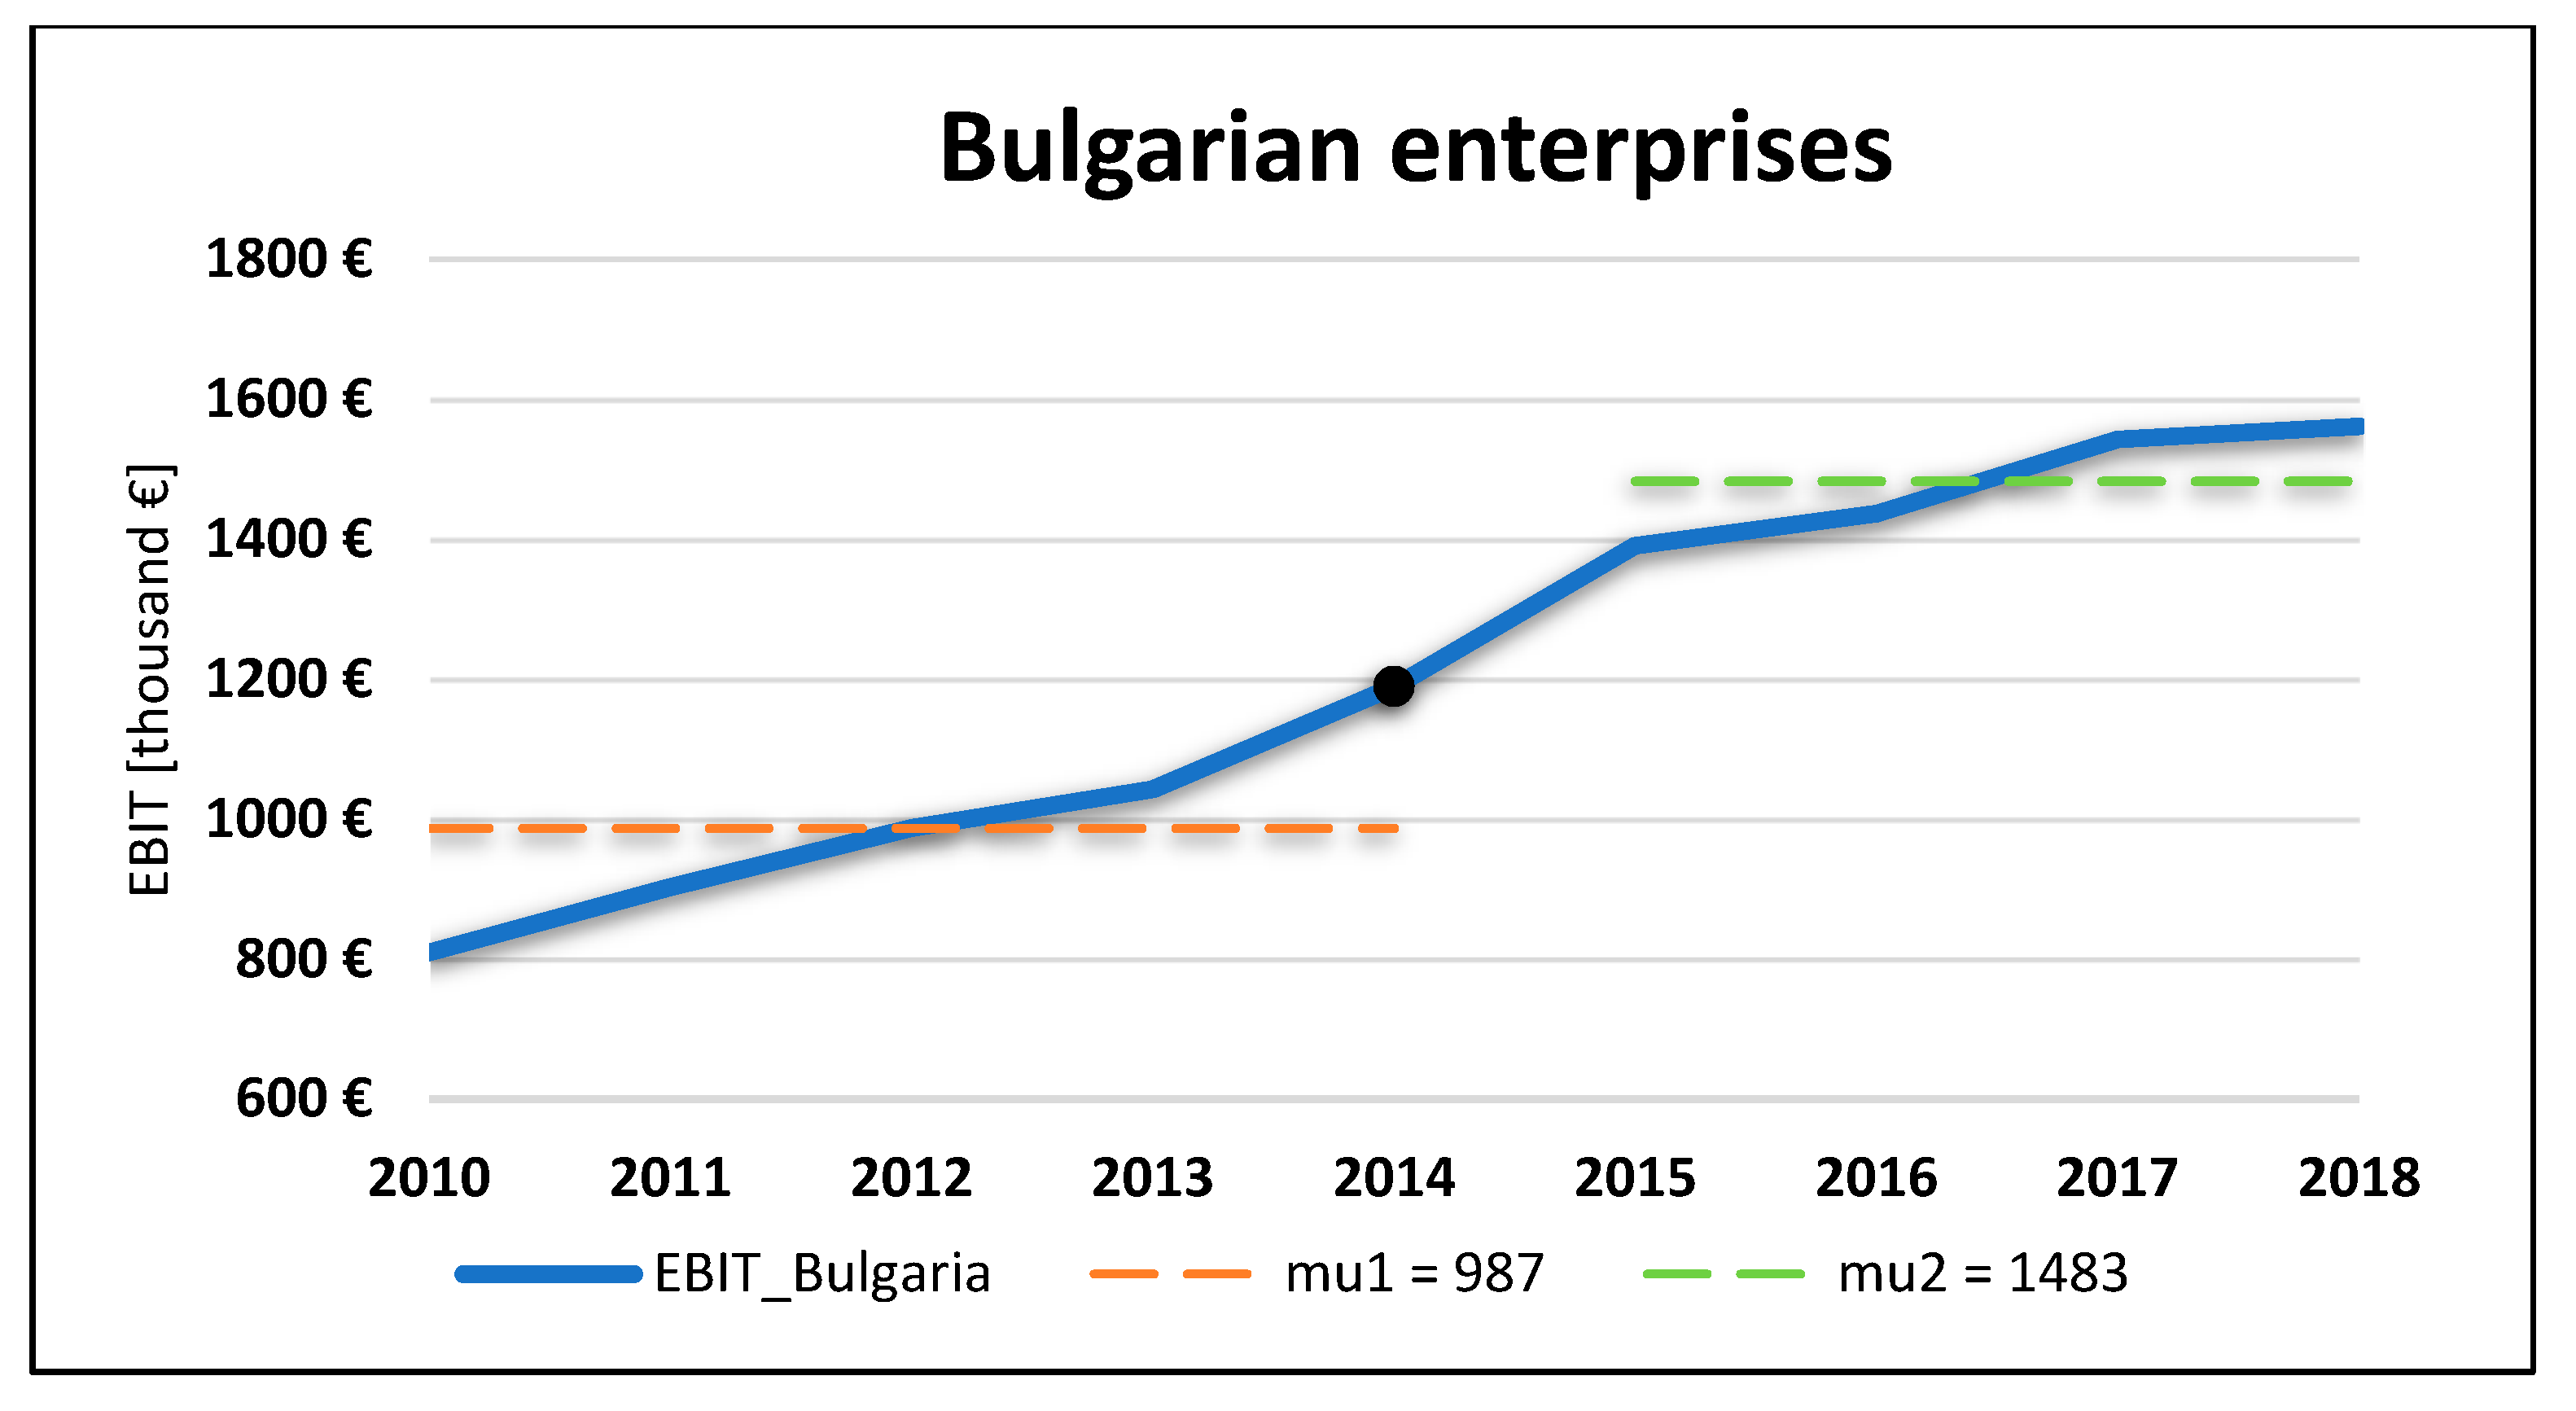
Von Neumann’s test indicates heterogeneity in the series of EBIT, but not a year of the significant change. This situation may mark the occurrence of the year that divides the development of EBIT of Slovak and Bulgarian enterprises into two homogenous groups. These groups are differentiated by the year of the change, they do not have only one mean of the development, but each has own central mean line of the development. The standard normal homogeneity test is run to detect a year of a significant change in the earnings management and the values of both central mean lines of development labelled mu.
- H1D.The series of EBIT is heterogeneous. There is a year of a significant change in the earnings management.
The p-value of SNHT was computed using 1,000,000 Monte Carlo simulations. As the computed p-value is lower than the significance level alpha, one should reject the null hypothesis H0D, and accept the alternative hypothesis H1D, based on Table 9. It is rejected following the SNHT that no year of a significant change of EBIT does exist. Table 9 and Figure 3 and Figure 4 involve indicated year as well as indicated central mean lines of development. The year 2014 is the year of significant change in the earnings management of Slovak and Bulgarian enterprises. This year divides the development of EBIT and determines the individual central line. The difference between calculated central lines of EBIT of Bulgarian and Slovak enterprises is not very noticeable. It is EUR 92,000 until 2014 and EUR 110,000 since 2014. The finding also confirms some parallel of these emerging economies.
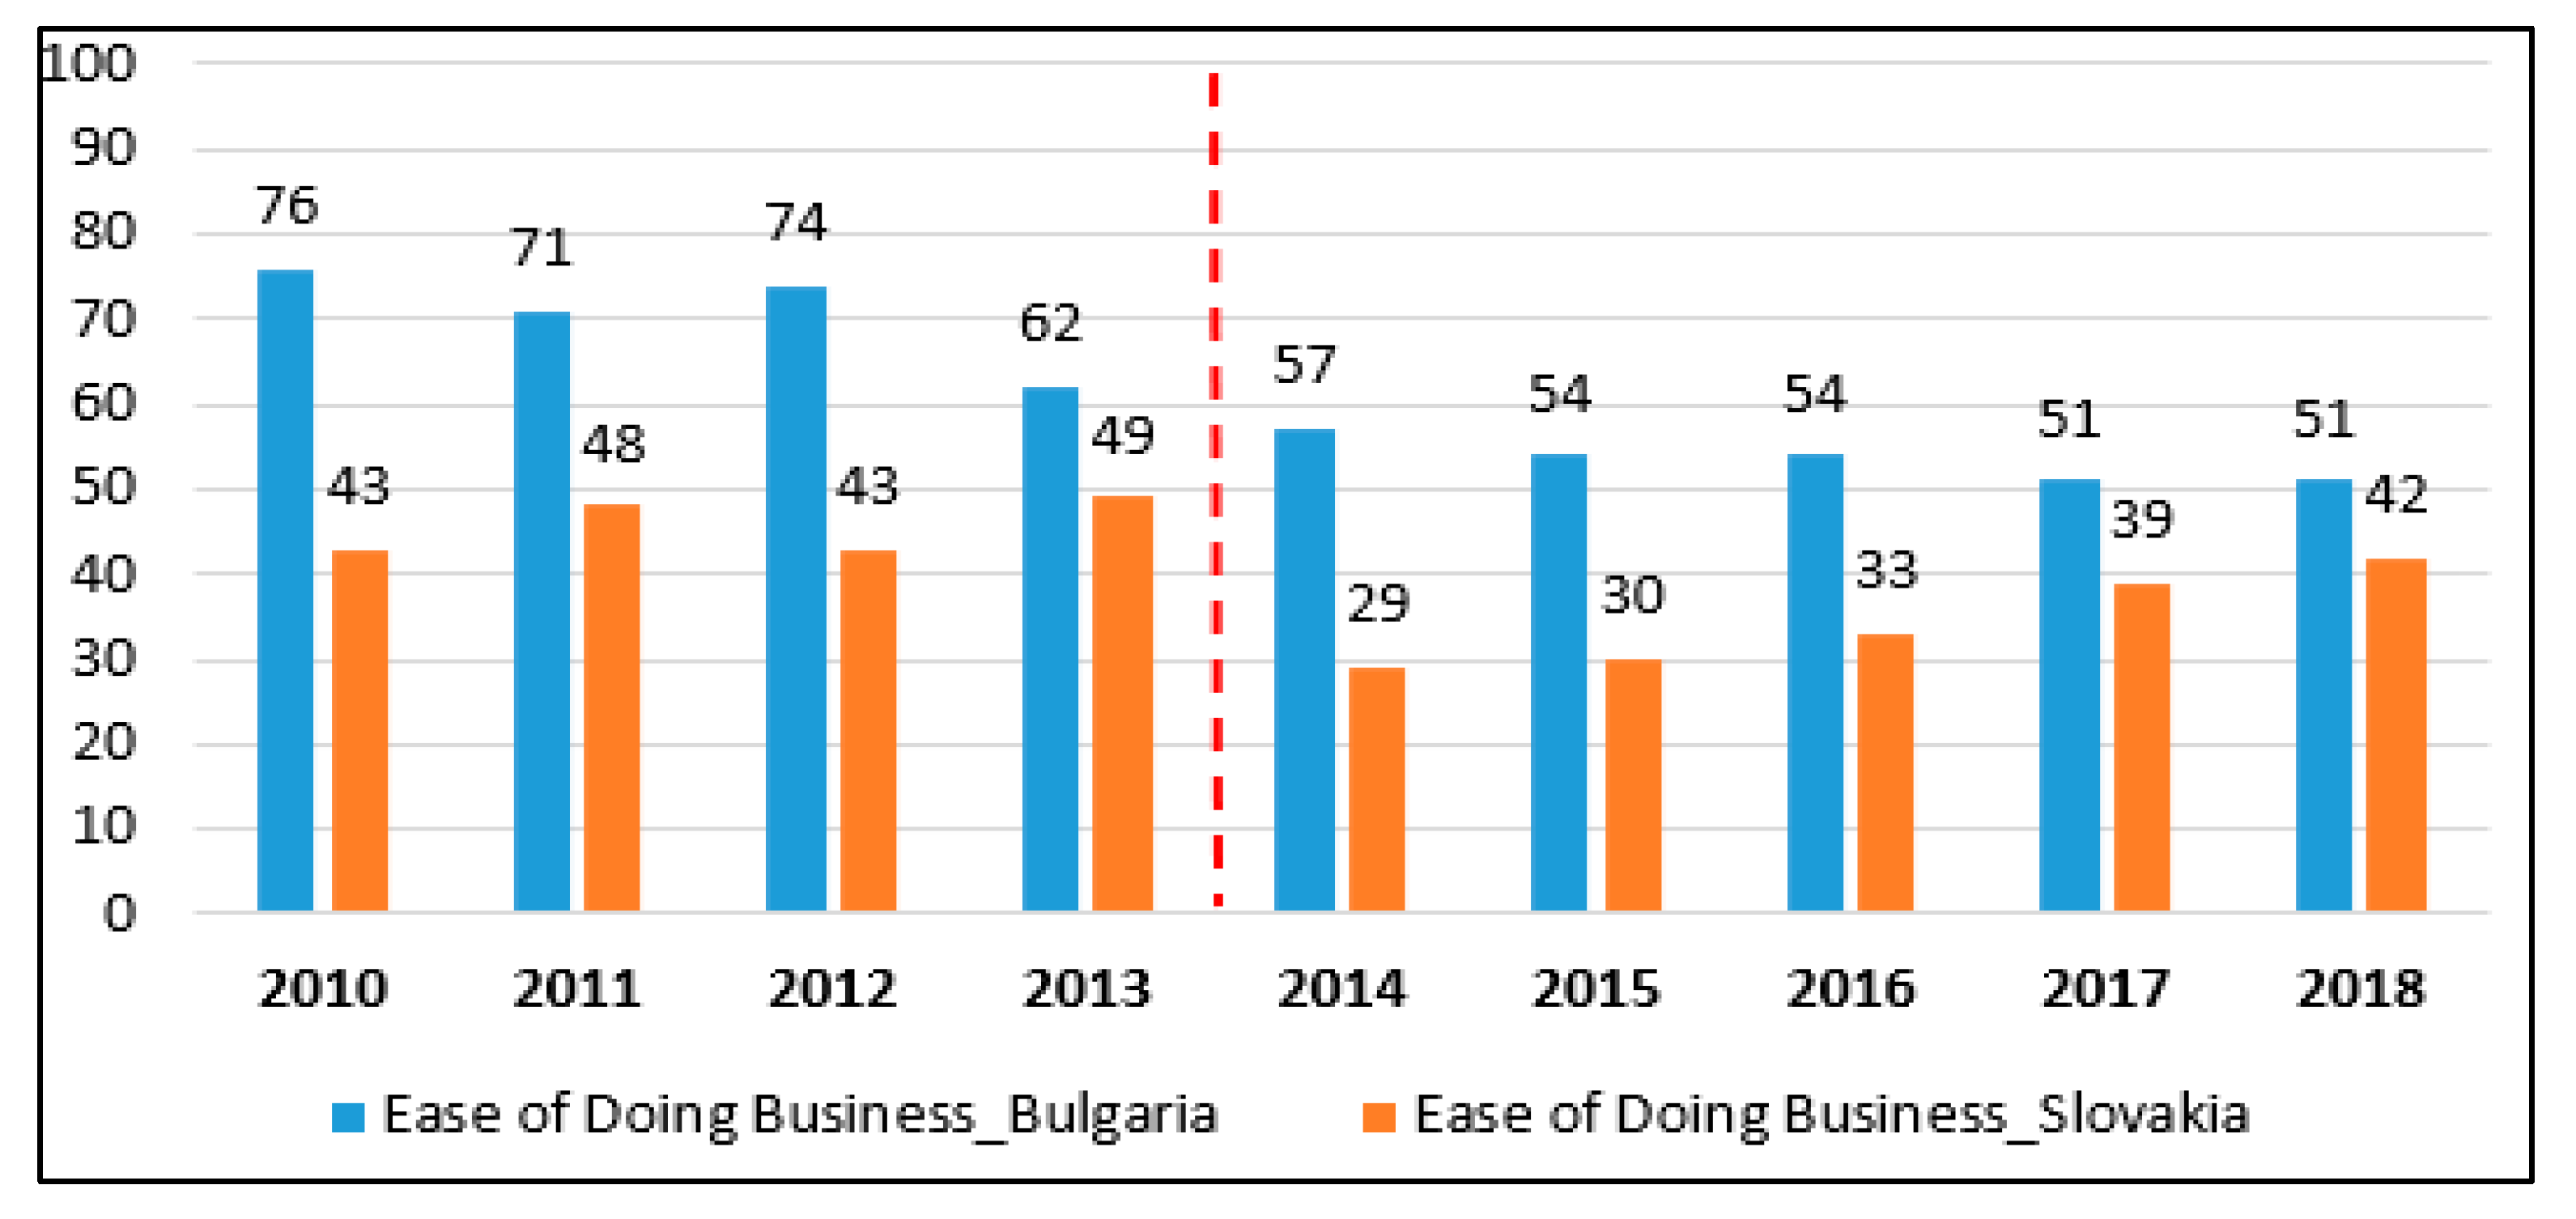
Our findings concerned with the significance of the year 2014 for Slovak and Bulgarian enterprises are supported by Figure 5. It shows the rank of ease of doing business in Slovakia and Bulgaria. The lowest value of this index, the better for business. This year also divides the development of ease of doing business as in the case of earnings management into two periods with very homogenous development within own group but very heterogeneous comparing the groups. The year 2014 saw a breaking point in the improvement of business conditions in both countries. These results of assessment of the business environment were expertly evaluated by global monitoring of the entrepreneurship (Madgerova et al. 2019).
The positive macroeconomic environment influences earnings manipulation of Slovak and Bulgarian enterprises and implicates significant change (heterogeneity) in the earnings management. Despite the ease of doing business rank, the positive macroeconomic environment in 2014 was represented by the annual growth rate of GDP, since this year it has been above zero and the annual growth rate has had rapid upward tendency (Figure 6). This year was the milestone also in decreasing of the long-term unemployment rank in both countries (Figure 7). Last but not least, Standard & Poor’s set positive outlook related to the credit rating for Slovakia and stable outlook for Bulgaria in the year 2014 (Trading Economics 2020) as well as the cohesion policy has changed new development environment within the European Union after the year 2014, based on the new programming period (Marin and Dimitrov 2018).
Our results are discussed with the last studies and investigations from emerging markets. Cugova et al. (2019) analyze various forms of earnings and the subsequent analysis of the profitability indicators of the engineering companies operating in the Slovak Republic. They analyze the period of 2012–2017. Both profits and profitability indicators show an increasing tendency, and in the last few years, they achieved impressive results. The performed analyses are only an elementary basis for earnings management. Orazalin (2019) focuses on earnings management activities of enterprises from Kazakhstan. This study indicates that enterprises with larger boards adopt a more restrained concept to earnings management manipulation. However, the conclusions deliver not significant proof of the connection among board independence and earnings quality. The study of Orazalin and Akhmetzhanov (2019) an identify the force of earnings management and audit quality on the cost of debt in Kazakh enterprises. The result portrays that earnings management is negatively depended on the cost of debt. Their conclusions highlight higher audit quality means to a lower cost of debt and confirm no significant influence of audit quality on earnings management. Valaskova et al. (2019) evaluate the robustness of selected models in automotive of Slovakia. They analyze Jones’ model and the modified Jones model, and find that the original Jones model is the most appropriate in identifying the earnings management in that environment. Pavlovic et al. (2019) investigate if the board of directors’ age impact earnings management practices. The sample consists of all Serbian agriculture enterprises from Belgrade Stock Exchange for the interval of years 2013 to 2016. To detect the earnings management the modified Jones Model is used, which is shown as the most appropriate. The results indicate that there is no impact of board of directors’ age on earnings management practices. They also find no evidence of the impact of the chairman’s age on earnings management practices. Relationship between gender diversity and earning management practices has not been found. Pavlovic et al. (2018) suggest that there is an insignificant negative linear relationship between the number of women in the board and earnings management. These findings are supported by the studies which indicate that the reasons for earnings management should be found in different factors, like cultural and political factors or religious attitude or age of the members of the boards but not on the gender differences. Piosik and Genge (2019), analyze enterprises from the Warsaw Stock Exchange in Poland and detect the negative dependency among total upward real earnings management and managerial ownership. Their study argues that specific tools of real earnings management are connected to the ownership assembly and managerial ownership in individual cases. Sosnowski and Wawryszuk-Misztal (2019) also used a sample from the Warsaw Stock Exchange and they reveal that some attributes of the supervisory board raise the effectivity of forward-focusing financial data connecting the initial public offering (IPO) prospectus, as some of boards attributes have the impact on the assessment of the earnings approximation credibility at the realizing of the IPO. Sosnowski (2018) confirms no proof of the existence of private equity fund between the shareholders of the enterprise in the time of preceding first listing of stocks on a market constrains the applying of earnings management prior to the IPO. He does not reject that any significant discrepancy exists between the discretionary accruals in private equity backed and matched enterprises, when controlling for the market value and book-to-market ratio. Lizinska and Czapiewski (2018) disclose positive and significant discretionary accruals in the IPO year that can be considered as an indication of weak earning quality. They depict that analyzed accruals are indirectly depended on the subsequent long-term market value for IPOs realized before the global recession. Istrate (2019) confirms the increased rounding of earnings in a limited amount of units, even if the amplitude of identified gaps is really significant. The development of the accounting regulation tends to the state when it has begun preferring decreased modifications. The International Financial Reporting Standards (IFRS) transition does not tend to a limitation of the gap among the real occurrence and the normal one. This study finds out that smaller enterprises modify the net income not so significantly upward than the larger enterprises. Turlea et al. (2019) provide results from Romania concerned to the impact of granted by the auditor when the value of discretional accruals is encountered and approximate the impact on the mandatory implementation of IFRS. They estimate the value of discretional accruals by the value of residuals from two equations as regression models that calculate and detect the value of total accruals. The paper of Stoyan and Todorov (2019) examines the long-run and short-run tax buoyancies. They empirically test the impact of the buoyancy on income, profit, and consumption increases in Bulgaria.
5. Conclusions
The effective business finance is a key core of the success of all enterprises to be profitable in short as well as long-term period. The globally used phenomenon of earnings management allows a legal opportunity for the enterprises to make a purpose-built decision in the profit policy. Earnings management is widely realized in developed countries and the occurrence is comprehensively mapped. However, the aim of this paper was to detect the existence of earnings management in emerging countries by the times series analysis. Our results confirm that also managers of Slovak and Bulgarian enterprises are not static but significantly manage their earnings during the analyzed nine-year period. Earnings management creates an important part of coherent business finance. It supports the annual prosperity of the enterprises and presents a substantial tool of reducing risk in analyzed emerging countries.
The weakness of the provided research is the use of annual average values of EBIT. Panel data for the whole analyzed period may be used in further research. The analysis could be extended for all Soviet-controlled countries to disclose a comprehensive view on the issue of earnings management in these countries with similar historical and political development. We run only Dickey–Fuller test to detect the existence of significant change in the earnings management of Slovak and Bulgarian enterprises, not its modified versions. Further research may support these results by additional use of these tests. The standard normal homogeneity test was used to determine the year of a significant change in the earnings management of Slovak and Bulgarian enterprises, but this test is very sensitive when detecting the breaks near the beginning and the end of the series. Our results focus a priori on the parametric test. In the future investigations, the results of Dickey–Fuller tests may be compared with a nonparametric Phillips–Perron test, Kwiatkowski–Phillips–Schmidt–Shin test with the nonparametric test for stationarity in continuous-time Markov processes, von Neumann’s test and standard normal homogeneity test with nonparametric Pettitt’s test.
Author Contributions
Conceptualization, P.D. and V.K.; methodology, P.D.; software, P.D.; validation, D.C., V.K., K.V. and I.A.; formal analysis, V.K., K.V. and I.A.; investigation, P.D. and K.V.; resources, D.C., K.V. and I.A.; data curation, K.V.; writing—original draft preparation, P.D.; writing—review and editing, K.V.; visualization, P.D.; supervision, D.C., V.K., K.V. and I.A.; project administration, K.V.; funding acquisition, K.V. All authors have read and agreed to the published version of the manuscript.
Funding
This research received no external funding.
Acknowledgments
This research was financially supported by the Slovak Research and Development Agency—Grant NO. APVV-17-0546: Variant Comprehensive Model of Earnings Management in Conditions of the Slovak Republic as an Essential Instrument of Market Uncertainty Reduction and VEGA 1/0210/19: Research of innovative attributes of quantitative and qualitative fundaments of the opportunistic earnings modeling.
Conflicts of Interest
The authors declare no conflict of interest.
References
- Agha, Omar M. A. Mahmood, Çağatay S. Bağçacı, and Nermin Şarlak. 2017. Homogeneity analysis of precipitation series in North Iraq. IOSR Journal of Applied Geology and Geophysics 5: 57–63. [Google Scholar] [CrossRef]
- Alexandersson, Hans. 1986. A homogeneity test applied to precipitation data. Journal of Climatology 6: 661–75. [Google Scholar] [CrossRef]
- Andries, Katheleen, Martine Cools, and Steve Van Uytbergen. 2017. To shift or not to shift? Intertemporal income shifting as a response to the risk capital allowance introduction in Belgium. European Accounting Review 26: 531–59. [Google Scholar] [CrossRef]
- Archibald, T. Ross. 1967. The return to straight-line depreciation: An analysis of a change in accounting method. Journal of Accounting Research 5: 164–80. [Google Scholar] [CrossRef]
- Bai, Jushan, and Serena Ng. 2005. Tests for skewness, kurtosis, and normality for time series data. Journal of Business & Economic Statistics 23: 49–60. [Google Scholar]
- Balcerzak, Adam P., Tomas Kliestik, Dalia Streimikiene, and Lubos Smrcka. 2017. Non-parametric approach to measuring the efficiency of banking sectors in European union countries. Acta Polytechnica Hungarica 14: 51–70. [Google Scholar]
- Barefield, Russell M., and Eugene E. Comiskey. 1972. The smoothing hypothesis: An alternative test. The Accounting Review 47: 291–98. [Google Scholar]
- Ben Amar, Anis, and Salma Chakroun. 2018. Do dimensions of corporate social responsibility affect earnings managements? Evidence from France. Journal of Financial Reporting and Accounting 16: 348–70. [Google Scholar] [CrossRef]
- Beneish, Messod D. 1997. Detecting GAAP violation: Implications for assessing earnings management among firms with extreme financial performance. Journal of Accounting and Public Policy 16: 271–309. [Google Scholar] [CrossRef]
- Bera, Anil K., and Carlos M. Jarque. 1981. Efficient tests for normality, homoscedasticity and serial independence of regression residuals: Monte Carlo evidence. Economics Letters 7: 313–18. [Google Scholar] [CrossRef]
- Berti-Équille, Laure, Ji Meng Loh, and Tamraparni Dasu. 2015. A masking index for quantifying hidden glitches. Knowledge and Information Systems 44: 253–77. [Google Scholar] [CrossRef]
- Bowman, Kimiko O., and Lyndon R. Shenton. 1975. Omnibus test contours for departures from normality based on√ b 1 and b 2. Biometrika 62: 243–50. [Google Scholar] [CrossRef]
- Box, George E. P., and David A. Pierce. 1970. Distribution of residual autocorrelations in autoregressive-integrated moving average time series models. Journal of the American statistical Association 65: 1509–26. [Google Scholar] [CrossRef]
- Buishand, T. Adri. 1982. Some methods for testing the homogeneity of rainfall records. Journal of Hydrology 58: 11–27. [Google Scholar] [CrossRef]
- Burgstahler, David, and Illia Dichev. 1997. Earnings management to avoid earnings decreases and losses. Journal of Accounting and Economics 24: 99–126. [Google Scholar] [CrossRef]
- Bzeouich, Bilel, Faten Lakhal, and Neila Dammak. 2019. Earnings management and corporate investment efficiency: Does the board of directors mater? Journal of Financial Reporting and Accounting 17: 650–70. [Google Scholar] [CrossRef]
- Christensen, Hans B., Edward Lee, Martin Walker, and Cheng Zeng. 2015. Incentives or Standards: What determines accounting quality changes around IFRS adoption? European Accounting Review 24: 31–61. [Google Scholar] [CrossRef]
- Cimini, Riccardo. 2015. How has the financial crisis affected earnings management? A European study. Applied Economics 47: 302–17. [Google Scholar] [CrossRef]
- Copeland, Ronald M. 1968. Income smoothing. Journal of Accounting Research 6: 101–16. [Google Scholar] [CrossRef]
- Cugova, Aneta, Juraj Cug, and George Lazaroiu. 2019. Descriptive Analysis of Company’s Profit as a Basis for Earnings Management. Paper presented at 33rd International-Business-Information-Management-Association (IBIMA) Conference: Education Excellence and Innovation Management Through Vision 2020, Granada, Spain, April 10–11; pp. 5629–38. [Google Scholar]
- Dascher, Paul E., and Robert E. Malcom. 1970. A note on income smoothing in the chemical industry. Journal of Accounting Research 8: 253–59. [Google Scholar] [CrossRef]
- DeAngelo, Linda Elizabeth. 1986. Accounting numbers as market valuation substitutes: A study of management buyouts of public stockholders. Accounting Review 61: 400–20. [Google Scholar]
- Dechow, Patricia M., and Douglas J. Skinner. 2000. Earnings management: Reconciling the views of accounting academics, practitioners, and regulators. Accounting Horizons 14: 235–50. [Google Scholar] [CrossRef]
- Dechow, Patricia M., Richard G. Sloan, and Amy P. Sweeney. 1995. Detecting earnings management. Accounting Review 70: 193–225. [Google Scholar]
- Degeorge, Francois, Jayendu Patel, and Richard Zeckhauser. 1999. Earnings management to exceed thresholds. The Journal of Business 72: 1–33. [Google Scholar] [CrossRef]
- Dickey, David A., and Wayne A. Fuller. 1979. Distribution of the estimators for autoregressive time series with a unit root. Journal of the American Statistical Association 74: 427–31. [Google Scholar]
- Dopuch, Nicholas, and David D. Drake. 1966. The effect of alternative accounting rules for nonsubsidiary investments. Journal of Accounting Research 4: 192–219. [Google Scholar] [CrossRef]
- Dufour Jean-Marie, Abdeljelil Farhat, Lucien Gardiol, and Lynda Khalaf. 1998. Simulation-based finite sample normality tests in linear regressions. Econometrics Journal 1: 154–73. [Google Scholar] [CrossRef] [Green Version]
- Eldenburg, Leslie G., Katherine A. Gunny, Kevin W. Hee, and Naomi Soderstrom. 2011. Earnings management using real activities: Evidence from nonprofit hospitals. The Accounting Review 86: 1605–30. [Google Scholar] [CrossRef]
- Elder, John, and Peter E. Kennedy. 2001. Testing for unit roots: What should students be taught? The Journal of Economic Education 32: 137–46. [Google Scholar] [CrossRef]
- Ferrer Garcia, Cristina, and Jose Antonio Lainez Gadea. 2013. Detecting differences on the earnings quality measurement: Empirical evidence on Spanish firms. Revista de Metodes Cuantitativos para la Economia y la Empresa 16: 5–28. [Google Scholar]
- Garcia, Francisco Augusto Alcaraz. 2012. Tests to Identify Outliers in Data Series. Rio de Janeiro: Pontifical Catholic University of Rio de Janeiro, Industrial Engineering Department. [Google Scholar]
- Ghosh, Dhiren, and Andrew Vogt. 2012. Outliers: An evaluation of methodologies. Joint Statistical Meetings, 3455–60. Available online: https://ww2.amstat.org/meetings/jsm/2012/onlineprogram/AbstractDetails.cfm?abstractid=304068 (accessed on 30 May 2020).
- Gordon, Myron J. 1964. Postulates, principles and research in accounting. The Accounting Review 39: 251. [Google Scholar]
- Gordon, Myron J., Bertrand N. Horwitz, and Philip T. Meyers. 1966. Accounting measurements and normal growth of the firm. Research in Accounting Measurement 23: 223–41. [Google Scholar]
- Graham, John R., Campbell R. Harvey, and Shiva Rajgopal. 2005. The economic implications of corporate financial reporting. Journal of Accounting and Economics 40: 3–73. [Google Scholar] [CrossRef] [Green Version]
- Guay, Wayne R., S. P. Kothari, and Ross L. Watts. 1996. A market-based evaluation of discretionary accrual models. Journal of Accounting Research 34: 83–105. [Google Scholar] [CrossRef]
- Gunny, Katherine A. 2010. The relation between earnings management using real activities manipulation and future performance: Evidence from meeting earnings benchmarks. Contemporary Accounting Research 27: 855–88. [Google Scholar] [CrossRef]
- Hacker, Scott R., and Abdulnasser Hatemi-J. 2010. The Properties of Procedures Dealing with Uncertainty about Intercept and Deterministic Trend in unit Root Testing. CESIS Electronic Working Paper Series; Stockholm: Centre of Excellence for Science and Innovation Studies, The Royal Institute of Technology, pp. 1–19. [Google Scholar]
- Healy, Paul. 1985. The impact of bonus schemes on the selection of accounting principles. Journal of Accounting and Economics 7: 85–107. [Google Scholar] [CrossRef]
- Hepworth, Samuel R. 1953. Smoothing periodic income. The Accounting Review 28: 32–39. [Google Scholar]
- Hoang, Trang Cam, and Dempsey Michael Joseph. 2019. The effect of new corporate accounting regime on earnings management: Evidence from Vietnam. Journal of International Studies 12: 93–104. [Google Scholar]
- Hoglund, Henrik. 2012. Detecting earnings management with neural networks. Expert Systems with Applications 39: 9564–70. [Google Scholar] [CrossRef]
- Hudakova, Maria, Matej Masar, Maria Luskova, and Milan Robin Patak. 2018. The dependence of perceived business risks on the size of SMEs. Journal of Competitiveness 10: 54–69. [Google Scholar] [CrossRef] [Green Version]
- Iatridis, George, and George Kadorinis. 2009. Earnings management and firm financial motives: A financial investigation of UK listed firms. International Review of Financial Analysis 18: 164–73. [Google Scholar] [CrossRef]
- Istrate, Costel. 2019. Detecting earnings management using Benford’s Law: The case of Romanian listed companies. Journal of Accounting and Management Information Systems 18: 198–223. [Google Scholar] [CrossRef]
- Jarque, Carlos M., and Anil K. Bera. 1980. Efficient tests for normality, homoscedasticity and serial independence of regression residuals. Economics Letters 6: 255–59. [Google Scholar] [CrossRef]
- Jones, Jennifer J. 1991. Earnings management during import relief investigations. Journal of Accounting Research 29: 193–228. [Google Scholar] [CrossRef]
- Kang, Ho Ming, and Fadhilah Yusof. 2012. Homogeneity tests on daily rainfall series. International Journal of Contemporary Mathematical Sciences 7: 9–22. [Google Scholar]
- Kanovsky, Martin. 2018. The research effectivity of Slovak universities: Quantitative analysis of trends 2008–2017. Slovak Sociological Review 50: 429–47. [Google Scholar] [CrossRef]
- Kaplan, Robert S. 1985. Evidence on the effect of bonus schemes on accounting procedure and accrual decisions. Journal of Accounting and Economics 7: 109–13. [Google Scholar] [CrossRef]
- Kempen, R. 2010. Earnings Management in Public and Private Companies in the Netherlands. Master’s thesis, Accounting and Finance, Erasmus University Rotterdam, Rotterdam, The Netherlands; pp. 1–32. [Google Scholar]
- Khanh, Hoang Mai Thi, and Anh Phung Thu. 2019. The effect of financial leverage on real and accrual-based earnings management in Vietnamese firms. Economics and Sociology 12: 299–333. [Google Scholar] [CrossRef] [Green Version]
- Kral, Pavol, Viera Valjaskova, and Katarina Janoskova. 2019. Quantitative approach to project portfolio management: Proposal for Slovak companies. Oeconomia Copernicana 10: 797–814. [Google Scholar] [CrossRef] [Green Version]
- Kwiatkowski, Denis, Peter C. B. Phillips, Peter Schmidt, and Yongcheol Shin. 1992. Testing the null hypothesis of stationarity against the alternative of a unit root. Journal of Econometrics 54: 159–78. [Google Scholar] [CrossRef]
- Leybourne, Stephen. J., Terence C. Mills, and Paul Newbold. 1998. Spurious rejections by Dickey–Fuller tests in the presence of a break under the null. Journal of Econometrics 87: 191–203. [Google Scholar] [CrossRef]
- Lizinska, Joanna, and Leszek Czapiewski. 2018. Towards economic corporate sustainability in reporting: What does earnings management around equity offerings mean for long-term performance? Sustainability 10: 4349. [Google Scholar] [CrossRef] [Green Version]
- Ljung, Greta M., and George E. P. Box. 1978. On a measure of lack of fit in time series models. Biometrika 65: 297–303. [Google Scholar] [CrossRef]
- Madgerova, Raya, Vyara Kyurova, Anny Atanasova, and Blagovesta Koyundzhiyska-Davidkova. 2019. Study of the business environment for the development of youth entrepreneurship in Bulgaria. Theoretical and practical aspects. Revista Inclusiones 6: 90–104. [Google Scholar]
- Marin, Nikolay, and Preslav Dimitrov. 2018. Economic Effects of the membership of the Republic of Bulgaria in the European Union. Kutafin University Law Review 5: 209–21. [Google Scholar]
- McNichols, Maureen, and Peter G. Wilson. 1988. Evidence of earnings management from the provision for bad debts. Journal of Accounting Research 26: 1–31. [Google Scholar] [CrossRef]
- Meyers, Thomas D., Ladislav Vagner, Katarina Janoskova, Iulia Grecu, and Gheorghe Grecu. 2019. Big data-driven algorithmic decision-making in selecting and managing employees: Advanced predictive analytics, workforce metrics, and digital innovations for enhancing organizational human capital. Psychosociological Issues in Human Resource Management 7: 49–54. [Google Scholar]
- Nagy, Ladislav. 2016. Ratio indicators database of HGN1 model for measuring enterprise performance. Journal of Knowledge Society 4: 1–11. [Google Scholar]
- Orazalin, Nurlan. 2019. Board gender diversity, corporate governance, and earnings management. Gender in Management 35: 37–60. [Google Scholar] [CrossRef]
- Orazalin, Nurlan, and Rassul Akhmetzhanov. 2019. Earnings management, audit quality, and cost of debt: Evidence from a Central Asian economy. Managerial Auditing Journal 34: 696–721. [Google Scholar] [CrossRef]
- Pavlovic, Vladan, Goranka Knezevic, and Radica Bojicic. 2018. Board gender diversity and earnings management in agricultural sector—Does it have any influence? Custos E Agronegocio On Line 14: 340–63. [Google Scholar]
- Pavlovic, Vladan, Goranka Knezevic, and Radica Bojicic. 2019. Does board of director’s age impact earnings management in agriculture? Case of Serbian agricultural sector. Custos E Agronegocio on Line 15: 254–72. [Google Scholar]
- Peasnell, Ken V., Peter F. Pope, and Steven Young. 2000. Detecting earnings management using cross-sectional abnormal accruals models. Accounting and Business Research 30: 313–26. [Google Scholar] [CrossRef]
- Penman, Stephen H., and Xiao-Jun Zhang. 2002. Accounting conservatism, the quality of earnings, and stock returns. The Accounting Review 77: 237–64. [Google Scholar] [CrossRef] [Green Version]
- Pina, Vicente, Maria Jose Arcas, and Caridad Marti. 2012. Accruals and accounting numbers management in UK executive agencies. Public Money & Management 32: 273–80. [Google Scholar]
- Piosik, Andrzej, and Ewa Genge. 2019. The influence of a company’s ownership structure on upward real earnings management. Sustainability 12: 152. [Google Scholar] [CrossRef] [Green Version]
- Pohlert, Thorsten. 2016. Non-Parametric Trend Tests and Change-Point Detection. Creative Commons License (CC BY-ND 4.0). Available online: https://mran.microsoft.com/snapshot/2016-06-30/web/packages/trend/vignettes/trend.pdf (accessed on 30 March 2020).
- Rahman, Ashiqur, Jaroslav Belas, Tomas Kliestik, and Ladislav Tyll. 2017. Collateral requirements for SME loans: Empirical evidence from the Visegrad countries. Journal of Business Economics and Management 18: 650–75. [Google Scholar] [CrossRef] [Green Version]
- Rodriguez-Perez, Gonzalo, and Stefan van Hemmen. 2010. Debt, diversification and earnings management. Journal of Accounting and Public Policy 29: 138–59. [Google Scholar] [CrossRef]
- Roychowdhury, Sugata. 2006. Earnings management through real activities manipulation. Journal of Accounting and Economics 42: 335–70. [Google Scholar] [CrossRef]
- Sosnowski, Tomasz. 2018. Earnings management in the private equity divestment process on Warsaw Stock Exchange. Equilibrium. Quarterly Journal of Economics and Economic Policy 13: 689–705. [Google Scholar] [CrossRef]
- Sosnowski, Tomasz, and Anna Wawryszuk-Misztal. 2019. Diversity on management and supervisory board and accuracy of management earnings forecasts in IPO prospectuses. Ekonomia i Prawo. Economics and Law 18: 347–63. [Google Scholar] [CrossRef]
- Spuchlakova, Erika, and Juraj Cug. 2015. Credit risk and LGD modelling. Procedia Economics and Finance 23: 439–44. [Google Scholar] [CrossRef] [Green Version]
- Tanchev, Stoyan, and Ivan Todorov. 2019. Tax buoyancy and economic growth: Empirical evidence of Bulgaria. Journal of Tax Reform 5: 236–48. [Google Scholar]
- Susanto, Yulius Kurnia, Kashan Pirzada, and Adrianne Sheryl. 2019. Is tax aggressiveness an indicator of earnings management? Polish Journal of Management Studies 20: 516–27. [Google Scholar]
- Svabova, Lucia, and Marek Durica. 2019. Being an outlier: A company non-prosperity sign? Equilibrium. Quarterly Journal of Economics and Economic Policy 14: 359–75. [Google Scholar] [CrossRef]
- Svabova, Lucia, and Lucia Michalkova. 2018. Pre-processing of data in earnings management. Business Economics and Management 3: 65–72. [Google Scholar]
- Trading Economics. 2020. Available online: https://tradingeconomics.com/indicators (accessed on 20 April 2020).
- Turlea, Carmen, Laura Brad, Florin Dobre, and Ioan Codrut Turlea. 2019. The Influence of Financial Auditor on the Earnings Management Process: Mandatory Application of IFRS for the First Time in Romania. Paper presented at BASIQ International Conference on New Trends in Sustainable Business and Consumption, Bari, Italy, May 30–June 1. [Google Scholar]
- Vagner, Ladislav. 2017. Facility Management as a Partner of Cost Controlling at Costs Optimization in the Selected Enterprise. Paper presented at 17th Annual Conference on Finance and Accounting: New Trends in Finance and Accounting, Prague, Czech Republic, May 27; pp. 621–29. [Google Scholar]
- Valaskova, Katarina, Tomas Kliestik, and Maria Kovacova. 2019. Assessment of Selected Models of Earnings Management in Economic Conditions of Slovakia. Paper presented at 33rd International-Business-Information-Management-Association (IBIMA) Conference Education Excellence and Innovation Management Through Vision 2020, Granada, Spain, April 10–11; pp. 3922–31. [Google Scholar]
- Velte, Patrick P. 2019. The bidirectional relationship between ESG performance and earnings management—Empirical evidence from Germany. Journal of Global Responsibility 10: 322–38. [Google Scholar] [CrossRef]
- Von Neumann, John. 1941. Distribution of the ratio of the mean square successive difference to the variance. The Annals of Mathematical Statistics 12: 367–95. [Google Scholar] [CrossRef]
- White, Gary E. 1970. Discretionary accounting decisions and income normalization. Journal of Accounting Research 8: 260–73. [Google Scholar] [CrossRef]
- Young, Steven. 1999. Systematic measurement error in the estimation of discretionary accruals: An evaluation of alternative modelling procedures. Journal of Business Finance & Accounting 26: 833–62. [Google Scholar]
Figure 1.
Gross domestic product (GDP) index. Source: Trading Economics.

Figure 2.
The values of average EBIT with error bars. Source: own research.

Figure 3.
Significant change in the earnings management of Slovak enterprises. Source: own research.
Figure 3.
Significant change in the earnings management of Slovak enterprises. Source: own research.

Figure 4.
Significant change in the earnings management of Bulgarian enterprises. Source: own research.
Figure 4.
Significant change in the earnings management of Bulgarian enterprises. Source: own research.

Figure 5.
Ease of doing business rank. Source: own research.

Figure 6.
Annual growth rate of GDP. Source: Trading Economics.

Figure 7.
Long-term unemployment rank. Source: Trading Economics.


Table 1.
Investigate samples.
| Samples | Slovakia | Bulgaria |
|---|---|---|
| Origin | 1347 | 1839 |
| Missing values | 189 | 358 |
| Outliers | 69 | 60 |
| Final | 1089 | 1421 |
Source: own research.
Table 2.
Dixon test.
| Year | Observed Value | Critical Value | p-Value (Two-Tailed) | Alpha | |||
|---|---|---|---|---|---|---|---|
| Slovakia | Bulgaria | Slovakia | Bulgaria | Slovakia | Bulgaria | ||
| 2010 | 0.621 | 0.447 | 0.174 | 0.168 | <0.0001 | <0.0001 | 0.05 |
| 2011 | 0.272 | 0.597 | 0.174 | 0.168 | <0.0001 | <0.0001 | 0.05 |
| 2012 | 0.491 | 0.205 | 0.174 | 0.168 | <0.0001 | <0.012 | 0.05 |
| 2013 | 0.273 | 0.411 | 0.174 | 0.168 | <0.0001 | <0.0001 | 0.05 |
| 2014 | 0.715 | 0.290 | 0.174 | 0.168 | <0.0001 | 0.0002 | 0.05 |
| 2015 | 0.611 | 0.434 | 0.174 | 0.168 | <0.0001 | <0.0001 | 0.05 |
| 2016 | 0.639 | 0.241 | 0.174 | 0.168 | <0.0001 | <0.003 | 0.05 |
| 2017 | 0.809 | 0.540 | 0.174 | 0.168 | <0.0001 | <0.0001 | 0.05 |
| 2018 | 0.668 | 0.248 | 0.174 | 0.168 | <0.0001 | 0.002 | 0.05 |
Source: own research.
Table 3.
Annual average EBIT of enterprises.
| Year | Slovakia [Thousand €] | Bulgaria [Thousand €] |
|---|---|---|
| 2010 | 826.304 | 809.544 |
| 2011 | 849.407 | 903.255 |
| 2012 | 832.338 | 987.599 |
| 2013 | 891.055 | 1042.889 |
| 2014 | 1074.256 | 1189.924 |
| 2015 | 1247.988 | 1391.023 |
| 2016 | 1359.095 | 1437.167 |
| 2017 | 1438.782 | 1543.163 |
| 2018 | 1444.950 | 1561.801 |
Source: own research.
Table 4.
Jarque–Bera test.
| Jarque–Bera Test | Slovakia | Bulgaria |
|---|---|---|
| JB (Observed value) | 1.119 | 0.884 |
| JB (Critical value) | 5.991 | 5.991 |
| DF | 2 | 2 |
| p-value (Two-tailed) | 0.572 | 0.643 |
| alpha | 0.05 | 0.05 |
Source: own research.
Table 5.
Box–Pierce test.
| Box–Pierce Test | Slovakia | Bulgaria |
|---|---|---|
| DF | 6 | 6 |
| Q | 11.172 | 9.630 |
| p-value (Two-tailed) | 0.083 | 0.141 |
| alpha | 0.05 | 0.05 |
Source: own research.
Table 6.
Dickey–Fuller test.
| Dickey–Fuller Test | Observed Value | Critical Value | p-Value (One-Tailed) | Alpha | |||
|---|---|---|---|---|---|---|---|
| Slovakia | Bulgaria | Slovakia | Bulgaria | Slovakia | Bulgaria | ||
| No intercept | 2.788 | 3.724 | −1.965 | −1.965 | 0.993 | 0.998 | 0.05 |
| Intercept | 0.007 | −0.699 | −3.353 | −3.353 | 0.932 | 0.792 | 0.05 |
| Intercept + Trend | −1.843 | −1.620 | −4.230 | −4.230 | 0.588 | 0.688 | 0.05 |
Source: own research.
Table 7.
Kwiatkowski–Phillips–Schmidt–Shin (KPSS) test.
| KPSS Test | Observed Value | Critical Value | p-Value (One-Tailed) | Alpha | |||
|---|---|---|---|---|---|---|---|
| Slovakia | Bulgaria | Slovakia | Bulgaria | Slovakia | Bulgaria | ||
| Level | 0.893 | 0.912 | 0.459 | 0.459 | <0.0001 | <0.0001 | 0.05 |
| Trend | 0.939 | 0.967 | 0.149 | 0.149 | 0.007 | 0.002 | 0.05 |
Source: own research.
Table 8.
von Neumann’s test.
| von Neumann’s Test | Slovakia | Bulgaria |
|---|---|---|
| N | 0.151 | 0.145 |
| p-value (Two-tailed) | <0.0001 | <0.0001 |
| alpha | 0.05 | 0.05 |
Source: own research.
Table 9.
Standard normal homogeneity test (SNHT).
| SNHT Test | Slovakia | Bulgaria |
|---|---|---|
| T0 | 7.053 | 6.732 |
| t (year of significant change) | 2014 | 2014 |
| mu1 [thousand €] | 895 | 987 |
| mu2 [thousand €] | 1373 | 1483 |
| p-value (Two-tailed) | 0.008 | 0.008 |
| alpha | 0.05 | 0.05 |
Source: own research.
© 2020 by the authors. Licensee MDPI, Basel, Switzerland. This article is an open access article distributed under the terms and conditions of the Creative Commons Attribution (CC BY) license (http://creativecommons.org/licenses/by/4.0/).
Share and Cite
MDPI and ACS Style
Durana, P.; Valaskova, K.; Chlebikova, D.; Krastev, V.; Atanasova, I. Heads and Tails of Earnings Management: Quantitative Analysis in Emerging Countries. Risks 2020, 8, 57. https://0-doi-org.brum.beds.ac.uk/10.3390/risks8020057
AMA Style
Durana P, Valaskova K, Chlebikova D, Krastev V, Atanasova I. Heads and Tails of Earnings Management: Quantitative Analysis in Emerging Countries. Risks. 2020; 8(2):57. https://0-doi-org.brum.beds.ac.uk/10.3390/risks8020057
Chicago/Turabian StyleDurana, Pavol, Katarina Valaskova, Darina Chlebikova, Vladislav Krastev, and Irina Atanasova. 2020. "Heads and Tails of Earnings Management: Quantitative Analysis in Emerging Countries" Risks 8, no. 2: 57. https://0-doi-org.brum.beds.ac.uk/10.3390/risks8020057
Note that from the first issue of 2016, this journal uses article numbers instead of page numbers. See further details here.