Article

Are Investors’ Attention and Uncertainty Aversion the Risk Factors for Stock Markets? International Evidence from the COVID-19 Crisis

1
Department of Management Sciences, National Textile University, Faisalabad 37610, Pakistan
2
School of Finance, Jiangxi University of Finance and Economics, Nanchang 330013, China
3
NUST Business School, National University of Sciences and Technology, Islamabad 44000, Pakistan
*
Author to whom correspondence should be addressed.
Submission received: 12 November 2020 / Revised: 8 December 2020 / Accepted: 16 December 2020 / Published: 22 December 2020
(This article belongs to the Special Issue Financial Stability and Systemic Risk in Times of Pandemic)

Abstract

:
In this paper, we examine the impact of investors’ attention to COVID-19 on stock market returns and the moderating effect of national culture on this relationship. Using daily data from 34 countries over the period 23 January to 12 June 2020, and measuring investors’ attention with the Google search volume (GSV) of the word “coronavirus” for each country, we find that investors’ enhanced attention to the COVID-19 pandemic results in negative stock market returns. Further, measuring the national culture with the uncertainty avoidance index (the aspect of national culture which measures the cross-country differences in decision-making under stress and ambiguity), we find that the negative impact of investors’ attention on stock market returns is stronger in countries where investors possess higher uncertainty avoidance cultural values. Our findings imply that uncertainty avoidance cultural values of investors promote financial market instability amid the crisis.

1. Introduction

Recently emerging literature has identified that stock markets reacted negatively to the COVID-19 outbreak. More specifically, this literature points out that stock market returns declined as laboratory-confirmed cases of COVID-19 increased (Al-Awadhi et al. 2020; Ashraf 2020b). This finding is puzzling in the context of the US stock market, which is considered a benchmark worldwide. As shown in 
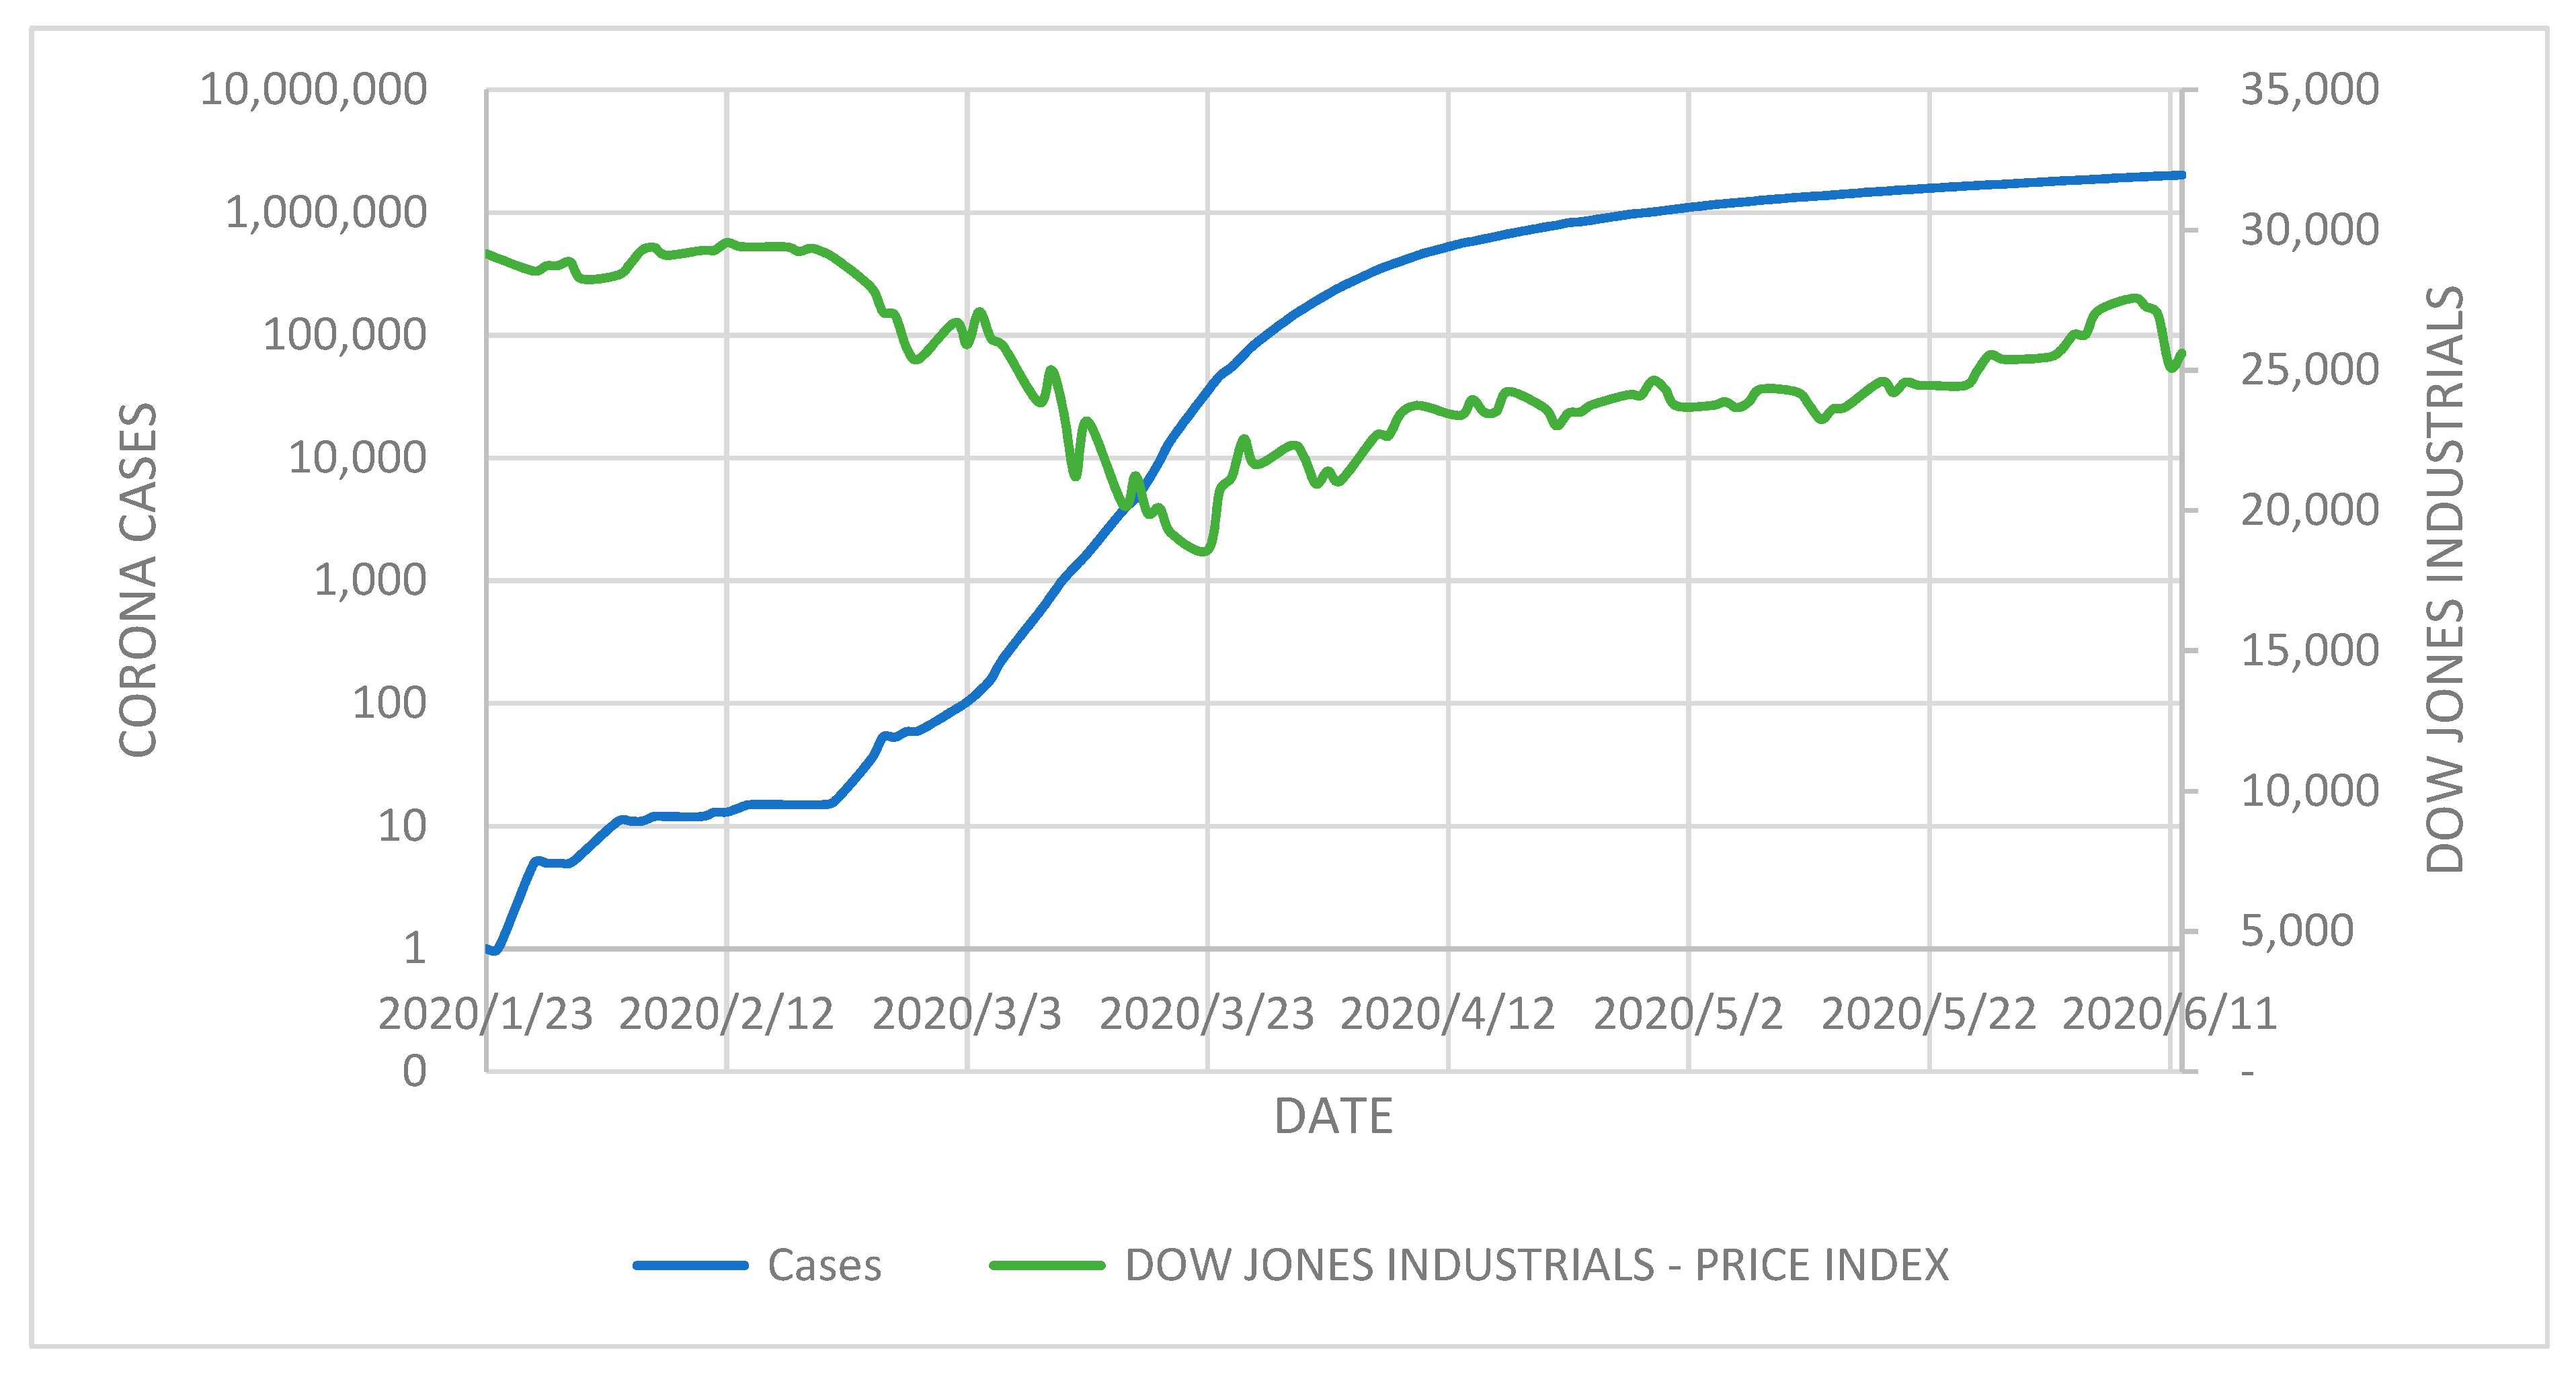
Figure 1, the Dow Jones Industrial Index (DJII from hereafter) was going up in mid-February when confirmed cases of COVID-19 in the US were also on the rise. Further in this regard, Onali (2020) fails to find evidence that both the DJII and S&P 500 index reacted negatively to the numbers of confirmed COVID-19 cases and deaths in the US.
One potential reason might be investors’ lack of attention in the early days of the outbreak. Extensive literature sheds light on the relationship between investors’ attention and stock markets. This literature largely suggests investors’ attention has a significant effect on different aspects of the stock market, including trading volume (Vlastakis and Markellos 2012), market volatility (Andrei and Hasler 2015) and stock returns both at an individual stock level (Da et al. 2011) and aggregate level (Vozlyublennaia 2014). Huberman and Regev (2001) explore that it is the investors’ attention after which prices react to any new information. They show that investors’ attention to already available information can increase share prices. In 
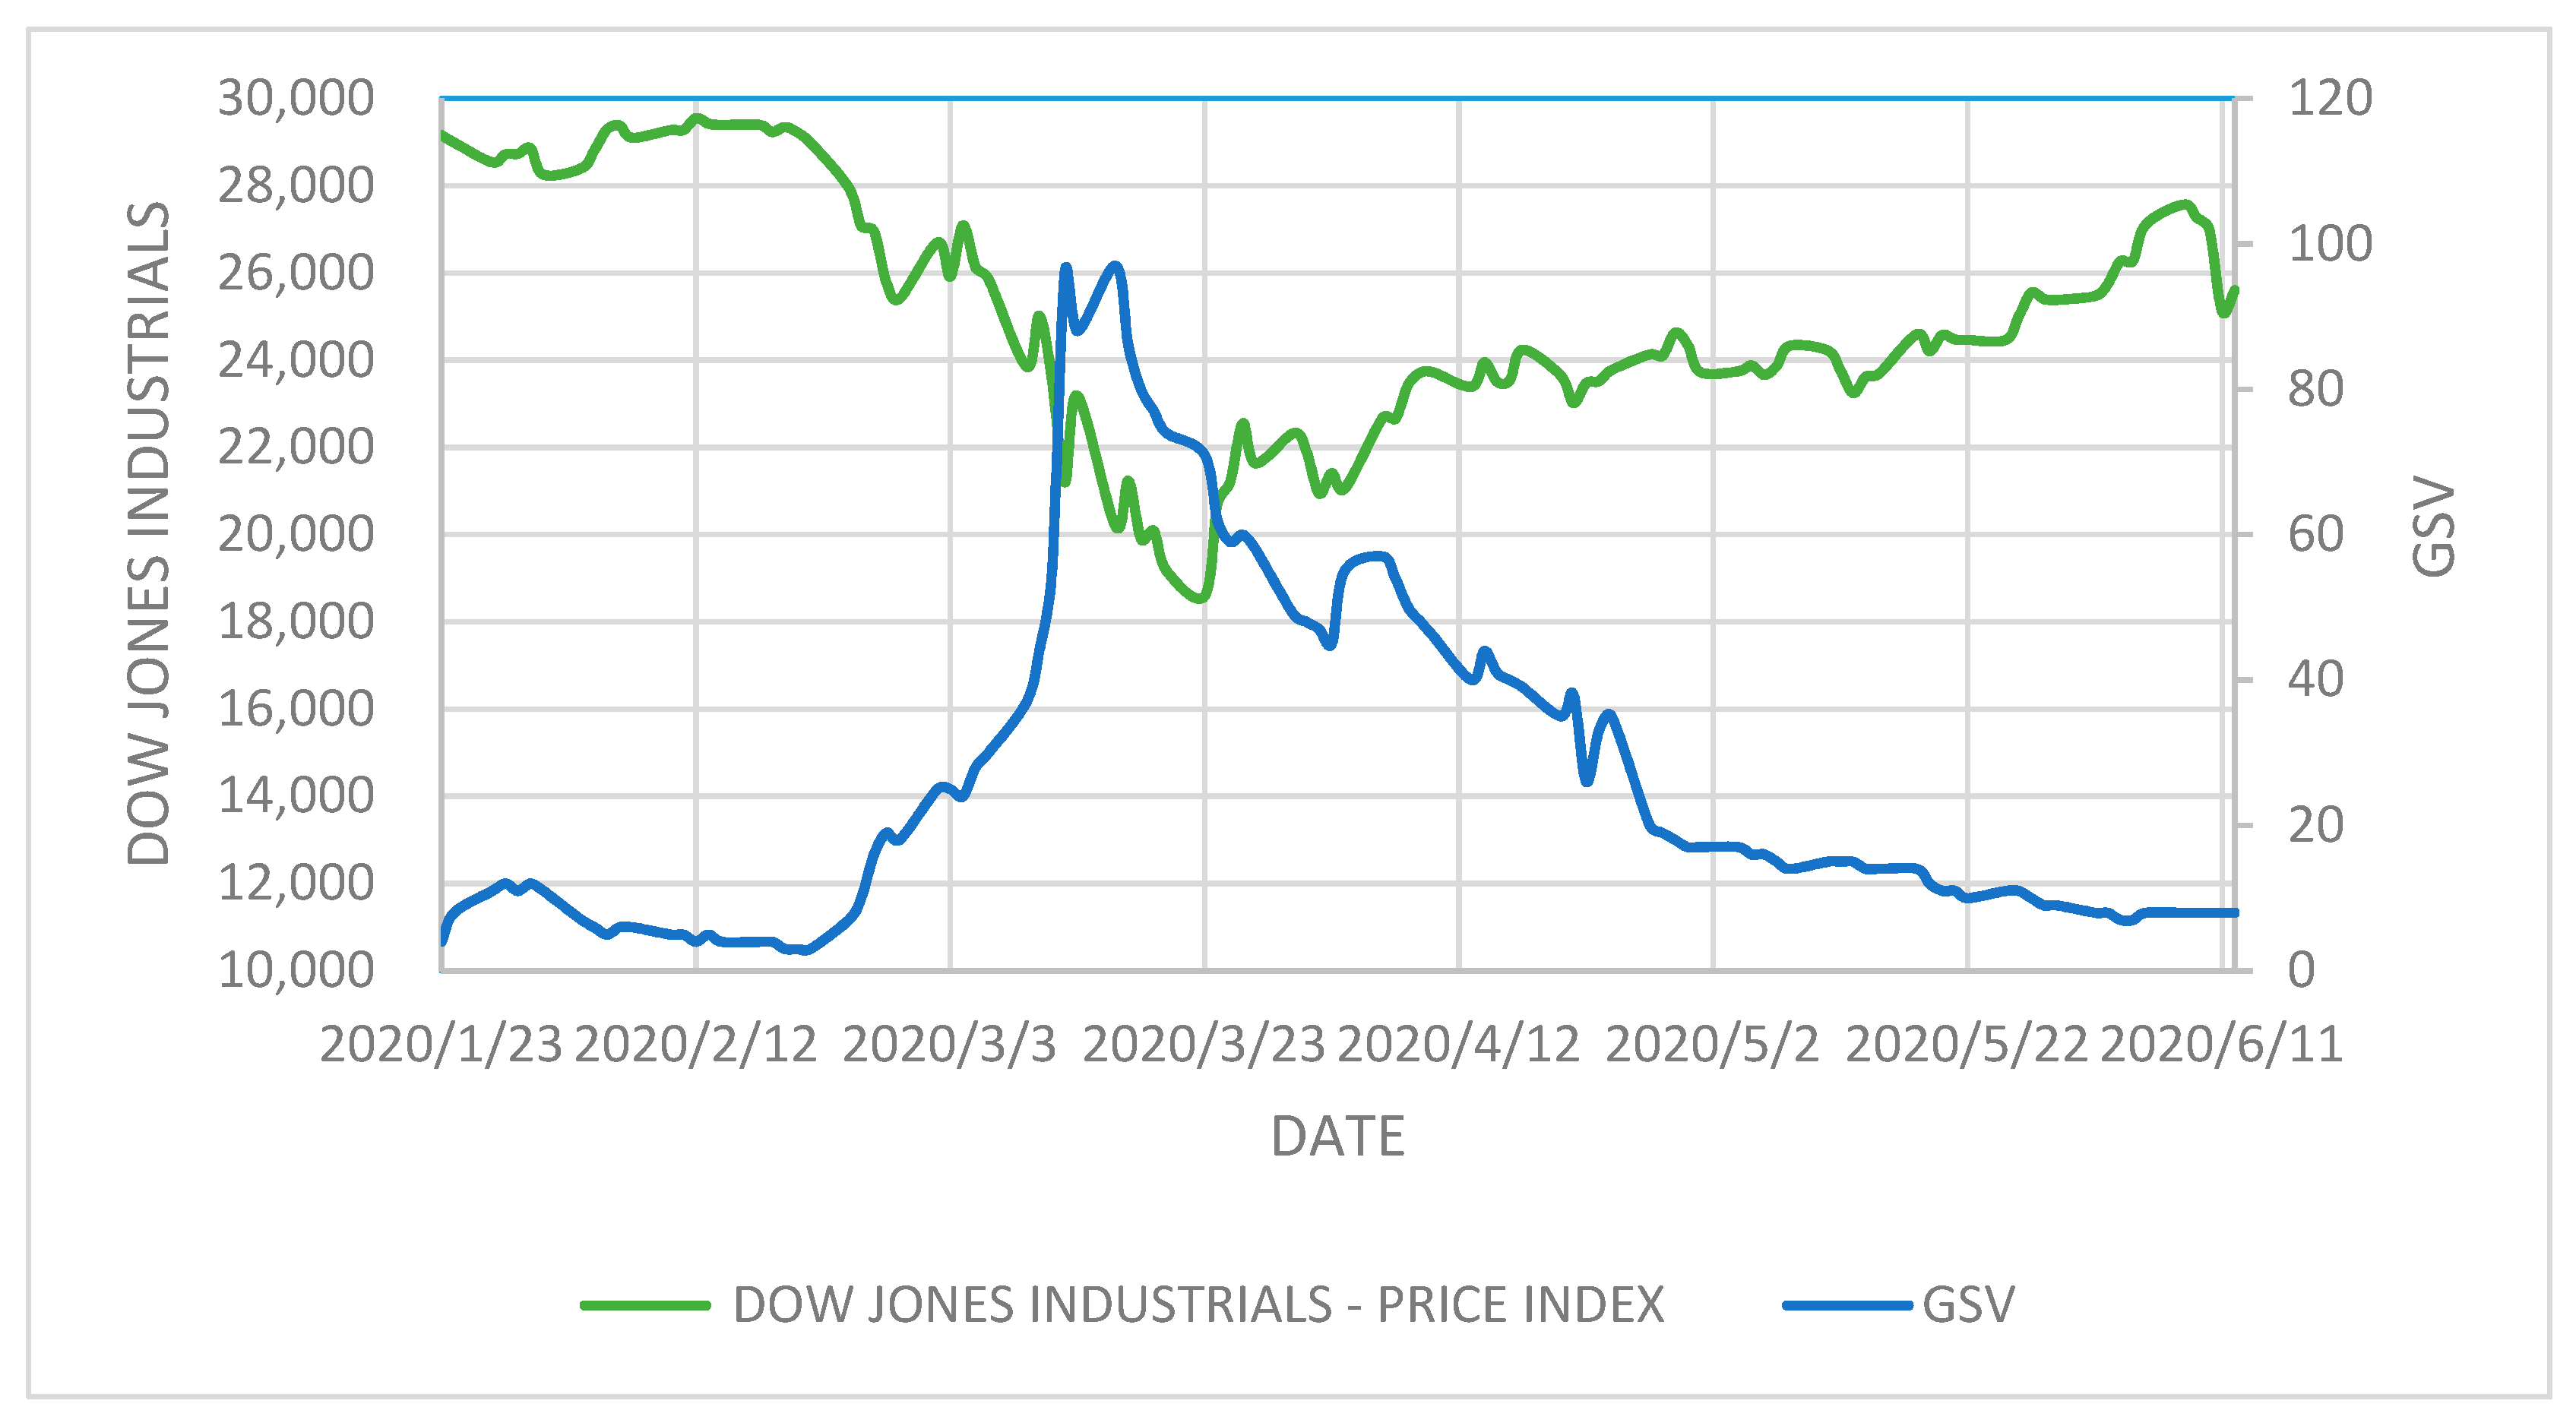
Figure 2, we draw the DJII with Google search volume (GSV from here after) of the word “coronavirus”. It is evident from Figure 2 that the market moved more closely with the Google searches. The DJII started declining when searches started increasing at the end of February, was off to its lowest value after the searches peaked in mid-March and started recovering after the decline in search volume.
Motivating from this general observation from the benchmark financial market, in this paper, we aim to examine whether and how investors’ attention to COVID-19 has influenced market returns. Further building on Ashraf (2020c), who finds that the national culture of investors has a strong bearing on how investors reacted to the COVID-19 shock, we examine whether the relationship between investors’ attention and stock returns is moderated by investors’ level of uncertainty avoidance.
Using data from 34 countries over the period January 23 to June 12, 2020, first we found evidence that investors’ attention has a negative impact on stock returns. Next, using an interaction term between investors’ attention and an uncertainty avoidance variable, we found that the negative impact of investors’ attention on stock market returns is stronger in countries where the level of uncertainty avoidance of investors is higher.
This study makes a three-fold contribution. First, it augments the literature focusing on the relationship between investors’ attention and stock markets. In this vein, Da et al. (2011) propose GSV as a new proxy for investor attention and found its significant impact on stock prices and performance of initial public offering (IPO) stocks. Yuan (2015) found a significant impact of market-wide attention events on stock returns. Andrei and Hasler (2015) theoretically and empirically link attention and uncertainty to stock prices. Peltomäki et al. (2018) found that investors’ attention influences stock market volatility. Swamy et al. (2019) investigate whether investors’ attention (proxied by GSV) plays a role in stock returns forecasting or not in an emerging market and found a significant impact of investors’ attention on stock returns. We add to these studies by examining the impact of investors’ attention to an exogenous health crisis, which has economic consequences through human costs and social distancing measures, on stock market returns. Overall, we show that enhanced investors’ attention to the pandemic has resulted in declined stock market returns.
Second, it adds to the evolving literature on COVID-19 and the stock market relationship. Goodell (2020) reviews the literature encompassing the economic and financial impact of diseases and suggests that COVID-19 is likely to have an important impact on the functioning of financial markets. Other studies have examined the impact of COVID-19 on stock returns (Panyagometh 2020; Butt et al. 2020), risk and volatility (Zhang et al. 2020), stability and sequential irregularity (Lahmiri and Bekiros 2020), industry’s returns dependence and the structure of the risk-return relationship (AZİMLİ 2020), the market crash in March 2020 (Mazur et al. 2020), fractal contagion effect among stock markets (Okorie and Lin 2020), returns of companies sharing the name “corona” (Corbet et al. 2020) and changes in investment, fiscal and export multipliers due to the COVID-19 pandemic (Derkacz 2020). We contribute by analyzing whether investors’ enhanced attention to COVID-19, measured with the Google search volume of the word “coronavirus”, affects stock market returns.
Lastly, we add to the recent literature that explores that national characteristics influence the Covid–stock relationship. Recent studies find that national characteristics can moderate this relationship. For instance, Ashraf (2020c) explores that national culture, proxied with the level of uncertainty avoidance, acts as a moderator in the COVID-19 confirmed cases and stock market returns relationship. Ashraf (2020a) shows that stringent government social distancing policies weaken the negative association between COVID-19 confirmed cases and stock market returns. Erdem (2020) finds the moderating effect of economic freedom on the Covid–stock relationship. Extending this literature, we examine whether the national culture, proxied with the level of uncertainty avoidance, acts as a moderator in the investors’ attention and stock market returns relationship. Moreover, our study also augments the literature that focuses on COVID-19 in the cultural context (e.g., Monica-violeta et al. 2020).
The rest of the paper is arranged as follows. The next section discusses the relevant literature and presents hypotheses. Section 3 outlines the data and empirical model. Section 4 presents the results and discussion. The last section concludes the study.

2. Literature Review and Hypotheses

2.1. Google Search Volume

Google provides the data of a keyword if it has achieved a certain number of searches. This data can be accessed on Google Trends and is scaled from 0 (the lowest level of searches) to 100 (the highest level of searches). The majority of internet users seek new information via Google as it is the most popular search engine around the globe. GSV as a proxy of investors’ attention offers several advantages, such as that it depicts investors’ behavior in a more timely manner and captures the behavior of retail investors more precisely (Da et al. 2011). If one is searching for some keywords, it is a clear indication that one is paying attention to this piece of information. A number of studies have used GSV as a proxy of investors’ attention to predict stock returns (Vlastakis and Markellos 2012; Dzielinski 2012; Vozlyublennaia 2014; Smales 2020). Besides stock markets, GSV has also been applied in other financial and commodity markets. Smith (2012) studies the impact of GSV on the exchange rate volatility of different currencies and finds that GSV has significant impact on exchange rate volatility. Salisu et al. (2020) investigate the relationship between GSV and precious metal returns. They find a positive and significant impact of GSV on these returns. Mišečka et al. (2019) study the impact of attention driven behavior (proxied by GSV) of investors on agricultural commodity markets. Bilgin et al. (2019) develop a macroeconomic uncertainty index by using Google trends data for Turkey and find that their index has significant predictive power. D’Amuri and Marcucci (2017) report a strong association between Google searches and unemployment. Vosen and Schmidt (2011) forecast consumption by using GSV.
To examine the impact of investors’ attention to COVID-19 on stock returns, we employ stock index level data and proxy investors’ attention with GSV. Though Da et al. (2011) use stock ticker symbols as keywords and take their Google search volume to measure investors’ attention to individual stocks, we largely follow the approach of Da et al. (2015) who propose that investors’ attention can be directly measured through the internet search behavior of households. More specifically, they calculate households’ FEARS index from the GSV of several keywords related to the economy as a proxy of investors’ attention and check its impact on stock returns. In this regard, we use the GSV of the keyword “coronavirus” for each country as a proxy of investors’ attention during the pandemic and examine its impact on stock index returns. Our motivation to use index-level data comes from Vozlyublennaia (2014), who argues that retail investors trade through professional financial intermediaries and usually do not pay attention to individual stocks because the investment choice set offered by the intermediaries typically includes only broad market indexes or portfolios.

2.2. Investors’ Attention and Stock Returns

The efficient market hypothesis suggests that stock prices reflect all available information. However, investors do not always gather all information but only the information they are interested in because attention is a scarce cognitive activity in the real world (Kahneman 1973). Based on the notion that attention is a limited resource, Barber and Odean (2008) propose attention theory (also referred to as the “price pressure hypothesis”), which suggests that enhanced investors’ attention may impact stock returns largely positively. Barber and Odean (2008) argue that investors face an asymmetric choice problem when buying and selling stocks. While making buying decisions, investors face the difficulty of searching the thousands of stocks they can potentially buy. As a result, they mostly buy the stocks that grab their attention. On the contrary, while making selling decisions, they do not face such difficulty since they have to sell only those stocks that they already own. As a consequence, enhanced investors’ attention boosts only buying pressure, but not the selling pressure, leading to a net increase in stock prices and market returns. However, this increase is temporary and reverses in the near future. For example, building on the arguments of Barber and Odean (2008), Da et al. (2011) use a sample of Russell 3000 stocks from 2004 to 2008 and show that an increase in GSV of a specific stock predicts higher returns of that stock in the next two weeks and an eventual return reversal within the year. Overall, these studies suggest that enhanced investors’ attention destabilizes the markets due to the additional noise trading, boosts stock return predictability and thus contributes to market inefficiency.
Notwithstanding the above arguments, Vozlyublennaia (2014) postulates that investors’ attention results in a higher probability of any information being incorporated into stock prices and thus, it actually reduces stock return predictability and increases market efficiency. She suggests investors’ attention might result in either positive or negative market reaction depending on the nature of the information. A handful of recent studies have supported the idea that enhanced investors’ attention may also result in negative returns.
For instance, Yuan (2015) found that higher market attention results in lower returns dramatically when the level of the stock market is high. He argues that enhanced attention makes investors more active and causes individual investors to reduce stock positions, either by selling stocks or by redeeming mutual fund shares. This selling pressure generates lower stock returns. He argues that the attention theory of Barber and Odean (2008) is applicable only to new investors but not to existing ones. Existing investors already hold stocks and sell their holdings due to the disposition effect or rebalancing needs as the market gets more attention.
Da et al. (2015) find that investors’ sentiment, measured with the FEARS index, which is calculated by households’ Google searches of several keywords linked with the economy, results in low returns the same day, although some reversal occurs in later days. Likewise, Bijl et al. (2016) find that higher attention, measured with GSV, to a specific stock predicts significantly negative returns in the next five weeks, a finding that is opposite to the Da et al. (2011). Bijl et al. (2016) argue that one potential reason behind their opposite results might be their sample period, which spans from 2008 to 2013 and includes weaker economic conditions due to the effects of the global financial crisis of 2007–2009. The results also change depending on the market context. Different from the above studies, which employ US stock market data, Takeda and Wakao (2014) analyze the impact of GSV on 189 Japanese firms’ stocks over the period 2008–2011 and find that attention seems to not have significant positive effect on stock returns, the results also not supporting the attention theory.
Since COVID-19 created unprecedented uncertainty and brought enormous economic costs due to the social distancing measures to contain and control the contagion, higher attention to this event is expected to create selling pressure from existing shareholders due to the disposition effect or portfolio rebalancing needs. Dzielinski (2012) notes that investors react to uncertainty by selling risky assets and requiring high risk premiums afterwards. Thus, we postulate the following hypothesis.
Hypothesis 1.
Investors’ higher attention to the COVID-19 pandemic results in negative stock market returns.

2.3. Uncertainty Avoidance and Stock Returns

Lemieux and Peterson (2011) notes that economic psychology literature has consistently found that consumers respond to greater uncertainty by increasing their search for information. And this search continues as long as its marginal benefit increases its cost. The cultures where uncertainty avoidance is higher are likely to fall in this paradigm. According to Hofstede and Bond (1984), uncertainty avoidance is the extent to which people of a culture feel threatened by uncertain/unknown situations and the extent to which they try to minimize this uncertainty. People with high uncertainty avoidance feel anxious about uncertainty. They react quickly and try to mitigate uncertainty. As these people are expected to be more risk averse, they would also increase attention by seeking more information. Vlastakis and Markellos (2012) note that investors demand more information with an increase in their risk aversion attitude. On the other hand, people with low uncertainty avoidance face uncertainty without panic and react slowly to such situations.
Existing literature suggests that culture is shared as well as situational, and specific cultural values have a more important effect in specific contexts (Licht et al. 2005; Orihara and Eshraghi 2019). Ashraf (2020c) suggests the national culture has significant influence on how investors react to any news in the stock market. Specifically, he shows that investors who possess higher uncertainty avoidance cultural values react more strongly to COVID-19 cases in terms of negative stock market returns. We expect that the decrease in stock returns in response to higher investors’ attention is likely to be stronger in those countries where investors possess higher values of uncertainty avoidance. Thus, we postulate the following hypothesis.
Hypothesis 2.
The negative impact of investors’ enhanced attention to COVID-19 on stock market returns is likely to be strong in countries with higher uncertainty avoidance culture.

3. Data and Methodology

3.1. Data

Our sample includes data for 34 countries over the period from January 23 to June 12, 2020. The data for Google search volume (GSV) for each country is downloaded from Google Trends. We used “coronavirus” as the keyword for each country to find out the attention being paid to COVID-19. The GSV index ranges between 0 to 100, where 0 represents the lowest attention and 100 shows the highest attention paid to the keyword.
The daily data for stock indexes is obtained from the DataStream database. The uncertainty avoidance index is taken from Hofstede’s framework of national culture. “It indicates to what extent a culture programs its members to feel either uncomfortable or comfortable in unstructured situations” (Hofstede 2011). The index ranks countries from 0 to 100, where 0 represents the lowest uncertainty avoidance while 100 is for the highest uncertainty avoidance.
Cases growth is the daily logarithmic change in numbers of COVID-19 confirmed cases in each country. Data for COVID-19 confirmed cases is taken from the website https://ourworldindata.org/coronavirus. Democratic accountability is taken from the International Country Risk Guide (ICRG) database and it ranks countries based on the type of government, where alternating democracy gets the highest points (6) followed by dominated democracy, de facto one-party state, de jure one-party state and autarchy gets the lowest score of 1. It measures “how responsive government is to its people, on the basis that the less responsive it is, the more likely it is that the government will fall, peacefully in a democratic society, but possibly violently in a non-democratic one” (Llewellyn and Howell 2011). Investment freedom is taken from the Heritage Foundation’s website and represents the free flow of capital among markets. Heritage Foundation (www.heritage.org) refers to investment freedom as “Individuals and firms would be allowed to move their resources into and out of specific activities, both internally and across the country’s borders, without restriction”. Log (GDP) is taken from the World Development Indicators (WDI) of World Bank and controls for the level of economic development.

3.2. Methodology

To select an appropriate method for empirical analysis, we first tested the stationarity of our variables by using the unit root test of Im et al. (2003) and found our main variables of interest are stationary. To select an appropriate model for panel analysis, we followed Busu (2019) and performed the Lagrange multiplier (LM) test. We chose a pooled panel regression model because the Lagrange multiplier Breusch–Pagan test favors a pooled panel model over a random-effects model. Tests of these results are reported in Appendix A Table A1 and Table A2. This model choice is consistent with recent studies (Elmenhorst et al. 2019; Moncatar et al. 2020; Ashraf 2020b). We cannot use a fixed-effect panel estimator because our model also includes time-invariant variables. Specifically, our baseline model is as follows
R S E i t = α c + γ 1 Δ G S V i t + J = 1 J β J X i J + t = 1 T 1 ε t D t + ε i t
where RSE is the stock market returns of country i at time t, calculated as Log(Priceit/Priceit−1). Δ G S V i t is the log change in the Google Search Volume of country i at time t, calculated as Log(GSVit/GSVit1). Different variables can affect stock returns cross-sectionally, hence, a set of control variables (represented by X in Equation (1) is included to cater this issue. The control variables include growth in confirmed cases, investment freedom index, uncertainty avoidance index, democratic accountability, growth in the numbers of confirmed cases, and Log (GDP), as defined in the previous section. Dt is the set of time dummy variables to control for factors that affect stock markets on a daily basis. ε i t is an error term. We expect reverse causality is less a concern in our model because of the exogenous nature of the COVID-19 crisis, which originated from health concerns. That is, investors’ attention to the coronavirus actually led to a fall in stock prices but not the other way around.
To examine the second hypothesis, we modify Equation (1) as follows:
R S E i t = α c + γ 1 Δ G S V i t + γ 2 Δ G S V i t × U n c e r t a i n t y   A v o i d a n c e i + J = 1 J β J X i J + t = 1 T 1 ε t D t + ε i t
Here, the interaction term ΔGSVit × Uncertainty Avoidancei is the variable of main interest, where the γ2 coefficient explains whether stock market reaction towards investors’ attention is moderated by uncertainty avoidance.

4. Results and Discussion

Table 1 presents the summary statistics for our variables. The RSE (i.e., stock market returns) variable shows negative returns, which indicates markets declined during our sample period. The minimum and maximum values are indicating large dispersions in stock returns, which is quite understandable due to the large fluctuations during the sample period. The high standard deviation value of GSV indicates large fluctuations in investors’ attention during the sample period. Table A5 in Appendix A presents summary statistics for individual countries.
Table 2 presents a pairwise correlation analysis for all the variables included in the analysis. Our main variable, GSV, is negatively and significantly correlated with stock returns. Other variables also show a negative correlation with returns of stock markets.
Table 3 presents the main results of the panel regression analysis. The first model (1) is the baseline specification where we include the cases growth variable only. Cases growth has significant and negative impact on stock returns, a finding that is consistent with recent studies (Al-Awadhi et al. 2020; Ashraf 2020b) and validates our model for further analyses.
Model (2) is the main specification to test the first hypothesis. It is evident that a change in GSV has a significant and negative impact on stock returns, suggesting that an increase in investors’ attention results in lower stock market returns. This finding is in line with Dzielinski (2012) and Yuan (2015). The finding is also in line with our assumption that selling pressure is more likely to prevail in the market due to the high uncertainty generated by COVID-19. The finding contradicts the attention theory of Barber and Odean (2008), which states that increased investors’ attention generates buying pressure. We argue that due to the deteriorating situation in stock markets around the globe, the probability of new buyers entering the market decreased during COVID-19. Hence, existing shareholders become more active due to increased attention and they sold their holdings due to the dispositions effect or rebalancing needs in accordance with the proposition of Yuan (2015). Uncertainty avoidance enters the negative, though is insignificant, showing that investors in countries with higher uncertainty avoidance are selling shares at relatively lower prices.
Model (3) presents the results where we include an interaction term. The interaction term is significant and negative suggesting that the negative impact of growth in investors’ attention on stock market returns is stronger for countries with higher uncertainty avoidance. These findings validate our second hypothesis, that national culture plays a moderating role in the investors’ attention and stock market relationship.
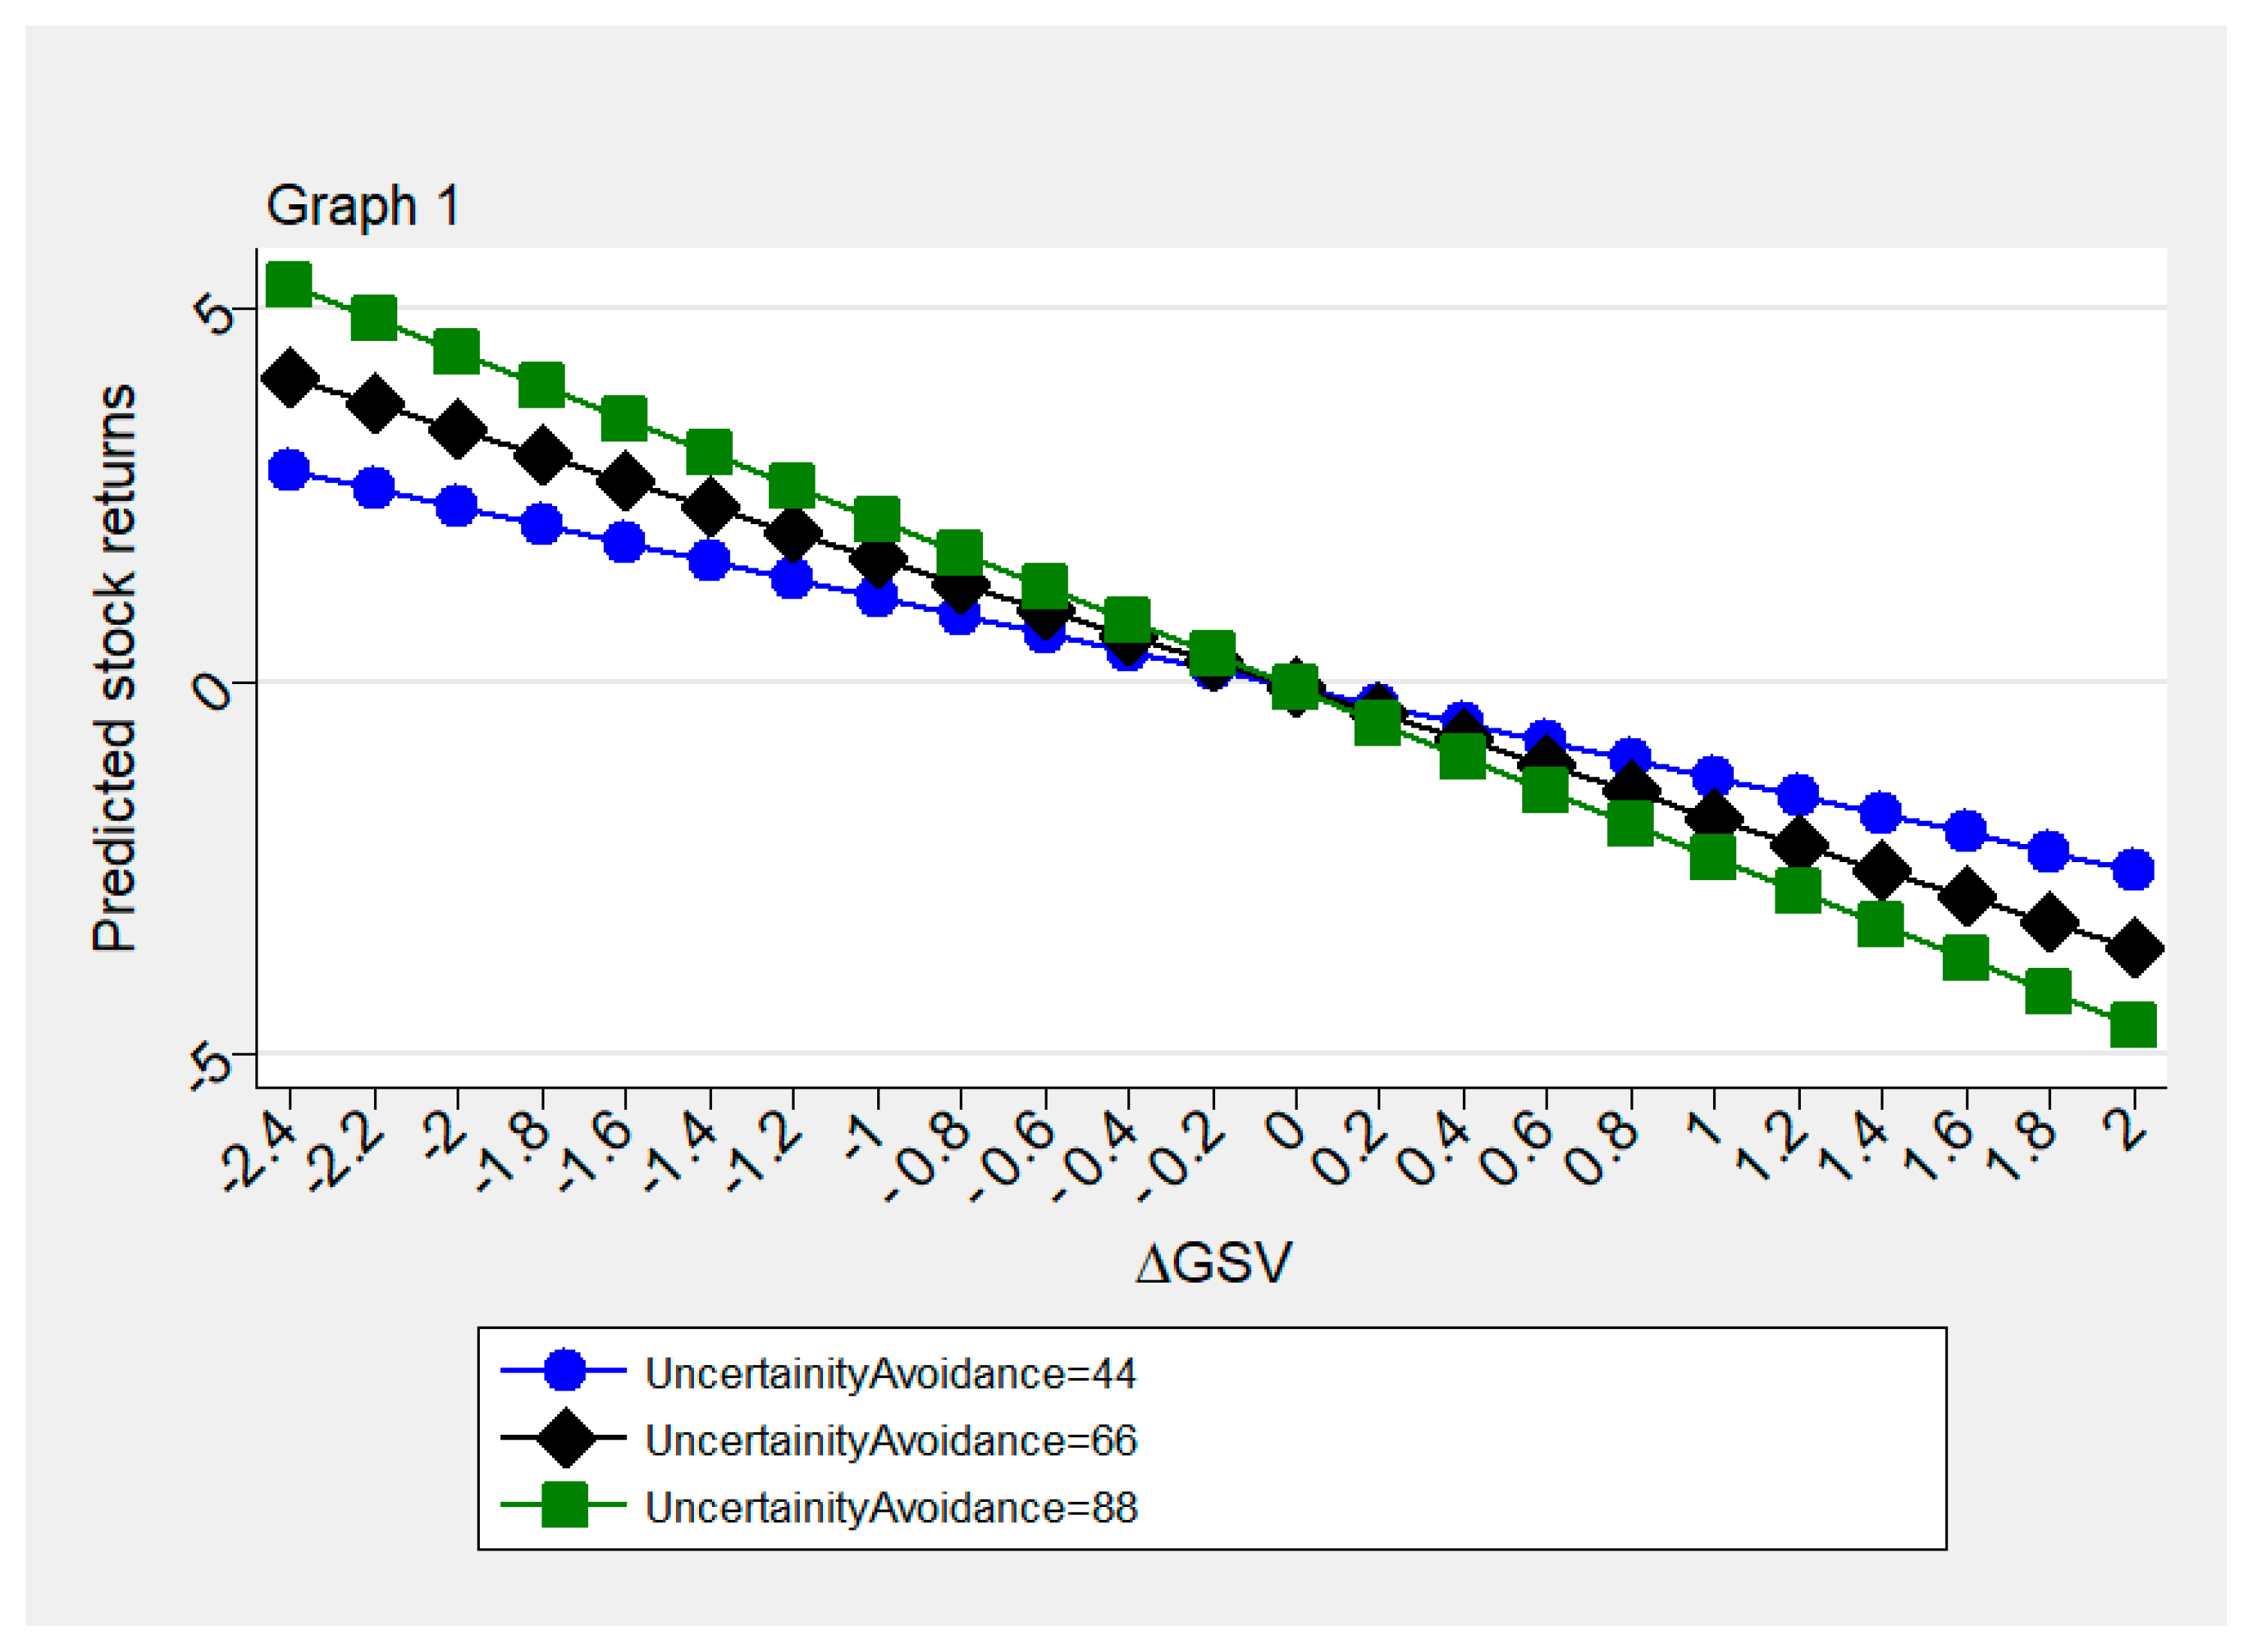
To further elaborate this moderation effect, we present the relationship between the stock market and investors’ attention by drawing a graph (Figure 3) from Model (3) and Table 3. The graph is formulated by using the mean and ±1 standard deviation of ∆GSV and stock returns. The line (L2) with the embedded rhombus depicts a mean value for the uncertainty avoidance index, while the line (L1) with embedded circles represents the lower values of the index and line (L3) with the embedded squares represents the highest values of the uncertainty avoidance index. All the lines are downward sloped, which shows that stock returns and investors’ attention has a negative relationship. As we move from L1 to L3 we can observe that lines are becoming steeper (L1) to the steepest (L3). This implies that the negative relationship between investors’ attention and stock returns is getting stronger as uncertainty avoidance is increasing. Thus, we can conclude that investors’ attention has a more negative impact on stock returns for countries with higher uncertainty avoidance. Considering that people in countries with high uncertainty avoidance like to mitigate uncertainty on priority basis, it is understandable that such investors are lured towards selling their shares to reduce the uncertainty caused by COVID-19.
We use several robustness checks for our estimated results. At first, we used two global factors as additional control variables to control for global equity and volatility factors that can influence stock returns. The first factor is the All Countries World Index (ACWI) by Morgan Stanley Capital International (MSCI). It is the flagship global equity index of MSCI, and it represents the set of large- and mid-cap stocks across 23 developed and 26 emerging markets. As of December 2019, it covers more than 3000 constituents across 11 sectors and approximately 85% of the free float-adjusted market capitalization in each market. The index has been used as a benchmark for global equity markets in previous studies as well (e.g., García Petit et al. 2019). The second factor is the Volatility Index (VIX) of the Chicago Board Options Exchange (CBOE). The CBOE has computed the index since 1993 “to measure market expectations of the near-term volatility implied by stock index option prices” (Fernandes et al. 2014). Previous studies e.g., Marfatia (2020) suggest that the VIX has a significant impact on the US and other leading stock markets. Table A4 in Appendix A presents results after controlling for these global factors. The results are largely consistent with our main findings in Table 3.
As a second robustness check, we used random effect panel analysis. Specifically, we re-estimated all models of Table 3 with a panel random-effects model. Table A5 in Appendix A presents the results for this analysis. Column 1 shows results for cases growth as an independent variable. Columns 2 and 3 present results without and with an interaction term, respectively. The findings are consistent with our previous findings in Table 3.

5. Conclusions

We investigated the relationship between investors’ attention and stock market returns during the COVID-19 pandemic. To proxy investors’ attention, Google search volume (GSV) data from Google Trends is used. The motivation behind using this measure lies in the literature, which supports that this measure provides timely and action-oriented behavior of investors. For empirical analysis, we used daily data from 34 countries over the period January 23 to June 12, 2020. We found that investors’ higher attention to COVID-19 led to negative market returns. These findings contradict the attention theory (i.e., Barber and Odean 2008; Da et al. 2011) which predicts a positive relationship between investors’ enhanced attention and stock market returns based on the notion that an increase in investors’ attention increases share prices and hence returns. However, our findings are in line with the results of Yuan (2015), who argues that attention theory is more applicable to new investors, and existing investors increase selling due to the disposition effect or portfolio rebalancing needs.
We further extended our analysis by including uncertainty avoidance as a moderating variable. Our findings from this analysis show that national culture as measured by the uncertainty avoidance index has a significant moderating effect on the relationship between investors’ attention and stock market returns. These findings suggest that national culture is an important factor for determining the stock market and investors’ attention relationship.
Overall, our findings have important implications for attention theory by showing that investors’ enhanced attention to an adverse shock, even one that originates in the health sector, leads to negative returns in financial markets. Our analysis suggests enhanced attention would not always lead to positive returns especially if attention increases during the crisis. Further, the influence of cultural values of individuals cannot be neglected even though investors try to base their decisions on more sophisticated information collection by paying higher attention.
One limitation of this study is that our proxy of GSV just considers the term “coronavirus” while several other terms, such as COVID-19, have also been widely used during the pandemic. Future research may construct a more comprehensive proxy of investors’ attention.

Author Contributions

Conceptualization, F.S.; methodology, F.S.; data collection, formal analysis, F.S.; review and editing, B.N.A.; revision and draft update, M.S. All authors have read and agreed to the published version of the manuscript.

Funding

This research received no external funding.

Data Availability Statement

The data presented in this study are available on request from the corresponding author.

Acknowledgments

Authors are grateful to three anonymous reviewers and editor of the journal for their helpful and constructive comments.

Conflicts of Interest

The authors declare no conflict of interest.

Appendix A

Table A1. Stationarity test.
Test StatisticsProbability
∆GSV−35.50250.0000
Cases growth−23.44070.0000
RSE−34.47310.0000
This table reports results of Im et al. (2003) unit root test. The Ho: All panels contain unit roots is tested against Ha: Some panels are stationary. RSE represent stock returns. ∆GSV is natural logarithmic change in Google search volume. Cases growth is natural logarithmic growth in Number of Corona Cases.
Table A2. Breusch and Pagan Lagrangian multiplier test for random effects.
Coefficients 0.00
Probability 1.0000
The table presents results for Lagrangian multiplier test. The Ho: variance of random effects is zero is tested against Ha: variance of random effects is not zero.
Table A3. Panel regression results: robustness tests with additional controls.
(1)(2)(3)(4)
VariablesRSERSERSERSE
Cases growth−0.014 ***−0.014 ***−0.026 ***−0.026 ***
(0.000)(0.000)(0.000)(0.000)
∆GSV−0.495 ***0.466−0.975 ***−0.072
(0.004)(0.414)(0.000)(0.870)
Uncertainty avoidance−0.001−0.001 *−0.001−0.001
(0.122)(0.063)(0.363)(0.234)
∆GSV* Uncertainty Avoidance −0.015 * −0.014 **
(0.076) (0.038)
Democratic accountability 0.0200.0200.0380.038
(0.452)(0.459)(0.399)(0.402)
Investment freedom −0.001−0.002−0.002−0.002
(0.482)(0.468)(0.454)(0.434)
Log GDP0.0000.0000.0080.008
(0.992)(0.969)(0.608)(0.591)
CMSCI0.592 ***0.591 ***
(0.000)(0.000)
CVIX −0.097 ***−0.097 ***
(0.000)(0.000)
Constant−0.012−0.0020.1000.118
(0.985)(0.998)(0.882)(0.860)
Observations2684268425282528
Countries34343434
Daily fixed-effects YESYESYESYES
Table A3 presents the results for Equation (1). RSE represent stock returns. ∆GSV is the natural logarithmic change in Google search volume. The interaction term ∆GSV* Uncertainty Avoidance is a variable of main interest, which explains whether stock market reaction towards investor attention is moderated by uncertainty avoidance. Control variables include an investment freedom index as a proxy for free capital markets, an uncertainty avoidance index as a proxy for national culture, democratic accountability as a proxy for type of government. Cases growth is a natural logarithmic growth in the number of coronavirus cases, and Log (GDP) is a proxy for economic development. CVIX and CMSCI are log changes in the Volatility Index (VIX) and Morgan Stanley Capital International (MSCI) indexes, and control for global equity and volatility, respectively. RSE, cases growth and GSV are winsorized at a 1% level to cater the problem of extreme values. p values in parentheses represents *** p < 0.01, ** p < 0.05, * p < 0.1.
Table A4. Panel regression results: robustness tests with random-effects model.
(1)(2)(3)(4)(5)
VariablesRSERSERSERSERSE
Cases growth −0.036 ***−0.014 ***−0.014 ***−0.026 ***−0.026 ***
(0.000)(0.000)(0.000)(0.000)(0.000)
∆GSV −0.495 ***0.466−0.975 ***−0.072
(0.004)(0.414)(0.000)(0.870)
Uncertainty avoidance −0.001−0.001 *−0.001−0.001
(0.122)(0.063)(0.363)(0.234)
GSV* Uncertainty Avoidance −0.015 * −0.014 **
(0.076) (0.038)
Democratic accountability 0.0200.0200.0380.038
(0.452)(0.459)(0.399)(0.402)
Investment freedom −0.001−0.002−0.002−0.002
(0.482)(0.468)(0.454)(0.434)
Log GDP 0.0000.0000.0080.008
(0.992)(0.969)(0.608)(0.591)
CMSCI 0.592 ***0.591 ***
(0.000)(0.000)
CVIX −0.097 ***−0.097 ***
(0.000)(0.000)
Constant0.625−0.012−0.0020.1000.118
(0.272)(0.985)(0.998)(0.882)(0.860)
Observations26842684268425282528
Countries3434343434
Daily fixed-effectsYESYESYESYESYES
Table A4 presents the results for Equation (1). RSE represent stock returns. ∆GSV is the natural logarithmic change in Google search volume. The interaction term ∆GSV* Uncertainty Avoidance is a variable of main interest, which explains whether stock market reaction towards investor attention is moderated by uncertainty avoidance. Control variables include an investment freedom index as a proxy for free capital markets, uncertainty avoidance index as a proxy for national culture and democratic accountability as a proxy for type of government. Cases growth is the natural logarithmic growth in the number of coronavirus cases and Log (GDP) is a proxy for economic development. CVIX and CMSCI are log changes in the VIX and MSCI indexes, and control for global equity market returns and volatility, respectively. RSE, Cases growth and GSV are winsorized at a 1% level to cater the problem of extreme values. p values in parentheses *** p < 0.01, ** p < 0.05, * p < 0.1.
Table A5. Summary statistics for individual countries.
CountryObservationsCountry-Level Mean Values
RSEGSVCases Growth
Austria77−0.3230.00511.748
Belgium93−0.2190.00811.825
Brazil77−0.1690.00717.657
Bulgaria66−0.0040.0129.225
Chile72−0.121−0.00116.591
China1010.039−0.0281.801
Colombia640.271−0.00110.574
Croatia720.0120.00510.209
Czech Republic74−0.100−0.00410.946
Denmark760.0570.00212.363
Estonia680.006−0.0037.380
France99−0.1940.00910.966
Germany98−0.1110.00712.379
Hungary69−0.0260.0039.021
Iceland740.0510.0028.650
Indonesia65−0.018−0.0089.679
Ireland70−0.1080.00812.760
Israel74−0.0900.01711.017
Italy95−0.2180.01411.867
Latvia690.0640.0138.549
Lithuania660.2220.0057.317
Malaysia97−0.0340.0027.660
Peru69−0.0420.00414.973
Philippines91−0.072−0.0139.768
Poland690.1380.01111.376
Portugal73−0.1540.00313.419
Romania72−0.1250.01212.872
Russia94−0.1200.01213.228
Slovenia69−0.0820.0069.629
South Africa680.2060.01715.234
Spain94−0.2770.01113.193
Sweden94−0.098−0.00311.473
United Kingdom95−0.1860.01012.515
United States1010.0190.00714.377
This table reports the sample countries along with the number of observations and the key summary statistics from each country. RSE represent stock returns. ∆GSV is natural logarithmic change in Google search volume. Cases growth is the natural logarithmic growth in the number of coronavirus cases.

References

  1. Al-Awadhi, Abdullah M., Khaled Alsaifi, Ahmad Al-Awadhi, and Salah Alhammadi. 2020. Death and Contagious Infectious Diseases: Impact of the COVID-19 Virus on Stock Market Returns. Journal of Behavioral and Experimental Finance 27: 100326. [Google Scholar] [CrossRef] [PubMed]
  2. Andrei, Daniel, and Michael Hasler. 2015. Investor Attention and Stock Market Volatility. Review of Financial Studies 28: 33–72. [Google Scholar] [CrossRef]
  3. Ashraf, Badar Nadeem. 2020a. Economic Impact of Government Interventions during the COVID-19 Pandemic: International Evidence from Financial Markets. Journal of Behavioral and Experimental Finance 27: 100371. [Google Scholar] [CrossRef] [PubMed]
  4. Ashraf, Badar Nadeem. 2020b. Stock Markets’ Reaction to COVID-19: Cases or Fatalities? Research in International Business and Finance 54. [Google Scholar] [CrossRef]
  5. Ashraf, Badar Nadeem. 2020c. Stock Markets’ Reaction to COVID-19: Moderating Role of National Culture. Finance Research Letters. in press. [Google Scholar] [CrossRef]
  6. AZİMLİ, Asil. 2020. The Impact of COVID-19 on the Degree of Dependence and Structure of Risk-Return Relationship: A Quantile Regression Approach. Finance Research Letters 36: 101648. [Google Scholar] [CrossRef]
  7. Barber, Brad M., and Terrance Odean. 2008. All That Glitters: The Effect of Attention and News on the Buying Behavior of Individual and Institutional Investors. Review of Financial Studies 21: 785–818. [Google Scholar] [CrossRef] [Green Version]
  8. Bijl, Laurens, Glenn Kringhaug, Peter Molnár, and Eirik Sandvik. 2016. Google Searches and Stock Returns. International Review of Financial Analysis 45: 150–56. [Google Scholar] [CrossRef]
  9. Bilgin, Mehmet Huseyin, Ender Demir, Giray Gozgor, Gokhan Karabulut, and Huseyin Kaya. 2019. A Novel Index of Macroeconomic Uncertainty for Turkey Based on Google-Trends. Economics Letters 184: 108601. [Google Scholar] [CrossRef]
  10. Busu, Mihail. 2019. The Role of Renewables in a Low-Carbon Society: Evidence from a Multivariate Panel Data Analysis at the Eu Level. Sustainability 11: 5260. [Google Scholar] [CrossRef] [Green Version]
  11. Butt, Hilal A., Falik Shear, and Mohsin Sadaqat. 2020. Investor Attention towards coronavirus and response of Stock and Sovereign Credit Default Swaps Markets. SSRN Electronic Journal. [Google Scholar] [CrossRef]
  12. Corbet, Shaen, Yang Hou, Yang Hu, Brian Lucey, and Les Oxley. 2020. Aye Corona! The Contagion Effects of Being Named Corona during the COVID-19 Pandemic. Finance Research Letters, 101591. [Google Scholar] [CrossRef] [PubMed]
  13. D’Amuri, Francesco, and Juri Marcucci. 2017. The Predictive Power of Google Searches in Forecasting US Unemployment. International Journal of Forecasting 33: 801–16. [Google Scholar] [CrossRef]
  14. Da, Zhi, Joseph Engelberg, and Pengjie Gao. 2011. In Search of Attention. Journal of Finance 66: 1461–99. [Google Scholar] [CrossRef]
  15. Da, Zhi, Joseph Engelberg, and Pengjie Gao. 2015. The Sum of All FEARS Investor Sentiment and Asset Prices. Review of Financial Studies 28: 1–32. [Google Scholar] [CrossRef] [Green Version]
  16. Derkacz, Arkadiusz J. 2020. Fiscal, Investment and Export Multipliers and the COVID-19 Pandemic Slowdowns Uncertainty Factor in the First Half of 2020. Risks 8: 122. [Google Scholar] [CrossRef]
  17. Dzielinski, Michal. 2012. Measuring Economic Uncertainty and Its Impact on the Stock Market. Finance Research Letters 9: 167–75. [Google Scholar] [CrossRef] [Green Version]
  18. Elmenhorst, Eva Maria, Barbara Griefahn, Vinzent Rolny, and Mathias Basner. 2019. Comparing the Effects of Road, Railway, and Aircraft Noise on Sleep: Exposure–Response Relationships from Pooled Data of Three Laboratory Studies. International Journal of Environmental Research and Public Health 16: 1073. [Google Scholar] [CrossRef] [Green Version]
  19. Erdem, Orhan. 2020. Freedom and Stock Market Performance during COVID-19 Outbreak. Finance Research Letters 36: 101671. [Google Scholar] [CrossRef]
  20. Fernandes, Marcelo, Marcelo C. Medeiros, and Marcel Scharth. 2014. Modeling and Predicting the CBOE Market Volatility Index. Journal of Banking and Finance 40: 1–10. [Google Scholar] [CrossRef]
  21. García Petit, Juan José, Esther Vaquero Lafuente, and Antonio Rúa Vieites. 2019. How Information Technologies Shape Investor Sentiment: A Web-Based Investor Sentiment Index. Borsa Istanbul Review 19: 95–105. [Google Scholar] [CrossRef]
  22. Goodell, John W. 2020. COVID-19 and Finance: Agendas for Future Research. Finance Research Letters 35: 101512. [Google Scholar] [CrossRef] [PubMed]
  23. Hofstede, Geert, and Michael H. Bond. 1984. Hofstede’s culture dimensions: An independent validation using Rokeach’s value survey. Journal of Cross-Cultural Psychology 15: 417–33. [Google Scholar] [CrossRef]
  24. Hofstede, Geert. 2011. Dimensionalizing Cultures: The Hofstede Model in Context. Online Readings in Psychology and Culture 2: 1–26. [Google Scholar] [CrossRef]
  25. Howell, Llewellyn D. 2011. International Country Risk Guide Methodology. Available online: https://www.prsgroup.com/ (accessed on 10 November 2020).
  26. Huberman, Gur, and Tomer Regev. 2001. Contagious Speculation and a Cure for Cancer: A Nonevent That Made Stock Prices Soar. Journal of Finance 56: 387–96. [Google Scholar] [CrossRef]
  27. Im, Kyung So, M. Hashem Pesaran, and Yongcheol Shin. 2003. Testing for Unit Roots in Heterogeneous Panels. Journal of Econometrics 115: 53–74. [Google Scholar] [CrossRef]
  28. Kahneman, Daniel. 1973. Attention and Effort. The American Journal of Psychology 88: 339–40. [Google Scholar] [CrossRef]
  29. Lahmiri, Salim, and Stelios Bekiros. 2020. The Impact of COVID-19 Pandemic upon Stability and Sequential Irregularity of Equity and Cryptocurrency Markets. Chaos, Solitons and Fractals 138: 109936. [Google Scholar] [CrossRef]
  30. Lemieux, James, and Robert A. Peterson. 2011. Purchase Deadline as a Moderator of the Effects of Price Uncertainty on Search Duration. Journal of Economic Psychology 32: 33–44. [Google Scholar] [CrossRef]
  31. Licht, Amir N., Chanan Goldschmidt, and Shalom H. Schwartz. 2005. Culture, Law, and Corporate Governance. International Review of Law and Economics 25: 229–55. [Google Scholar] [CrossRef]
  32. Marfatia, Hardik A. 2020. Investors’ Risk Perceptions in the US and Global Stock Market Integration. Research in International Business and Finance 52: 101169. [Google Scholar] [CrossRef]
  33. Mazur, Mieszko, Man Dang, and Miguel Vega. 2020. COVID-19 and March 2020 Stock Market Crash. Evidence from S&P1500. SSRN Electronic Journal, 101690. [Google Scholar] [CrossRef]
  34. Mišečka, Tomáš, Pavel Ciaian, Miroslava Rajčániová, and Jan Pokrivčák. 2019. In Search of Attention in Agricultural Commodity Markets. Economics Letters 184: 108668. [Google Scholar] [CrossRef]
  35. Moncatar, T. J. Robinson, Keiko Nakamura, Kathryn Lizbeth Siongco, Mosiur Rahman, and Kaoruko Seino. 2020. Prevalence and Determinants of Self-Reported Injuries among Community-Dwelling Older Adults in the Philippines: A 10-Year Pooled Analysis. International Journal of Environmental Research and Public Health 17: 4372. [Google Scholar] [CrossRef] [PubMed]
  36. Monica-violeta, Achim, Viorela Ligia Vaidean, Borlea Sorin, and Decebal Remus Florescu. 2020. The Lesson of COVID-19 Pandemic for Democracy within Cultural Context. vol. 50, pp. 1–46. [Google Scholar] [CrossRef]
  37. Okorie, David Iheke, and Boqiang Lin. 2020. Stock Markets and the COVID-19 Fractal Contagion Effects. Finance Research Letters, 101640. [Google Scholar] [CrossRef]
  38. Onali, Enrico. 2020. COVID-19 and Stock Market Volatility. SSRN Electronic Journal, 1–24. [Google Scholar] [CrossRef]
  39. Orihara, Masanori, and Arman Eshraghi. 2019. Corporate Governance Compliance and Firm Value: A Cultural Perspective. SSRN Electronic Journal, 1–49. [Google Scholar] [CrossRef]
  40. Panyagometh, Kamphol. 2020. The Effects of Pandemic Event on the Stock Exchange of Thailand. Economies 8: 90. [Google Scholar] [CrossRef]
  41. Peltomäki, Jarkko, Michael Graham, and Anton Hasselgren. 2018. Investor Attention to Market Categories and Market Volatility: The Case of Emerging Markets. Research in International Business and Finance 44: 532–46. [Google Scholar] [CrossRef]
  42. Salisu, Afees A., Ahamuefula E. Ogbonna, and Adeolu Adewuyi. 2020. Google Trends and the Predictability of Precious Metals. Resources Policy 65: 101542. [Google Scholar] [CrossRef]
  43. Smales, L. A. 2020. Investor Attention and the Response of US Stock Market Sectors to the COVID-19 Crisis. Review of Behavioral Finance. [Google Scholar] [CrossRef]
  44. Smith, Geoffrey Peter. 2012. Google Internet Search Activity and Volatility Prediction in the Market for Foreign Currency. Finance Research Letters 9: 103–10. [Google Scholar] [CrossRef]
  45. Swamy, Vighneswara, M. Dharani, and Fumiko Takeda. 2019. Investor Attention and Google Search Volume Index: Evidence from an Emerging Market Using Quantile Regression Analysis. Research in International Business and Finance 50: 1–17. [Google Scholar] [CrossRef]
  46. Takeda, Fumiko, and Takumi Wakao. 2014. Google Search Intensity and Its Relationship with Returns and Trading Volume of Japanese Stocks. Pacific Basin Finance Journal 27: 1–18. [Google Scholar] [CrossRef]
  47. Vlastakis, Nikolaos, and Raphael N. Markellos. 2012. Information Demand and Stock Market Volatility. Journal of Banking and Finance 36: 1808–21. [Google Scholar] [CrossRef]
  48. Vosen, Simeon, and Torsten Schmidt. 2011. Forecasting Private Consumption: Survey-Based Indicators vs. Google Trends. Journal of Forecasting 30: 565–78. [Google Scholar] [CrossRef] [Green Version]
  49. Vozlyublennaia, Nadia. 2014. Investor Attention, Index Performance, and Return Predictability. Journal of Banking and Finance 41: 17–35. [Google Scholar] [CrossRef]
  50. Yuan, Yu. 2015. Market-Wide Attention, Trading, and Stock Returns. Journal of Financial Economics 116: 548–64. [Google Scholar] [CrossRef]
  51. Zhang, Dayong, Min Hu, and Qiang Ji. 2020. Financial Markets under the Global Pandemic of COVID-19. Finance Research Letters. [Google Scholar] [CrossRef]
Figure 1. Movements of coronavirus cases and the Dow Jones Industrial Index during the COVID-19 period. Sources: https://www.investing.com; https://ourworldindata.org/coronavirus-data.
Risks 09 00002 g001
Figure 2. Movements of Google search volume (GSV) and the Dow Jones Industrial Index during the COVID-19 period. Sources: https://www.investing.com; https://trends.google.com/trends.
Risks 09 00002 g002
Figure 3. Relationship between stock returns and the change in investors’ attention considering different levels of uncertainty avoidance. The graph is formulated by using the mean and ±1 standard deviation of ∆GSV and stock returns. The line (L2) with the embedded rhombus depicts the mean value for the uncertainty avoidance index, while the line (L1) with embedded circles represents the lower values of the index and line (L3) with the embedded squares represents the highest values of the uncertainty avoidance index.
Risks 09 00002 g003
Table 1. Summary statistics.
VariableNMeanSDMinMax
RSE2684−0.0642.703−18.54113.009
∆GSV2684−0.0200.248−1.7152.862
Cases growth268411.27521.617−7.522378.419
Uncertainty avoidance268466.42222.6272399
Investment freedom268471.88017.8952090
Democracy accountability26845.2351.0951.56
Log GDP268426.8711.65723.92230.601
The table presents summary statistics for different variables used in Equation (1). The N, Mean, SD, Min, and Max represent Number of observations, Minimum value, Standard Deviation, Mean value and Maximum values, respectively. RSE represents returns of stock markets, ∆GSV is the change in Google search volume. Investment freedom, uncertainty avoidance and democratic accountability are indexes and are proxies for free capital markets, for national culture and for type of government, respectively.
Table 2. Pairwise correlation analysis.
Variables1234567
1RSE1
2∆GSV−0.164 ***1
3Uncertainty avoidance−0.0120.0211
4Cases growth−0.277 ***0.454 **0.036 **1
5Investment freedom−0.0120.0210.075 ***0.0261
6Democratic accountability−0.0110.0250.096 ***0.041 **0.851 ***1
7Log GDP−0.015−0.039 **−0.205 ***−0.035 *−0.272 ***−0.227 ***1
This table presents results for a pairwise correlation analysis for different variables used in Equation (1). RSE represents returns of stock markets, ∆GSV is the change in Google search volume. Investment freedom, uncertainty avoidance and democratic accountability are indexes and are proxies for free capital markets, for national culture and for type of government, respectively. Cases growth is the natural logarithmic growth in the number of coronavirus cases, and Log (GDP) is a proxy for economic development. ***, **, * shows the level of significance at 1%, 5% and 10% respectively.
Table 3. Panel regression results.
(1)(2)(3)
VariablesRSERSERSE
Cases growth−0.037 ***−0.036 ***−0.036 ***
(0.000)(0.000)(0.000)
∆GSV −1.655 ***−0.178
(0.000)(0.822)
Uncertainty avoidance 0.000−0.000
(0.964)(0.758)
∆GSV* uncertainty avoidance −0.024 **
(0.043)
Democratic accountability 0.0720.072
(0.186)(0.190)
Investment freedom −0.003−0.004
(0.322)(0.311)
Log GDP 0.0020.002
(0.924)(0.897)
Constant0.6370.2040.218
(0.278)(0.782)(0.764)
Observations268426842684
R-squared0.1340.1540.156
Countries343434
Country fixed-effectsYES
Daily fixed-effectsYESYESYES
Table 3 presents the main results. RSE is a dependent variable and represents stock market returns. ∆GSV is a natural logarithmic change in Google search volume. The interaction term ∆GSV* uncertainty avoidance is a variable of main interest, which explains whether the relationship between investors’ attention and stock market returns is moderated by uncertainty avoidance. Control variables include an investment freedom index as a proxy for free capital markets, an uncertainty avoidance index as a proxy for national culture and democratic accountability as a proxy for type of government. Cases growth is the natural logarithmic growth in the number of coronavirus Cases, and Log (GDP) is a proxy for economic development. RSE, cases growth and GSV are winsorized ata 1% level to cater the problem of extreme values. p values in parentheses represent *** p < 0.01, ** p < 0.05.
Publisher’s Note: MDPI stays neutral with regard to jurisdictional claims in published maps and institutional affiliations.

