
How the COVID-19 Pandemic Affects Bank Risks and Returns: Evidence from EU Members in Central, Eastern, and Northern Europe


1
Institute of Finance, Cracow University of Economics, Rakowicka 27, 31-510 Krakow, Poland
2
Institute of Economics and Finance, Warsaw University of Life Sciences, Nowoursynowska 166, 02-787 Warszawa, Poland
*
Author to whom correspondence should be addressed.
Risks 2021, 9(10), 180; https://0-doi-org.brum.beds.ac.uk/10.3390/risks9100180
Submission received: 29 July 2021
/
Revised: 18 September 2021
/
Accepted: 27 September 2021
/
Published: 9 October 2021
(This article belongs to the Special Issue Financial Stability and Systemic Risk in Times of Pandemic)
Abstract
:The purpose of this study was to examine banks’ strategic adjustments to the challenges brought about by the COVID-19 pandemic. It examines how deep and pressing the necessary transformations are, based on an analysis of the banking sectors of Central, Eastern, and Northern European countries (CENE): the Czech Republic, Hungary, Poland, Slovakia, Estonia, Latvia, and Lithuania. The main research question posed asks how the pandemic and the subsequent economic crisis have changed banks’ sources of profits and risks, forcing banks to speed up structural transformations. In particular, the study identified and verified the following hypotheses: that the initial impact of the COVID-19 pandemic on banks in the analyzed region was heterogeneous and that the pandemic has intensified the challenges of digitalization and forced banks to speed up the digital transformations of their business models. The methodology employed was the dynamic panel data model—generalized method of moment (GMM-SYS version), using an adjusted dataset from the BankFocus database for unconsolidated bank data for the 2016–2020 period. The econometric analysis was supplemented with a CENE bank survey, researching bank attitudes and the stage of digital transformation. The results of the survey revealed that the majority of the surveyed banks consider themselves digitalization leaders, with a clearly articulated and implemented digitalization strategy. The main finding of the study was that the digital focus may help large banks in CENE to address and offset problems revealed by the panel data model: that traditional sources of incomes, based on intermediation and interest-related incomes, no longer contribute positively to profitability but also to stability.
1. Introduction
In spite of the fact that the financial industry was not at the center of the 2020 economic crisis, this sector has nevertheless been quite significantly affected. The COVID-19 pandemic has had a direct influence on the real economy and has created a number of vulnerabilities for the banking sector, such as the pushing out of bank loans in the form of public grants and subsidies, thereby endangering its corporate loans portfolio. It also triggered or strengthened structural changes within access channels and influenced changes in consumer preferences. Additionally, bank business models were threatened by the low interest rate environment, as well as by the low demand for credit and tight regulatory and compliance requirements, which imposed new costs and reduced bank operational flexibility.
There is a consensus within the banking literature that the COVID-19 pandemic and the related economic crisis has forced banks to change their business model (Carletti et al. 2020). Half of the European banking capital is located in banks with a return on equity of less than 4 percent, and this has already forced fundamental operating model changes: branch closures, staff members working from home, and procedures having to be redesigned overnight (Oliver Wyman 2021). The purpose of this study was to examine just how deeply and urgently changes are necessary, using an analysis of the banking sectors of central, eastern, and northern European countries (CENE): the Czech Republic, Hungary, Poland, Slovakia, Estonia, Latvia, and Lithuania. These countries have been members of the UE since 2004, and the final four belong to the Eurozone. All are characterized by a bank-based financial sector model and are at a similar stage of banking sector development (NBP 2020). Moreover, all are characterized by an open attitude towards digital transformation (Raiffeisen Research 2020).
Specifically, the study focused on the consequences of the 2020 crisis for CENE bank profitability and stability. Banks are for-profit companies characterized by a direct responsibility towards their shareholders, and efficiency in generating profits is their primary business objective (Berger and Humphrey 1997; Fiordelisi 2007). Banks are also public institutions, with a direct responsibility for stimulating economic growth by efficient credit distribution, which also constitutes an important dimension in assessing bank performance (De Haas et al. 2010; Beck et al. 2000; Keen 2017). Finally, the financial crisis of 2008 made it clear how important both bank stability and systemic risk avoidance are (Allen and Carletti 2013). Consequently, the main research question posed was how the COVID-19 pandemic and the subsequent economic crisis have changed a bank’s source of profit and risks, forcing banks to speed up their structural transformations, and in this process what the role of the digital transformation was.
In particular, the study identified and verified the following hypotheses:
- -
- that the initial COVID-19 impact on banks in the analyzed region studied was heterogeneous, affecting certain countries strongly, while leaving others initially unaffected,
- -
- that the pandemic has intensified the challenges of digitalization and forced banks to speed up the digital transformations in their business models.
In the empirical section, this study analyzed banking sector profitability and stability in seven CENE countries. The methodology employed was a dynamic panel data model: the generalized method of moment, commonly referred to as GMM, in the GMM-SYS version, using an adjusted dataset from the BankFocus database for unconsolidated bank data for the 2016–2020 period. The econometric analysis was supplemented by a CENE bank survey researching into their attitude and stage of digital transformation, and was it responded to predominantly by the largest banks in the region, possessing about 70% of the region’s asses. The survey revealed that the majority of the surveyed banks consider themselves to be digitalization leaders, with a clearly articulated and implemented digitalization strategy. Consequently, the main finding of the study was that the digital focus may assist large banks in CENE to address and offset problems revealed by the panel data model, in particular, that traditional sources of income, based on intermediation and interest-related incomes, no longer contribute positively to profitability and also to stability.
The structure of this article is as follows: Section 2 contains a literature review of the consequences of the pandemic and an overview of bank performance in the CENE region; Section 3 provides an analysis of the impact of the COVID-19 pandemic on consumer preferences; Section 4 analyses the results of a bank digitalization survey; Section 5 provides a detailed analysis of CENE bank performance using aggregated performance and stability indices: multilevel performance score, financial stability index, and Z-score; and Section 6 explains the construction and provides the interpretation of the panel data model. The concluding section summarizes the key findings and suggests the direction of future research.
2. COVID-19 Shock and Bank Resilience in CENE
During the global financial crisis of 2008, the Central and Eastern European region proved to be very resilient, comparable to Western European banking sectors, owning to the sound capitalization, tight regulation, and high profitability achieved before the crisis (Horobet et al. 2021; Demirguc-Kunt et al. 2010). However, the crisis has changed the attitude towards bank assessment, by stressing the importance of bank stability and risk control (Allen et al. 2009) and proper capitalization (Demirgüç-Kunt and Huizinga 2010). Thus, on the supply-side, banks both globally and in CENE entered the 2020 global economic crisis with strong and stable performance. On the demand side, the pandemic strengthened trends in consumer behavior towards digitally based products and operations, highlighting the advantages of the alternative business models of fintech firms.
The pandemic directly contributed to economic and real-sector shock but has also indirectly impacted the financial sector. Pandemic-related restrictions imposed burdens on enterprises, lowering GDP growth and investments and also threatening the growth of the NPL portfolio. The low interest-rate environment also forced banks to look for non-interest-bearing sources of income. The supply shock was accompanied by a demand shock, as consumer preferences and habits were also transformed by the pandemic. The supply shock might have been more devastating were it not for the substantial fiscal and monetary stimuli in all major countries, which stabilized the economies at the cost of a growing public debt (European Parliament 2021).
The banking sectors in the CENE region represent bank-based systems (NBP 2020). As a result of transition processes, banking markets are dominated by foreign, mostly EU-headquartered banks, with the exception of Poland, which due to the “re-polonisation” strategy of recent years, have today achieved a balanced structure with foreign capital representing 45% of banking sector assets. Both banking markets and the largest banks in CENE are much smaller than in the Eurozone countries (Table 1).
CENE banking sectors entered the economic crisis of 2020 with strong fundamentals, with high profitability and a moderate cost/income ratio: RoE around 10% and C/I—62% on average in the 2016–2019 period, which provided a high degree of accumulated resilience, as measured also by high capitalization—TCR over 20% (Table 2). Moreover, banks were indirectly and directly aided by fiscal and monetary governmental measures, such as liquidity support and capital relief measures (Raiffeisen Research 2020). However, for the region, the long-term negative consequences of the economic crisis may turn out to be strong and long lasting. In analyzing major ratios for 2020, a dramatic decline in profitability, as measured by ROA and ROE, can be seen in almost all of the analyzed countries, except for Lithuania. Poland and Latvia have recorded negative figures; for the latter, profitability has also deteriorated through a dramatic increase in costs—a C/I ratio of 96% for 2020. From the positive side, all CENE countries managed to keep high capital adequacy standards in 2020. It is interesting to note that in regard to risk-weighted asset growth, credit risk should have increased during the pandemic period, with the ratio expected to increase in 2020, while on average it actually decreased, most dramatically of all in Estonia and Poland. This can be explained by large bank investment in those countries in governmental bonds, at the expense of bank lending. Thus, based on the analysis of the basic performance ratios, it can be concluded that the impact of the COVID-19 pandemic in the region was profound, but not homogenous. The most affected countries in terms of profitability were Hungary, Latvia, and Poland, and the least affected were Lithuania and the Czech Republic. Moreover, capitalization in all countries remained strong, thereby not raising imminent stability threats.
However, many challenges still remain in this region. First, there is the question of the sustainability of the SME sector once subsidies are removed. Further, there is a negative pressure on earning, which derives from the low interest rate environment for the region with the dominance of the traditional bank business model. It is also due to intensified competition from largely unregulated fintech firms and challenger banks. Many reports indicate that customers are open to switching to high-tech-based financial firms because of their easy service, more attractive rates, better quality of service, and more innovative products. Moreover, despite a considerable cybersecurity risk, the younger generation of clients show a high degree of trust in fintech firms, products, and solutions (BIS 2019). Another challenge concerns reputational risk. When comparing the Baltic States, there is a striking difference in performance between Lithuania at one end and Latvia at the other. Both countries belong to a region with a strongly concentrated banking sector, with a strong presence of foreign, mostly Scandinavian-based banks. However, since 2018, banks in this region, and in Latvia in particular, have been engaged in money-laundering scandals, which have resulted in a blow to the Baltic states’ reputation as dynamic and safe markets for foreign investment. As a result of the scandals, one Latvian bank was closed down, and the president of the Latvian Central Bank of that time had to face corruption charges. Latvia has been most affected by scandal and reputational problems. In addition, the regulatory tightening on accepting foreign deposits has also strongly affected Latvian bank performance (Samson and Kusz 2019).
3. The Impact of the Pandemic on Consumer Preferences
As a result of the pandemic, the scale and scope of customer experiences in the digital banking channels increased significantly. The pandemic enhanced the need to have an easy, convenient, and safe access to services. By switching office work to distance work, with shopping in the world of e-commerce, and entertainment and banking services moving to the digital world, the world of consumers underwent a fundamental change. As a result of health restrictions, customers transferred to new channels to meet their needs, including financial services. The pandemic was also a time of accelerated digital transformation, at least in three aspects. The first is the quantitative statistics of customers who started using these services; the second is the change in frequency of using these services; and the third is the evaluation of customer experience in each bank distribution channel.
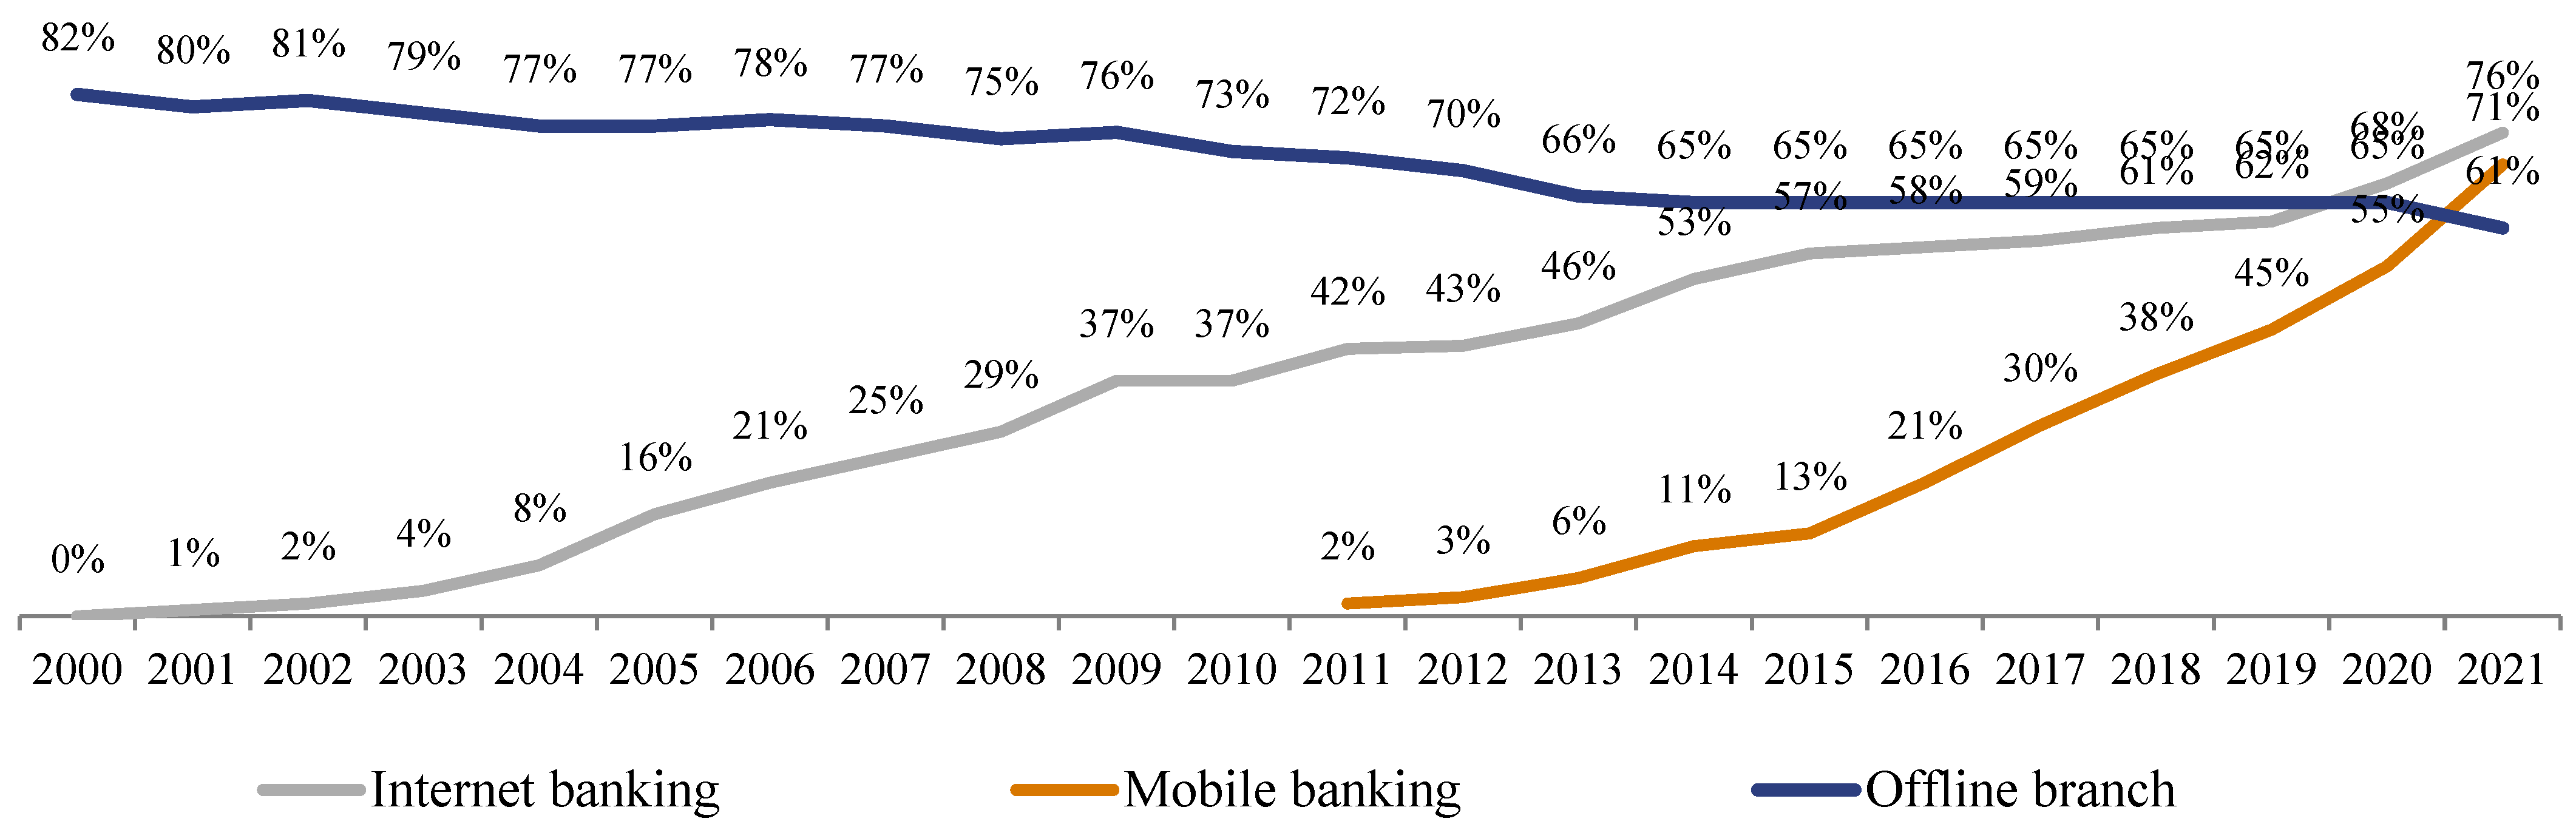
Regarding Poland, in 2021, the group of customers using electronic channels (76%) was larger than the group of customers who go to offline bank branches (61%), and 71% also use mobile banking (Figure 1). All this means that the bank operating model must fundamentally evolve.
The pandemic caused a shock, which forced many customers to learn about certain useful new features and functionalities offered by the new bank access channels. In so doing, they gained new experience, which turned out to be positive. In 2021, 70% of Polish customers evaluated the Internet and mobile banking as positive or very positive, with only 5% evaluating them as low. Furthermore, while 30% noticed an improvement in online services during the pandemic, only 4% noticed a worsening (Kantar 2021). Ninety percent of the customers who started or increased the intensity of using electronic channels during the pandemic declared that they would stay online. However, the process of customer digital transformation is not yet complete. Although there has been a distinct transfer from the Internet banking to mobile banking, there has only been a partial transfer from offline channels to digital channels. Thus, some of the traditional customers who did not use electronic banking during the pandemic were excluded from access to the banking services (ZBP 2021).
Increased online presence, videoconferences, and Internet communication have also created a natural context for consumers for banking services. The online context can be converted to stronger consumer inclination to use a given communication channel with banks too. Mobile banking is the most popular channel for young customers aged 15–24, and the popularity of the Internet banking is stable in the age group of 15–40, after which it drops abruptly. Additionally, structural changes are currently leading towards the “mobile only” trend (Kantar 2021).
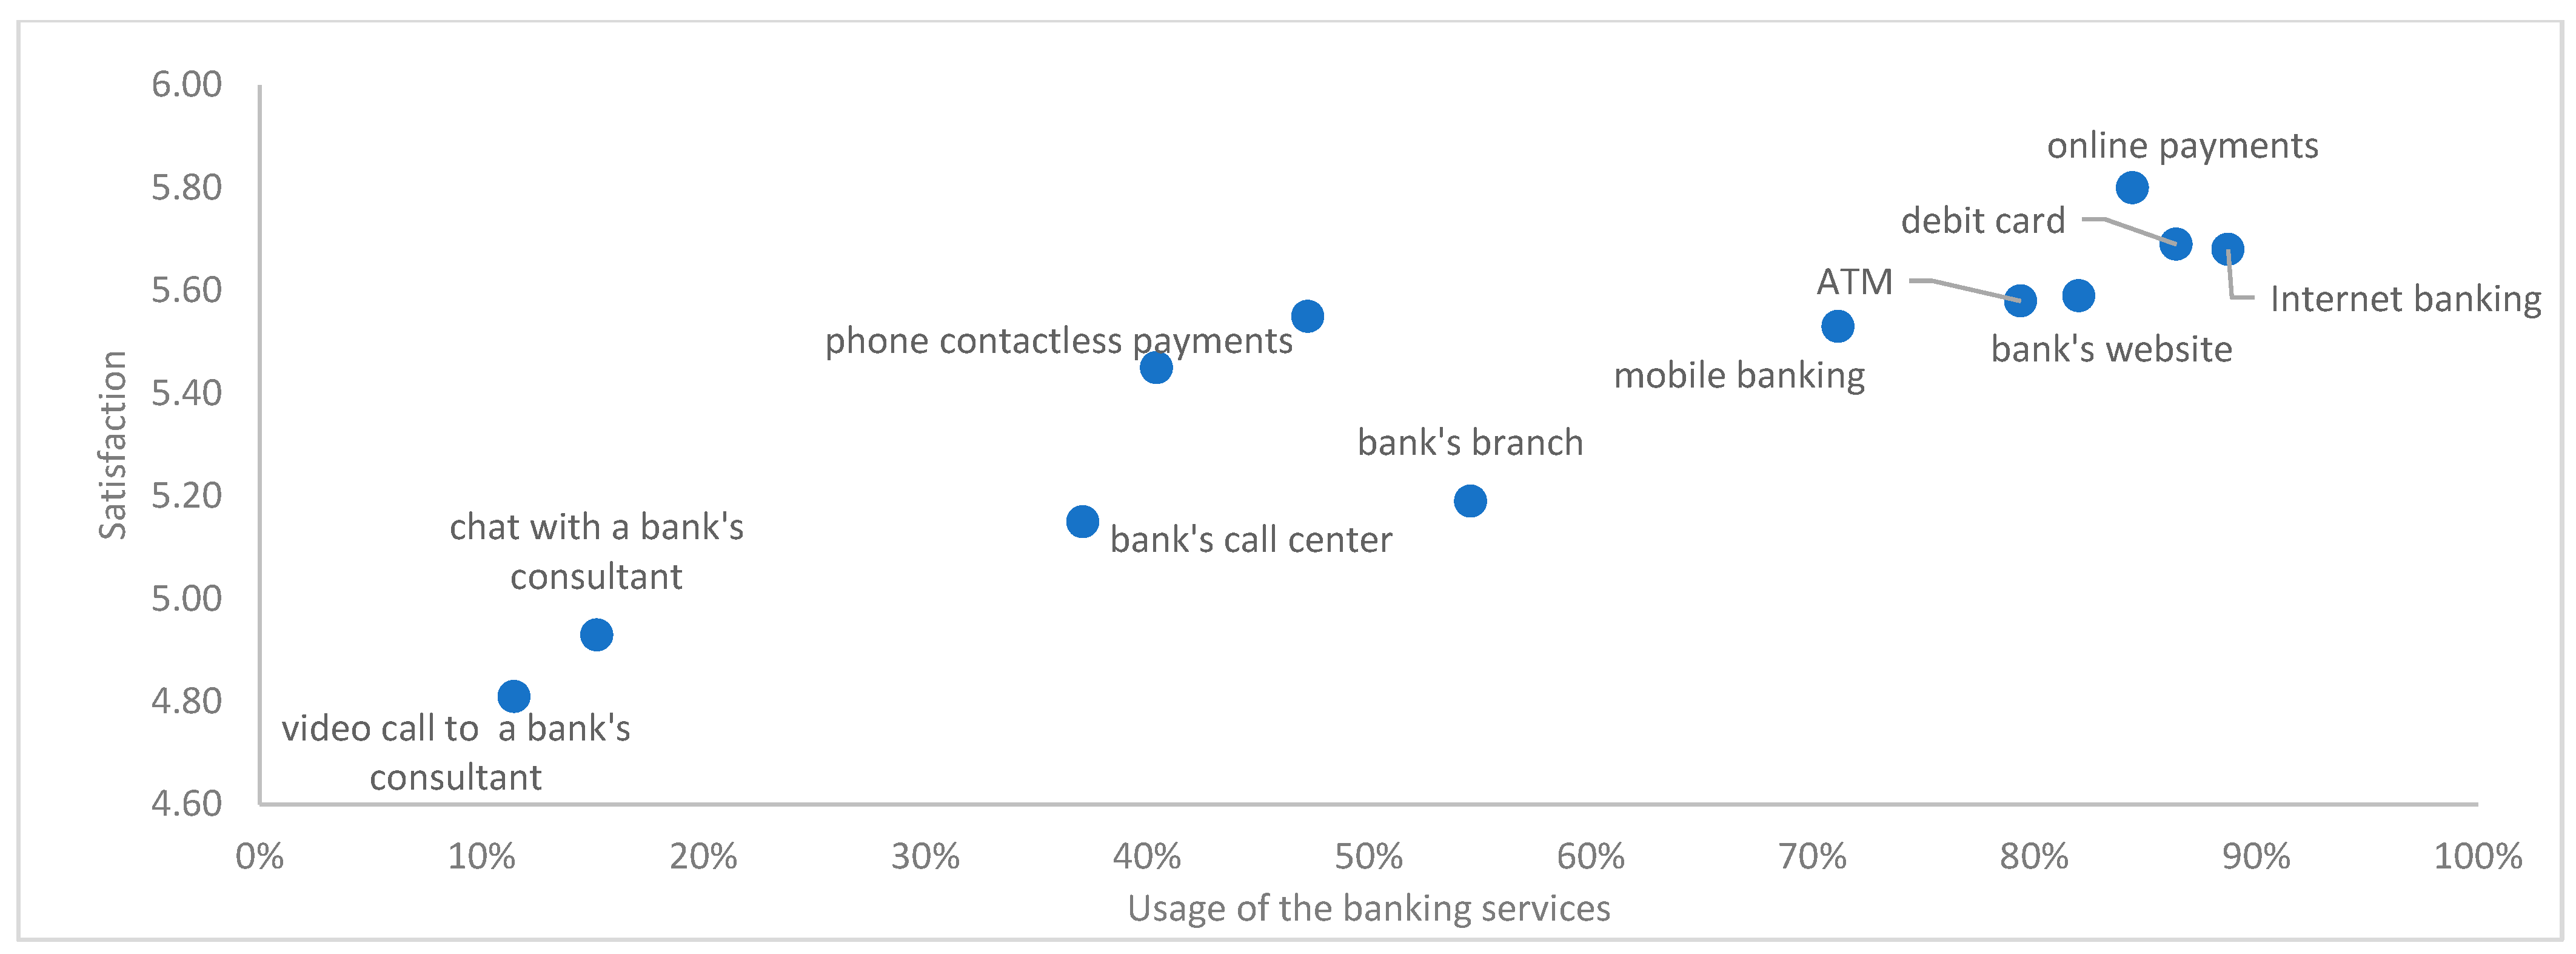
The success of each bank distribution channel is directly linked with customer experiences gained in these channels. When studying the period of the pandemic, customers definitely had positive experiences when using Internet payments, Internet banking, debit cards, bank websites, and mobile banking (Figure 2).
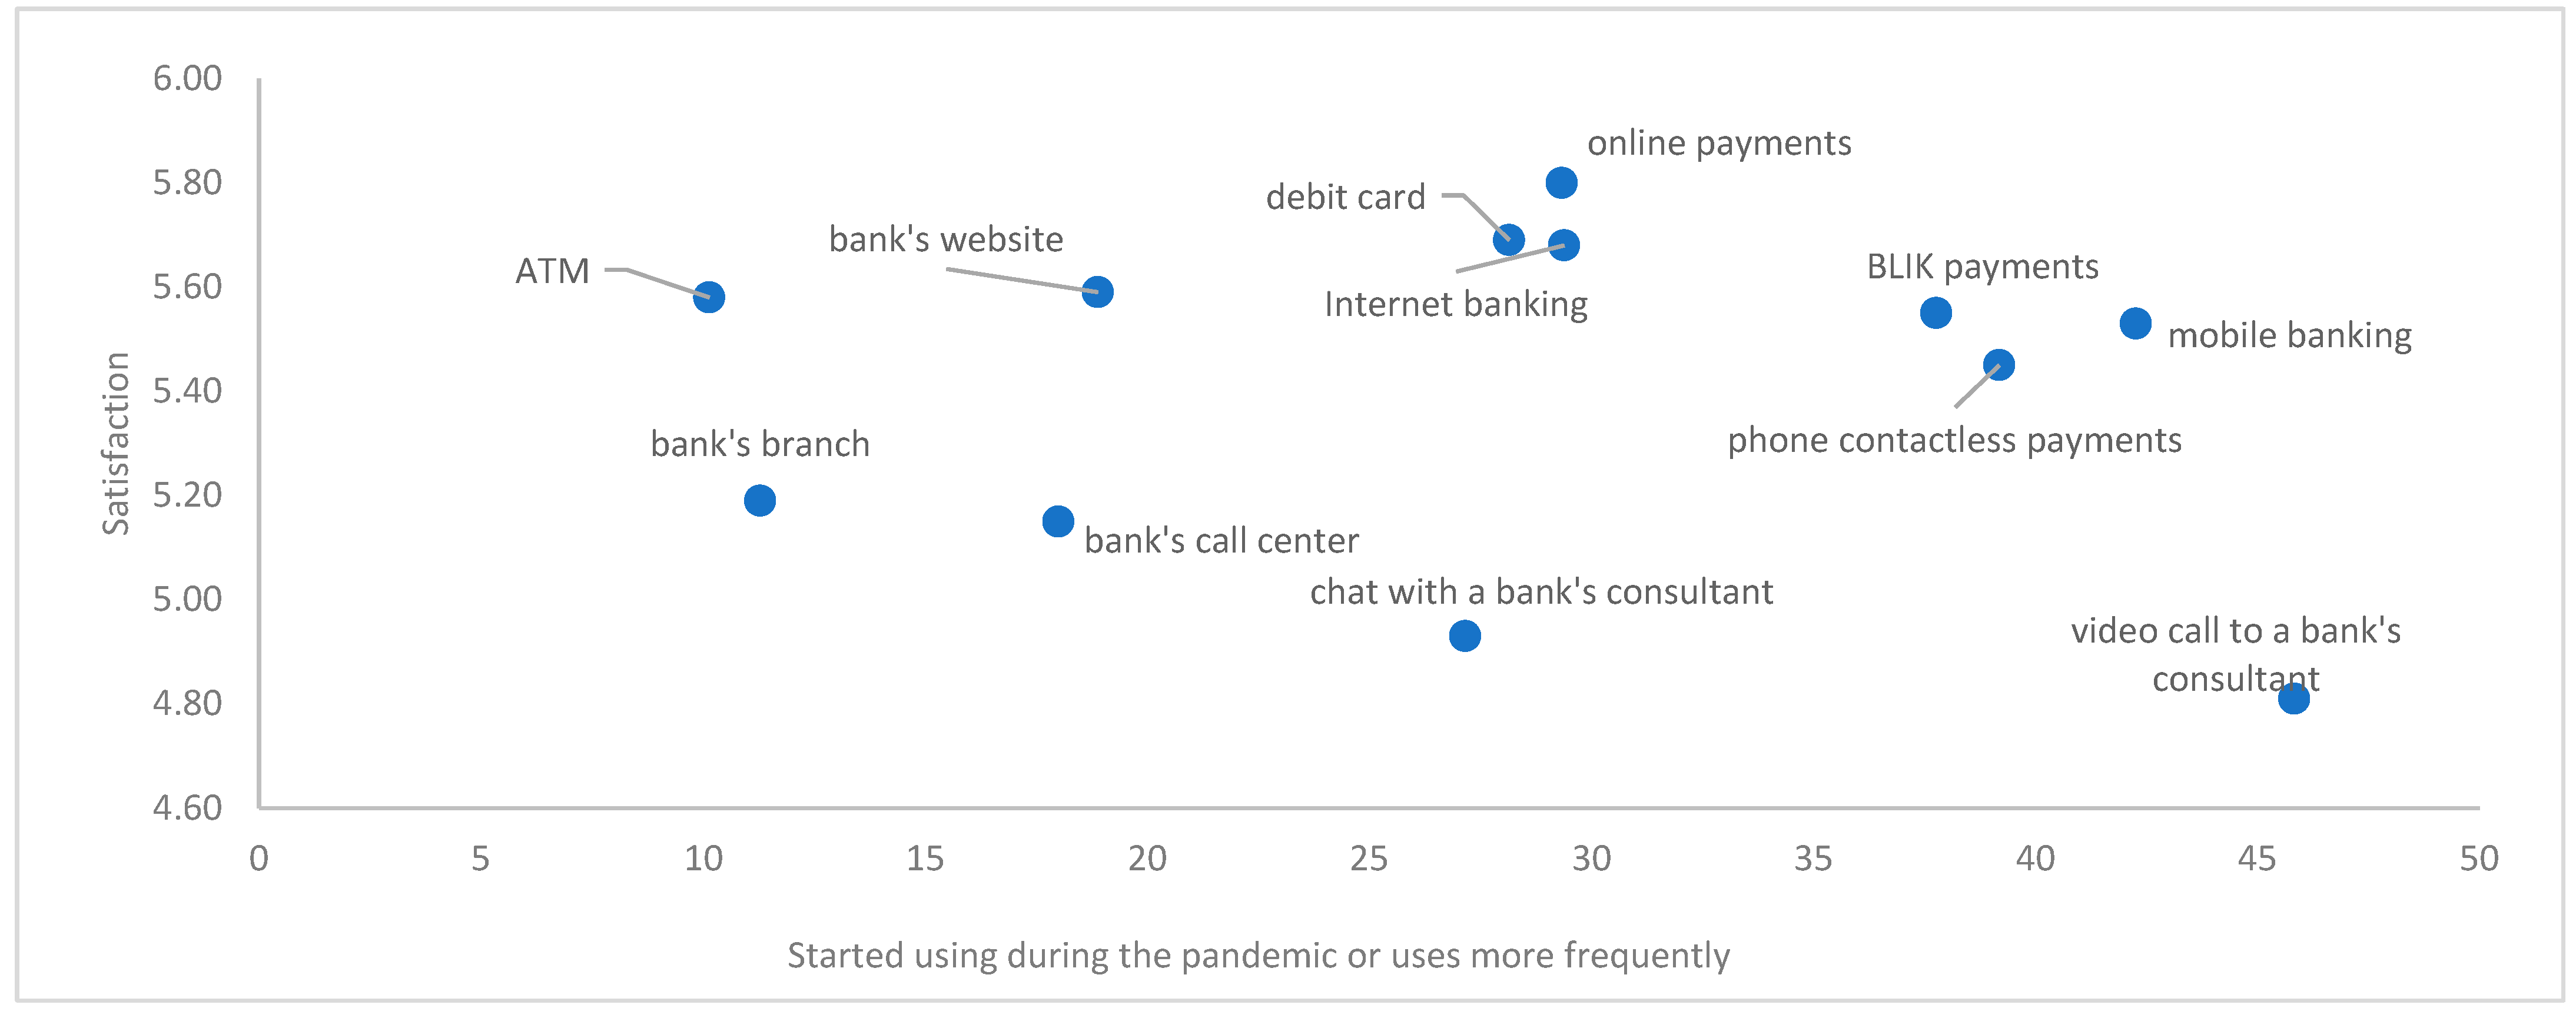
However, the experiences of the customers who started using new channels during the pandemic are more diversified (Figure 3). Customers gained positive experiences from mobile banking, contactless payments, and online payments and negative experience from video calls and video chats.
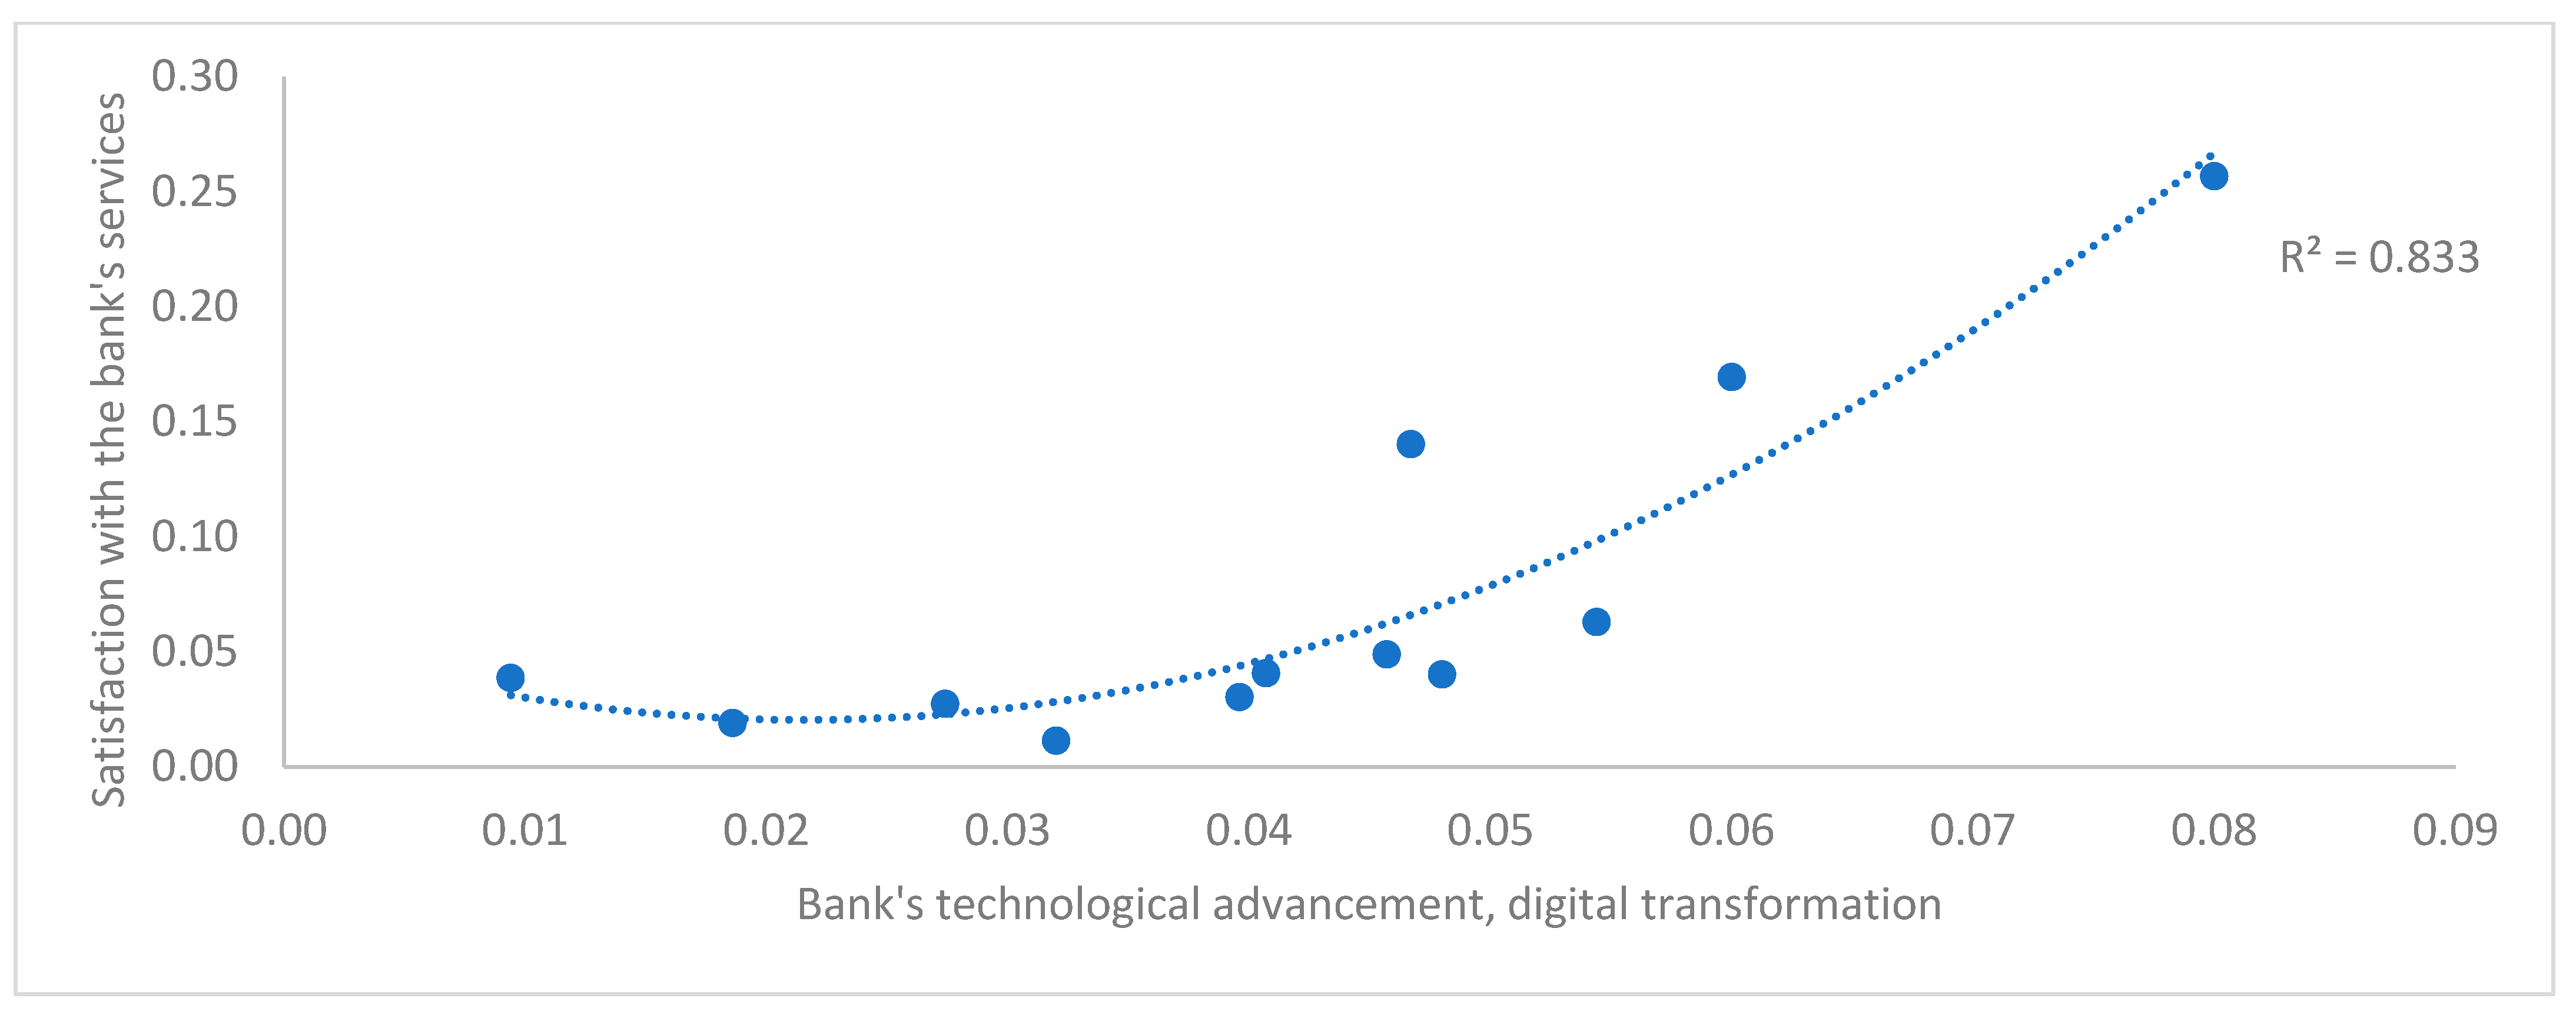
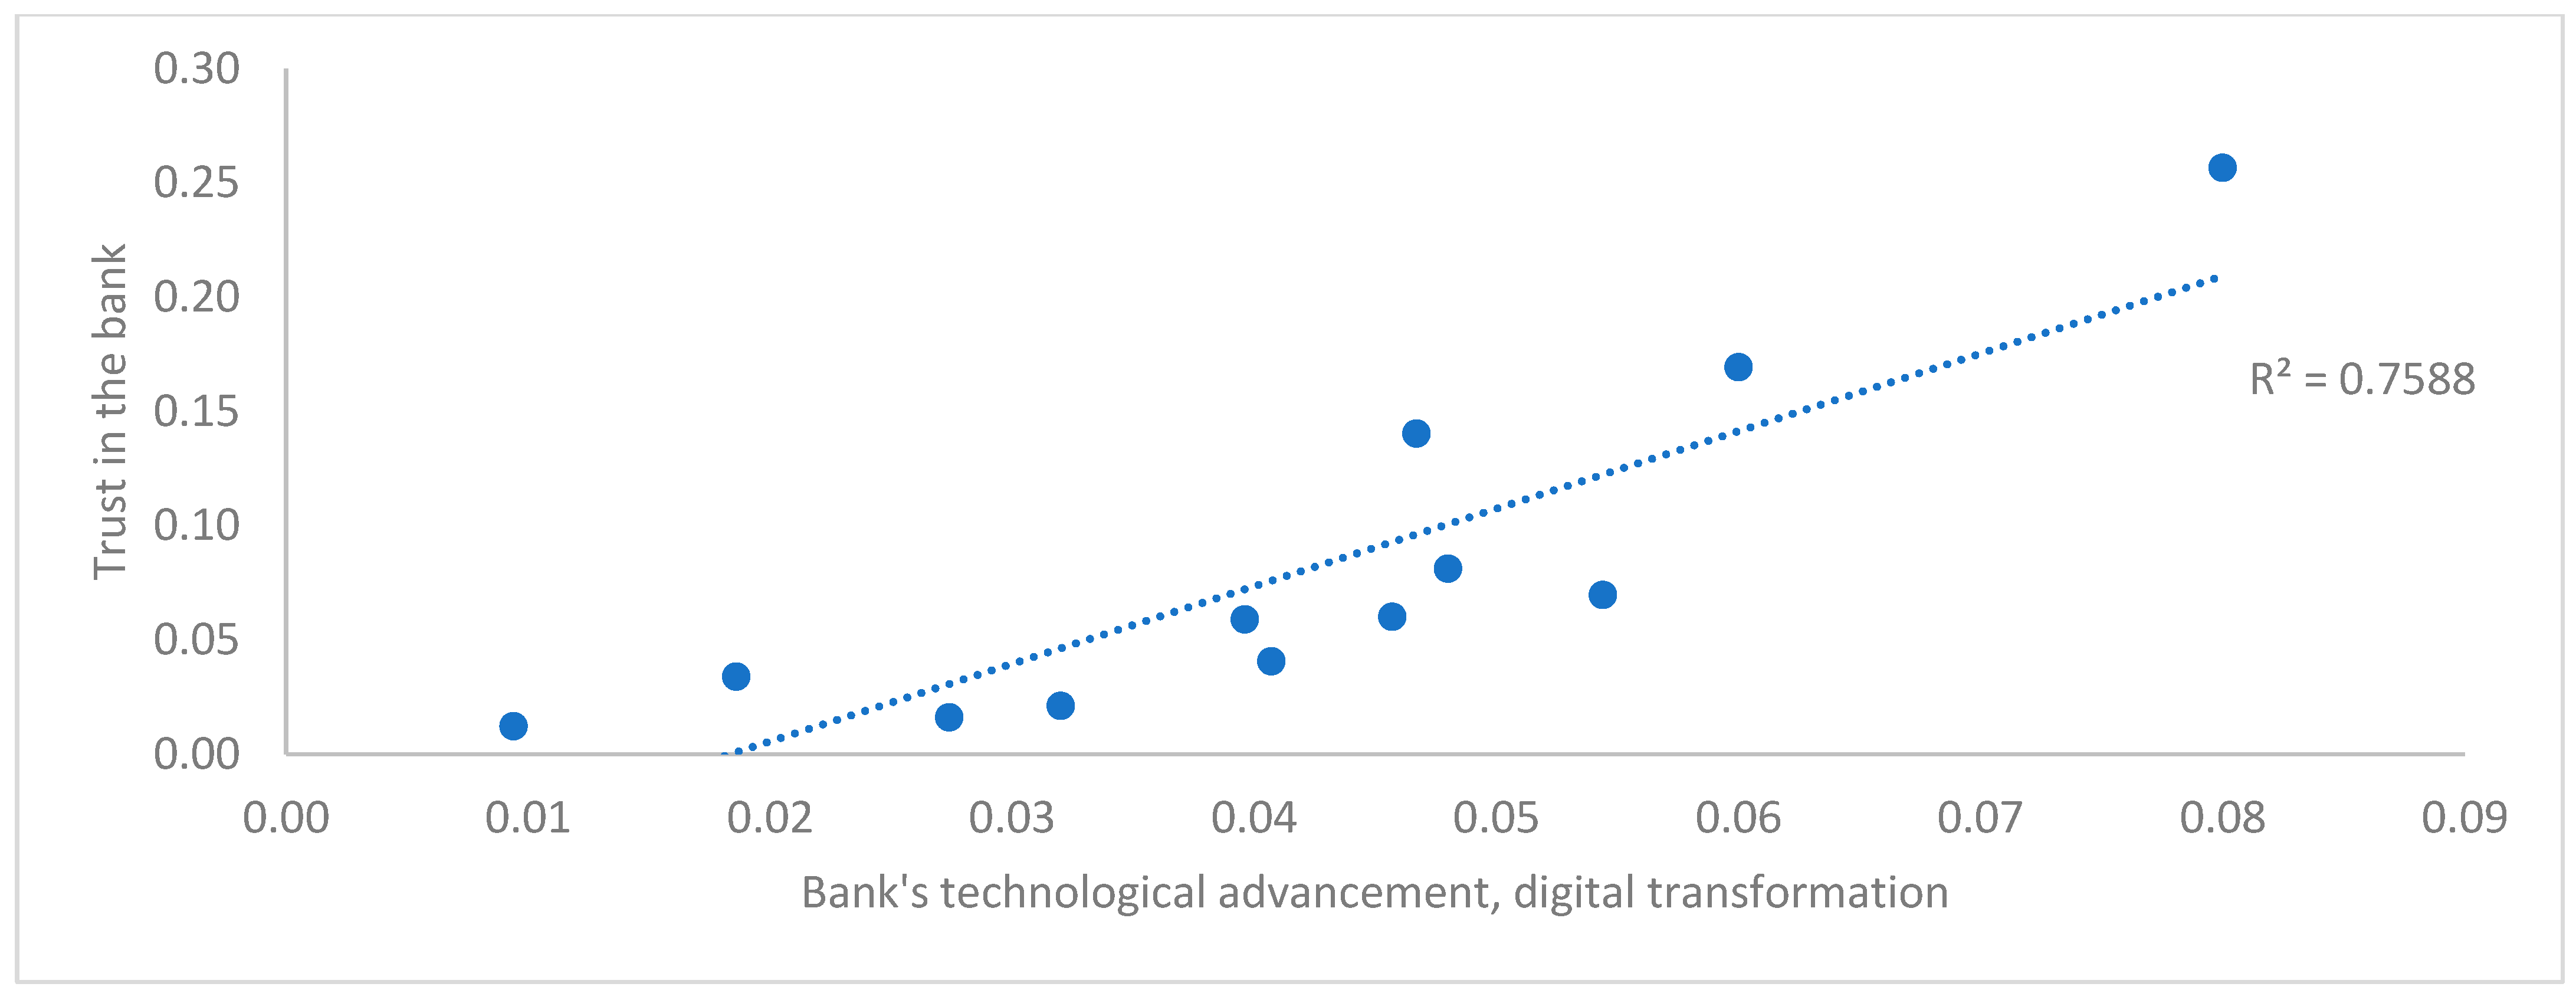
Advanced technologies and the introduction of digital solutions by banks are not only image- or satisfaction-related matters. On the basis of a study of 1000 customers of 14 banks in Poland, conducted in 2020, a strong connection between bank technological advancement and digital transformation with satisfaction with banking services has been established (Figure 4). Moreover, the study also revealed a strong impact of bank technological advances on customer trust (Figure 5)
The above analysis of changes in consumer behavior, largely based on the Polish case, illustrates that digital transformation means more than just providing online and mobile functionality. It is based on reinventing the consumer journey, redefining the operating model, and building a digitally driven organization. Consumers want financial services that are customer-centric, easy to use, low-cost, and always available, as in the offerings of bigtech and fintech firms. This creates strong pressure on banks to reform their legacy infrastructure and to modify traditional business models.
4. CENE Banks’ Attitude to Digitalization: The Results of the 2020 Bank Survey
COVID-19 accelerated certain existing trends in the banking sector and reversed others. Most importantly, it accelerated the digitalization and technology-based restructuring of the banking sector globally and in the CENE. The majority of banks seek to become digitally mature and are driven mostly by innovation (EY 2018). Digitalization also increases operational flexibility and generates greater customer satisfaction (Boot et al. 2020). However, a combination of technology-based innovations and changes in consumer preferences, together with restrictive regulation, are eroding the traditional competitive advantages of many banks (BIS 2018). While the challenges of digitalization are uniform, banks react to them differently, both in terms of strategies, operational behavior, and client and product focus. In order to test the attitude of CENE banks towards digitalization, a bank survey was conducted in the fourth quarter of 2020. Survey questions were directed to all banks registered in CENE and were responded to by 11 banks from Poland and 9 from other CENE countries (Czech Rep.—3; Slovakia—3; Hungary, Estonia, and Latvia—1 each), mostly by the major banks in the region. The most interesting results of the survey are presented in Table A1 in Appendix A and in Figure 6, Figure 7, Figure 8, Figure 9 and Figure 10.
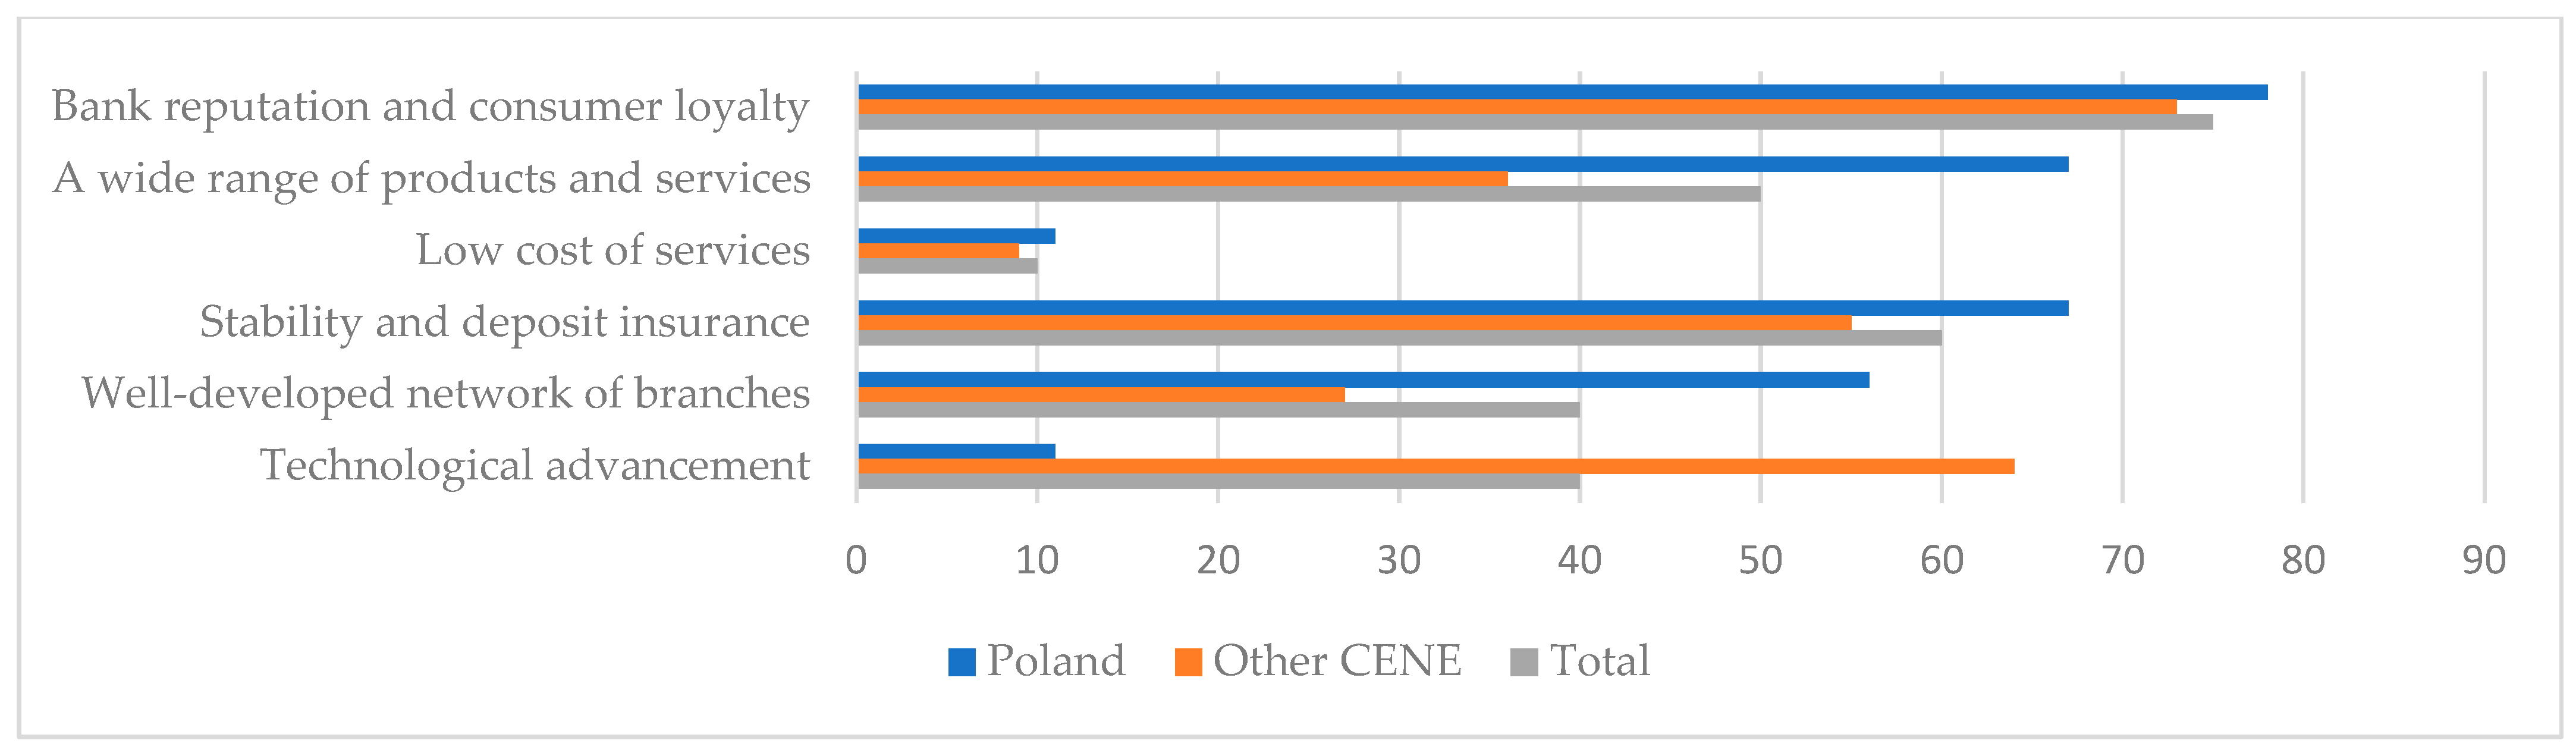
The surveyed banks revealed an open and positive attitude towards digitalization, although they admitted that it would strongly affect their business models. They also agreed that the payment segment will be the most affected. All banks confirmed that digital transformation is their main investment priority. Eighty-two percent of Polish banks and 56% in other CENE defined themselves as market leaders in the field of digitalization, and only 5% of banks in the region declared to be at an early stage of technological transformation. Ninety-five percent of Polish banks and 100% of banks in other CENE countries stated that they had implemented a clearly defined digital strategy. Only when asked about competitive advantages over the fintech sector were results more diverse. All banks pointed to bank reputation, customer loyalty, and deposit insurance, but Polish banks also stressed their wide range of products and network of branches, while other CENE banks pointed to technological advancement (Figure 7). To sum up, the survey results presented in Table A1 in Appendix A provide a very optimistic picture, showing a homogeneity among the analyzed banks in their open and agile attitude to digitalization. However, these banks were aware that digitalization entails fundamental changes, particularly for their business models (Figure 6).
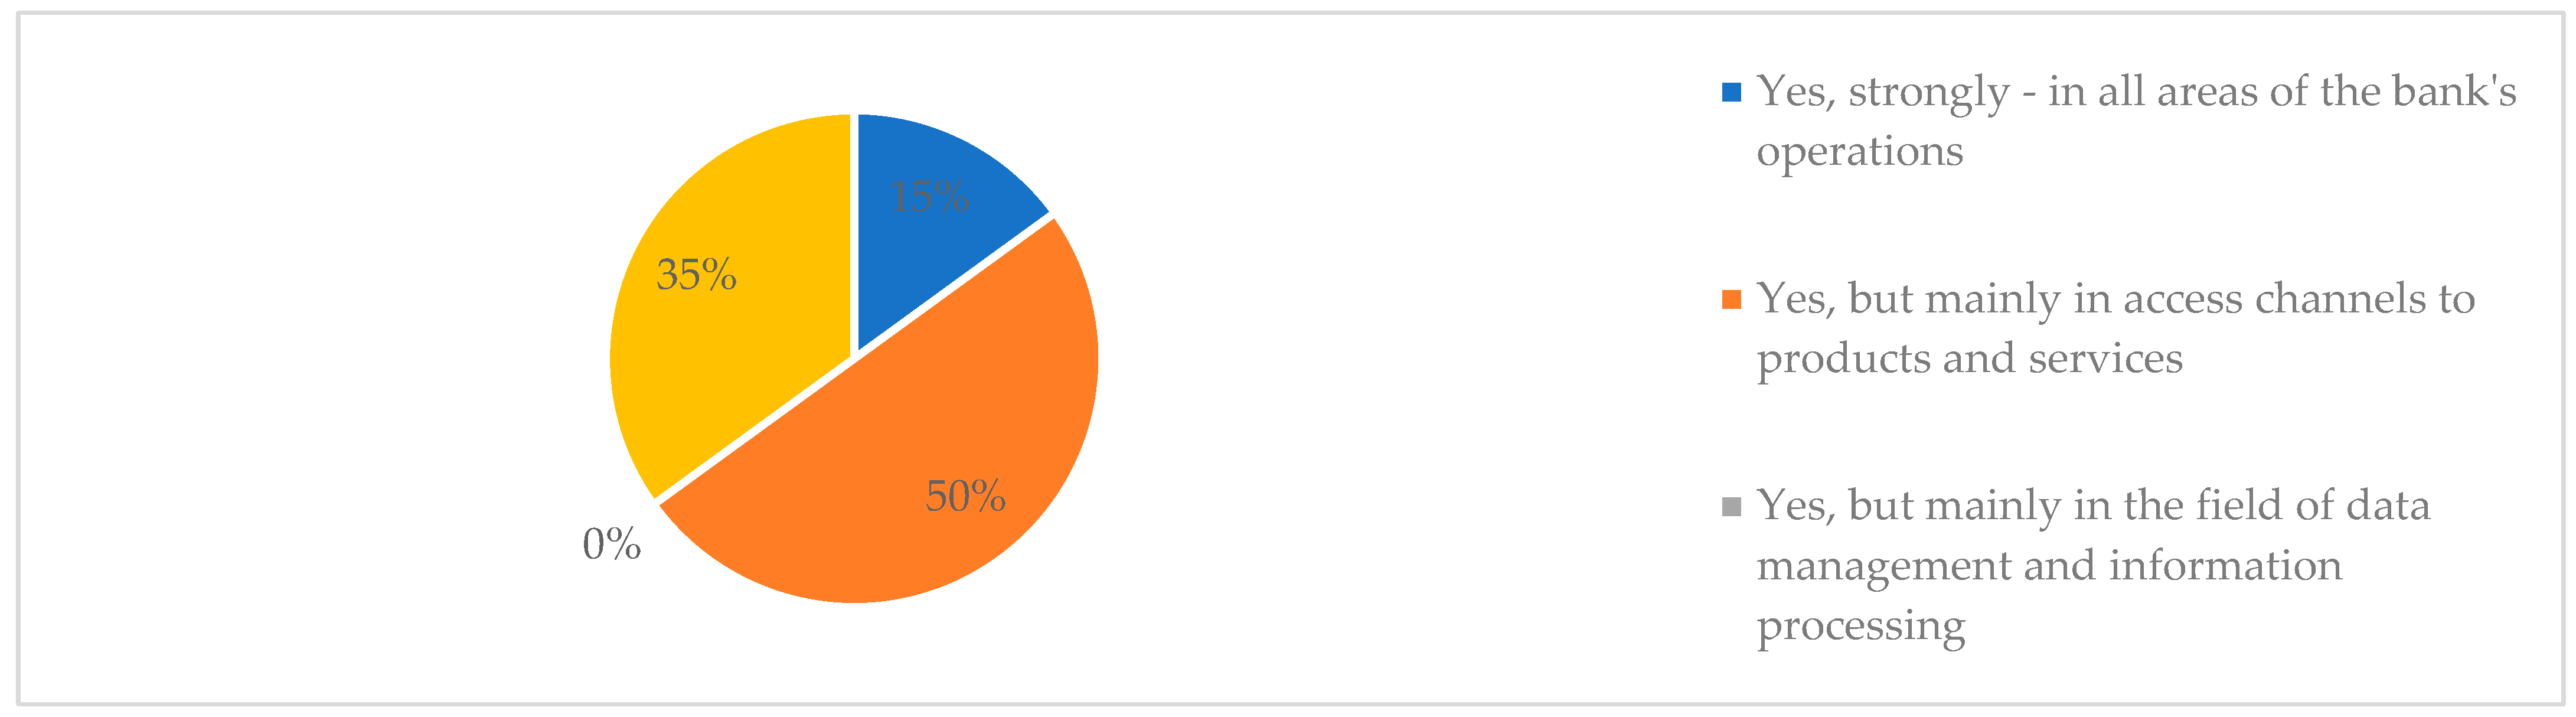
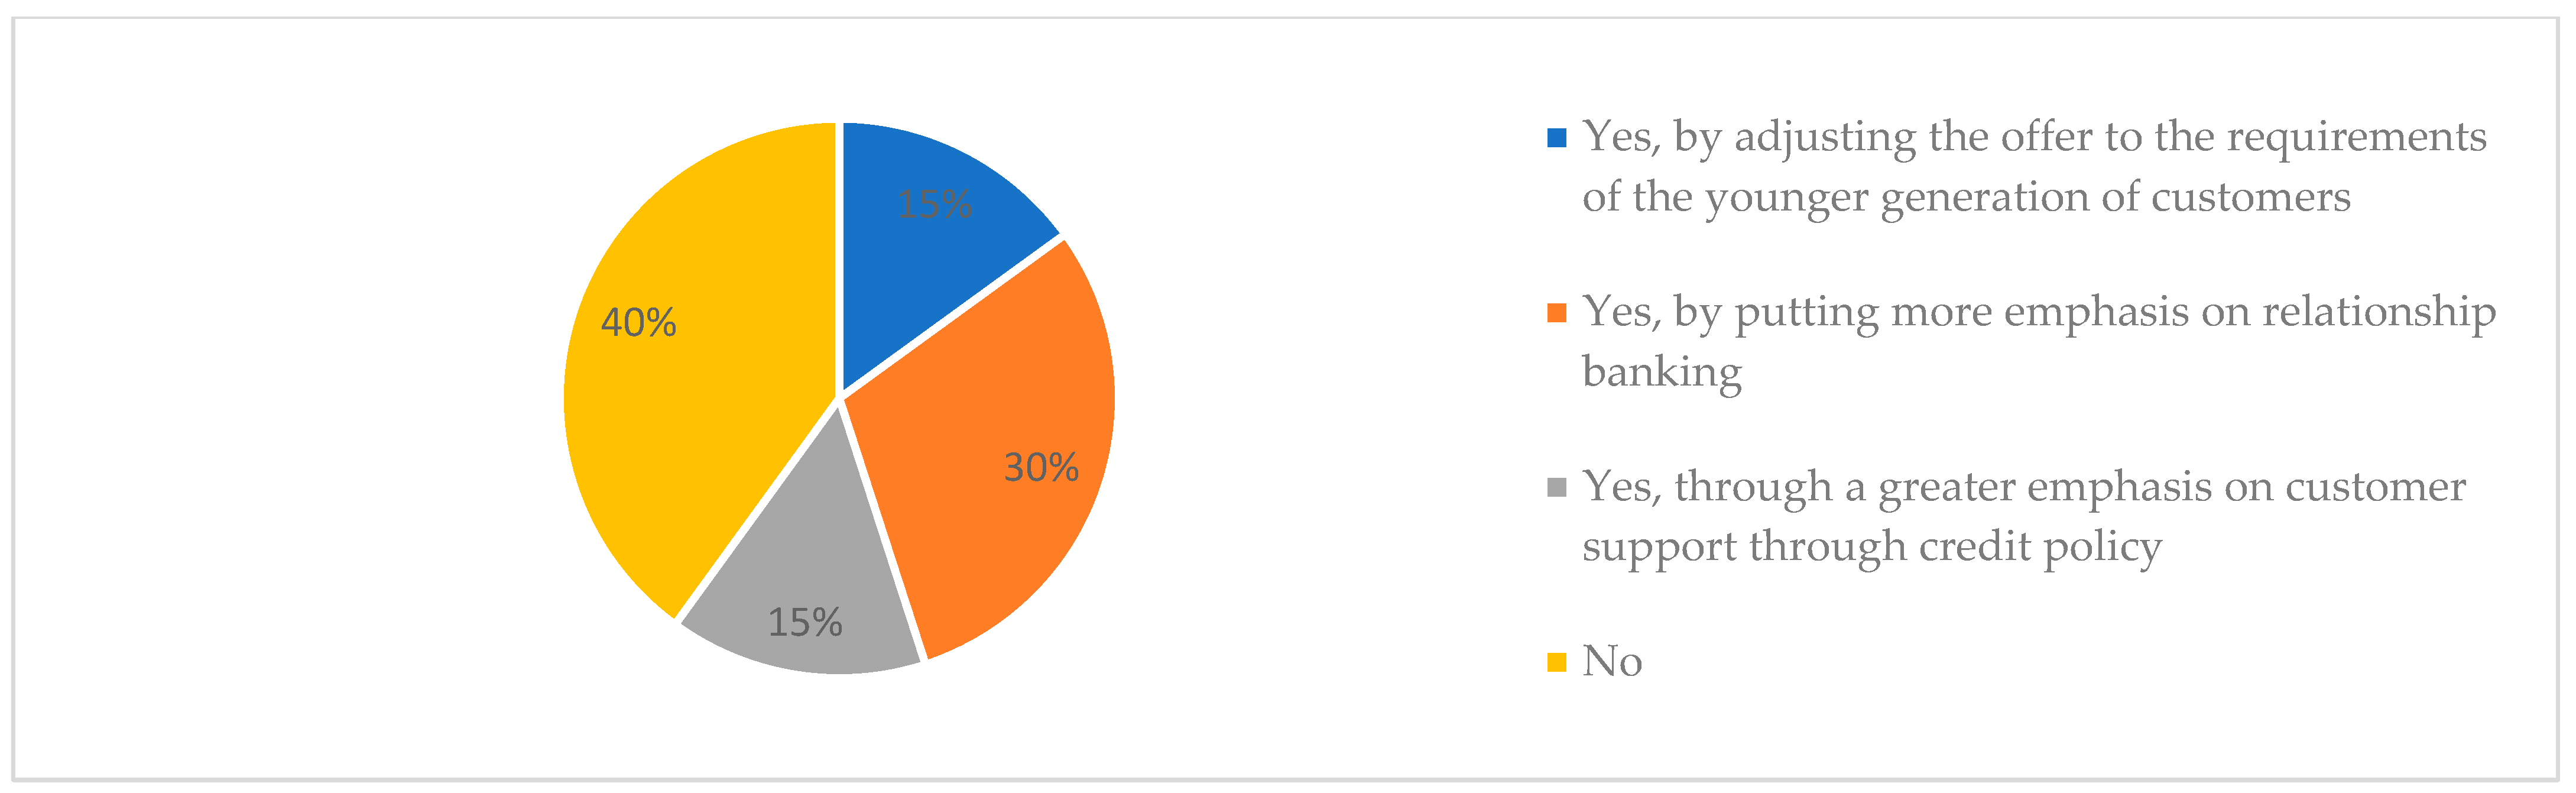
The last three questions in the survey aimed at analyzing the impact of the COVID-19 pandemic on bank strategic solutions (Figure 8, Figure 9 and Figure 10). In this section, banks revealed a more hesitant attitude towards a fundamental change. Fifty percent of banks agreed that change will mostly affect access channels to products and services and not all areas of bank operations (15%). Forty percent of banks also do not see the need to alter their customer relations. Finally, 50% of banks do not see the need for fundamental change in bank strategy—although a negative answer was given by 36% of Polish banks as opposed to 67% in other CENE, which indicates that only a major drop in profitability, such as in Poland, is forcing banks to undertake more fundamental strategic actions.
To summarize, the survey revealed the significant awareness of CENE banks of both technological challenges and opportunities, as well as of the necessity to carry out a comprehensive reorientation of their business operating model. However, the answers given in the COVID-19 section (Figure 8, Figure 9 and Figure 10) indicate that banks in CENE may underestimate the challenges ahead and the required scale and scope of transformation.
5. Factors Influencing Bank Performance in CENE: Comparison of Aggregate Bank Stability and Performance Measures
The effective and stable performance of credit institutions may be measured not so much by isolated ratios, as by aggregate comprehensive indices, taking into account indicators of bank financial strength—performance and capital adequacy and major risks—credit and liquidity risk (Kocisova 2015). For this reason, in order to complement the analysis of CENE bank performance ratios and capitalization measures, this section analyses three aggregate stability and risk-adjusted performance measures: Z-score, MLPS, and FSI. In analyzing bank stability and soundness, the most typical assessment method, except for capital adequacy measures and the non-performing loans (NPLs) indicator, is the Z-score stability index (Lepetit and Strobel 2015; Haq and Heaney 2012). The multi-level performance score (MLPS) is a risk-adjusted, aggregated performance indicator developed by Miklaszewska and Kil (2016), based on three efficiency ratios and two stability indicators. FSI, like MLPS, is a comprehensive financial stability indicator based on five performance areas developed by Iwanicz-Drozdowska et al. (2017). All three of the above-mentioned aggregate measures have certain complementary characteristics: the MLPS measures long-term risk-adjusted performance, and the FSI is centered more on short-term stability (encompassing two liquidity indicators), while the Z-score stresses the importance of bank strong capitalization and predictable earnings.
5.1. Z-Score Stability Index
This is based on the notion that bank risk has an adverse impact on profitability and leads to the solvency risk of being unable to absorb losses generated by all types of risks with the available capital. The Z-score ratio approximates this kind of risk and is defined as:
where: At = assets in a period t; πt = net profit in t; 2πt/(At + At−1) the average value of ROA in t; σROA = standard deviation of ROA; Et = bank equity in t; (Et + Et−1)/(At + At−1) denotes CAR in t; n = number of researched periods (years).
The score estimates the probability that a bank will run out of capital, on the basis of its capitalization and profitability and the volatility of its returns. It measures the number of standard deviations the ROA must decrease by before the bank’s equity is depleted. Consequently, a high Z-score level indicates a low default risk, and vice-versa. The value of the index crucially depends on the variability of returns and the bank capitalization level, which is advantageous to well-capitalized traditional banks with stable returns.
5.2. Multi-Level Performance Score Index (MLPS)
The score is computed as a sum of five areas vital to bank long-term stability and performance: three efficiency ratios (ROE, C/I, and loan accessibility, measured by the loans to assets (L/A) ratio) and two stability indicators: Z-score and NPLs.
It is defined by the following formula:
MLP Score = ROE + L/A + C/I + Z-Score + NPL
Scores for the MLPS in all five areas are allocated by taking the results for each indicator for the whole group in a given year and dividing it into ten deciles. Each subsequent decile above the median for the ROE, the L/A, and the Z-Score has a score ranging from +1 to +5, while each subsequent decile below the median has a score ranging from −1 to −5. For the C/I and the NPL indicators, the signs are opposite. The median for the group has a value of 0. Due to this scoring methodology, the ratio has a simple interpretation—the higher the value of the MLP Score, the better the assessment of the bank.
5.3. Financial Stability Indicator (FSI)
The FSI represents the weighted sum of the five normalized variables
where:
FSI = 0.2 · ETA + 0.2 · ROA + 0.2 · LAF − 0.2 · LD − 0.2 · LITA.
- -
- ETA stands for equity to total assets, representing capital adequacy;
- -
- ROA stands for return on assets, representing profitability;
- -
- LAF stands for liquid assets to total funding, representing liquidity;
- -
- LD stands for loans to customers to deposits from customers, representing liquidity;
- -
- LITA stands for impairment charges to total assets, representing asset quality.
The index values on the bank level range from −0.4 to 0.6. The weights assigned to each variable reflect their importance in the aggregated index, where it is assumed that each variable has the same importance.
Table 3 summarizes and compares the results of the Z-score and MLPS and FSI data for the analyzed CENE banks in the period of 2016–2019, and it compares them with the 2020 figures. In addition, for the Z-score and the MPLS, the calculations for 2004–2014 are provided, based on Miklaszewska and Kil (2016).
Thus, when summing up the impact of the pandemic on profitability and stability ratios and on aggregate performance indices for CENE banking sectors (Table 2 and Table 3), the following conclusions can be formed:
- comparing the results for the Z-score in the 2004–2014 and the 2016–2019 periods, the overall improvement of CENE bank stability can be observed, which was not affected by the pandemic in 2020. The only exceptions were Hungary, with a result much below the average, and Slovakia, with a very high bank stability score;
- for the aggregate MLPS index, the conclusion can be formed that banks in some countries, such as the Czech Republic, Estonia, and, to some extent, Slovakia, have managed to demonstrate steady high performance values. At the other end of the spectrum, there was a steady worsening performance in Hungary and Latvia. The two remaining cases are Poland, which had a very high performance score in the 2004–2014 period, rapidly deteriorating in the 2016–2019 period, and the worst score of the whole group in 2020; and Lithuania, with a low score in 2004–2015, and the highest score after 2016, including in 2020;
- for the FSI, values were quite harmonized within the group, and for all countries were higher in 2020 than in the preceding years, indicating the stable funding and liquidity position of banks in the analysed countries, and the lack of a substantial credit risk related to the NPL portfolio;
- one of the most affected banking sectors in terms of bank profitability were those of Hungary, Latvia, and Poland. Polish banks were seriously affected by regulatory burdens: high bank tax, macroeconomic trends (low interest rates), and legal risk (large portfolio of foreign denominated mortgage loans) (Raiffeisen Research 2020;)
- the countries with the most stable and positive performance were the Czech Republic, Estonia, and Slovakia; and the country which seemed to be least affected by the pandemic was Lithuania—all with an environment very favourable to technology-based transformation. As Deloitte pointed out, banks that invested heavily in technology managed to offset the pandemic effect, at least in the short run (Deloitte 2020a, 2020b);
- in all the analysed countries the crisis mostly affected profitability, while stability indicators and bank capitalisation remained strong.
6. The Impact of the COVID-19 Pandemic on Bank Performance: Panel Data Analysis
To provide an in-depth analysis of the impact of the COVID-19 pandemic on risk/returns in CENEbanking sectors, the panel data model was employed, using a sample of 106 banks from the following countries: Czech Republic—27, Estonia—7, Hungary—17, Lithuania—4, Latvia—13, Poland—24, and Slovakia—14. The selected banks were active throughout the analysed period 2016–2020, and they constituted 71.3% of banking sector assets of the analysed countries, as of 31 December 2020. Bank data were taken predominantly from the BankFocus database, supplemented by other sources.
The analysis depends on the type and scope of the available data. The research was based on the micro-panel data, resulting from the combination of time series observations for cross-sectional units. The dynamic panel model was employed—generalized method of moment—commonly referred to as GMM, in the GMM-SYS version (Blundell and Bond 1998). GMM models are typically used in financial research, particularly for banking studies (Andreß et al. 2013). A strong advantage of this method is the elimination of the standard assumption of strict exogeneity of regressors, which allows for taking into account of the lagged values of the dependent variable, which is not feasible in the case of statistical panel models. Methods, which are based on GMM, are therefore particularly useful for models including endogenous or predetermined explanatory variables (Dańska-Borsiak 2009). Moreover, a small research sample (max. of 530 observations) also constitutes an important factor in the selection of the GMM-SYS model (Bond 2002). Moreover, all control variables could be applied, because they can be endogenous and because the GMM-SYS estimator can produce more reliable results (Baltagi 2005). In the GMM estimations, one lag of each endogenous variable was used, and time effects were included as exogenous instruments. In the study, a one-step estimate was used, as the two-step method could lead to erroneous conclusions, especially in the case of heteroscedasticity of the random component (Blundell and Bond 1998). For diagnostic purposes, the Hansen test was used, as well as Arellano-Bond autocorrelation tests for first differences: AR (1) and AR (2).
The employed estimated dynamic model of regression is given by the following equation:
where:
BPit/BCit = const + a1*BP/BCit-1 + a2*MACRO.VARi(t, t − 1) + a3*MICRO.VAR i,t + vit
- BP—measure of bank financial performance (ROA, ROE; C/I, MLPS, FSI);
- BC—measure of bank capital stability (Z-SC, CAR, TCR);
- MACRO.VAR—the vector of values of macroeconomic variables in period t or t − 1; MICRO.VAR—a vector of control variables characterizing the specific operation of a particular cooperative bank in the period t; vit—the random component, which is the sum of the individual, unchanged in time effect and the pure random error ε.
Definitions and characteristics for dependent variables and explanatory variables are provided in Table 4 and Table 5. Descriptive statistics and the correlation matrix are presented in Appendix A in Table A2 and Table A3. Among the dependent variables, profitability and stability indicators were selected, including the aggregate measures: Z-score, MLPS, and FSI, which are defined in the previous section. For explanatory variables, two groups of indicators were used: macroeconomic variables and bank-level variables.
The estimation results are provided in Table 6, Table 7 and Table 8. When analyzing the profitability measures (Table 7), some results were predictable: variables such as GDP growth or bank concentration influenced profitability positively and cost efficiency negatively; loan size and growth rate also contributed towards increasing costs, without influencing profitability, while growing NPLs portfolio negatively influenced profitability. It was surprising to see the lack of significance of bank scale and the negative impact of deposit growth on profitability but the positive impact on costs. These results pinpoint the current bank business model dilemma: models based on traditional intermediation do not contribute to profitability, but they do contribute to costs, and traditional financing based on customer deposits constitutes a burden. This structural direction, reinforced by the pandemic (low interest rates, public subsidies phasing out bank credit) are particularly harmful for banks in some CENE countries, and they call for a bank operational reorientation towards riskier universal or wholesale business models. In most developed Eurozone countries, banks post-global-financial-crisis have adapted to their new regulatory landscape, re-assessing and adjusting their business strategies and models, including their balance sheet structure, cost base, scope of activities, and geographic presence (BIS 2018). For CENE banks, this reorientation is looming on horizon.
In analyzing risk-based indicators (Table 7), bank stability as measured by the Z-score was positively influenced by GDP growth and an efficient supply of domestic credit but negatively influenced by bank size, which stresses that just as before GFC, large banks are still a source of over-proportional risk. The aggregate performance indicator MLPS was negatively influenced by deposit growth, just as in the case of individual performance ratios, but it was positively influenced by bank market concentration and GDP growth. As for FSI, the negative impact was due to loan growth and the share of government securities in total assets.
As regards bank capital position (Table 8), it is interesting to observe that GDP growth was positively related to bank leverage (equity to total assets) and negatively to total capital requirement (TCR), defined as total capital/risk weighted assets. GDP growth in the analyzed period declined, which resulted in a decrease in equity and an increase in regulatory capital, due to the increase in the portfolio of governmental bonds with a zero risk weight. Moreover, also of note was the information that both bank size (LN_TA), loan dynamics (LO_GR), and non-performing loans portfolios were negatively correlated with bank capital ratios, which further supports the thesis that traditional bank business models based on intermediation do not guarantee satisfactory profitability (negative relation of deposit on dependent variables in Table 7 and Table 8) but also deplete banks’ capital bases. This observation is supported by the positive impact of non-interest incomes on bank capital ratios.
7. Conclusions: COVID-19 and CENE Bank Business Model Reorientation
The aim of this study was to contribute to the discussion on the long-term impact of the COVID-19 pandemic and the 2020 economic crisis on bank stability and profitability, with a focus on Central, Eastern, and Northern European countries. The main research question asked to what extent the CENE banks, which grew dynamically in the post-GFC period, were affected by the new trends and the new economic environment and whether the pandemic influenced their digital transformation. The most interesting findings of the empirical section are that banks in CENE have to modify their business models based on traditional intermediation, as they no longer contribute to profitability and stability. Both the CENE bank survey and the panel data model indicate that a strong deposit position and loan growth no longer contribute positively to profitability. A special focus was placed on research into bank digital attitudes, as a way to address the environmental challenge. To this end, a survey among CENE banks was conducted, which demonstrated the substantial digital transformation of large banks in this region, which allows for an optimistic assessment of future transformation. The survey also indicated that banks still have many advantages: a reliable customer base with data based on a long history; “soft” information on customers; and a high level of data privacy, which ensures trust and enables a broad product offer. On the other hand, a bank cannot benefit from information with social media, similarly to fintechs. There is also the question of dealing with an outdated legacy infrastructure (BIS 2019).
In answering the initial hypotheses, the analysis presented in the article indicates that the impact of the economic crisis has been diverse in the analyzed group. Employing tools such as ratio analysis and aggregated performance measures (the Z-score, MLP score, and FSI), the study showed the strong and stable results of banks in the Czech Republic and Lithuania and also the weakest performance of banks in Poland, Hungary, and Latvia. Then, employing the generalized method of moments (GMM) for dynamic panels of bank-level data for CENE countries over the 2016–2020 period, an analysis was made of the factors that contributed positively and negatively to bank profitability and stability. This allowed us to positively verify the second hypothesis that the traditional intermediation business model, which characterizes banks in the analyzed region, does not contribute to better performance and higher stability. The analyses of consumers’ shifting preferences and the bank survey results allowed us to verify the third hypothesis that the pandemic has strengthened the importance of digitalization and has forced banks to speed up their digital transformation.
The analysis makes it also possible to formulate the policy recommendation that in order to stimulate a stable and efficient banking system, a focus no longer should be placed on bank stability (proper capitalization) but rather on improving bank performance. Moreover, a bank should receive relief from certain regulatory burdens, such as repressive bank taxes, and be added into their technological investments (i.e., by favorable tax treatment of technological spending). These empirical results indicate that the digitalization of processes and products will be a precondition for building a stable and efficient banking sector in the CENE region. The areas of future research should include proposing a modification to existing bank business models in order to improve bank efficiency and competitive position, without encouraging an excessive risk, and to allow for the active participation of banks in economic recovery (Oliver Wyman 2019, 2021).
Finally, it is worth noticing that although most bank efficiency research assumes that banks are managed in a similar fashion, in reality, banks are different because of their historical developments, their size and complexity, and their reward systems (Bhagat et al. 2015). Moreover, firm size is commonly considered as a fundamental firm characteristic. In banking studies, size is typically measured by total assets, which reflects a firm’s total resources. However, different size proxies (total assets, total sales, and market capitalization) capture different aspects of “firm size” and thus have different implications (Dang et al. 2018). For example, in a study by Neves et al. (2020), conducted for the Eurozone countries, bank size was measured by a number of employees. In their study, bank size was negatively related to profitability, which was explained by the fact that the higher the number of employees, the higher are the salaries and the lower is the operating efficiency. Dang (2019) also examined how loan growth affects the performance of banks, particularly increasing credit risk, based on the case of Vietnam during the 2006–2017 period. His study emphasized the importance of caution in an aggressive expansion of lending activities, as a dynamic loan growth can constitute a potential driver of bank poor performance.
Moreover, sometimes the term “management” is replaced by “leadership,” which is also dangerous, particularly for a complex organization (Dinesen 2020). Consequently, another recommendation for future research would be to complement analysis of exogenous factors influencing bank risk and returns with the analysis of bank-based factors, such as the way banks are individually managed and to implement firm- and manager-specific heterogeneities in determining incentives and policies that influence risk and performance (Coles and Li 2020) and to put more stress on individual bank complexity (Keen 2017).
Author Contributions
Conceptualization, E.M., K.K. and M.I.; methodology, K.K.; software, K.K.; validation, K.K.; formal analysis, E.M. and K.K.; investigation, E.M., K.K. and M.I.; resources, E.M., K.K. and M.I.; data curation, K.K.; writing—original draft preparation, E.M., K.K. and M.I.; writing—review and editing, E.M., visualization, K.K. and M.I.; supervision, E.M.; project administration, E.M. and K.K.; funding acquisition, E.M. and K.K. All authors have read and agreed to the published version of the manuscript.
Funding
The publication was financed from the subsidy granted to Cracow University of Economics (20/EFB/2021/POT).
Institutional Review Board Statement
Not applicable.
Informed Consent Statement
Not applicable.
Data Availability Statement
The sources of data were: BankFocus database (https://0-bankfocus-bvdinfo-com.brum.beds.ac.uk/version-2021107/bankfocus), World Bank database (https://data.worldbank.org/), ECB: consolidated banking data (https://sdw.ecb.europa.eu/browse.do?node=9691533), ECB: financial markets and interest rates data (https://www.ecb.europa.eu/stats/financial_markets_and_interest_rates/html/index.en.html).
Conflicts of Interest
The authors declare no conflict of interest.
Appendix A

Table A1.
Digitalization challenges: CENE bank survey, 2021 (in%).
| Survey Questions | Answering Options | Answers CENE (without Poland) | Answers Poland | Total CENE |
|---|---|---|---|---|
| 1. What is the impact of technological changes and competition from the fintech sector on the banking market in your country? | Neutral—they will not threaten the existing market structure and products | 11 | 0 | 5 |
| Positive, evolutionary—improving customer satisfaction | 67 | 73 | 70 | |
| Positive, revolutionary—changes market functioning and the products’ offer | 22 | 27 | 25 | |
| Negative—changing market structure and displacing some products | 0 | 0 | 0 | |
| 2. Which banking market segment is most affected as a result of new technologies? | Robotization | 11 | 18 | 15 |
| Payment services | 45 | 55 | 50 | |
| Big data/cloud computing | 22 | 9 | 15 | |
| Credit services | 22 | 18 | 20 | |
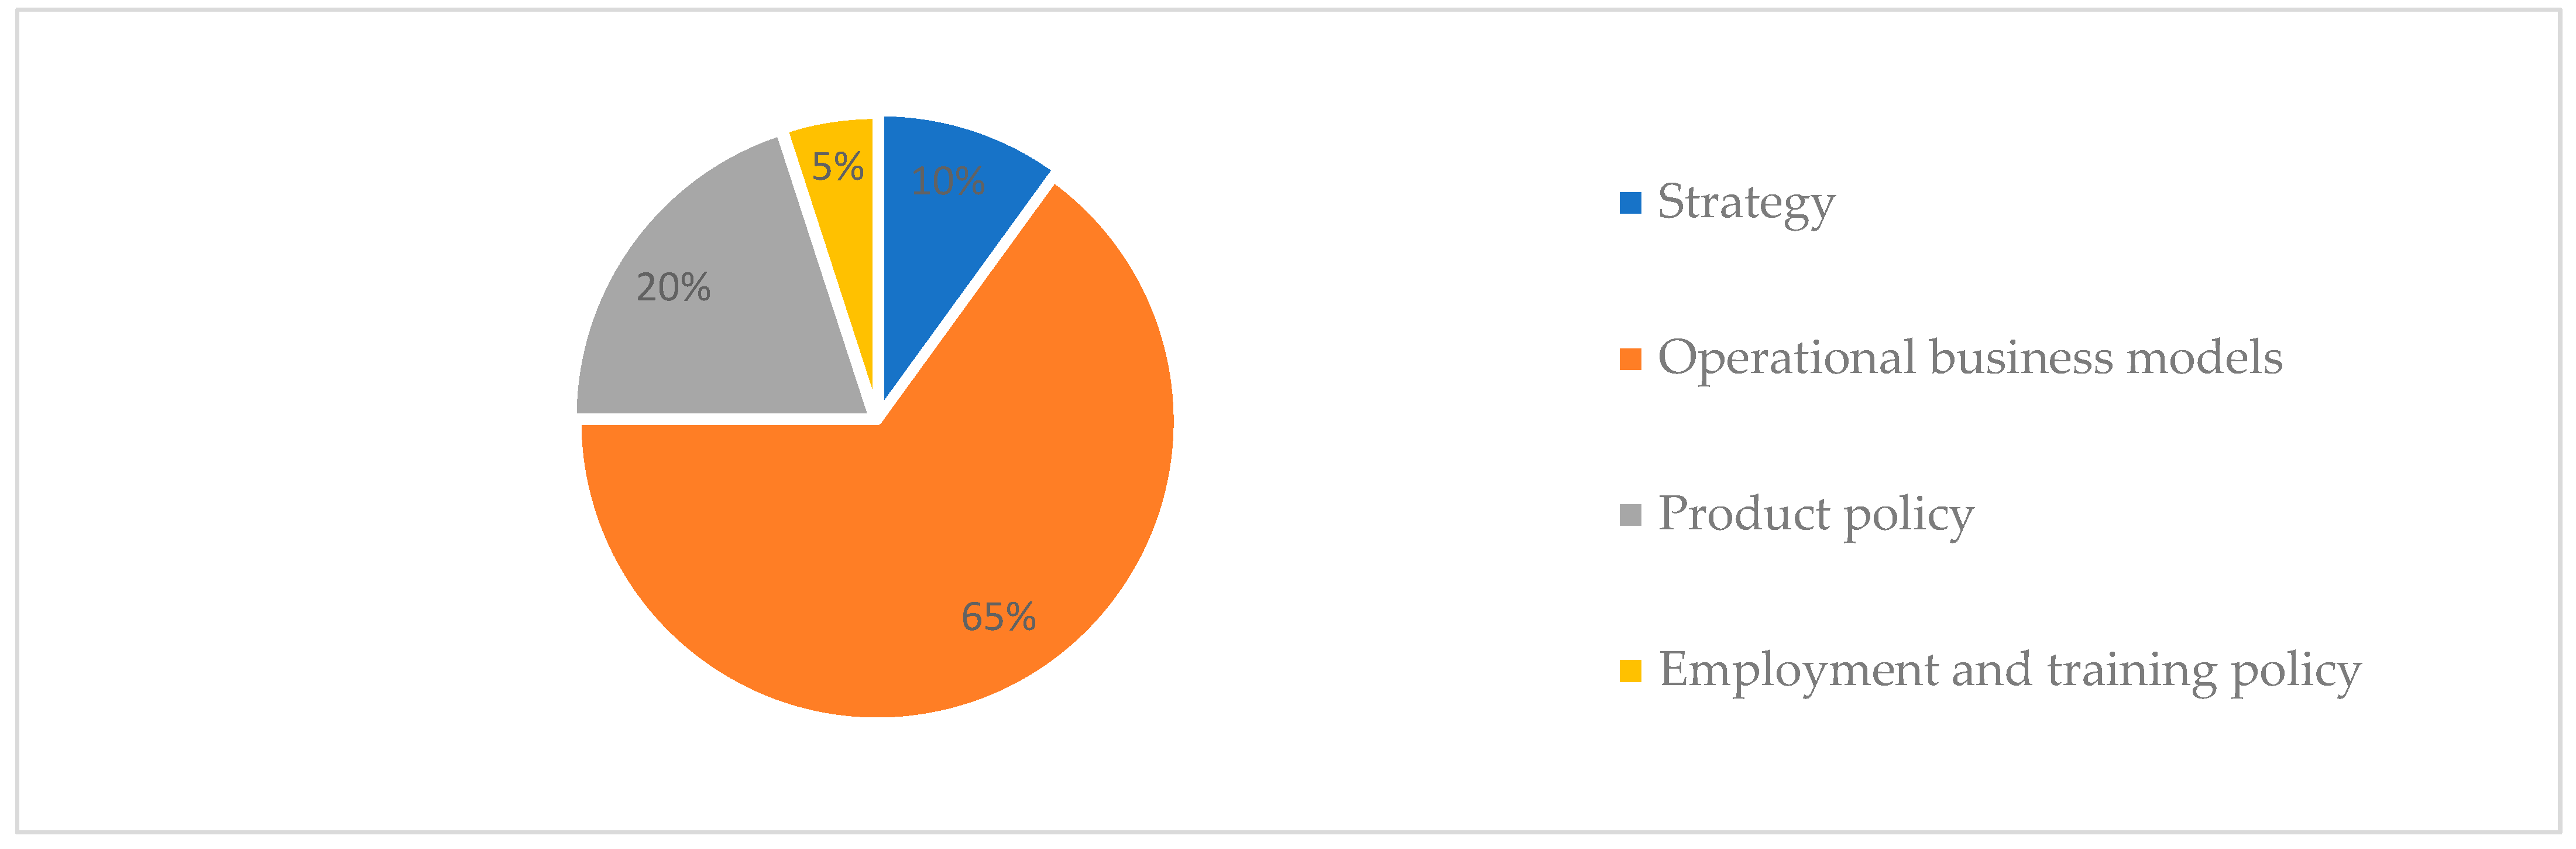
| 3. Which area of banks’ operations will be most impacted as a result of new technologies? | Strategy | 11 | 9 | 10 |
| Operational business models | 67 | 64 | 65 | |
| Product policy | 22 | 18 | 20 | |
| Employment and training policy | 0 | 9 | 5 | |
| 4. What are the main challenges for banks in implementing innovation? (up to 3 answers) | Cybersecurity | 56 | 100 | 80 |
| Cost barriers | 0 | 27 | 15 | |
| Managing complexity and integration of technological processes | 78 | 18 | 45 | |
| Regulatory barriers | 56 | 18 | 35 | |
| Customer education | 22 | 55 | 40 | |
| Employee competences | 33 | 36 | 35 | |
| 5. What are the outlays in your bank for digital transformation (in % of total investments)? | Significant—this is the main investment priority | 67 | 73 | 70 |
| On par with other investment priorities | 33 | 18 | 25 | |
| Low, mainly for reconstruction projects | 0 | 9 | 5 | |
| 6. How does your bank define its competitive position in the field of digitization? | We are market leaders, advanced in implementing new technologies | 56 | 82 | 70 |
| We are moderately advanced, similarly like our main competitors | 33 | 18 | 25 | |
| We are at an early stage of technological changes | 11 | 0 | 5 | |
| It is hard to say—we do not have a specific digitization strategy | 0 | 0 | 0 | |
| 7. Does your bank have a clearly articulated digitization strategy? | Yes, developed and implemented | 100 | 91 | 95 |
| Yes, but at the conceptual stage | 0 | 0 | 0 | |
| Yes, but the implementation was interrupted by the pandemic | 0 | 9 | 5 | |
| We do not see the need to prepare such a strategy | 0 | 0 | 0 | |
| 8. Has the COVID-19 pandemic revealed the need to change technological solutions in your bank? | Yes, strongly—in all areas of the bank’s operations | 11 | 18 | 15 |
| Yes, but mainly in access channels to products and services | 56 | 46 | 50 | |
| Yes, but mainly in the field of data management and information processing | 0 | 0 | 0 | |
| No | 33 | 36 | 35 | |
| 9. Has the COVID-19 pandemic revealed the need to change customer relations in your bank? | Yes, by adjusting the offer to the requirements of the younger generation of customers | 11 | 18 | 15 |
| Yes, by putting more emphasis on relationship banking | 22 | 36 | 30 | |
| Yes, through a greater emphasis on customer support through credit policy | 22 | 9 | 15 | |
| No | 44 | 36 | 40 | |
| 10.Has COVID-19 revealed the need for a fundamental change in your bank’s strategy? | Yes, by placing the emphasis on non-interest incomes | 0 | 18 | 10 |
| Yes, by changing the type of customer relationship | 11 | 46 | 30 | |
| Yes, through possible participation in consolidation processes | 22 | 0 | 10 | |
| No | 67 | 36 | 50 | |
| No. of banks | 9 | 11 | 20 |
Source: own calculations based on BankFocus database.
Table A2.
Correlation matrix.
| Var. | DEP_GR | GS_TA | NII_OR | NPL | LO_GR | LO_DEP | LO_TA | LN_TA | LTIR | HHI | C_GDP | GDP_GR | TCR | E_TA | FSI | MLPS | Z-SC | C/I | ROE | ROA |
|---|---|---|---|---|---|---|---|---|---|---|---|---|---|---|---|---|---|---|---|---|
| ROA | 0.04 | −0.02 | 0.02 | −0.39 | 0.05 | −0.02 | 0.15 | 0.12 | −0.03 | 0.18 | 0.06 | 0.17 | 0.06 | 0.07 | −0.30 | 0.62 | −0.01 | −0.39 | 0.63 | 1.00 |
| ROE | 0.02 | −0.06 | −0.01 | −0.39 | 0.03 | −0.04 | −0.07 | 0.13 | −0.02 | 0.08 | 0.03 | 0.10 | 0.03 | −0.13 | −0.10 | 0.45 | −0.14 | −0.29 | 1.00 | |
| C/I | −0.01 | 0.02 | −0.11 | 0.41 | −0.05 | 0.14 | −0.04 | −0.26 | −0.03 | 0.02 | −0.17 | −0.03 | −0.14 | −0.11 | 0.20 | −0.41 | −0.07 | 1.00 | ||
| Z-SC | 0.08 | 0.27 | 0.08 | 0.09 | 0.08 | 0.02 | 0.10 | −0.06 | 0.01 | −0.05 | 0.18 | 0.05 | 0.11 | 0.38 | 0.01 | −0.03 | 1.00 | |||
| MLPS | 0.00 | −0.23 | 0.26 | −0.53 | 0.06 | −0.07 | 0.45 | 0.37 | −0.11 | 0.16 | 0.17 | −0.01 | 0.15 | −0.01 | −0.23 | 1.00 | ||||
| FSI | 0.04 | −0.18 | 0.10 | 0.20 | −0.06 | −0.43 | −0.07 | −0.09 | 0.00 | 0.06 | −0.02 | −0.05 | 0.07 | 0.03 | 1.00 | |||||
| E_TA | 0.00 | 0.04 | −0.06 | 0.06 | 0.03 | −0.10 | 0.01 | −0.14 | −0.08 | 0.09 | 0.13 | 0.04 | 0.44 | 1.00 | ||||||
| TCR | −0.03 | −0.04 | 0.10 | 0.17 | −0.07 | −0.12 | −0.15 | −0.12 | −0.02 | 0.01 | −0.10 | −0.03 | 1.00 | |||||||
| GDP_GR | 0.04 | −0.05 | 0.00 | 0.08 | 0.05 | 0.14 | 0.05 | −0.06 | 0.35 | −0.14 | −0.08 | 1.00 | ||||||||
| C_GDP | 0.07 | −0.05 | 0.39 | −0.19 | 0.11 | 0.12 | 0.34 | 0.11 | −0.26 | 0.20 | 1.00 | |||||||||
| HHI | 0.09 | −0.28 | −0.11 | −0.07 | 0.09 | −0.13 | −0.04 | −0.31 | −0.61 | 1.00 | ||||||||||
| LTIR | 0.04 | 0.24 | 0.15 | −0.03 | 0.05 | 0.20 | 0.06 | 0.26 | 1.00 | |||||||||||
| LN_TA | 0.02 | 0.20 | 0.23 | −0.35 | 0.00 | 0.05 | 0.14 | 1.00 | ||||||||||||
| LO_TA | 0.07 | −0.23 | 0.44 | −0.31 | 0.15 | 0.20 | 1.00 | |||||||||||||
| LO_DEP | 0.02 | 0.11 | 0.11 | −0.08 | 0.05 | 1.00 | ||||||||||||||
| LO_GR | 0.36 | −0.05 | 0.14 | −0.25 | 1.00 | |||||||||||||||
| NPL | −0.06 | −0.01 | −0.29 | 1.00 | ||||||||||||||||
| NII_OR | 0.10 | −0.18 | 1.00 | |||||||||||||||||
| GS_TA | −0.03 | 1.00 | ||||||||||||||||||
| DEP_GR | 1.00 |
Table A3.
Descriptive statistics.
| Variable | Av. | Med. | S.D. | Min. | Max. |
|---|---|---|---|---|---|
| ROA | 0.80 | 0.74 | 1.19 | −8.17 | 7.11 |
| ROE | 8.52 | 7.72 | 14.9 | −70.1 | 134.2 |
| C/I | 63.0 | 57.7 | 42.2 | 6.00 | 799.6 |
| Z-SC | 49.3 | 36.0 | 48.0 | −6.76 | 333.1 |
| MLPS | 0.50 | 1.00 | 9.51 | −25.0 | 21.0 |
| FSI | 0.05 | 0.05 | 0.06 | −0.19 | 0.256 |
| E_TA | 11.3 | 10.0 | 9.13 | −59.2 | 82.2 |
| TCR | 21.7 | 18.5 | 13.2 | 4.69 | 129.3 |
| GDP_GR | 2.12 | 3.14 | 3.35 | −5.60 | 5.50 |
| C_GDP | 49.0 | 50.9 | 9.92 | 32.4 | 68.9 |
| HHI | 0.12 | 0.11 | 0.05 | 0.06 | 0.27 |
| LTIR | 1.50 | 1.29 | 1.10 | −0.53 | 3.54 |
| LN_TA | 7.94 | 8.04 | 1.55 | 4.44 | 11.2 |
| LO_TA | 57.6 | 59.8 | 22.3 | 2.28 | 99.7 |
| LO_DEP | 84.1 | 77.2 | 66.6 | 0.000 | 646.4 |
| LO_GR | 11.5 | 5.53 | 59.3 | −100.0 | 0.00 |
| NPL | 8.43 | 4.50 | 11.2 | 0.00 | 79.8 |
| NII_OR | 64.9 | 67.2 | 22.6 | −4.76 | 161.0 |
| GS_TA | 13.5 | 11.6 | 11.4 | 0.00 | 68.6 |
| DEP_GR | 13.6 | 6.15 | 62.9 | −93.5 | 961.2 |
References
- Allen, Franklin, Ana Babus, and Elena Carletti. 2009. Financial Crises: Theory and Evidence. European University Institute. Available online: http://apps.eui.eu/Personal/Carletti/ARFE-Crises-08June09-final.pdf (accessed on 5 June 2021).
- Allen, Franklin, and Elena Carletti. 2013. What is systemic risk? Journal of Money, Credit and Banking 45: 121–27. [Google Scholar] [CrossRef]
- Andreß, Hans-Jürgen, Katrin Golsch, and Alexander W. Schmidt. 2013. Applied Panel Data Analysis for Economic and Social Surveys. Berlin: Springer. [Google Scholar]
- Baltagi, Badi H. 2005. Econometric Analysis of Panel Data. Chichester: John Wiley and Sons. [Google Scholar]
- Beck, Thorsten, Ross Levine, and Norman Loayza. 2000. Finance and sources of growth. Journal of Financial Economics 58: 261–300. [Google Scholar] [CrossRef] [Green Version]
- Berger, Allen N., and David Humphrey. 1997. Efficiency of Financial Institutions: International Survey and Direction for Future Research. Journal of Operational Research 98: 175–212. [Google Scholar] [CrossRef] [Green Version]
- Bhagat, Sanjai, Brian Bolton, and Jun Lu. 2015. Size, leverage, and risk-taking of financial institutions. Journal of Banking & Finance 59: 520–37. [Google Scholar]
- BIS. 2018. Structural Changes in Banking after the Crisis, CGFS Papers No 60. Available online: https://www.bis.org/publ/cgfs60.pdf (accessed on 5 June 2021).
- BIS. 2019. BigTech in Finance: Opportunities and Risks. Annual Economic Report. Available online: https://www.bis.org/publ/arpdf/ar2019e3.htm (accessed on 5 June 2021).
- Blundell, Richard, and Stephen Bond. 1998. Initial conditions and moment restrictions in dynamic panel model data models. Journal of Econometrics 87: 115–43. [Google Scholar] [CrossRef] [Green Version]
- Bond, Stephen R. 2002. Dynamic Panel Data Models: A Guide to Micro Data Methods and Practice. Cemmap Working Paper 09/02. London: Institute for Fiscal Studies. [Google Scholar]
- Boot, Arnoud, Peter Hoffmann, Luc Laeven, and Lev Ratnovski. 2020. Financial intermediation and technology: What’s old, what’s new? ECB Discussion Paper 2438: 1–33. [Google Scholar] [CrossRef]
- Carletti, Elena, Stijn Claessens, Antonio Fatás, and Xavier Vives. 2020. The Bank Business Model in the Post-Covid-19 World. London: CEPR. [Google Scholar]
- Coles, Jeffrey L., and Zhichuan Frank Li. 2020. Managerial Attributes, Incentives, and Performance. The Review of Corporate Finance Studies 2: 256–301. [Google Scholar]
- Dang, Chongyu, Zhichuan Li, and Chen Yang. 2018. Measuring firm size in empirical corporate finance. Journal of Banking & Finance 86: 159–76. [Google Scholar]
- Dang, Van Dan. 2019. The effects of loan growth on bank performance: Evidence from Vietnam. Management Science Letters 9: 899–910. [Google Scholar] [CrossRef]
- Dańska-Borsiak, Barbara. 2009. Zastosowania panelowych modeli dynamicznych w badaniach mikroekonomicznych i makroekonomicznych. Przegląd Statystyczny 56: 25–41. [Google Scholar]
- De Haas, Ralph, Daniel Ferreira, and Anita Taci. 2010. What determines the composition of banks’ loan portfolios? Evidence from transition countries. Journal of Banking & Finance 34: 388–98. [Google Scholar]
- Deloitte. 2020a. CEE Banks Facing Challenging Times. Economic Turbulence to Boost Consolidation. Available online: https://www2.deloitte.com/content/dam/Deloitte/ce/Documents/finance/MA_Banking_study_2020_digital.pdf (accessed on 25 June 2021).
- Deloitte. 2020b. Digital Banking Maturity 2020. Available online: https://www2.deloitte.com/content/dam/Deloitte/ce/Documents/financial-services/ce-digital-banking-maturity-2020.pdf (accessed on 21 June 2021).
- Demirgüç-Kunt, Asli, and Harry Huizinga. 2010. Bank activity and funding strategies: The impact on risk and return. Journal of Financial Economics 98: 625–50. [Google Scholar] [CrossRef] [Green Version]
- Demirguc-Kunt, Asli, Enrica Detragiache, and Ouarda Merrouche. 2010. Bank Capital: Lessons from the Financial Crisis. IMF Working Paper 286: 1–35. [Google Scholar]
- Dinesen, Christian. 2020. Absent Management in Banking: How Banks Fail and Cause Financial Crisis. Cham: Palgrave Macmillan. [Google Scholar]
- European Parliament. 2021. Impacts of the COVID-19 Pandemic on EU Industries. Available online: https://www.europarl.europa.eu/thinktank/en/document.html?reference=IPOL_STU2021.662903 (accessed on 18 June 2021).
- EY. 2018. Global Banking Outlook. Available online: www.ey.com/en_gl/digital/banking-innovation (accessed on 10 June 2021).
- Fiordelisi, Franco. 2007. Shareholder value efficiency in European banking. Journal of Banking & Finance 31: 2151–71. [Google Scholar]
- Haq, Mamiza, and Richard Heaney. 2012. Factors determining European bank risk. Journal of International Financial Markets, Institutions & Money 22: 696–718. [Google Scholar]
- Horobet, Alexandra, Magdalena Radulescu, Lucian Belascu, and Sandra M. Dita. 2021. Determinants of Bank Profitability in CEE Countries: Evidence from GMM Panel Data Estimates. Journal of Risk and Financial Management 14: 307. [Google Scholar] [CrossRef]
- Iwanicz-Drozdowska, Małgorzata, Paweł Smaga, and Bartosz Witkowski. 2017. Role of Foreign Capital in Stability of Banking Sectors in CESEE Countries. Czech Journal of Economics and Finance 67: 492–511. [Google Scholar]
- Kantar. 2021. Zoom Finance 2021. Warsaw: Kantar. [Google Scholar]
- Keen, Steve. 2017. Can We Avid Another Financial Crisis? Cambridge: Polity Press. [Google Scholar]
- Kocisova, Kristina. 2015. Banking Stability Index: A Cross-Country Study. Paper presented at 15th International Conference of Finance and Banking Proceedings, Prague, Czech Republic, October 13–14; Available online: http://icfb2015.cms.opf.slu.cz/sites/icfb.rs.opf.slu.cz/files/kocisova.pdf (accessed on 25 June 2021).
- Lepetit, Laetitia, and Frank Strobel. 2015. Bank insolvency risk and Z-score measures: A refinement. Finance Research Letter 13: 214–24. [Google Scholar] [CrossRef] [Green Version]
- Miklaszewska, Ewa, and Krzysztof Kil. 2016. The Impact of 2007–9 Crisis on the Assessment of Bank Performance: The Evidence from CEE-11 Countries. Transformations in Business & Economics 2A: 459–79. [Google Scholar]
- NBP. 2020. Financial System in Poland 2019. Warsaw: NBP. [Google Scholar]
- Neves, Maria E. D., Maria D. C. Gouveia, and Catarina A. N. Proença. 2020. European Bank’s Performance and Efficiency. Journal of Risk and Financial Management 13: 67. [Google Scholar] [CrossRef] [Green Version]
- Oliver Wyman. 2019. Time to Start Again: The State of the Financial Services Industry. Available online: https://www.oliverwyman.com/content/dam/oliver-wyman/v2/publications/2019/January/The-State-Of-Financial-Services-2019-Time-to-start-again.pdf (accessed on 5 June 2021).
- Oliver Wyman. 2021. Ready to Lead: How Banks Can Drive the European Recovery. Available online: https://www.oliverwyman.com/content/dam/oliver-wyman/v2/publications/2021/jul/European-Banking-Outlook-2021.pdf (accessed on 5 June 2021).
- Raiffeisen Research. 2020. CEE Banking Sector Report. Available online: http://www.rbinternational.com/eBusiness/services/resources/media/829189266947841370829189181316930732_829602947997338151_829603177241218127-164075872827402397-1-2-EN.pdf (accessed on 25 June 2021).
- Samson, Kirk, and Gabriella Kusz. 2019. The Silver Lining of the Baltic Banking Crisis, Global Trade Magazine. Available online: https://www.globaltrademag.com/the-silver-lining-of-the-baltic-banking-crisis (accessed on 25 June 2021).
- ZBP. 2021. Reputation of the Polish Banking Sector 2021. Warsaw: ZBP. [Google Scholar]
Figure 1.
The percentage of customers using banking services in online and offline channels in Poland. Source: Kantar 2021.
Figure 1.
The percentage of customers using banking services in online and offline channels in Poland. Source: Kantar 2021.

Figure 2.
Satisfaction with and use of the banking services in different channels, 1Q 2021. Source: own computation based on data from ZBP 2021.
Figure 2.
Satisfaction with and use of the banking services in different channels, 1Q 2021. Source: own computation based on data from ZBP 2021.

Figure 3.
Satisfaction of contact initiation in new touchpoints, 1Q 2021. Source: own computation based on data from ZBP 2021.
Figure 3.
Satisfaction of contact initiation in new touchpoints, 1Q 2021. Source: own computation based on data from ZBP 2021.

Figure 4.
Customer satisfaction of banking services in relation to bank technological advancement, 2Q 2021. Source: own computation based on data from ZBP 2021.
Figure 4.
Customer satisfaction of banking services in relation to bank technological advancement, 2Q 2021. Source: own computation based on data from ZBP 2021.

Figure 5.
Customer trust in their bank in relation to bank technological advances, 2Q 2021. Source: own computation based on data from ZBP 2021.
Figure 5.
Customer trust in their bank in relation to bank technological advances, 2Q 2021. Source: own computation based on data from ZBP 2021.

Figure 6.
Which area of bank operation will be most impacted as a result of new technologies?

Figure 7.
What are the competitive advantages of banks in relation to the Fintech sector? (up to 3 answers).
Figure 7.
What are the competitive advantages of banks in relation to the Fintech sector? (up to 3 answers).

Figure 8.
Has the COVID-19 pandemic revealed the need to change technological solutions in your bank?
Figure 8.
Has the COVID-19 pandemic revealed the need to change technological solutions in your bank?

Figure 9.
Has the COVID-19 pandemic revealed the need to change customer relations in your bank?

Figure 10.
Has the COVID-19 pandemic revealed the need for a fundamental change in your bank strategy?
Figure 10.
Has the COVID-19 pandemic revealed the need for a fundamental change in your bank strategy?

Table 1.
Leading banks by assets in Europe and CEE (excluding Russia), December 2020.
| Bank/Country | Europe Assets in Billions EUR | Bank/Country | CEE Assets in Billions EUR |
|---|---|---|---|
| BNP Paribas/France | 2521 | PKO BP/Poland | 81.737 |
| HSBC/the UK | 2440 | ČSOB/Czech Republic | 66.927 |
| Credit Agricole/France | 2241 | OTP Bank/Hungary | 63.953 |
| Banco Santander/Spain | 1508 | Česká Spořitelna/Czech Rep. | 58.596 |
| Barclays/the UK | 1506 | Bank Pekao/Poland | 50.568 |
Source: for Europe, S&P Global Market Intelligence, https://www.spglobal.com/marketintelligence/en/news-insights/research/europes-50-largest-banks-by-assets-2021; for CEE, BankFocus database. Accessed on 10 July 2021.
Table 2.
The average performance ratios for CENE banking sectors: major indicators ROA, ROE, C/I, CAR, TCR, and risk-weight asset growth (RWA_GR).
Table 2.
The average performance ratios for CENE banking sectors: major indicators ROA, ROE, C/I, CAR, TCR, and risk-weight asset growth (RWA_GR).
| Country | ROA | ROE | C/I | TCR | CAR | RWA_GR | ||||||
|---|---|---|---|---|---|---|---|---|---|---|---|---|
| 2016–2019 | 2020 | 2016–2019 | 2020 | 2016–2019 | 2020 | 2016–2019 | 2020 | 2016–2019 | 2020 | 2016–2019 | 2020 | |
| CZ | 0.98 | 0.52 | 15.06 | 9.04 | 54.73 | 55.60 | 21.96 | 26.05 | 11.85 | 9.00 | 3.24 | 1.84 |
| EE | 2.08 | 0.79 | 14.25 | 6.95 | 58.37 | 72.36 | 22.01 | 23.12 | 12.22 | 12.53 | 51.06 | 10.93 |
| HU | 1.16 | 0.35 | 11.99 | 2.70 | 78.52 | 68.73 | 20.00 | 20.29 | 11.93 | 9.41 | 6.61 | 6.47 |
| LT | 1.46 | 1.07 | 14.40 | 11.04 | 48.47 | 48.54 | 20.40 | 21.84 | 12.24 | 9.24 | 8.27 | 10.04 |
| LV | 0.90 | −0.12 | 5.65 | −0.67 | 74.46 | 95.68 | 20.86 | 22.93 | 12.82 | 13.20 | 1.92 | 1.50 |
| PL | 0.55 | −0.08 | 3.58 | −1.74 | 58.47 | 69.56 | 20.51 | 19.59 | 13.38 | 10.04 | 17.38 | 0.12 |
| SK | 0.74 | 0.50 | 7.28 | 5.24 | 60.71 | 62.67 | 21.55 | 18.40 | 14.59 | 9.71 | 5.67 | 1.12 |
| Av. CENE | 0.91 | 0.35 | 9.45 | 4.33 | 62.20 | 67.47 | 21.47 | 22.36 | 11.56 | 10.26 | 12.08 | 3.16 |
Source: own calculations based on the BankFocus database.
Table 3.
The average results for CENE banks: stability and synthetic performance indicators.
| Country | Z-SC | MLPS | FSI | |||||
|---|---|---|---|---|---|---|---|---|
| 2004–2014 * | 2016–2019 | 2020 | 2004–2014 * | 2016–2019 | 2020 | 2016–2019 | 2020 | |
| CZ | 19.05 | 43.60 | 41.79 | 4.79 | 3.33 | 4.2 | 0.04 | 0.06 |
| EE | 21.87 | 41.67 | 44.66 | 3.18 | 4.93 | 4.4 | 0.06 | 0.08 |
| HU | 10.38 | 34.82 | 27.62 | 1.89 | −1.95 | −3.8 | 0.04 | 0.05 |
| LT | 11.96 | 43.71 | 40.11 | −0.08 | 7.53 | 9.0 | 0.02 | 0.07 |
| LV | 12.89 | 35.49 | 34.56 | −4.09 | −3.78 | −5.1 | 0.02 | 0.06 |
| PL | 18.66 | 59.09 | 44.87 | 5.00 | −1.53 | −4.8 | 0.04 | 0.09 |
| SK | 22.61 | 73.41 | 75.19 | 3.72 | 0.55 | 3.8 | 0.01 | 0.05 |
| Av. CEE | 16.22 | 50.54 | 43.67 | - | - | - | 0.03 | 0.07 |
Source: own calculations. * calculations of Z-score and MLPS score for 2004–2014 period: Miklaszewska and Kil (2016).
Table 4.
Dependent variables.
| Variable | Characteristics | Rationale |
|---|---|---|
| ROA | Return on assets | Profitability indicator |
| ROE | Return on equity | Profitability indicator |
| C/I | Cost to income ratio | Cost-efficiency indicator |
| Z-SC | Bank distnce from banktruptcy: compares the capitalization (CAR) and return (ROA) buffers with risk, represented by volatility of returns and measured by standard deviation of ROA | Bank stability indicator |
| MLPS | Multi-level performance score composed of three efficiency ratios (ROE, C/I, and loan accessibility measured by loans to asset ratio) and two stability indicators (Z-score and NPL level), interpreted relatively to the whole analysed group | An aggregate performance idicator |
| FSI | Financial stability indicator Composed of five performance indicators, representing profitability, capital adequacy, asset quality, and two liquidity measures | An aggregate financial stability indicator |
| E_TA | Equity to assets ratio | An indicator of financial leverage |
| TCR | Total capital ratio | The regulatory capital adequacy indicator |
Table 5.
Explanatory variables.
| Variable | Characteristics | Rationale/Explaining Factor | Source of Data |
|---|---|---|---|
| Bank Level Variables | |||
| LN_TA | Ln of total assets | Bank scale | BankFocus (or own culations based on Bankfocus) |
| LO_TA | Loans to assets ratio | Bank credit policy | |
| LO_GR | Non-financial loan growth (annual % change) | Changes in demand and supply of loans | |
| NPL | Non-performing loans ratio | Credit risk | |
| LO_DE | Loans to deposit ratio | Bank financial strategy | |
| NII_OR | Non-interest income ratio | Diversification of incomes | |
| GS_TA | Government debt securities as a share of total assets | Bank involvement in financing of public debt | |
| DEP_GR | The annual growth rate of deposits placed by non-financial sector | Supply of deposits | |
| Macro-Level Variables | |||
| GDP_GR | GDP growth | Economic growth | Eurostat |
| C_GDP | Domestic credit to private sector as % of GDP | Banking sector development indicator | World Bank |
| HHI | Herfindahl–Hirschman Index | Concentration index | ECB: consolidated banking data |
| LTIR | Long-term interest rate (yield to maturity on long-term government bonds) | Interest rate risk | ECB: financial markets and interest rates data |
Table 6.
Panel model results for performance indicators (ROA, ROE, C/I).
| Variable | ROA | ROE | C/I |
|---|---|---|---|
| BP(-1) | 0.509 *** (0.187) | 0.634 *** (0.175) | 0.365 * (0.218) |
| Const | −0.818 (1.324) | 3.528 (9.22) | 101.89 * (56.358) |
| GDP_GR | 0.077 *** (0.015) | 0.717 *** (0.124) | −0.848 ** (0.411) |
| C_GDP | 0.005 (0.006) | 0.063 (0.056) | −0.21 (0.186) |
| HHI | 3.345 * (1.913) | 3.371 (14.23) | −72.48 * (42.132) |
| LTIR | 0.064 (0.063) | 0.165 (0.521) | −2.025 (1.344) |
| LN_TA | 0.032 (0.05) | 0.205 (0.288) | −3.741 (2.419) |
| LO_TA | −0.003 (0.003) | −0.066 (0.046) | 0.124 * (0.07) |
| LO_DEP | −0.001 (0.001) | −0.009 (0.01) | 0.015 (0.021) |
| LO_GR | 0.005 (0.004) | 0.045 * (0.024) | −0.166 ** (0.069) |
| NPL | −0.027 ** (0.011) | −0.255 *** (0.084) | 0.387 (0.264) |
| NII_OR | 0.002 (0.005) | −0.025 (0.032) | −0.199 (0.16) |
| GS_TA | −0.005 (0.005) | −0.146 * (0.081) | 0.087 (0.136) |
| DEP_GR | −0.002 *** (0.001) | −0.019 *** (0.007) | 0.08 ** (0.039) |
| No. observation | 228 | 228 | 249 |
| AR (1) test | −1.74442 (0.0211) | −2.00929 (0.0445]) | −2.55095 (0.0107) |
| AR (2) test | 0.877989 (0.3799) | −0.748511 (0.4542) | −1.48856 (0.1366) |
| Hansen test | 4.46435 (0.8130) | 10.5678 (0.2274) | 7.69091 (0.4642) |
Note: *** significance at the level of 1%, ** significance at the level of 5%, * significance at the level of 10%. Source: Own study.
Table 7.
Panel model results: risk-based stability and performance indicators (Z-score, MLPS, and FSI).
Table 7.
Panel model results: risk-based stability and performance indicators (Z-score, MLPS, and FSI).
| Variable | Z-SC | MLPS | FSI |
|---|---|---|---|
| BP(-1) | 0.864 *** (0.056) | 0.827 *** (0.114) | 0.102 *** (0.020) |
| Const | −0.513 (6.755) | −7.705 (4.690) | 0.075 * (0.044) |
| GDP_GR | 0.276 ** (0.114) | 0.241 ** (0.095) | −0.001 (0.001) |
| C_GDP | 0.142 ** (0.067) | −0.026 (0.028) | 0.000 (0.000) |
| HHI | 2.171 (16.311) | 15.549 * (9.360) | −0.129 (0.096) |
| LTIR | 0.186 (0.709) | −0.088 (0.660) | 0.003 (0.004) |
| LN_TA | −1.251 ** (0.544) | 0.547 (0.481) | 0.001 (0.003) |
| LO_TA | 0.082 (0.053) | - | 0.000 (0.000) |
| LO_DEP | −0.013 (0.028) | 0.009 (0.008) | - |
| LO_GR | −0.006 (0.05) | 0.026 (0.031) | −0.001 *** (0.000) |
| NPL | 0.037 (0.089) | - | - |
| NII_OR | 0.037 (0.055) | 0.029 (0.024) | 0.000 (0.000) |
| GS_TA | 0.187 (0.155) | −0.028 (0.035) | −0.001 ** (0.000) |
| DEP_GR | −0.033 (0.031) | −0.028 ** (0.011) | 0.000 (0.000) |
| No. observation | 228 | 260 | 206 |
| AR (1) test | −1.99955 (0.0455) | −3.76847 (0.0002) | 0.279244 (0.0401) |
| AR (2) test | 0.67514 (0.4996) | 0.682279 (0.4951) | −1.46015 (0.1442) |
| Hansen test | 11.4202 (0.1790) | 15.1513 (0.1563) | 13.5978 (0.2127) |
Note: *** significance at the level of 1%, ** significance at the level of 5%, * significance at the level of 10%. Source: Own study.
Table 8.
Panel model results: indicators of bank capitalization: leverage (E_TA) and TCR.
| Variable | E_TA | TCR |
|---|---|---|
| BC(-1) | 0.852 *** (0.074) | 1.027 *** (0.052) |
| Const | 0.177 (1.13) | −1.111 (2.585) |
| GDP_GR | 0.062 ** (0.031) | −0.128 ** (0.053) |
| C_GDP | 0.011 (0.012) | −0.025 (0.03) |
| HHI | 4.681 (3.795) | −2.225 (5.381) |
| LTIR | 0.193 (0.184) | −0.274 (0.326) |
| LN_TA | −0.233 ** (0.104) | 0.177 (0.16) |
| LO_TA | 0.005 (0.015) | −0.011 (0.016) |
| LO_DEP | 0.007 (0.012) | 0.001 (0.007) |
| LO_GR | −0.019 * (0.011) | −0.038 ** (0.018) |
| NPL | 0.016 (0.021) | −0.059 * (0.03) |
| NII_OR | 0.007 (0.01) | 0.041 *** (0.013) |
| GS_TA | 0.027 (0.02) | 0.03 (0.033) |
| DEP_GR | −0.008 (0.008) | −0.017 (0.015) |
| No. of observation | 249 | 233 |
| AR (1) test | −2.81652 (0.0049) | −2.39085 (0.0168) |
| AR (2) test | 0.460254 (0.6453) | −0.681621 (0.4955) |
| Hansen test | 8.00543 (0.4329) | 5.8789 (0.6608) |
Note: *** significance at the level of 1%, ** significance at the level of 5%, * significance at the level of 10%. Source: Own study.
Publisher’s Note: MDPI stays neutral with regard to jurisdictional claims in published maps and institutional affiliations. |
© 2021 by the authors. Licensee MDPI, Basel, Switzerland. This article is an open access article distributed under the terms and conditions of the Creative Commons Attribution (CC BY) license (https://creativecommons.org/licenses/by/4.0/).
Share and Cite
MDPI and ACS Style
Miklaszewska, E.; Kil, K.; Idzik, M. How the COVID-19 Pandemic Affects Bank Risks and Returns: Evidence from EU Members in Central, Eastern, and Northern Europe. Risks 2021, 9, 180. https://0-doi-org.brum.beds.ac.uk/10.3390/risks9100180
AMA Style
Miklaszewska E, Kil K, Idzik M. How the COVID-19 Pandemic Affects Bank Risks and Returns: Evidence from EU Members in Central, Eastern, and Northern Europe. Risks. 2021; 9(10):180. https://0-doi-org.brum.beds.ac.uk/10.3390/risks9100180
Chicago/Turabian StyleMiklaszewska, Ewa, Krzysztof Kil, and Marcin Idzik. 2021. "How the COVID-19 Pandemic Affects Bank Risks and Returns: Evidence from EU Members in Central, Eastern, and Northern Europe" Risks 9, no. 10: 180. https://0-doi-org.brum.beds.ac.uk/10.3390/risks9100180
Note that from the first issue of 2016, this journal uses article numbers instead of page numbers. See further details here.