Article

Risk Assessment for Personalized Health Insurance Based on Real-World Data

by
Aristodemos Pnevmatikakis
1,*,
Stathis Kanavos
1,
George Matikas
1,
Konstantina Kostopoulou
1,
Alfredo Cesario
1,2 and
Sofoklis Kyriazakos
1,3
1
Innovation Sprint Sprl, Clos Chapelle-aux-Champs 30, 1200 Brussels, Belgium
2
Scientific Directorate, Fondazione Policlinico A. Gemelli IRCCS, 00168 Rome, Italy
3
Business Development and Technology Department, School of Business and Social Sciences, Aarhus University, Birk Centerpark 15, 7400 Herning, Denmark
*
Author to whom correspondence should be addressed.
Submission received: 2 February 2021 / Revised: 19 February 2021 / Accepted: 21 February 2021 / Published: 1 March 2021

Abstract

:
The way one leads their life is considered an important factor in health. In this paper we propose a system to provide risk assessment based on behavior for the health insurance sector. To do so we built a platform to collect real-world data that enumerate different aspects of behavior, and a simulator to augment actual data with synthetic. Using the data, we built classifiers to predict variations in important quantities for the lifestyle of a person. We offer a risk assessment service to the health insurance professionals by manipulating the classifier predictions in the long-term. We also address virtual coaching by using explainable Artificial Intelligence (AI) techniques on the classifier itself to gain insights on the advice to be offered to insurance customers.

1. Introduction

Health insurance products are today static in terms of customers’ health evaluation. Any personalization is based on a risk assessment of static data from the medical record of the customer and questionnaires they answer at the contract setup phase. Personalized health insurance products need to be dynamic, employing a continuous risk assessment of the customer.
Medical history of insurance customers can be scarce, and anyway only partly determines health. There are several studies that provide evidence about the relation between lifestyle and health. A study on diabetes prevention (Grey 2017) suggests that lifestyle is important for the outcomes in youths and adults. It correlates with the fact that obesity in adults has risen from less than 5% to more than 40% in some states, with an increase seen in type II diabetes over the last 20 to 30 years. Another study (Joseph-Shehu et al. 2019) shows that a good health-promoting lifestyle, especially health responsibility, physical activity and stress management, is a determinant of overweight and obesity, a major risk factor for cardiovascular diseases, type II diabetes and some forms of cancer. Behavioral, environmental, occupational and metabolic risk factors have been analyzed, leading to the 2017 global burden of disease study (Stanaway et al. 2018).
Risk assessment is an integral part of the insurance industry (Blackmore 2016b), but it is usually static, done at the beginning of a contract with a client. While the continuous estimation of risk factors is well-known in medicine, it is not widely used to personalize insurance products. Such personalized products start appearing as digital risk assessment platforms based on data start transforming insurance (Blackmore 2016a), and have been explored in the car insurance sector. The importance of vehicle-based risk assessment is discussed in Ref. (Gage et al. 2015). Usage-based insurance utilizes driver behavior analysis based on big data, as discussed in Ref. (Arumugam and Bhargavi 2019). Similarly, pricing innovations in German car insurance are addressed via telematics driving profile classification in Ref. (Weidner et al. 2017).
Unlike medical history where a snapshot in time yields information, lifestyle and behavior cannot be assessed momentarily, since they involve people’s habits and their continuous change. As such, personalized health insurance products require the continuous monitoring of customers’ lifestyle and behavior. This can be achieved with software tools for the collection of data chosen so that they capture important aspects of lifestyle and behavior. In this work we rigorously define with insurance experts the data to be collected, and we employ the Healthentia system (Innovation Sprint 2020) for data collection. Given the collected behavioral data of their customers, risk assessment services can be provided to health insurance professionals by training machine learning (ML) predictors for important health parameters. The usage of ML in insurance is not new. ML has been used to analyze insurance claim data (Bermúdez et al. 2020, Burri et al. 2019). The work in Ref. (Qazvini 2019) explores how the vehicle insurance coverage affects driving behavior and hence insurance claims. Instead of an analysis of data at the end of the insurance pathway, after the event, this paper focuses on the continuous analysis of data at the source (the customer) to modify the insurance pathway by personalizing the insurance product.
Insurance companies benefit from personalized dynamic product offerings, as they can be competitive with lower prices for low-risk customers. However, to obtain their customers’ consent to monitor them, insurance companies also need to persuade their customers about the benefits for them. Customers will potentially consent to two types of rewards: On the one hand, monetary rewards stem from receiving personalized offers with reduced premiums due to the lower risk of their healthy behavior. On the other hand, coaching for well-being is an indirect reward that can be offered by employing explainable AI techniques in the classifiers utilized by the risk assessment service.
The structure of this paper is as follows: Section 2 addresses data collection, identifying what and how to measure. In Section 3, classifiers on well-being are used both to assess risk and to establish personalized advice for well-being coaching. This work leads to the introduction of personalized health insurance products by the relative pilot of the INFINITECH project (Infinitech H2020 2020), as discussed in Section 4. Finally, the conclusions are drawn in Section 5.

2. Data Collection

In this section we address data collection, addressing issues on what to measure and how to end up with the necessary volume of Real-World Data (RWD). First, the necessary measured and reported RWD are established. Then the Healthentia system (Innovation Sprint 2020) used for collecting the RWD is introduced. Finally, the reasons and method for augmenting the data by synthetic RWD are analyzed.

2.1. Real-World Data

According to the Food and Drug Administration (FDA), RWD are “data related to patient health status and/or the delivery of health care routinely collected from Electronic Health Records (EHRs), claims and billing data, data from product and disease registries, patient-generated data including home-use settings, and data gathered from other sources that can inform on health status, such as mobile devices.” (US FDA 2017).
Two types of RWD are collected as input for the risk assessment: measurements and user reports. The measurements are values collected by sensors, which are automatically reported by these sensors to the data collection system, without the intervention of the user. They are objective RWD, since their quality only depends on the devices’ measurement accuracy.
User reports are formally termed patient-reported outcomes (PRO). The FDA definition of PRO includes all data related to a patient as “any report of the status of the patient’s health condition that comes directly from the patient, without interpretation of the patient’s response by a clinician or anyone else” (US FDA 2009). Indeed, PROs may refer to symptoms related to a disease, functional statuses, or answers to complex questionnaires such as the health-related quality of life questionnaire (Revicki et al. 2000). According to Ref. (Grey 2017), the inclusion of PROs in assessing one’s status allows better understanding of the user’s experience, especially in the domains of pain, fatigue and symptoms. User reports can be measurements taken by the user using a device, as long as the user themselves enters the data into the system, or a personal assessment of their status. They are subjective RWD, since their accuracy depends on the users’ understanding of the assessment at hand, their ability for objective self-assessment, and on their accuracy in data entry.

2.1.1. Measurements and Reports

The RWD we measured for risk assessment have to do with physical activity, the heart, and sleep. Regarding physical activity, we measured steps, distance, elevation, energy consumption and time spent in three different zones of activity intensity (light, moderate and intense). Regarding the heart, we measured the resting heart rate and the time spent in different zones of heart activity (fat burn, cardio and peak). Regarding sleep, we measured the time to bed and waking up time, so indirectly we got the sleep duration. We also measured the time spent in the different sleep stages (light, REM and deep sleep).
The reports we received from the users have to do with common symptoms, nutrition, mood and quality of life. The symptoms are systolic and diastolic blood pressure and body temperature (entered as numbers measured by the users), as well as cough, diarrhea, fatigue, headache and pain (where the user provides a five-level self-assessment of severity from not at all up to very much). Regarding nutrition, the user enters the number of meals and whether they contain meat, as well as the consumption of liquids: water, coffee, tea, refreshments and spirits. Mood is a five-level self-assessment of the user’s psychological condition, from very positive to neutral, and down to very negative. Finally, quality of life (Revicki et al. 2000) was reported using the EuroQol five degrees, five levels (EQ-5D-5L) questionnaire (Stolk et al. 2019), which asks the user to assess their status in five fields using five levels. The fields were mobility, self-care, usual activities, pain/discomfort and anxiety/depression, complemented with the overall health assessment.

2.1.2. Introducing History

As behavior is about habits and not so much the current status, risk assessment does not depend only on current values of the different quantities, but also on their temporal evolution. The temporal information for any quantity can be included by just using all d past samples of the quantity, but this leads to an unmanageable amount of input data. Another option is to use models of the past values: temporal evolution can be represented by assuming the normal distribution of the quantity, using its average and standard deviation.
Averages updated at every time step n with memory a n ( d ) can approximate expectations of the k-th power of any RWD sequence x n :
x n k ¯ ( d ) = a n ( d ) · x n 1 k ¯ ( d ) + ( 1 a n ( d ) ) x n k
where the memory is given by:
a n ( d ) = { 1 1 / n n < d 1 1 / d n d
The parameter d can be considered as the length of the memory, i.e., the approximate days that influence the average. The memory can be short- or long-term depending on the choice of d. We select a value of 7 for short-term averages (approximately, the last week is influencing short-term averages), and a value of 84 for long term averages (approximately 12 weeks–3 months influencing long-term averages).
The first order ( k = 1 ) and second order ( k = 2 ) averages yield the standard deviation estimates:
σ n ( d ) = x n 2 ¯ ( d ) ( x n ¯ ( d ) ) 2
We define the trend of a measurement as the variation in the short-term average from its long-term counterpart, normalized by the long-term standard deviation. The trend is then given by:
T n = x n ¯ ( d l o n g ) x n ¯ ( d s h o r t ) σ n ( d l o n g )
We add temporal information about all collected RWD by using the short- and long-term averages, as well as their trends. While missing measurements are very unusual and an indication of some failure, missing values in the reports are normal. Nobody expects users to be entering normal body temperatures and lack of symptoms, thus in the above calculations we consider missing reports in a day as indicating normality, and we use the equivalent values in the updates.

2.1.3. Composite Measurements
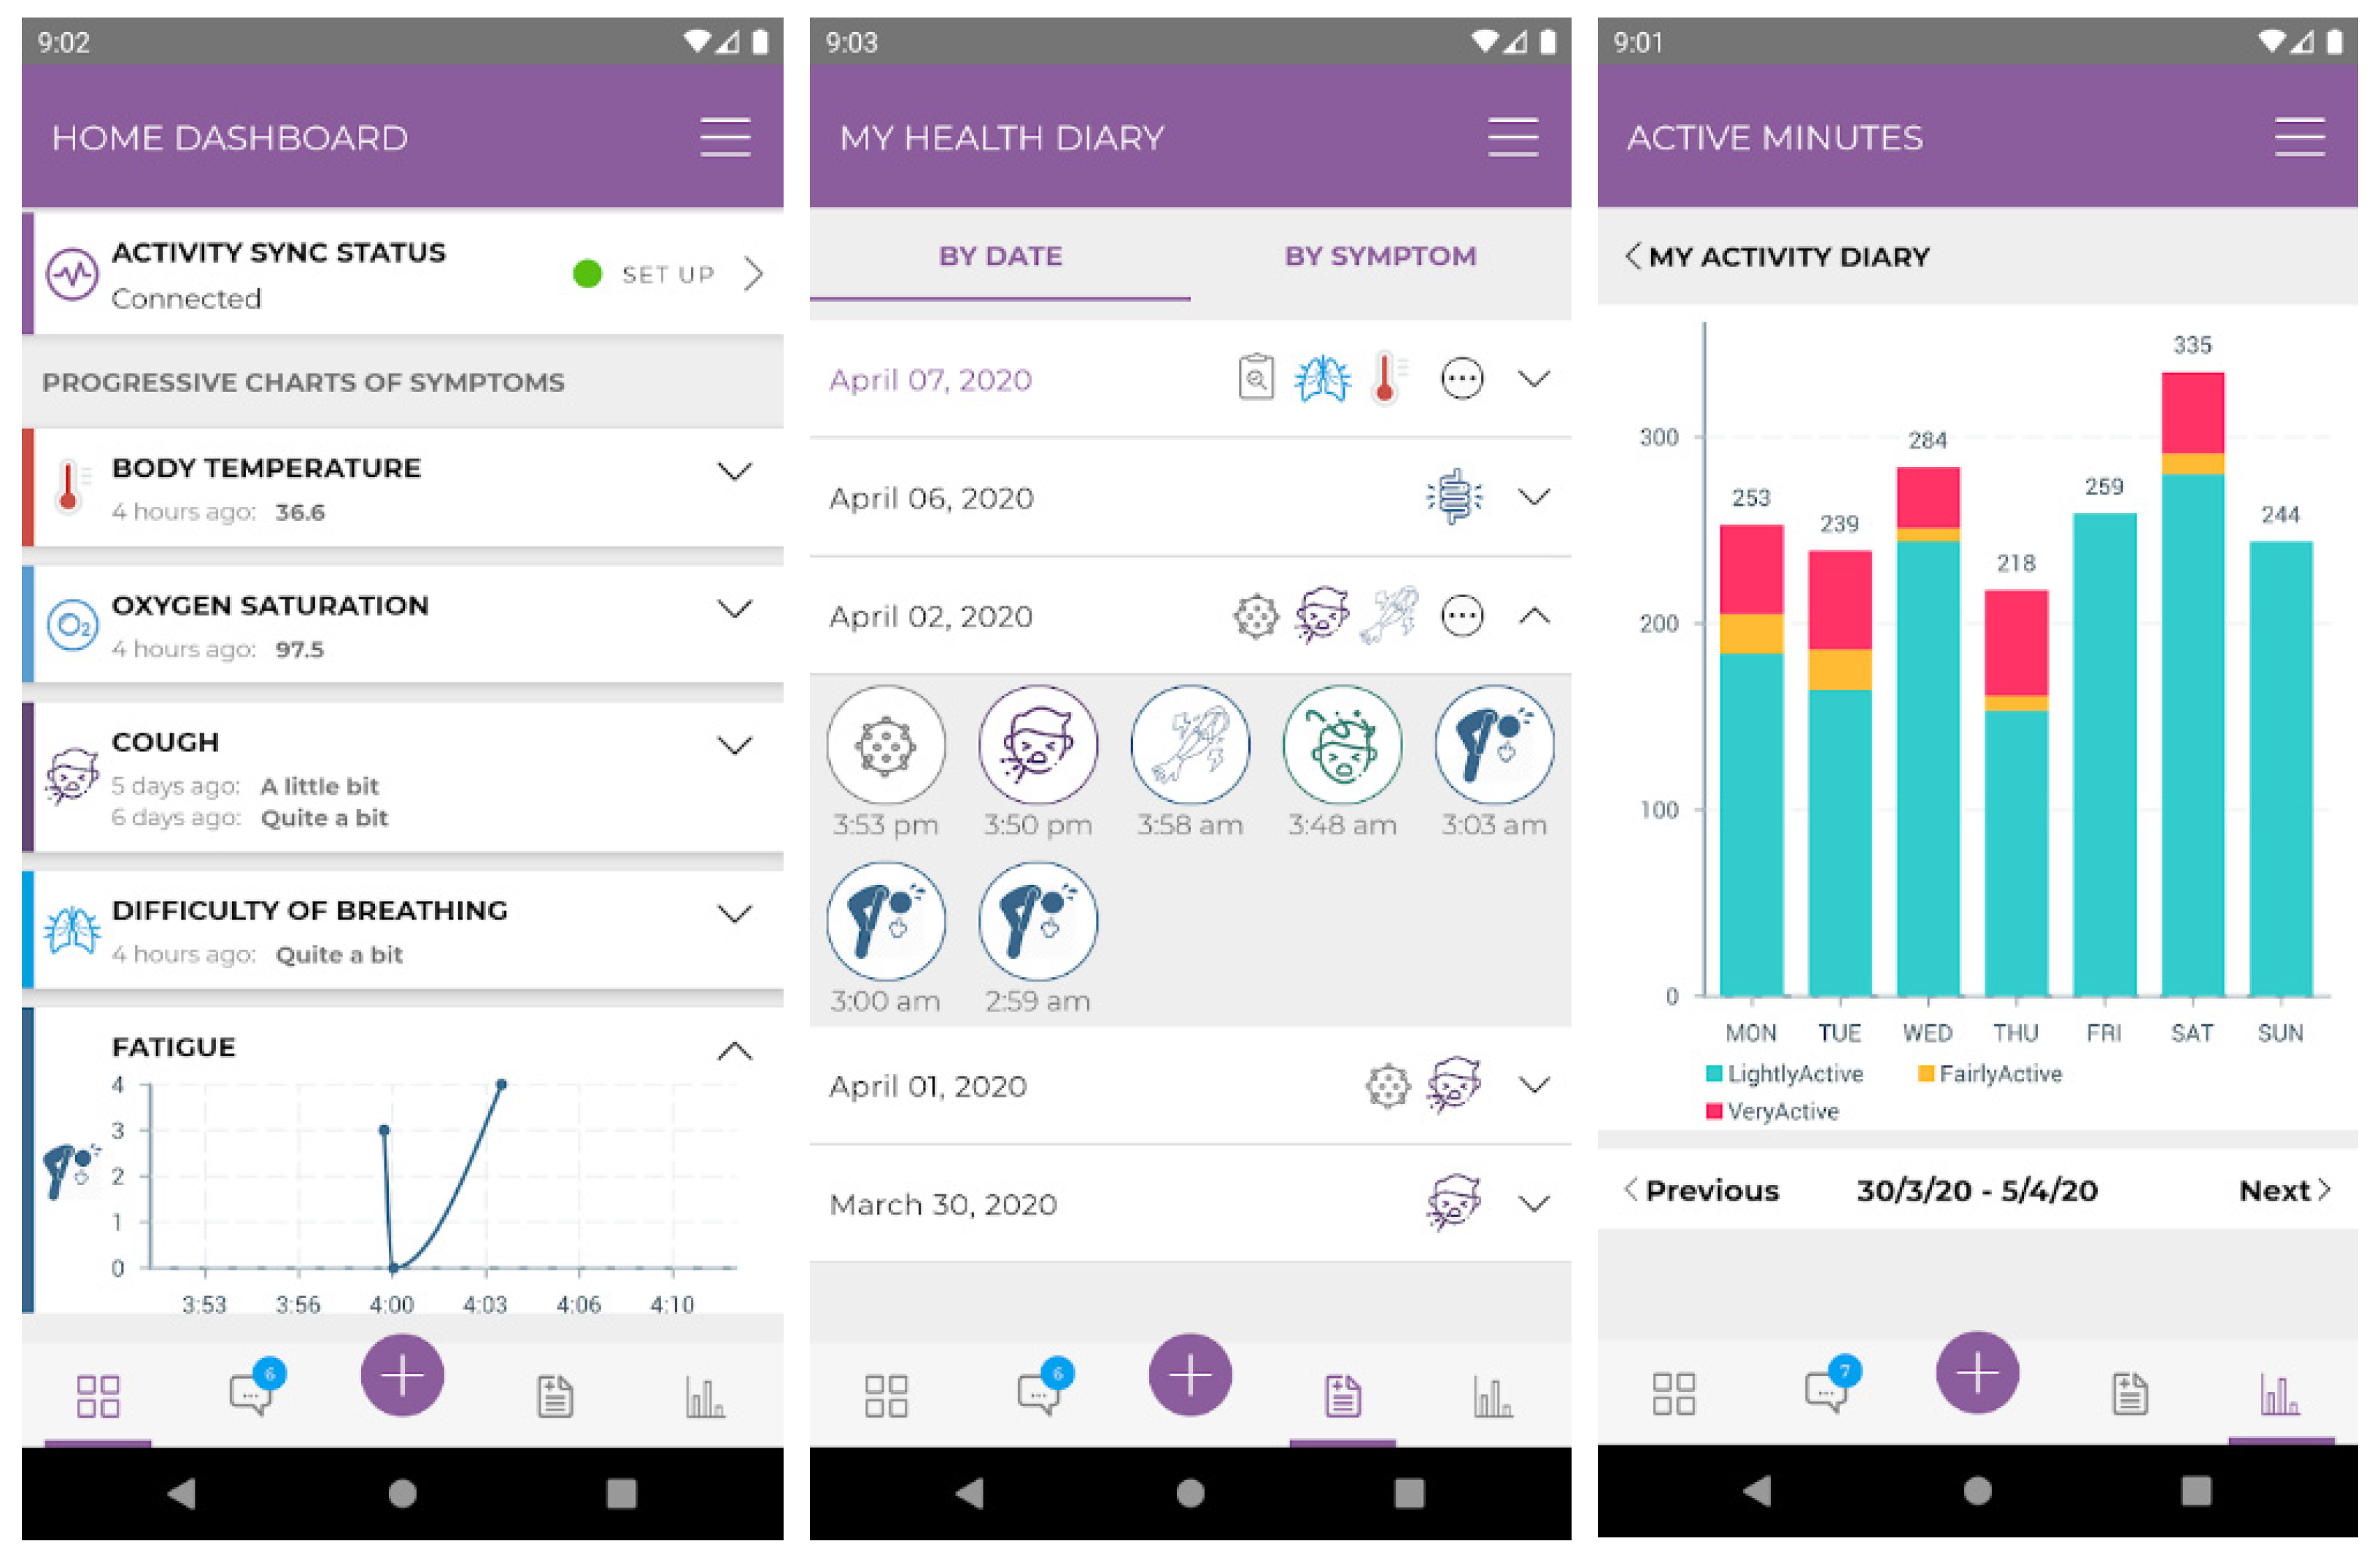
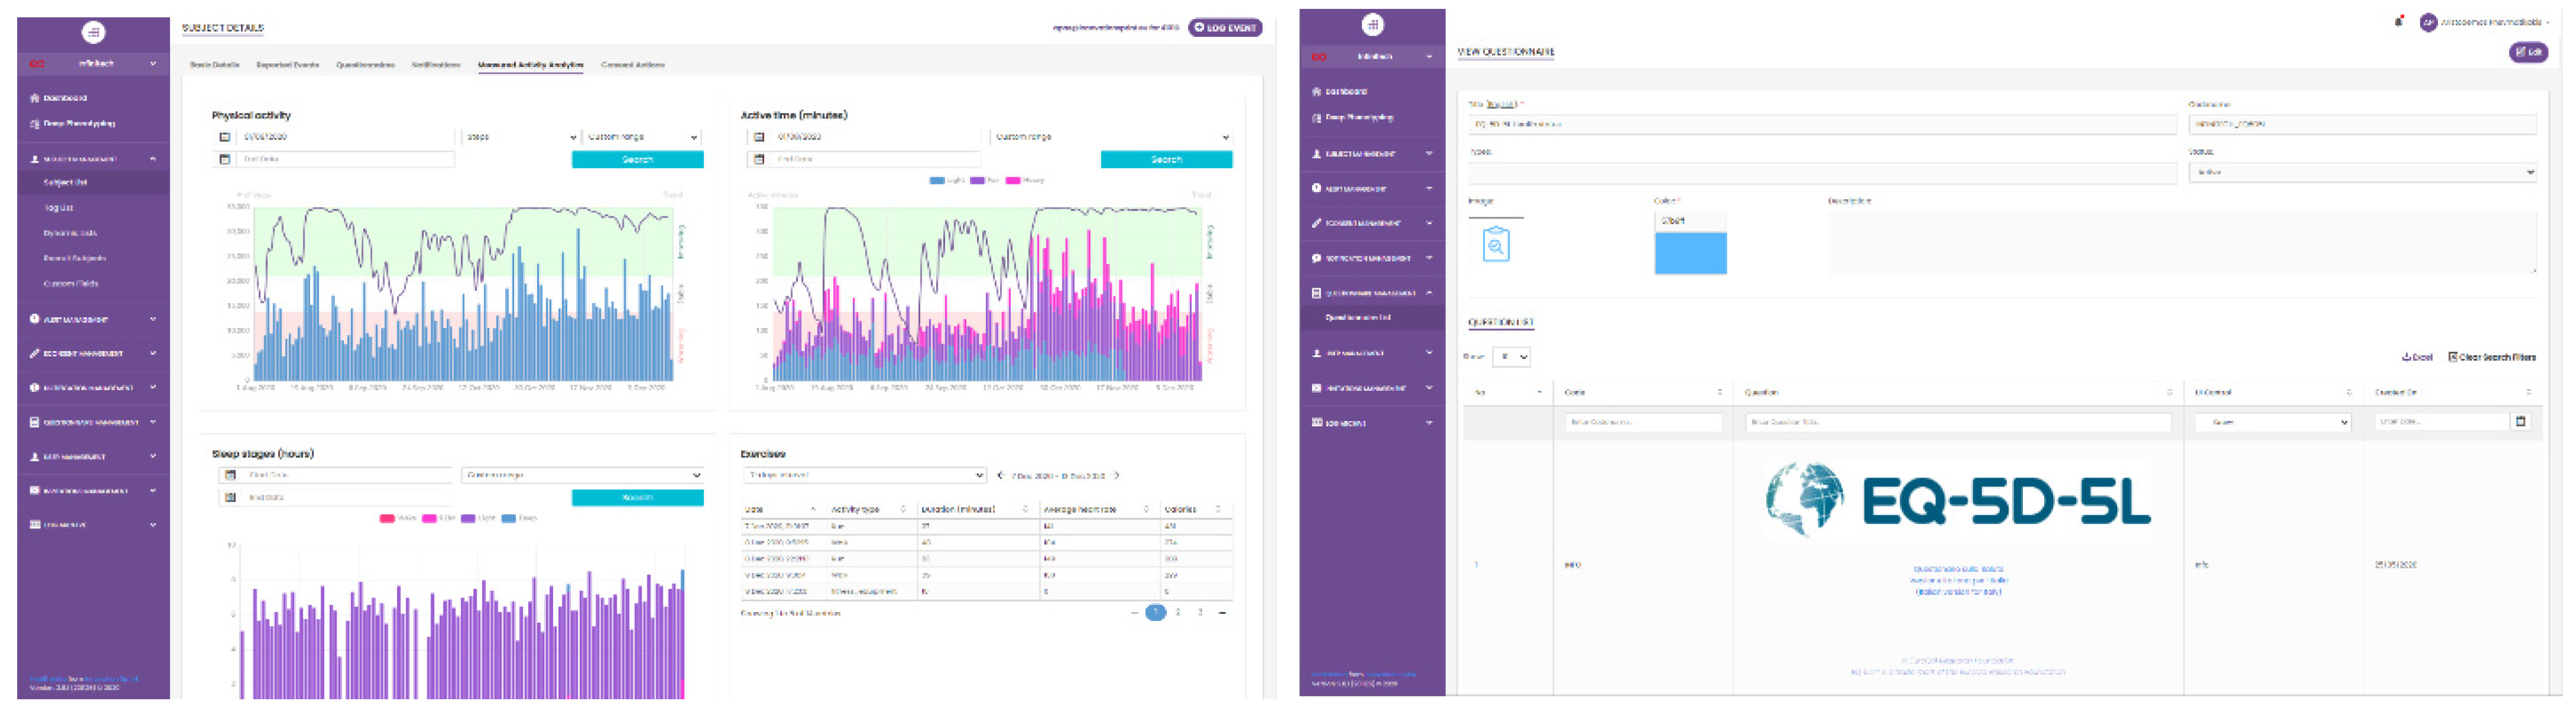
We also include some composite measurements that are derived from processing measured signals, sometimes of multiple types. We derive sleep quality as a composite measurement of stability and duration of sleep. We thus penalize non-zero trends of the bed time and the wake-up time, as well as smaller than 8 h sleep durations. Other examples are the frailty test (Lansbury et al. 2017), that enumerates equilibrium, ability to perform five sit-ups and speed of a few walking steps, and the six-minute walk test (Oliveira et al. 2019).

2.2. Healthentia

Healthentia (Innovation Sprint 2020) is an eClinical solution that facilitates clinical trial optimization, by accelerating the trial processes, reducing the failure rate, and validating intervention efficacy and effectiveness with RWD insights. Healthentia facilitates behavioral and health-related data collection by enabling measurements from wearables and other IoT devices, as well as reports from users. Healthentia is available for on-premises installation for clinical studies, as well as in a software-as-a-service (SaaS) mode, which is open to the wider community. The SaaS version includes further features, such as eRecruitment, eConsent and Virtual Coaching. It is exactly the SaaS version of Healthentia that is used by the personalized insurance products pilot of the INFINITECH project (Infinitech H2020 2020) for collecting the RWD necessary for risk assessment.
Healthentia comprises three modules: the platform for RWD management, the mobile application being used by the customers for RWD collection, and the portal application being used by the health insurance professionals for gaining risk assessment insights.
The Healthentia platform provides secure, persistent RWD storage and role-based, GDPR-compliant access. It is the heart of the Healthentia system, collecting the RWD from the mobile applications of all users, facilitating smart services such as our risk assessment on the RWD, and providing both original and processed information to the mobile and portal applications.
The Healthentia mobile application (Figure 1) enables RWD collection. Measurements are obtained in four modes, depending on the hardware available and the preference of the user: measurements collected from a Garmin device (Garmin 2020), from a Fitbit one (Fitbit 2020), accumulated in Apple Health (Apple 2020), or collected from an Android smartphone using its sensors and a proprietary sensing service (Android Developers 2019). User reports are obtained via answering questionnaires that are either regularly pushed to the users’ phones or are accessed on demand by the users themselves. Both the measured and reported RWD collected are displayed to the users, together with any insights offered by the smart services of the Healthentia platform.
The Healthentia portal application (Figure 2) is addressed to the health insurance professionals. It provides an overview of the users of each insurance organization and details for each user. Both overview and details include RWD collected and data facilitating risk assessment insights (as provided by the smart services of the Healthentia platform). Finally, the portal application provides a questionnaire management system to manage the types of RWD reported by the users.

2.3. Synthetic RWD

An RWD set suitable for training and testing the risk assessment system needs to be rich in terms of its length in time, depth in terms of different RWD collected, and breadth in terms of different people involved in the data collection. To achieve length, depth and breadth, we need to involve many people for a long time, ensuring they adhere to the data collection protocol. This is a lengthy process, and its correct planning is discussed in Section 4. To be able to setup the risk assessment system for the personalized health insurance products pilot of the INFINITECH project (Infinitech H2020 2020), we built a RWD simulator to obtain synthetic RWD.
The RWD simulator accepts demographic information and behavioral phenotypes of people, and simulates days of their lives. The demographic information includes gender, date of birth, height, weight, health status, employment and country of residence. The behavioral phenotypes enumerate the tendency of the people towards activities related to six behavioral traits: indoor and outdoor entertainment, indoor and outdoor athletics, inactivity, and work.
Groups of activities are defined for each of the six behavioral traits. For example, outdoor athletic activities include walking, hiking, running and bicycle riding. Every time the simulated person is about to select a new activity, they refer to their assigned behavioral trait to select the next activity group. The selection is don-deterministic, but the chances of each activity group are weighted by the personality, the time of day and the recent history of activity selection. Once the activity group is selected, an activity within the group is chosen randomly. The duration of the activity is chosen based on a Gaussian duration model that each activity has, and the remaining stamina of the person.
The duration of the activity is simulated in small time steps, the simulator time delta, which defaults to five minutes. For every simulation time delta, each activity generates values for each RWD measurement by defining models of the measurement x as:
x = { 0 u < T N ( m ,   σ 2 | a ) u T
where u is a random variable uniformly distributed in [ 0 ,   1 ] , T is a threshold value in [ 0 , 1 ) that depends on the activity a, and N ( m ,   σ 2 | a ) is a Gaussian random variable of mean m and variance σ 2 that also depend on the activity a. The mean m also depends on the available stamina of the simulated person. The threshold T is usually zero, resulting in values drawn from the Gaussian distribution. It is close to unity for activities wherein some non-zero measurements can appear sporadically, such as non-zero steps while working or sleeping, or floor climbing while walking.
Most activities diminish the stamina of the people, i.e., the available pool of energy to keep doing high-intensity activities. Some leisure activities do replenish stamina though, but it is mainly sleep that does the trick. The level of replenishment depends on the person’s health and quality of sleep.
Care is taken to respect weekends and vacations based on the country of residence of each person, whereupon work is eliminated (unless there is a strong work behavioral trait). There are random events that temporarily affect the health of people (illnesses and accidents, even mood-related events). Their probability increases as health is reduced. Health is reduced constantly by age, but it is also affected by long-term behavior; weight gain and lack of exercise or quality sleep will, in the long run, reduce health. The opposite behavior will improve health.
The simulated RWD are complemented with reports from questionnaires. Every question is defined, together with a model that determines the answer the simulator should give. The model equations are defined using any of the data produced by the simulator (either measurements or reports), including their short- and long-term averages and trends. For example, the answer to the “ability to perform the usual activities” question of the EQ-5D-5L questionnaire is modeled with a mean value of
(100-{HEALTH_SHORT})/20 + {PAIN_SHORT} + {HEADACHE_SHORT} − {MOOD_SHORT} + 2
and a constant standard deviation of 0.5. Similarly, the answer to the mobility ability question of the same questionnaire is modeled with a mean value of
5 − exp({STEPS}/3000)
and the same constant standard deviation. In the above expressions HEALTH_SHORT, PAIN_SHORT, HEADACHE_SHORT and MOOD_SHORT refer to the short-term averages of the equivalent symptom, and STEPS refers to the total steps walked in that day.
The RWD simulator is implemented in Python and generates large amounts of data. It stores RWD for every delta time interval in the Healthentia platform. It also stores all simulated physical exercise sessions and all answers to questionnaires. For convenience, it also generates a CSV file with daily aggregations of all generated RWD. It requires 80ms on average to simulate a person-day on a seventh generation Intel i7 CPU. In Section 3.1.2, it is used to simulate 812 days of 400 people.

3. Risk Assessment

Aspects of health can be assessed by single-element health indicators such as body temperature. More elaborate indicators are composite ones that involve non-linear, albeit simple, combinations of measurements, such as the body mass index (Garrow and Webster 1985). Such indicators though are not enough to capture the health risk, especially in the long term. In Section 2.1, we defined x as a vector of various measurements and F ( x ) as their non-linear combination into a prediction of some aspect of risk assessment. Discovering the non-linear combination function F is not done manually, resulting in an equation. Instead, it is done using a machine learning algorithm that learns F from the measurements x, yielding the metric to be evaluated for risk assessment. In machine learning terminology, x is the feature vector and F is the discriminant function of the classifier (Theodoridis and Koutroumbas 2008).
In this section we introduce classifiers for predicting the short-term variation of outcomes related to the well-being, and we evaluate their performance. We then utilize them for risk assessment and personalized coaching.

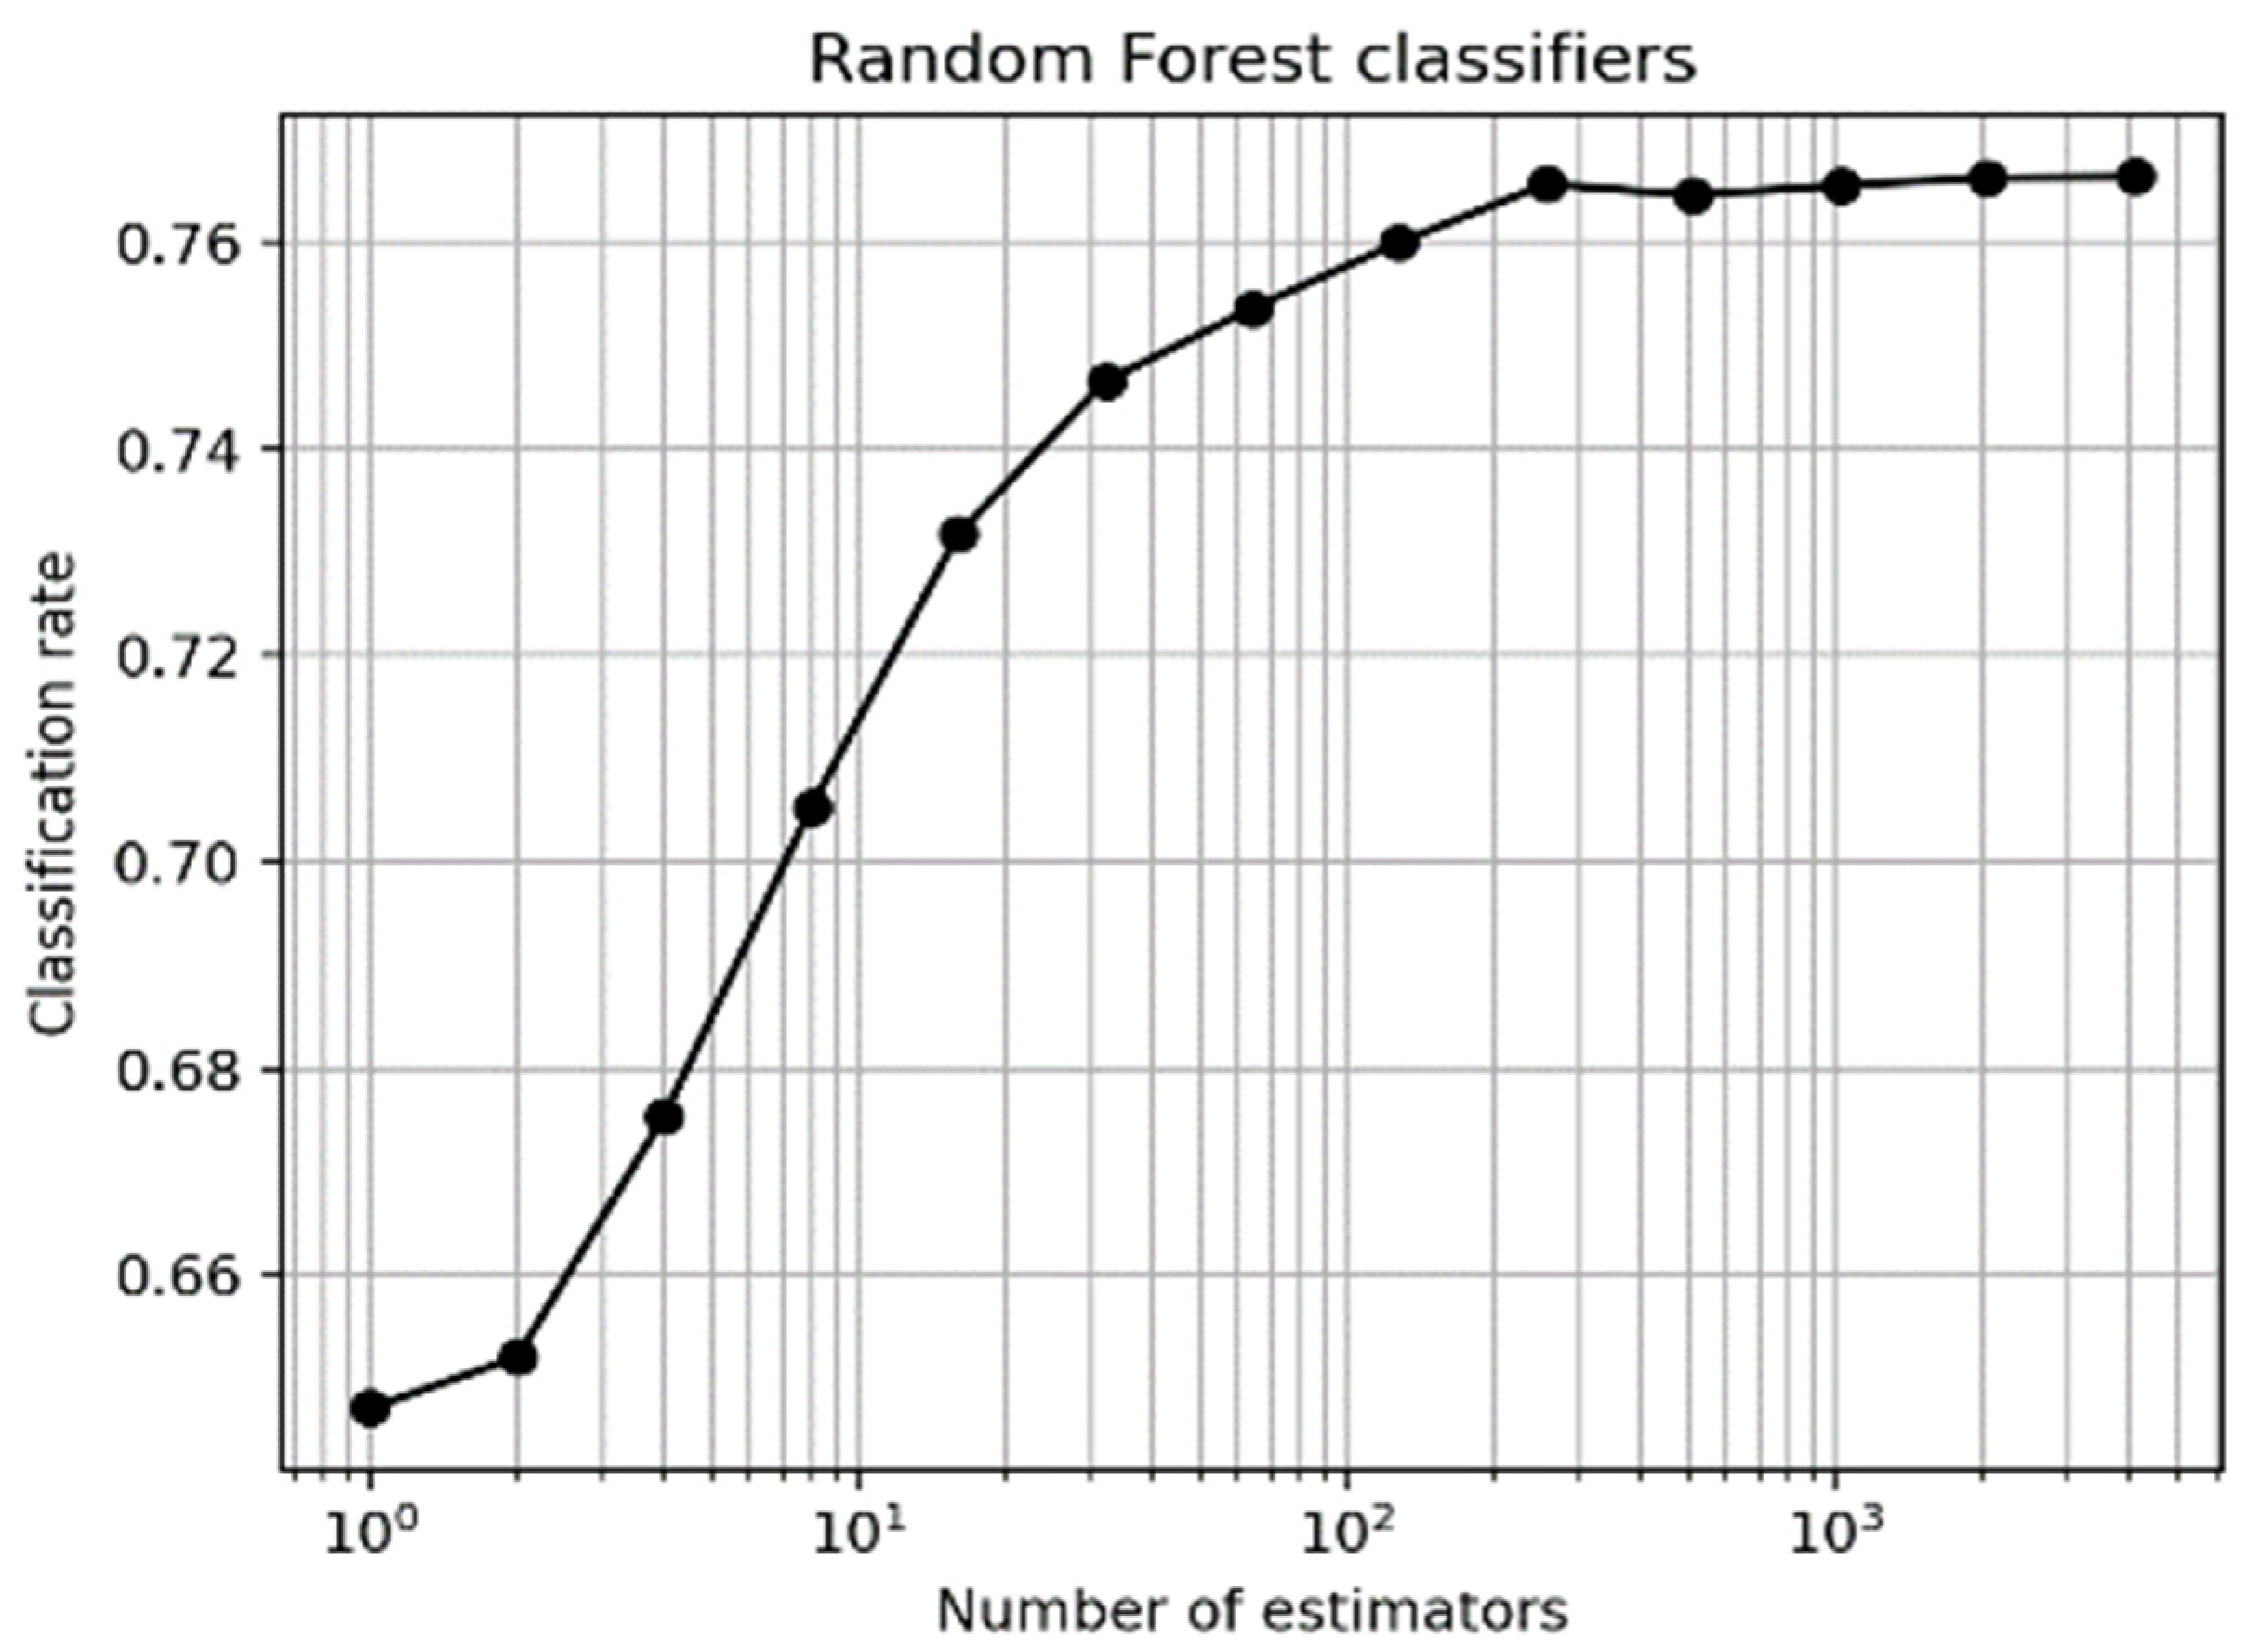
3.1. Classifiers for Short-Term Variation Prediction

Health-related outcomes have complex non-linear dependencies on the different elements of RWD. We uncover these dependencies using classifiers. Since continuous risk assessment needs to capture the dynamics of health-related outcomes, we focus on predicting ranges of variations of these outcomes using classifiers, instead of predicting the values themselves using regressors (Theodoridis and Koutroumbas 2008; Bishop 2006). The selected classifier algorithm depends on the problem at hand, the most determining factors being the size of the training set and the dimensionality of the feature vector. Classifiers able to uncover non-linear decision surfaces are preferred, namely subclass linear methods (Pnevmatikakis and Polymenakos 2009; Moghaddam 2002; Zhu and Martinez 2006), kernel methods (Baudat and Anouar 2000), random forests (Breiman 2001) and (deep) neural networks (Schmidhuber 2015).

3.1.1. Predicting Weight Variation

At first, we train a set of proof-of-concept classifiers for predicting if the weight of a person is expected to increase or decrease in the short term, based on the RWD collected in an interval of a week.
Actual RWD are used in training and testing the classifiers. The dataset is collected using Samsung Health and is moderate in terms of different types of RWD collected (overall steps, steps walked at a healthy pace, steps run, floors climbed, energy burned, sleep start time, sleep end time and water intake), hence its depth is acceptable. The weight’s short-term average of the previous week is also used as one of the feature vector elements for predicting the reduction or increase in the weight in the next week. Using previous values as part of the input to predict newer values of a quantity is typical in healthcare; see Ref. (Guthrie et al. 2019), where the previous blood pressure is used to predict the improvement in the blood pressure in the next period. Our dataset comprises 7 years of single-person data. In the first two years there are no weight measurements, so this part of the data is used just to establish the long-term averages and trends. This allows for 253 weeks of weight data. In total, 80% of the data are used for training and the rest for validation. Due to the limitation of the dataset in terms of length (few weeks’ worth of vectors), there is no possibility for an independent test set. Due to the extreme limitation in breadth (only one person), the resulting classifier is just a proof-of-concept, with no generalization expectations.
Random forest (Breiman 2001) classifiers are trained with a different but small number of trees in the ensemble. The choices of both random forest and small ensemble are again necessitated by the limited training set. The best classification rate of 67.9% is achieved for just three trees in the ensemble. Shapley additive explanations (SHAP) analysis (Lundberg and Lee 2017a, 2017b; Lundberg et al. 2020) is employed to establish the impact of the different feature vector elements in the classifier decision (either positive or negative), averaged over all feature vectors. The results are shown in Figure 3. The three most important features in the prediction of the weight increase or decrease have to do with trends of sleep duration, steps walked, and steps walked at a healthy pace. The actual weight in the previous period comes fourth in importance.

3.1.2. Predicting Well-Being Variation

To overcome the limitation in the existing dataset of actual RWD, we create a synthetic one that is rich in all three dimensions: It captures all the RWD elements of Section 2.1.1, so the depth is satisfactory. In total, 400 people are simulated for 3 months and 2 years each, resulting in a dataset rich in breadth and depth. The first three months are used just to allow long-term averages and trends to settle, and the remaining 2 years are used to form the training (60%), validation (20%) and testing (20%) sets.
We first consider the ideal case wherein the short-term average of the health during the previous week is one element of the feature vector for the prediction of its improvement or not during the next week. Due to the length and breadth of the dataset, we train both random forest classifiers (with up to large numbers of trees) and neural network classifiers. The tuning of the number of trees in the random forest ensemble is shown in Figure 4. The optimum classification rate of 76.6% is obtained with 256 trees, to be contrasted with the mere 3 for the limited weight prediction dataset. The best neural network was obtained with three hidden layers and rather high dropout between each layer to constrain overfitting. In total, it has 125,825 trainable parameters. Its classification rate is 76.9%, slightly better than the random forest counterpart.
The impact of the different feature vector elements in the classifier decision (either positive or negative health variation), averaged over all feature vectors, is shown in Figure 5. In contrast to the weight prediction, this time the previous state is the second most important feature. The trends in weight and energy burned conclude the three most clearly important features.
Unlike the weight variation case of Section 3.1.1, previous health estimates are not available in realistic cases. There is a health self-assessment in the EQ-5D-5L quality of life questionnaire, but this cannot be considered when coming from a simulator. In this simulated case the “reported” health is actually a noisy version of the simulator’s internal health variable, somewhat modified by another internal variable, the mood, to reflect the person’s mood, resulting in optimistic or pessimistic estimations. As such, we also train classifiers without the previous health information, expecting them to have rather reduced performance. In actual deployments, the questionnaire answers will be trusted, leading to a performance in between the two cases examined here.
Both binary and tri-state classifiers are trained. The binary classifiers yield whether the health is expected to improve or worsen. The tri-state ones are more suitable for risk prediction since they yield whether health is expected to improve, remain approximately constant, or worsen. The results are shown in Figure 6. In the binary case, the best random forest performance is 67.1% (which, as expected, is lower than the 76.6% achieved by the classifier considering previous health state too), achieved with 4096 trees in the ensemble. The best neural network performance is significantly lower, at 65.3%. In the tri-state case, the best RF performance is 58.2%, achieved with 2048 trees in the ensemble. The best neural network performance is also 58.2%.
The impact of the different feature vector elements in the binary random forest classifier decision, averaged over all feature vectors, is shown in Figure 7. Compared to the counterpart that utilizes the previous health state, as shown previously in Figure 5, many of the most important features are common (8 out of 10), having changed only in order. In addition, there is no huge variation in the importance when the previous health is not used.

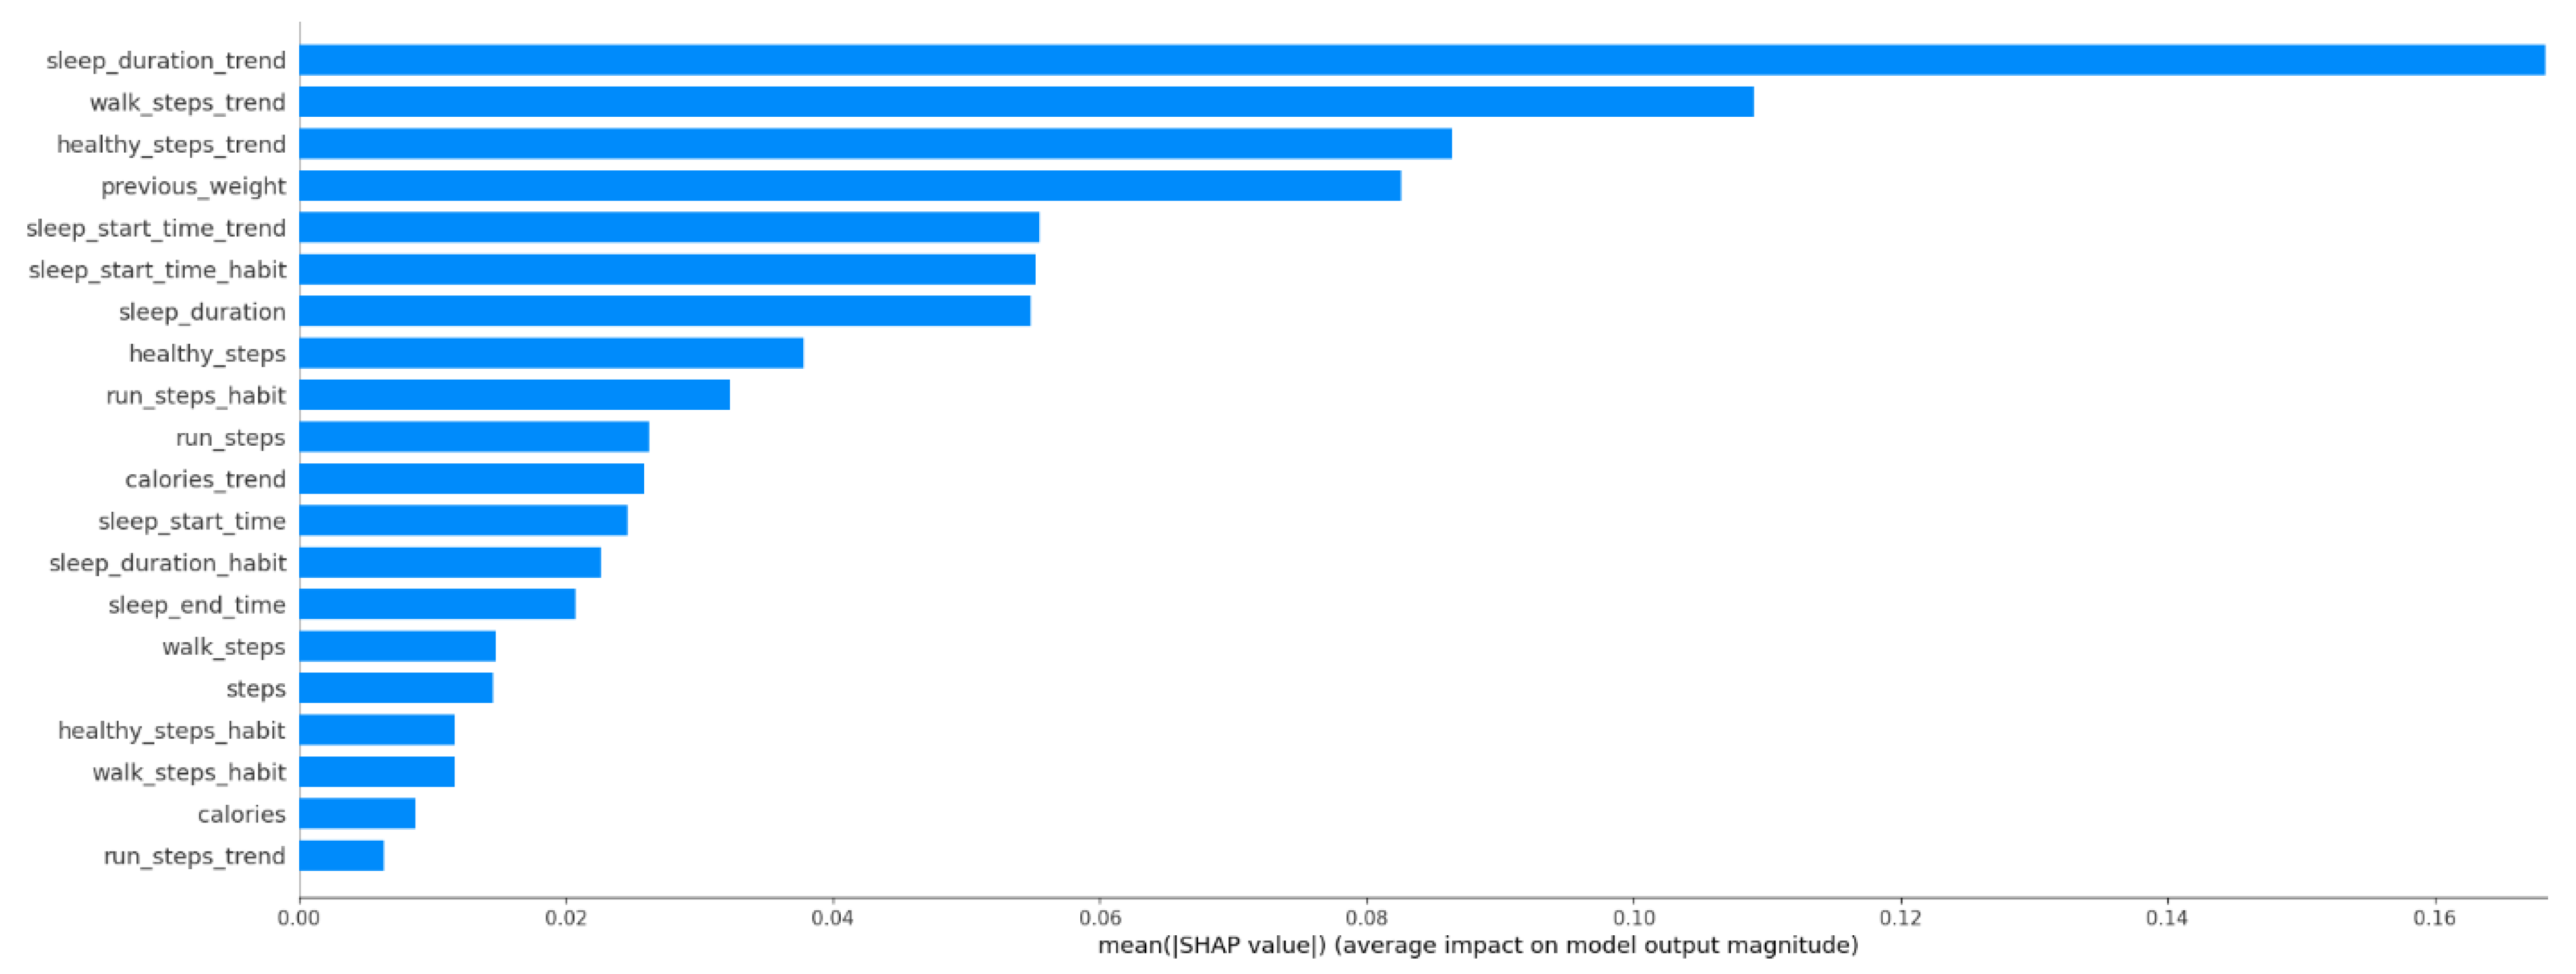
3.2. Risk Assessment from Health Predictors

The outputs of the different classifiers can be used to assess the risk associated with every customer. The assessments are long-term, i.e., they take into account all the classifier decisions over time intervals that are very long. In this study, we calculate the long-term averages of the different daily decisions with a memory length d equal to 180, corresponding roughly to half a year. There are two such averaged outputs for binary classifiers and three for the tri-state ones. In every case, the averages are run for the whole length of the synthetic dataset (two years), and for each day of decision they sum to unity. At any day, the risk is assessed as the sum of all the averaged positive outcomes from the beginning of the dataset up to the date of the assessment, minus the sum of the negative ones. In the tri-state case, the difference is normalized by the sum of the constant ones. The resulting grade is multiplied by 100 and thus can be in the range of [ 100 ,   100 ] . Obviously, risk grades somewhat larger than zero correspond to people whose well-being outlook has been mostly positive in the observation period, and risk grades somewhat smaller than zero correspond to people whose well-being outlook has been mostly negative in the observation period.
To evaluate the proposed risk assessment methodology, we generate an independent set of 540 people from three equally split personality groups: the athletic personality that likes indoors and outdoors exercising, and enjoys a good night’s sleep; the balanced personality that equally possesses all six personality traits; and the gamer, who is all about entertainment, mainly indoors, enjoys work and is not too keen on sleeping on time. The daily evolutions of the average classifier outputs for the two years of observation for the first person from each group are shown in Figure 8. Clearly, the athletic person is doing great, and the balanced one quite good. The gamer is not worsening, but looks rather stagnant.
We assessed their risk grades after two years, and the resulting grade histograms are shown in Figure 9. It is no surprise that the average risk grade for the athletic behavior type is 12.9, for the balanced type it is 10.1, and for the gamer type it is 7.01. Note though that it is not just the personality type that determines risk grade; the actual activities done do not just depend on that, so there is quite a lot of spread in the risk of the different personality types, as expected in real life.

3.3. Personalized Coaching

SHAP analysis results have thus far been presented, averaged over the entire population of feature vectors. The individual SHAP coefficients per feature vector are employed to establish the per person importance of feature vector elements (i.e., lifestyle aspects) in positive or negative well-being prediction. Thus, the elements of the feature vector of the particular user with the highest positive or negative influence towards the desired outcome of improvement of the user’s well-being are determined. Then, the person is coached about these elements. The virtual coach selects the feature vector elements of strong influence that are related to the user’s lifestyle. If they have strong negative influence, it coaches the person to change behavior. If they have strong positive influence, it encourages the person to keep up the good lifestyle in those aspects.
The SHAP analysis results for the individual feature vectors are shown in Figure 10. Each row corresponds to a feature vector element and each dot in a specific row corresponds to the value of that element in one of the feature vectors. The color of the dot indicates that element’s value (from small values in blue to large values in red). The placement of the dot on the horizontal axis corresponds to the SHAP value. Values close to zero correspond to feature vector elements with negligible effect on the decision, while large positive or negative values correspond to feature vector elements with large effects. The vertical displacement indicates how many feature vectors fall into the particular range of SHAP values. Thus, thick dot cloud areas correspond to many feature vectors.
Dots on the left correspond to feature values that direct one towards a prediction that health is improving, while dots on the right suggest a worsening of the health. For example, the refreshment consumption trend dots that are on the left are blue (small trend values), purple dots (moderate trend values) are around the center, and red dots (large trend values) are mostly on the right. As such, reducing the consumption of refreshments leads to improved health outlook, while increasing it leads to a worse health outlook. The situation is opposite for the sleep quality trend and the floors climbed trend.

4. Personalized Insurance Products Pilot of INFINITECH

The personalized health insurance products pilot of the INFINITECH project (Infinitech H2020 2020) is facilitating this research towards risk assessment by introducing four phases, each targeting an aspect of the development of the risk assessment system for health insurance companies.
The data collection phase of the pilot is running throughout the 30-month period of the pilot. During this phase, the questions of what RWD to collect and how to facilitate this collection using Healthentia (discussed in Section 2) are addressed. The proof-of-concept phase (already ended) has provided an early validation of the decisions and implementations with users from within the consortium partners. During that phase, physical data and questionnaires were collected from 19 users.
The data sharing acceptance and usability study phase will soon provide an evaluation of aspects of customer willingness to share data with their health insurer. It will also provide the usability feedback, and might lead to a redesign of the data capturing process and mobile application. The results of this phase will help the pilot prepare a system of low dropouts at the final phase.
At the final service validation phase of the pilot, the system will be finalized, since enough data will be available to train classifiers similar to those of Section 3.1.2, only this time on real data, perhaps only augmented by synthetic ones. It will then undergo expert evaluation by its end users, i.e., health insurance companies.

5. Conclusions

We have developed a system for RWD collection for the personalized health insurance products pilot of INFINITECH, and the means to augment these RWD in the current early stages of the pilot with synthetic ones. We then demonstrated how these RWD can be used to train classifiers to predict variations in the important quantities for the lifestyle of a person: their weight and their health outlook.
We employed the predictions of the health outlook variation classifier to build a risk assessment system for health insurance professionals. The results of the system are promising, but we also aim to address fraudulent behavior detection. In our future research, we will be addressing fraud detection using a combination of technical means (signal processing) and persuasion (offering the promise of well-being via coaching).
We used SHAP analysis of the health outlook variation classifier to understand the overall important features, but also important features on a personal level, to drive a virtual coaching system. Only the explainable machine learning foundations of this virtual coaching system have been discussed. The next steps of our research involve the creation of a virtual coaching system that employs the derived important features for directing actionable advice to actual people.
Most of this work has been based on synthetic data, and serves as a proof-of-concept. This is the limit of the presented research, and hence we focus on the methodology to derive the important lifestyle aspects for the classifiers, and not on what they are or the lifestyle aspects designated as important by the classifiers. As actual data are coming in, the classifiers will be retrained, and then we will be in a position to offer the risk assessment service to the health insurance professionals, as well as coaching to their customers.

Author Contributions

Conceptualization, S.K. (Sofoklis Kyriazakos), A.C. and A.P.; methodology, A.P.; software: S.K. (Sofoklis Kyriazakos) A.P. and G.M.; validation: A.P. and A.C.; formal analysis, A.P.; investigation, A.P. and S.K. (Sofoklis Kyriazakos); resources, K.K. and S.K. (Sofoklis Kyriazakos); data curation S.K. (Stathis Kanavos) and K.K.; writing—original draft preparation, A.P.; writing—review and editing, A.P. and G.M; visualization, A.P. and K.K.; supervision, A.P.; project administration, A.P.; funding acquisition, S.K. (Sofoklis Kyriazakos) All authors have read and agreed to the published version of the manuscript.

Funding

This research and the APC were funded by the INFINITECH project of the European Union’s Horizon 2020 research and innovation program, under grant agreement no. 85663.

Institutional Review Board Statement

Ethical review and approval were waived for this study, due to the use of synthetic data.

Informed Consent Statement

Informed consent was obtained from all subjects involved in the study.

Data Availability Statement

The synthetic data used in this study will be made available per request addressed to any of the authors.

Acknowledgments

The authors wish to thank all Pilot #12 partners of the INFINITECH project for their role in actually running the pilot.

Conflicts of Interest

The authors declare no conflict of interest.

References

  1. Android Developers. 2019. Sensors Overview. Available online: https://developer.android.com/guide/topics/sensors/sensors_overview (accessed on 1 March 2021).
  2. Apple. 2020. HealthKit. Available online: https://developer.apple.com/health-fitness/ (accessed on 1 March 2021).
  3. Arumugam, Subramanian, and R. Bhargavi. 2019. A survey on driving behavior analysis in usage based insurance using big data. Journal of Big Data 6: 1–21. [Google Scholar] [CrossRef] [Green Version]
  4. Baudat, Gaston, and Fatiha Anouar. 2000. Generalized discriminant analysis using a kernel approach. Neural Computation 12: 2385–404. [Google Scholar] [CrossRef] [PubMed]
  5. Bermúdez, Lluís, Dimitris Karlis, and Isabel Morillo. 2020. Modelling Unobserved Heterogeneity in Claim Counts Using Finite Mixture Models. Risks 8: 10. [Google Scholar] [CrossRef] [Green Version]
  6. Bishop, Christopher M. 2006. Pattern Recognition and Machine Learning. New York: Springer. [Google Scholar]
  7. Blackmore, Peter. 2016a. Digital Risk Profiling Transforms Insurance. Available online: https://www.insurancethoughtleadership.com/digital-risk-profiling-transforms-insurance/ (accessed on 1 March 2021).
  8. Blackmore, Peter. 2016b. Easier Approach to Risk Profiling. Available online: https://www.insurancethoughtleadership.com/easier-approach-to-risk-profiling/ (accessed on 1 March 2021).
  9. Breiman, Leo. 2001. Random Forests. Machine Learning 45: 5–32. [Google Scholar] [CrossRef] [Green Version]
  10. Burri, Rama Devi, Ram Burri, Ramesh Reddy Bojja, and S. Buruga. 2019. Insurance Claim Analysis Using Machine Learning Algorithms. International Journal of Innovative Technology and Exploring Engineering 8: 147–55. [Google Scholar]
  11. Fitbit. 2020. Technology That’s Inventing the Future. Available online: https://www.fitbit.com/global/us/technology (accessed on 1 March 2021).
  12. Gage, Thomas, Richard Bishop, and Jonathan Morris. 2015. The Increasing Importance of Vehicle-Based Risk Assessment for the Vehicle Insurance Industry. Minnesota Journal of Law, Science & Technology 16: 771. [Google Scholar]
  13. Garmin. 2020. Technology. Available online: https://www.garmin.com/en-US/garmin-technology/ (accessed on 1 March 2021).
  14. Garrow, John S., and Joan Webster. 1985. Quetelet’s index (W/H2) as a measure of fatness. International Journal of Obesity 9: 147–53. [Google Scholar]
  15. Grey, Margaret. 2017. Lifestyle Determinants of Health: Isn’t it all about genes and environment? Nursing Outlook 65: 501–15. [Google Scholar] [CrossRef]
  16. Guthrie, Nicole L., Jason Carpenter, Katherine L. Edwards, Kevin J. Appelbaum, Sourav Dey, David M. Eisenberg, David L. Katz, and Mark A. Berman. 2019. Emergence of digital biomarkers to predict and modify treatment efficacy: Machine learning study. BMJ Open 9: e030710. [Google Scholar] [CrossRef] [Green Version]
  17. Infinitech H2020. 2020. Infinitech HInfinitech—The Flagship Project for Digital Finance in Europe. Available online: https://www.infinitech-h2020.eu/ (accessed on 1 March 2021).
  18. Innovation Sprint. 2020. Healthentia: Driving Real World Evidence in Research & Patient Care. Available online: https://innovationsprint.eu/healthentia (accessed on 1 March 2021).
  19. Joseph-Shehu, Elizabeth M., Busisiwe P. Ncama, and Omolola O. Irinoye. 2019. Health-promoting lifestyle behaviour: A determinant for noncommunicable diseases risk factors among employees in a Nigerian University. Global Journal of Health Science 11: 1–15. [Google Scholar] [CrossRef]
  20. Lansbury, Lynn N., Helen Clare Roberts, Esther Clift, Annie Herklots, Nicola Robinson, and Avan A. Sayer. 2017. Use of the electronic Frailty Index to identify vulnerable patients: A pilot study in primary care. British Journal of General Practice 67: e751–e756. [Google Scholar] [CrossRef] [PubMed] [Green Version]
  21. Lundberg, Scott, and Su-In Lee. 2017a. A Unified Approach to Interpreting Model Predictions. Paper presented at Advances in Neural Information Processing Systems (NIPS2017), Long Beach, CA, USA, December 4–9. [Google Scholar]
  22. Lundberg, Scott M., and Su-In Lee. 2017b. Consistent feature attribution for tree ensembles. arXiv arXiv:1706.06060. [Google Scholar]
  23. Lundberg, Scott M., Gabriel Erion, Hugh Chen, Alex DeGrave, Jordan M. Prutkin, Bala Nair, Ronit Katz, Jonathan Himmelfarb, Nisha Bansal, and Su-In Lee. 2020. From local explanations to global understanding with explainable AI for trees. Nature Machine Intelligence 2: 56–67. [Google Scholar] [CrossRef]
  24. Moghaddam, Baback. 2002. Principal manifolds and probabilistic subspaces for visual recognition. IEEE Transactions on Pattern Analysis and Machine Intelligence 24: 780–88. [Google Scholar] [CrossRef] [Green Version]
  25. Oliveira, M. J., R. Marçôa, J. Moutinho, P. Oliveira, I. Ladeira, R. Lima, and M. Guimarães. 2019. Reference equations for the 6-min walk distance in healthy Portuguese subjects 18–70 years old. Pulmonology Journal 25: 83–89. [Google Scholar] [CrossRef]
  26. Pnevmatikakis, Aristodemos, and Lazaros Polymenakos. 2009. Subclass Linear Discriminant Analysis for Video-Based Face Recognition. Journal of Visual Communication and Image Representation 20: 543–51. [Google Scholar] [CrossRef]
  27. Qazvini, Marjan. 2019. On the validation of claims with excess zeros in liability insurance: A comparative study. Risks 7: 71. [Google Scholar] [CrossRef] [Green Version]
  28. Revicki, Dennis A., David Osoba, Diane Fairclough, Ivan Barofsky, Rick Berzon, N. K. Leidy, and Margaret Rothman. 2000. Recommendations on health-realted quality of life research to support labeling and promotional claims in the United States. Quality of Life Research 9: 887–900. [Google Scholar] [CrossRef] [PubMed]
  29. Schmidhuber, Jürgen. 2015. Deep Learning in Neural Networks: An Overview. Neural Networks 61: 85–117. [Google Scholar] [CrossRef] [Green Version]
  30. Stanaway, Jeffrey D., Ashkan Afshin, Emmanuela Gakidou, Stephen S. Lim, Degu Abate, Kalkidan Hassen Abate, Cristiana Abbafati, Nooshin Abbasi, Hedayat Abbastabar, Foad Abd-Allah, and et al. 2018. Global, regional, and national comparative risk assessment of 84 behavioural, environmental and occupational, and metabolic risks or clusters of risks for 195 countries and territories, 1990–2017: A systematic analysis for the Global Burden of Disease Study 2017. Global Health Metrics 392: 1923–94. [Google Scholar]
  31. Stolk, Elly, Kristina Ludwig, Kim Rand, Ben van Hout, and Juan Manuel Ramos-Goñi. 2019. Overview, Update, and Lessons Learned from the International EQ-5D-5L Valuation Work: Version 2 of the EQ-5D-5L Valuation Protocol. Value in Health 22: 23–30. [Google Scholar] [CrossRef] [PubMed] [Green Version]
  32. Theodoridis, S., and K. Koutroumbas. 2008. Pattern Recognition, 4th ed. Orlando: Academic Press, Inc. [Google Scholar]
  33. US Food and Drug Administration. 2009. Patient-Reported Outcome Measures: Use in Medical Products Development to Support Labelling Claims. FDA Guidance Document UCM193282. Available online: https://www.fda.gov/media/77832/download (accessed on 1 March 2021).
  34. US Food and Drug Administration. 2017. Use of Real-World Evidence to Support Regulatory Decision-Making for Medical Devices: Guidance for Industry and Food and Drug Administration Staff. Available online: https://www.fda.gov/downloads/medicaldevices/deviceregulationandguidance/guidancedocuments/ucm513027.pdf (accessed on 1 March 2021).
  35. Weidner, Wiltrud, Fabian W. G. Transchel, and Robert Weidner. 2017. Telematic driving profile classification in car insurance pricing. Annals of Actuarial Science 11: 213–36. [Google Scholar] [CrossRef] [Green Version]
  36. Zhu, Manli, and Aleix M. Martinez. 2006. Subclass discriminant analysis. IEEE Transactions on Pattern Analysis and Machine Intelligence 28: 1274–86. [Google Scholar] [PubMed] [Green Version]
Figure 1. Healthentia mobile application—main screen, reported events and measurements.
Risks 09 00046 g001
Figure 2. Healthentia portal application—viewing measurements and creating questionnaires.
Risks 09 00046 g002
Figure 3. Average impact of feature vector elements on weight change predictions (20 most influential elements shown).
Risks 09 00046 g003
Figure 4. Tuning the number of trees (estimators) in the random forest ensemble for the health change predictor utilizing previous health.
Risks 09 00046 g004
Figure 5. Average impact of feature vector elements on health change predictions utilizing previous health (20 most influential elements shown).
Risks 09 00046 g005
Figure 6. Tuning the number of trees (estimators) in the random forest binary and tri-state classifiers for the health change predictor without taking into account the previous health. The best neural network binary and tri-state performance is also shown for comparison.
Risks 09 00046 g006
Figure 7. Average impact of feature vector elements on health change predictions without utilizing previous health (20 most influential elements shown).
Risks 09 00046 g007
Figure 8. Averaged outputs of the tri-state random forest classifier with 2048 trees for the first athletic person (left) with a risk grade after two years of 46.2, for the first balanced person (middle) with a risk grade of 15.2, and the first gamer (right) with a risk grade of 2.9.
Risks 09 00046 g008
Figure 9. Histograms of risk grades for the three behavioral types. From athletic to gamer, the bulk of the grades move towards smaller values.
Risks 09 00046 g009
Figure 10. Shapley additive explanations (SHAP) analysis of the individual feature vectors, signaling the importance of small, medium and large feature values in the final decision reached for this vector.
Risks 09 00046 g010
Publisher’s Note: MDPI stays neutral with regard to jurisdictional claims in published maps and institutional affiliations.

