
Household’s Overindebtedness during the COVID-19 Crisis: The Role of Debt and Financial Literacy


Institute of Finance, Warsaw School of Economics, 02-513 Warsaw, Poland
Risks 2021, 9(4), 62; https://0-doi-org.brum.beds.ac.uk/10.3390/risks9040062
Submission received: 23 February 2021
/
Revised: 22 March 2021
/
Accepted: 26 March 2021
/
Published: 30 March 2021
(This article belongs to the Special Issue Financial Stability and Systemic Risk in Times of Pandemic)
Abstract
:The COVID-19 pandemic has shown how important it is to prepare one’s own financial budget for the unexpected loss of income. In this dimension, the financial education of the society plays an invaluable role. It allows us to account for events that may adversely affect personal finances in our budget management decisions. Therefore, the aim of the article is to check whether households with a higher level of financial and debt literacy have better management skills from the perspective of a household’s budget, which in the face of a crisis reduces the risk of individuals not paying their liabilities. Thus, at the turn of June and July 2020, we conducted surveys among 1300 Polish citizens. Using the multinomial logistic regression, we show that people with a higher financial and debt literacy are less affected by overindebtedness. During the crisis, people who have a higher debt literacy are better prepared to manage credit liabilities; in this situation, financial literacy is less important. In addition, the type of credit experience turned out to be significant. Respondents who have experience with consumer loans (potentially high-margin products) are more likely to have debt repayment problems than those with mortgage loans experiences.
JEL Codes:
D14; D91; G51; G531. Introduction
The health crisis has highlighted the need for effective household budget management. The cessation of operations by numerous companies and the temporary loss of income by many individuals during the coronavirus pandemic have shown how important it is to properly manage personal finances. In this respect, the financial education of a society plays an invaluable role. It not only allows for wider use of financial services, but also leads to effective budget management. From the policymaker perspective it is better to prevent the problems of overindebtedness accompanying financial crises than to “treat” them later with the available economic policy instruments. One of the main factors preventing problems with settling household liabilities during financial crises is financial education.
The dynamic growth of household indebtedness in many economies raises questions about the possibility of settling liabilities. The lack of financial and debt literacy of borrowers may lead to loans being taken by people who are unable to repay them. The health crisis period, which may lead to a significant increase in overindebtedness, plays a special role in this respect. People unprepared for difficult times are potentially at risk of overindebtedness. There are few studies in the literature on the relationship between financial literacy and overindebtedness. However, there is no analysis of the impact of financial literacy on preparation for financial crises and, as a result, the possible increase in the scale of overindebtedness. Therefore, the aim of this study is to answer the question of whether financial literacy contributes to better management of a household’s budget and contributes to reducing the risk of individuals not paying their liabilities during a crisis. Conducting a study at the peak of the coronavirus pandemic restrictions allows for an accurate response to the research objective defined above.
Research on financial and debt literacy in Poland is underdeveloped. Studies on a sample of Polish citizens focuses on the level of debt literacy (Cwynar et al. 2019) and financial literacy (Swiecka et al. 2000). The Polish literature is less related to the behavior of the citizens. Cwynar (2020) checked one of the aspects associated with the behavior of Polish Millennials. He proved that financial competences of Polish Millennials have a positive effect on healthy credit management. In terms of credit market participation, Cwynar et al. (2018) in a sample of 1004 adult Poles highlighted the importance of self-assessed debt literacy. Respondents who rated high in their debt literacy were more likely to participate in the credit market. Additionally, Białowolski et al. (2020) on the same sample of 1004 Poles find that debt skills can be considered as a strong predictor of consumer debt attitudes. The latest study on a sample of Polish citizens concerned the relationship between financial literacy and the savings behavior. Buchholtz et al. (2021) on a representative sample of 1006 Poles confirm that savings are concentrated in wealthier and better educated groups.
In our research we fill the research gap in three ways. First, we verify the level of financial and debt literacy in Poland based on the so-called “Big Three” financial literacy questions and questions related to debt literacy indicated by Lusardi and Tufano (2015). Such questions have been asked in many other countries, but so far have not been thoroughly verified in Poland. Second, we show the link between debt literacy and the threat of undue debt at the height of the coronavirus pandemic. Third, we examine the impact of other variables on the risk of overindebtedness, in particular, credit experience that is broken down into different types of loans (housing and consumer loans). Potentially, it can be expected that people with experience in housing loans, which by their nature are long-term and have high credit standards, may be more aware of how to properly manage their own budget during a crisis.
In order to fill the identified research gaps, we collected 1300 responses in the form of surveys from Polish citizens at the turn of June and July 2020. The sample of 1300 people is comparable to other surveys with a similar subject presented in different research (e.g., Toosi et al. 2020; Bucher-Koenen and Lusardi 2011; Beckmann 2013; Agnew et al. 2013). In the surveys, we verified the financial and debt literacy of Polish citizens, their debt situation, and expectations regarding their own financial conditions. The sample was differentiated according to age, gender, income, level of education, and type of household (details about the sample are presented in the Table A2 in the Appendix A). We tried to select the characteristics of the respondents so that they would constitute a representative sample of Polish society. The tool for analyzing the collected data was the multinomial logistic regression.
According to the results, we find a low debt literacy across Poland’s population. However, it is comparable to the debt literacy of U.S. citizens described in the Lusardi and Tufano (2015) study. Financial literacy among Polish citizens is higher than in other countries, but the awareness of the impact of inflation on savings still needs to be improved. The most important conclusion from the study, however, is the confirmation that people with a greater debt literacy are less threatened by the scale of overindebtedness during a health crisis (debt literacy turned out to be a significant variable). In addition, as expected, we showed that credit experience significantly affects the scale of overindebtedness. The high activity of the respondent in the credit market exposes him to excessive indebtedness. However, people who have repaid their mortgage loan in the past (or are paying it now) have fewer problems with settling current credit obligations than those with consumer lending experience (potentially high-margin loans).
We hope the results presented in this article will highlight the role of financial and debt education in society. During the coronavirus pandemic, aid programs significantly contributed to the increase in public (government) deficits in many countries. As shown by the results of this study, an adequate financial education of a society may contribute to the better preparation of households for a crisis period. Therefore, earlier prevention (in the form of education) is a better solution than post-treatment (in the form of economic policy activity). As financial stability is a main concern for central banks (Smaga 2013), it is crucial for them to support financial literacy programs. Such programs have to be targeted to specific groups depending on society preferences, economic situation and knowledge gaps among various social groups (Lusardi and Mitchell 2014).
The paper is organized as follows. In the next section, we review the literature on the relationship between financial literacy and debt management skills, as well as the importance of economic education of the financial system. In the third part, we present the main survey questions and methodology used to analyze the respondents’ answers. Section 4 presents the empirical results and its interpretations. The last part of the paper concludes our research.
2. Literature Overview
The widely known study on financial literacy and overindebtedness was carried out by Lusardi and Tufano (2015). They found that less knowledgeable people in this field report their debt as excessive. Moreover, lower debt literacy causes individuals to finance themselves at a greater cost. Additionally, the impact of financial literacy on the cost of borrowing was examined by Huston (2012). This research studies the link between financial literacy and the cost of borrowing via housing loans and credit cards among U.S. consumers. The results of this study indicate that financially literate people are twice as likely to have lower funding costs for both credit cards and mortgage loans. Brown et al. (2016), in turn, examined the relationship between financial literacy and debt behavior among young Americans. They showed that both mathematics and financial education improve repayment behavior. Already at this stage of the literature review, we can see that the relationship between financial education and debt behavior was mainly studied among U.S. citizens. In our study, we will examine a similar relationship in Poland. Research on financial and debt literacy in this region is still undeveloped.
Financing costs are largely related to the type of credit product. Products such as store cards or even short-term consumer loans are characterized by a greater cost than long-term and high-credit standard housing loans. On this point, Gathergood (2011), through a sample of UK consumers, confirmed that the lack of financial literacy is associated with a higher risk of consumer credit default. On the other hand, Dick and Jaroszek (2013) found that the frequency of using an easily accessible and relatively expensive consumer credit decreases together with the financial knowledge and is not related to household income. Most recent research of Artavanis and Karra (2020) showed that low-literacy students are more exposed to unexpected shock on their repayment abilities. Lusardi and Tufano (2015) also indicated that people who have experience with costly borrowing have difficulties in paying their liabilities. In the situation of experience with housing loans, borrowers who have a higher financial literacy are characterized by much fewer problems with debt repayment. The effect of mortgage delinquency in this research cannot be explained by the respondents’ characteristics (e.g., income or property characteristics). Additionally, Gerardi et al. (2013) confirmed that numerical ability predicts mortgage default, and people with a lower financial literacy take on more expensive loans (Moore 2003; Gathergood and Weber 2017).
When addressing the subject of households’ excessive debt, it is worth indicating other behavioral determinants (apart from literacy variables). Azimi Doosti and Karampour (2017) show that the propensity toward indebtedness largely depends on demographic factors, risk perception, and materialism (understood as an act of consumption). In terms of risk perception, research shows that individuals with a high risk perception tend to avoid debts (Nguyen et al. 2019). In the case of materialism, people with high levels of it are described as “spenders” (Azma et al. 2019), while the opposite are known as “savers” (Chatterjee et al. 2019). Therefore, the loan application of a highly materialistic consumer should be treated with caution (Rahman et al. 2020). Demographic factors also significantly influence the tendency to overindebtedness. Lin et al. (2019) found that men are more favorable to debt than women. In the age terms, young people under 30 are more disrespectful of debt compared to people over 45 (Keese 2012; Sevim et al. 2012).
In addition to overindebtedness, financial education plays an extremely important role in other areas of personal finance (Bongini et al. 2015). This mainly concerns the relationship between low financial literacy and the lack of retirement-planning (Lusardi and Mitchell 2014; Banks et al. 2010; Hastings and Mitchell 2020), suboptimal savings decisions (Smith et al. 2010; Bucher-Koenen and Lusardi 2011; Fan and Chatterjee 2018), and an aversion to participate in financial markets (Van Rooij et al. 2011; Christelis et al. 2010). In our study, we focus on the relationship between financial and debt literacy and the management of household budgets in times of crisis. This takes into account the impact of financial and debt literacy on the current debt situation, as well as the possibility of future problems with the credit obligations.
Increasing importance of behavioral economics creates new challenges for financial education research. The conventional economic assumes that individuals behave in an unemotional, deliberate, and fully informed way (Simon 1978). Therefore, the decisions of individuals are assumed to be close to the optimal level. In conventional economy financial education is hardly needed. Yet, the overindebtness of household sector in many countries prove that financial decisions are not optimized. In this article we show that the behavioral aspect of the economic agents—households—cannot be omitted. Thus, there is a space for conducting financial education in order to improve the decision making process (Altman 2012), to limit negative impact of irrational financial decisions on household indebtedness. In the case of poor financial decisions, people get into financial difficulties. As a consequence, if left unaddressed, it may develop into a systemic problem for the economy as a whole. This is one of the reasons for educational policy as an investment in human capital (Kim et al. 2013). It is a costly and long-term investment, but in the future it is expected to bring a high return in terms of economic growth and overall stability of the financial system (Hastings et al. 2011; Mitchell and Lusardi 2015).
3. Research Methodology
In our study we conducted CAWI internet survey (computer-assisted web interviewing) among 1300 Polish citizens. We applied multi-stage sampling method (i.e., dividing population into stages with smaller sampling units). The sample was differentiated according to age, gender, income, level of education, and type of household (see Table A2 in the Appendix A). We tried to select the characteristics of the respondents so that they would constitute a representative sample of Polish society. Only in this way the results of our study can be comparable to other similar results from the literature. In the first step we asked Polish citizens three questions to verify their financial literacy. The content of these questions is consistent with the “Big Three” concept provided by Lusardi and Mitchell (2011). In addition to questions about financial literacy, we asked four other questions about debt literacy: three of them provided by Lusardi and Tufano (2015) and one of the authors’ own country-specific question. The additional country-specific question is related to the significant competition between the banking sector and non-banking institutions in Poland. People with a low debt literacy may not distinguish which institutions can offer the least advantageous credit conditions (commercial bank, shadow bank institution, credit union, or cooperative bank). We divided the questions on verifying debt and financial literacy separately, as both skills seem to be useful in different conditions. A person who is financially literate makes healthy everyday decisions regarding the management of a household budget (e.g., the method of allocating savings, risk awareness, and functions of a household in specific economic conditions). A debt literate person, on the other hand takes care of household budget in terms of debt management and preparation for crisis times. In the Appendix A (Table A1) we present the questions that verify financial literacy (FL) and debt literacy (DL). Both in the case of debt and financial literacy, it is important to combine knowledge on personal finance management and the ability to apply it in everyday life, which is why in literacy questions we focused on verifying the respondent’s practical skills. In the next step, answers to the questions regarding debt and financial literacy were compared with the respondent’s declaration of his debt situation. According to the responses, 9% are overindebted during the COVID-19 crisis (answer a), 46% regularly repay their debt (answer b), and 45% are currently without debt (answer c).
The survey was conducted at the turn of June and July 2020. This is the period at the peak of restrictions related to the COVID-19 pandemic. According to the Central Statistical Office(registered unemployment database: https://stat.gov.pl/en/topics/labour-market/registered-unemployment/ (access: 16 March 2021)), the unemployment rate in this period was 6.1% (compared to 5.3% in June 2019), and from January 2020 to the end of May 2020, 130,000 enterprises suspended their activities, which is over 35% more than in 2019. On the basis of the data received, we studied the relationship between indebtedness (response variable) and literacy questions (explanatory variables) using the multinomial logistic regression. Our response variable (indebtedness) may take the values 1, 2, or 3 (see Table 1) depending on the debt situation of a given respondent, which justifies the use of this type of regression. All the explanatory variables and their structure used in the model are described in Table 1. Similar to binary logistic regression, multinomial logistic regression uses maximum likelihood estimation, but the dependent variable is not restricted to two categories.
In addition to the main research objective, (i.e., the relationship between literacy and overindebtedness), we have examined the significance of other variables that could potentially be important for personal finance management during the COVID-19 pandemic. These variables (indicated in Table 1) may also be vital in identifying the causes of overindebtedness. For example, income alone does not describe the living standards of a particular individual (potentially crucial for debt management). The cost of living of a given respondent seems to be a better variable (see the living standards variable in Table 1) (Braveman et al. 2005). In the case of credit experiences, people who were more often involved in high-margin products (e.g., consumer loans) may experience difficulties with debt service. In our results, we expect that high lending activity may expose clients to problems with overindebtedness (a significant positive sign). However, following Lusardi and Tufano (2015), these problems will be smaller for people who have taken low-margin loans in the past (e.g., home loans, see mortgage loan experience in Table 1) compared to high-margin loan products (see consumer loan experience in Table 1). Demographic features should also turn out to be important. For example, Li (2018) showed that single women have had more difficulties with debt repayment in the past than single men, underlying gender differences toward borrowing and debt management.
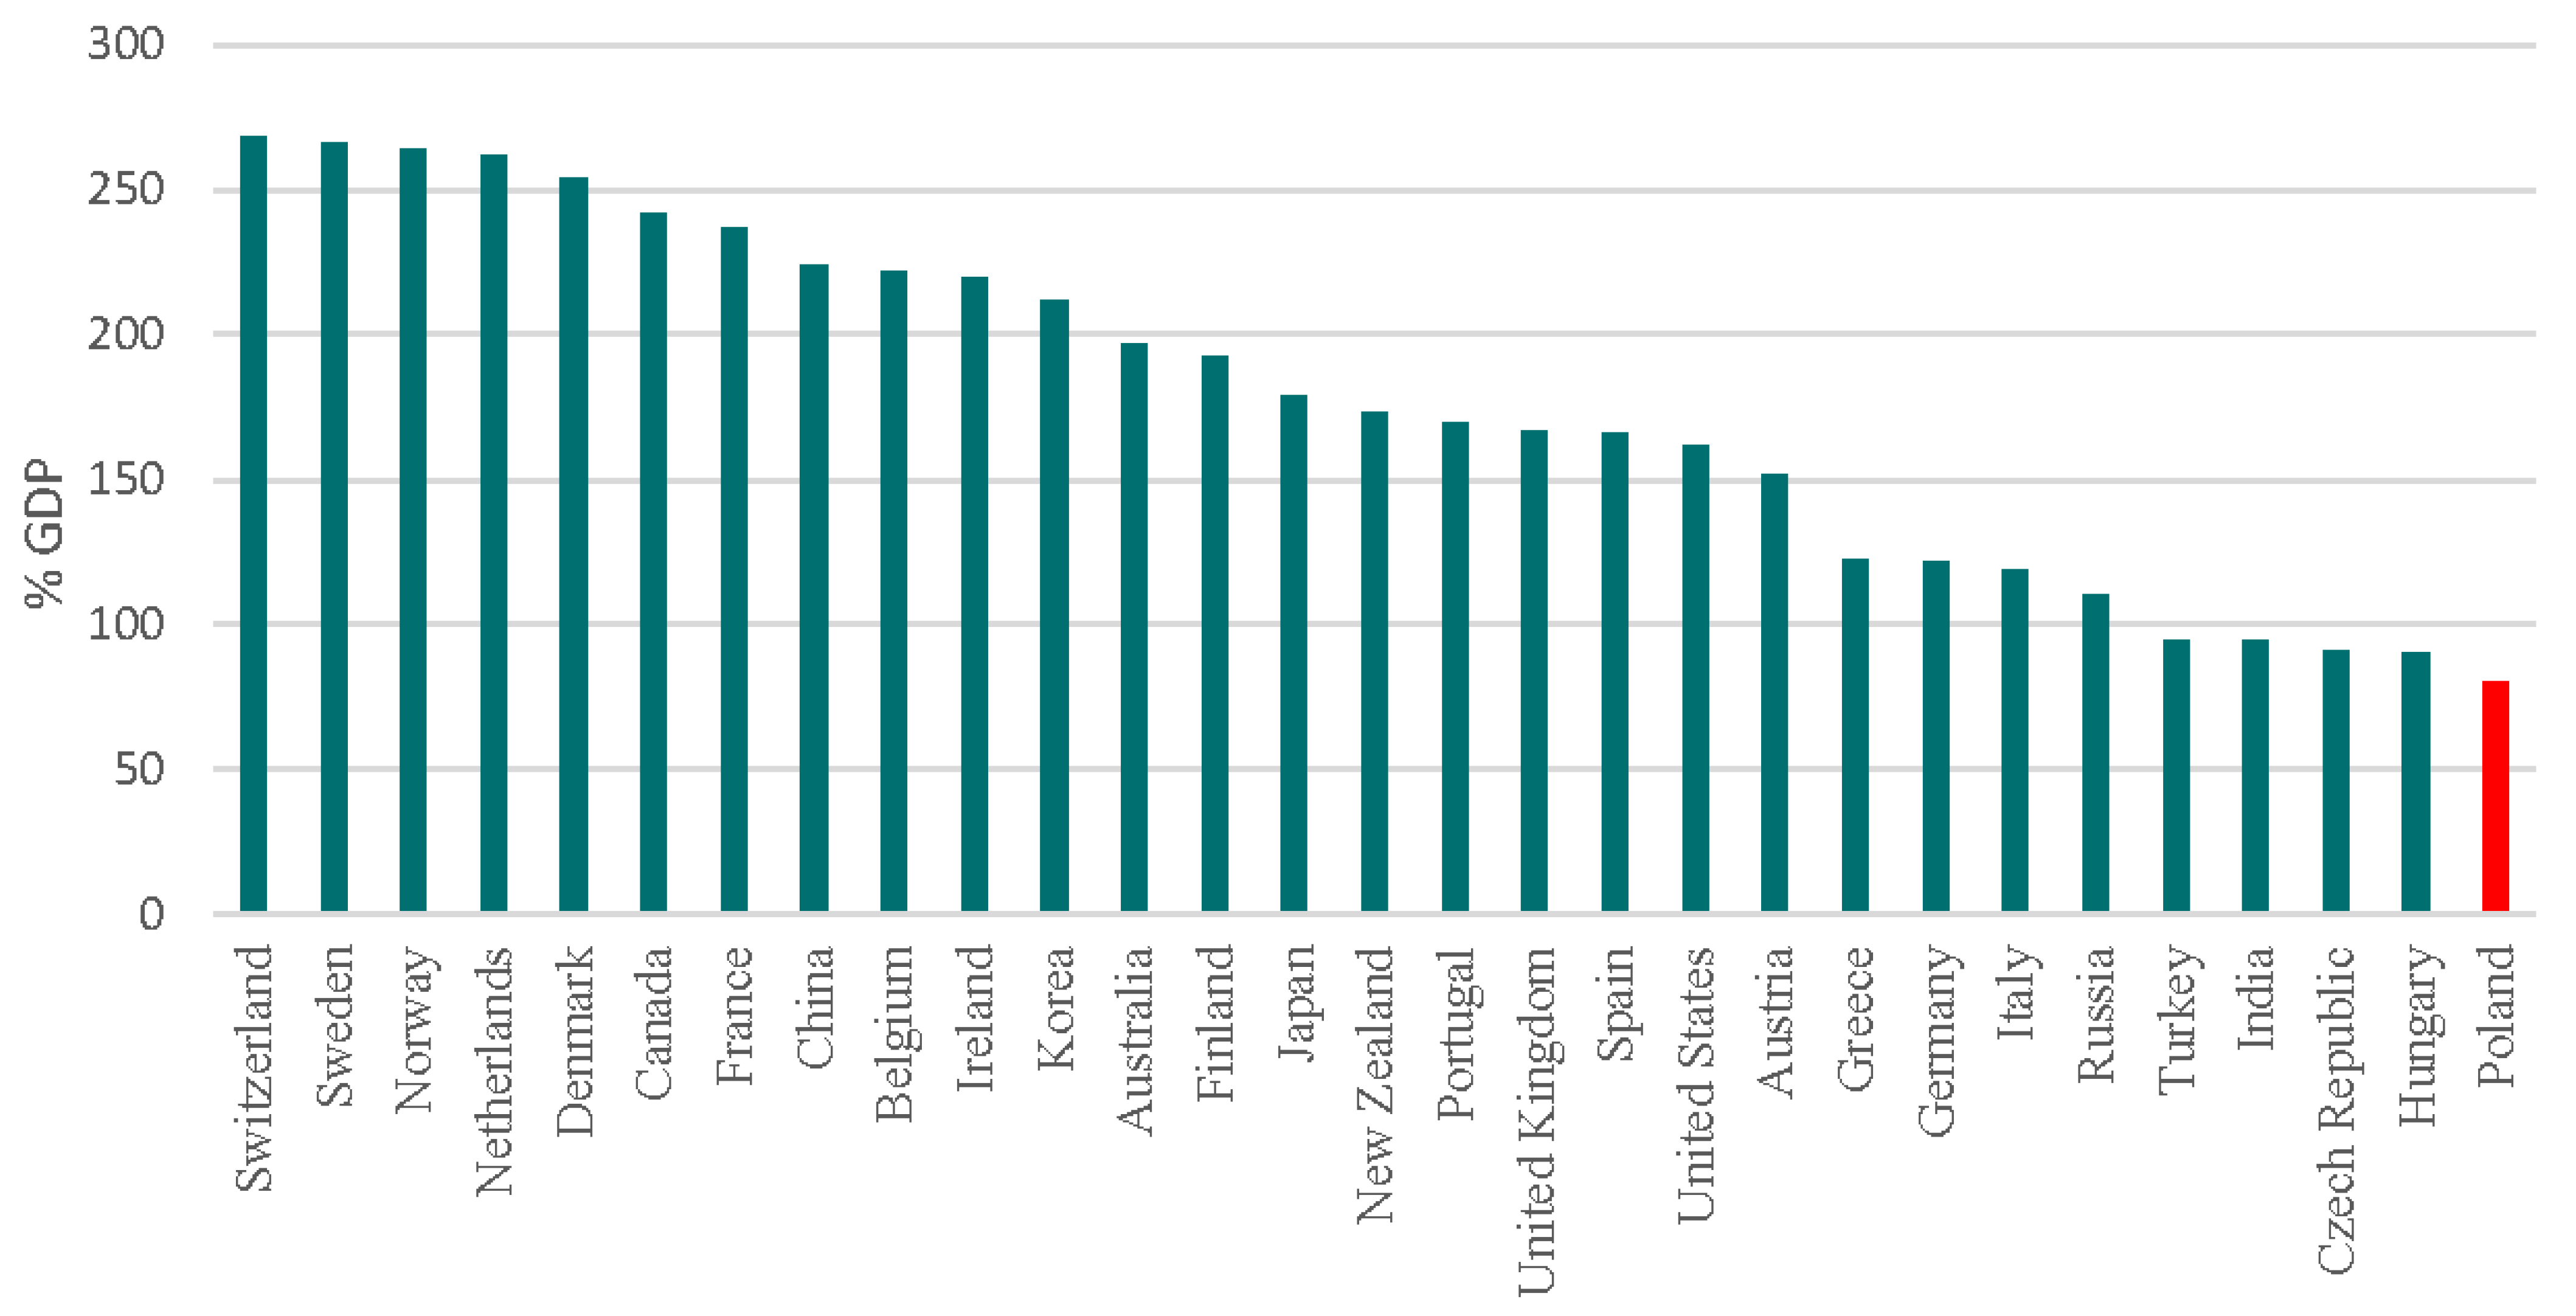
Before analyzing the results, it is worth pointing out that Polish society is characterized by relatively high debt aversion. In 2020 Q3, the value of household and non-financial corporation debt in Poland in relation to GDP amounted to 80.2%, which is the lowest value among the 29 analyzed developed countries and emerging markets (see Figure 1). However, still a bank loan is the main source of financing for non-financial corporations and households in Poland (which is a characteristic feature of a bank-based system). From this point of view, the research problem is particularly important for the functioning of the banking system, which are based on relationship banking where a dominant role for the economy is played by a bank credit.
4. Results
The three financial literacy questions (FL I; FL II; FL III) were asked by different authors in different countries. A summary of the results is presented in Table 2.
The same debt literacy questions (DL I; DL II; DL III) were asked by Lusardi and Tufano (2015) on a sample of 1000 U.S. citizens. The percentage of correct answers to the debt literacy questions in the U.S. study was 35.9%, 35.4%, and 6.9%, respectively. In our study, these values are 44% (DL I), 21% (DL II), and 15% (DL III). Equally 53% of the respondents correctly answered the country-specific question. In addition to the questions verifying debt and financial literacy, the respondents had to subjectively assess (from 0 to 7) their own levels of economic and financial skills.
Compared to the analyzed countries, the level of the Polish respondents’ financial skills (based on the survey conducted) should be considered as good. However, there is a need to improve the financial awareness of Polish residents in terms of the impact of inflation on savings (see the results of question FL II). In the case of debt literacy, both the Poland and U.S. responses are characterized by very low debt management skills. Additionally, Cwynar et al. (2019) verified the debt literacy among Polish citizens by using a number of different questions. They documented that almost 30% of respondents scored low on their debt literacy questions, while only 8% scored well (relative to others). About 60% of surveyed individuals had a moderate grasp of debt issues.
Looking at the answers in a given respondent characteristic, the gender gap is noticeable. Men perform better in the responses to each of the questions (see Table A3 in the Appendix A). The difference in financial literacy between women and men is also noted by Zissimopoulos et al. (2008). They found that middle-aged college-educated women answered significantly worse to interest computing questions than men with the same characteristics. For younger age groups, Chen and Volpe (2002) also reported gender differences. Looking at the age dimension of our research, the younger age groups (18–24 years) are characterized by the lowest level of financial literacy. On the other hand, in the case of debt literacy, the oldest (i.e., people over 65 years old) perform the worst.
In the next step, we checked the relationship between respondent debt situation and three literacy variables (financial literacy, debt literacy, and self-assessment knowledge). Financial literacy is necessary for making basic decisions about a household budget and seems to be a key variable for managing household finances in normal (non-crisis) times. However, debt literacy may turn out to be a significant variable in non-crisis times, but also when it comes to preparing household liabilities for crisis times. We also studied the significance of self-assessment knowledge because, according to the literature (cf., Courchane and Zorn 2005), it may have a significant impact on consumer behavior.
Table 3 shows the results of the multinomial logistic regression. According to these results, both debt and financial literacy significantly affect (reduce) the scale of overindebtedness (see models 1 and 3 in Table 3). However, in the case of people who may potentially be overindebted in the future (as a result of the COVID-19 pandemic), only debt literacy reduces the scale of potential problems with paying off liabilities. Financial literacy, in this case, plays a minor role (see model 4 in Table 3). This confirms our earlier suspicion regarding the greater role of debt literacy in preparing for managing household finances in times of crisis. Self-assessment knowledge in the case of Polish citizens turned out to be an insignificant variable (see models 5 and 6 in Table 3).
In the case of the type of credit experience, it should be indicated that people who have dealt in the past (or are currently) with high-margin credit products (consumer loans) are characterized by excessive indebtedness. This applies to a lesser extent to lower-margin products (mortgage loans). In models 1, 3, and 5, it is reflected as a significantly positive value of the parameter in the variable consumer loan experience and an insignificant value of the parameters in the variable mortgage loan experience. In a situation of possible overindebtedness during the coronavirus pandemic, both types of creditors (consumer and mortgage) may be affected by problems with regulating their obligations (although this also applies to a greater extent to experiences with consumer loans; see the higher values of the parameter in the variable consumer loan experience than in mortgage loan experience in models 2, 4, and 6). Descriptive statistics for credit experiences are presented in Table A4 in the Appendix A.
For living standards, this variable turns out to be significant in all equations. However, the direction of the impact on the scale of overindebtedness varies depending on whether we consider the current scale of overindebtedness and the possible increase in overindebtedness as a result of the coronavirus pandemic. In normal times, a high level of living standards reduces the scale of excessive indebtedness (a negative sign of the living standards parameters in models 1, 3, and 5), while in the situation of the coronavirus pandemic, high living standards significantly increase the possibility of problems with the repayment of liabilities (a positive sign of the parameters in models 2, 4, and 6). It is likely that living above the standard in “normal” times may not allow for adequate preparation for crisis times, which significantly threatens the increase in overindebtedness of this group during the coronavirus pandemic. Descriptive statistics for living standards are presented in Table A5 in the Appendix A.
When it comes to demographic characteristics, according to our results, women are surprisingly more affected by the scale of overindebtedness, and their personal finances are less prepared for the times of the pandemic. A negative significant sign in all equations in Table 3 near the gender variable indicates that being male reduces the scale of overindebtedness and possible overindebtedness as a result of the pandemic. These results are opposite to those obtained by, inter alia, Meyll and Pauls (2019) or Goode (2012) who show that women are less likely to become overindebted compared to men. However, studies that analyze the type of debt (e.g., Sandvall 2011) show that in the case of credit products (e.g., credit cards), women are more affected by debt settlement problems. In the case of men, overindebtedness relates to obligations such as business bankruptcies, alimony, and debts to the state. In turn, Li (2018) showed that single women have more difficulties with debt repayment than single men, underlying gender differences toward borrowing and debt management. Various conclusions in different studies prove that the approach to household budget management differs depending on the analyzed region or country. Therefore, it is important to take into account as many country-specific features as possible in research on consumer behavior and educational related subjects.
In the case of the remaining characteristics of the respondents, it is not surprising that the higher the income is, the smaller the scale of problems with paying liabilities. Higher education also significantly reduces the scale of excessive debt. However, education becomes less important in managing debt during the coronavirus pandemic (see the insignificant degree parameters in models 2, 4, and 6). In this respect, debt literacy seems to be more important than the respondents’ level of education.
Important conclusions can be drawn from the analysis of the relationship between age of respondent and overindebtedness. The age group most affected by overindebtedness is 55–65. It is also the effective age of retirement in Poland. This means that in Poland a large part of the society does not have their finances adequately prepared for the retirement period. If we look at possible debt repayment problems as a result of the coronavirus pandemic, the younger age groups (25–44 years old) seem to be more at risk. According to Lusardi and Mitchell (2014), older age groups are more experienced in using products and services offered by banks and the financial market. This could also affect their better debt management skills and, consequently, better budget preparation for times of crisis such as the coronavirus pandemic. Another explanation might be that the younger adults (especially 25–34 years old) may not have accumulated enough wealth during their lifetime to have their budget resilient to pandemic shock.
We also performed regression on the same principles as described in the research methodology part with exclusion of respondents over 64 years old. The COVID-19 shock concerns primarily the labor market, therefore, from the point of view of the research problem, it is reasonable to perform a regression excluding retired people, whose income is not affected by the coronavirus pandemic. This regression can also serve as a robustness check (see Table A7 in the Appendix A). The results obtained with the multinomial logistic regression with reduced sample give the same conclusions.
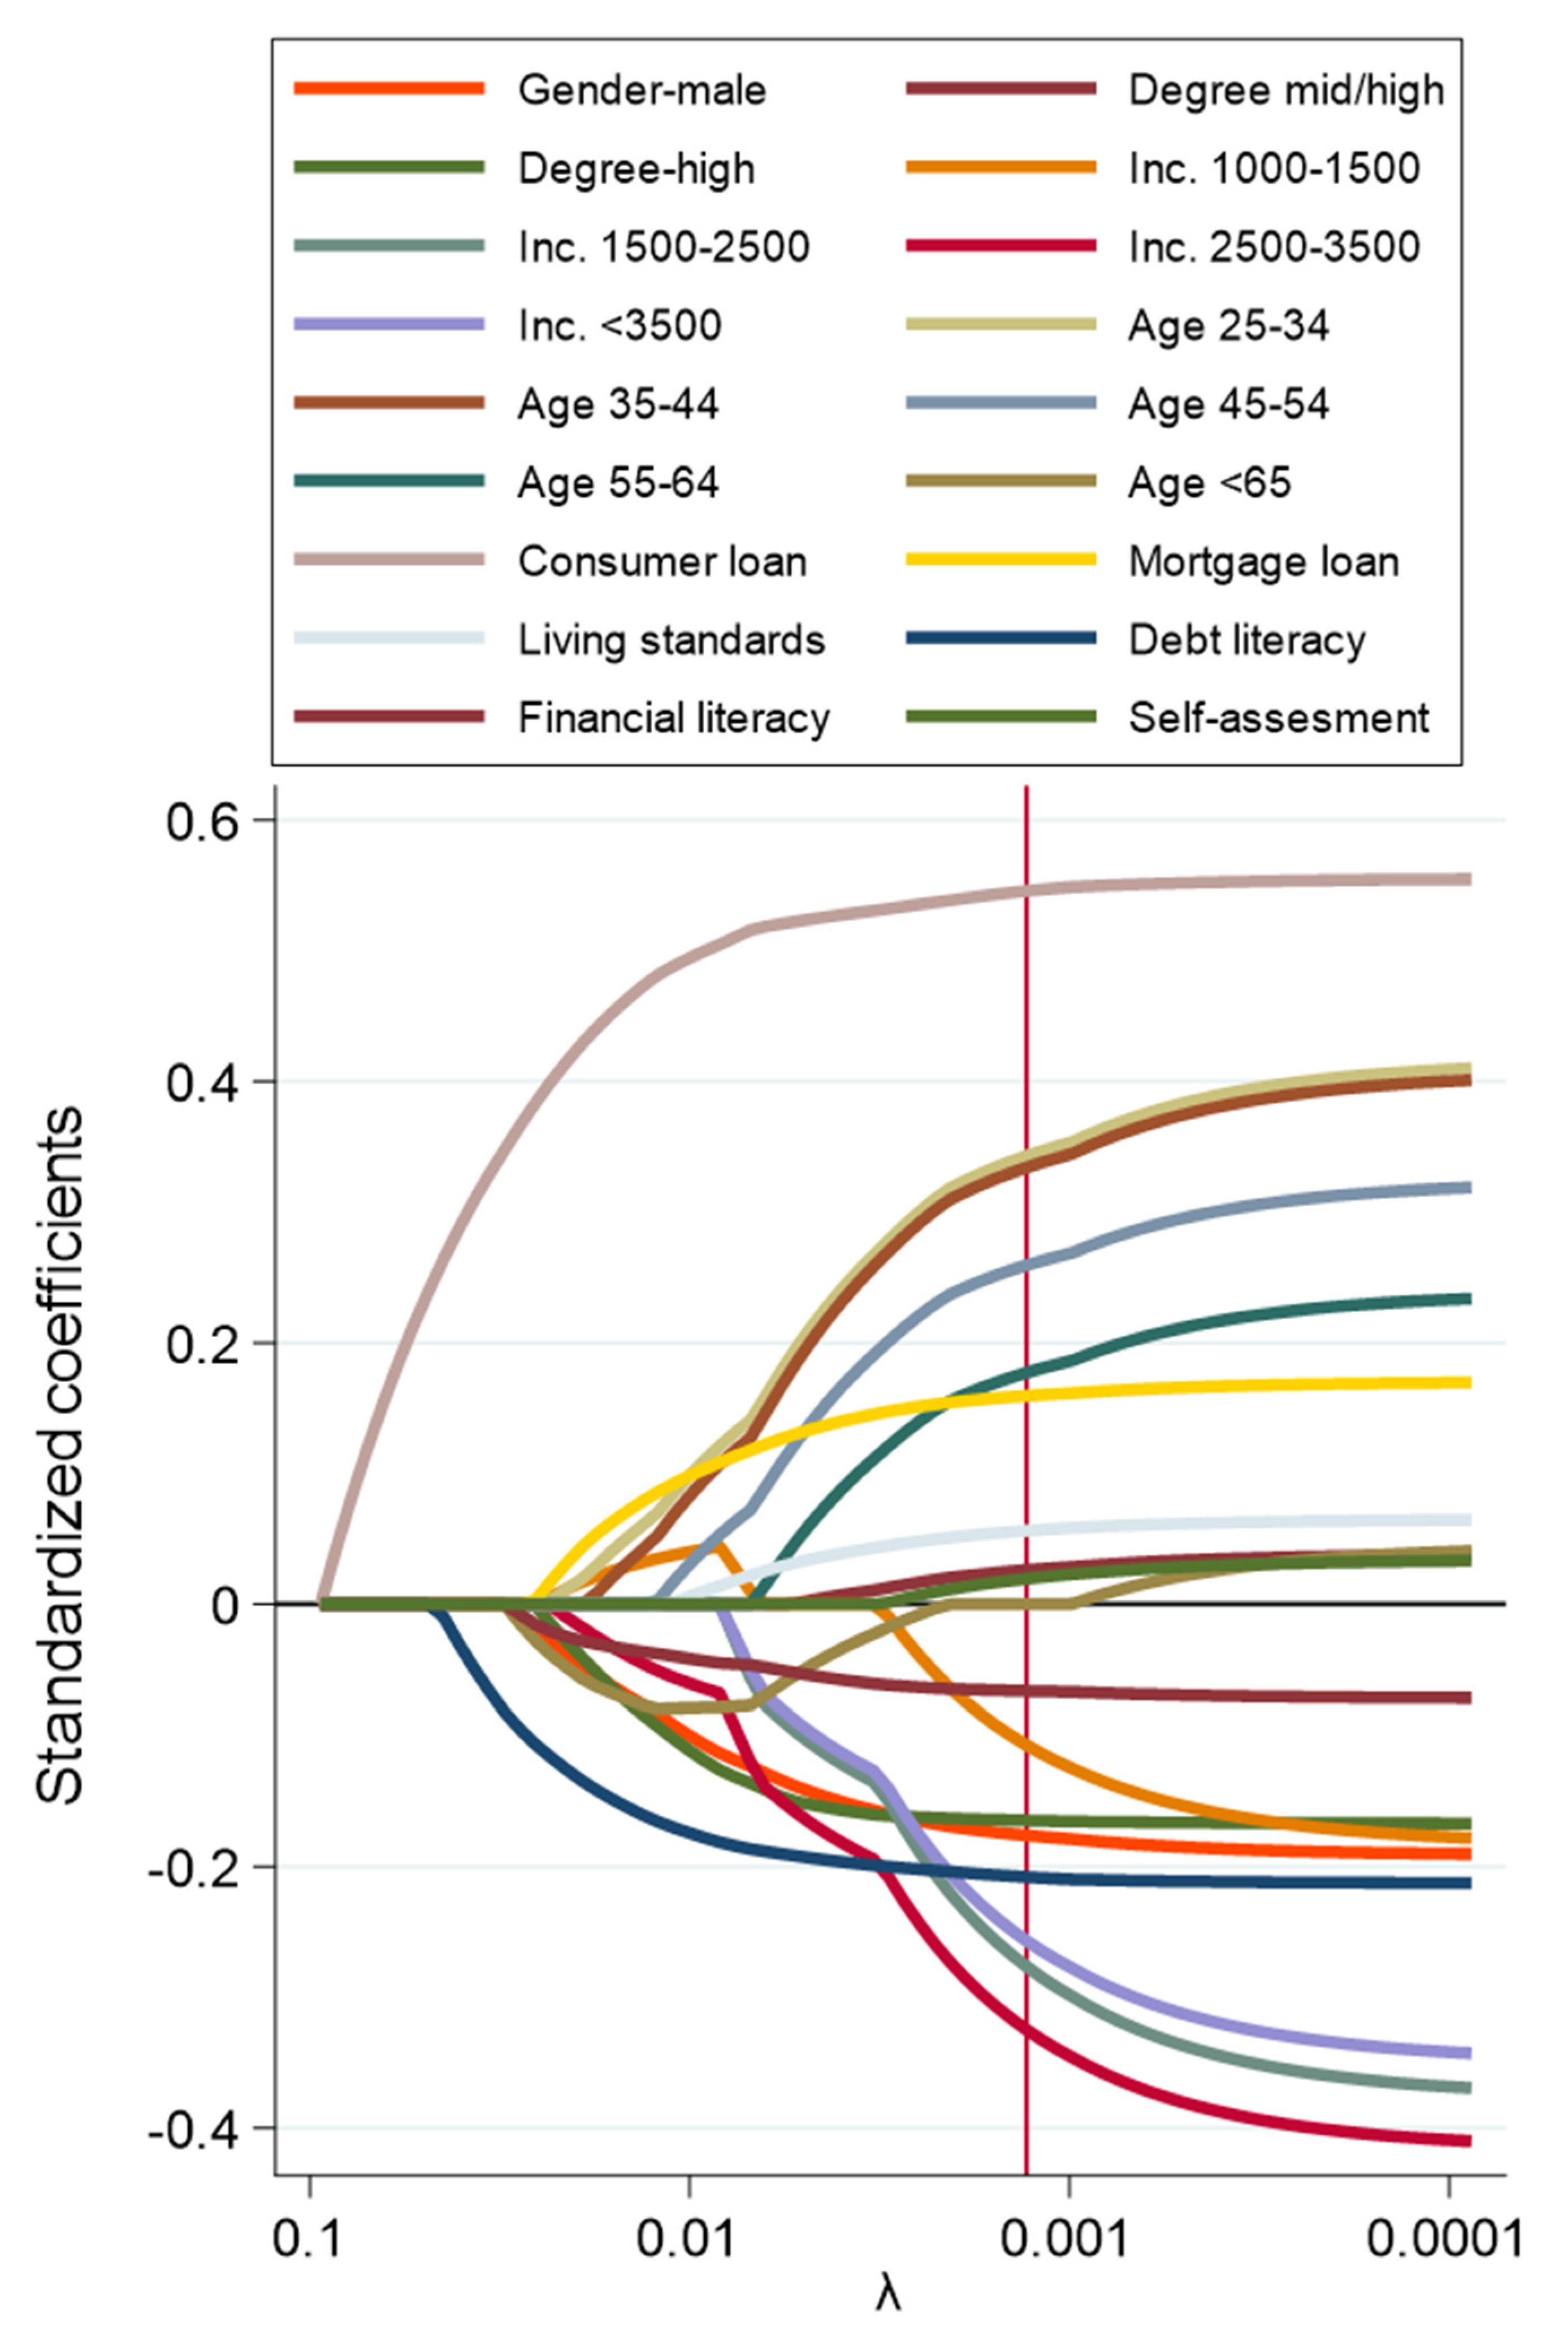
Moreover, as a robustness test, we also run penalized regression called logit lasso and show standardized coefficient paths for this model (see Figure A1 in the Appendix A). For the binary explanatory variable in the logit lasso, a respondent distinction was made between those who are currently overindebted or may be overindebted due to a pandemic (the value 1) and those who are not overindebted (the value 0). Following Tibshirani (1996) the penalty term is associated with penalty parameter λ. To obtain all coefficient paths (in Figure A1), we solved the lasso for different values of λ. Each path presented in the chart shows variation coefficient depending on the penalty parameter. Based on λ selected by cross-validation we can see that most of the variables included in the previous stages of the analysis were rightly included in the models. Lasso exercise confirmed also the importance of consumer loan experience and debt literacy for the assessment of overindebtedness.
5. Conclusions
The coronavirus pandemic has highlighted the importance of preparing household budgets for the unexpected loss of income. A feature of the COVID-19 crisis is that no early warning model of the financial crisis could have predicted the moment when the coronavirus pandemic would have hit the economy with consequences comparable to the 2008 global financial crisis. Therefore, it is important that households have their budget ready at all times for an unexpected loss of income. The main purpose of the article was to test the role of debt and financial literacy in preparing for the health crisis caused by the coronavirus pandemic. Therefore, a survey of 1300 Polish citizens was conducted at the turn of June and July 2020 (i.e., at the peak of government restrictions in response to COVID-19). The questionnaire verified the debt and financial literacy level of a given respondent and linked the obtained results with their debt situation.
According to the obtained results, Poles’ financial literacy, compared to the analyzed countries, should be considered good. However, the awareness of the impact of inflation on savings requires improvement. In the debt literacy dimension, the results indicate a very low knowledge of debt management (especially in the oldest age groups). Second, in this study, using the multinomial logistic regression, we confirm that financial literacy has a significant impact on the current debt situation of a given household. People with greater financial literacy are characterized by a relatively low scale of excessive debt. Debt literacy plays a more important role in the preparation of a household budget for the coronavirus pandemic. Respondents with a higher debt literacy are less likely to default as a result of a pandemic (they have more savings and are less concerned about losing their source of income). Credit experience also plays a vital role in managing a household budget. People with experience in both consumer and housing loans may be affected by problems with settling their obligations; however, this applies to a greater extent to experiences with consumer loans (potentially high-margin credit products).
The results of the survey showed new research areas that require exploration in the future. This applies to the gender gap in financial and debt literacy in Poland and the high scale of overindebtedness of people who are at pre-retirement age or are retiring. Moreover, it is worth studying whether the significant share of consumer loans in bank loan portfolios in Poland and their significant sensitivity to the recession may pose a threat to the financial system’s stability.
After analyzing the survey results, several areas emerged that should be explored in the future. First, we noticed a significant gender gap in Poland when it comes to financial and debt literacy, as well as the amount of savings held. Thus, it would be valuable to investigate what factors influence the gender gap in these characteristics. Second, we noticed that overindebtedness concerns the age group in which Polish society effectively starts the retirement period. In this respect, it is worth analyzing in detail the mechanism behind the excessive debt of this age group. Third, Poland is at the forefront of European countries in terms of the share of consumer loans in bank loan portfolios. At the end of 2019, the share of consumer loans in the loan portfolio of banks in Poland amounted to almost 10%. Among European countries, only Bulgaria and Romania achieved a higher value. As we have shown in the survey, respondents with consumer credit experiences are at a greater credit risk than other borrowers during the COVID-19 pandemic. It is worth considering in the future whether the relatively large share of consumer loans in Poland may constitute a systemic risk (due to their significant sensitivity to the economic situation), and to what extent financial education of the society may prevent it.
Funding
This research was funded the Institute of Finance at Warsaw School of Economics, grant number KZIF/S20:1.27.
Institutional Review Board Statement
Not applicable.
Informed Consent Statement
Not applicable.
Acknowledgments
The authors would like to thank Małgorzata Iwanicz-Drozdowska and Annamaria Lusardi for their helpful discussions and comments. The opinions expressed herein are those of the authors and do not reflect those of the associated institutions.
Conflicts of Interest
The authors declare no conflict of interest.
Appendix A

Table A1.
Literacy and Indebtedness question.
| Question | Possible Answers |
|---|---|
| Financial Literacy I (FL I): Suppose you had PLN100 in a savings account and the interest rate was 2% per year. After 5 years, how much do you think you would have in the account if you left the money to grow? | (a) More than 102 PLN; (b) Exactly 102 PLN; (c) Less than 102 PLN; |
| Financial Literacy II (FL II): Imagine that the interest rate on your savings account was 1% per year and inflation was 2% per year. After 1 year, how much would you be able to buy with the money in this account? | (a) More than today; (b) Exactly the same; (c) Less than today; |
| Financial Literacy III (FL III): Please tell me whether this statement is true or false. “Buying a single company’s stock usually provides a safer return than a stock mutual fund”. | (a) True; (b) False; |
| Debt literacy I (DL I): Suppose you owe PLN1000 on your credit card and the interest rate you are charged is 20% per year compounded annually. If you didn’t pay anything off, at this interest rate, how many years would it take for the amount you owe to double? | (a) 2 years; (b) Less than 5 years; (c) 5 to 10 years; (d) More than 10 years; (e) Do not know; |
| Debt literacy II (DL II): You owe PLN3000 on your credit card. You pay a minimum payment of PLN30 each month. At an annual percentage rate of 12% (or 1% per month), how many years would it take to eliminate your credit card debt if you made no additional new charges? | (a) Less than 5 years; (b) Between 5 and 10 years; (c) Between 10 and 15 years; (d) Never, you will continue to be in debt; (e) Do not know; |
| Debt literacy III (DL III): You purchase an appliance which costs PLN1000. To pay for this appliance, you are given the following two options: (a) Pay 12 monthly installments of PLN100 each; (b) Borrow at a 20% annual interest rate and pay back PLN1200 a year from now. Which is the more advantageous offer? | (a) Option (a); (b) Option (b); (c) They are the same; (d) Do not know; |
| Debt literacy IV (DL IV)—country specific question: Let’s assume you want to buy a car. You decide to borrow funds to buy this car. What do you think, the offer of which institution will be the least advantageous for you: | (a) Commercial bank; (b) Shadow bank institution; (c) Credit union; (d) Cooperative bank; |
| Indebtedness question: Which of the following best describes your current debt position? | (a) I have too much debt right now and I have difficulty paying it off. (b) I am currently paying off my debt regularly. (c) I have no debt at the moment. |
Table A2.
Respondent profiles.
| Variable | Number | |
|---|---|---|
| Gender | ||
| Male | 642 | |
| Female | 658 | |
| Age | ||
| 18–24 | 180 | |
| 25–34 | 339 | |
| 35–44 | 314 | |
| 45–54 | 197 | |
| 55–64 | 168 | |
| Age > 64 | 102 | |
| Degree | ||
| Elementary | 130 | |
| Middle-high | 628 | |
| High | 542 | |
| Income (PLN) | ||
| Income < 1000 | 80 | |
| 1000–1500 | 190 | |
| 1500–2499 | 440 | |
| 2500–3500 | 311 | |
| Income > 3500 | 279 | |
Table A3.
Financial and debt literacy: Share of correct answers in a particular question.
| Variable | FL I | FL II | FL III | DL I | DL II | DL III | DL IV | Self-Assessment | |
|---|---|---|---|---|---|---|---|---|---|
| Gender | |||||||||
| Male | 75.7% | 72.4% | 75.9% | 48.4% | 25.1% | 14.8% | 56.7% | 4.2 | |
| Female | 68.7% | 54.1% | 61.6% | 39.1% | 15.7% | 14.3% | 49.8% | 3.98 | |
| Age | |||||||||
| 18–24 | 73.9% | 57.2% | 57.8% | 43.9% | 21.7% | 13.3% | 59.4% | 4.04 | |
| 25–34 | 54.9% | 65.8% | 51.6% | 42.2% | 20.4% | 17.1% | 54.9% | 4.1 | |
| 35–44 | 71.7% | 62.1% | 71.7% | 43.0% | 18.2% | 15.0% | 54.8% | 4.15 | |
| 45–54 | 74.6% | 75.1% | 76.6% | 45.7% | 22.3% | 16.8% | 49.2% | 4.12 | |
| 55–64 | 78.0% | 73.8% | 79.8% | 45.8% | 26.8% | 10.7% | 51.2% | 4.05 | |
| Age > 64 | 77.5% | 74.5% | 79.4% | 43.1% | 17.6% | 8.8% | 43.1% | 3.98 | |
| Degree | |||||||||
| Elementary | 66.2% | 50.8% | 59.2% | 33.8% | 5.4% | 12.3% | 38.5% | 3.7 | |
| Middle-high | 71.2% | 61.1% | 67.7% | 42.0% | 19.9% | 12.9% | 52.1% | 4 | |
| High | 74.7% | 68.5% | 72.0% | 48.0% | 25.8% | 17.0% | 58.1% | 4.29 | |
Note: FL I, FL II, FL III—Financial literacy questions; DL I, DL II, DL III, DL IV—Debt literacy questions. Self-assessment—subjective respondent assessment on a scale of 0 (no economic and financial knowledge) to 7 (high level of economic and financial knowledge).
Table A4.
Consumer and mortgage loan experiences: Share of respondents with a particular loan experience.
Table A4.
Consumer and mortgage loan experiences: Share of respondents with a particular loan experience.
| Variable | Mortgage Loan | Car Loan | Loan for Household Goods | Current Account Loan | Credit Card Loan | Cash Loan | |
|---|---|---|---|---|---|---|---|
| Gender | |||||||
| Male | 23.1% | 17.3% | 36.1% | 17.1% | 28.7% | 38.2% | |
| Female | 16.9% | 15.0% | 30.1% | 13.1% | 22.0% | 34.3% | |
| Age | |||||||
| 18–24 | 15.0% | 11.7% | 15.0% | 7.2% | 12.8% | 18.3% | |
| 25–34 | 19.5% | 15.6% | 32.7% | 10.9% | 19.2% | 39.8% | |
| 35–44 | 30.6% | 15.9% | 37.6% | 11.8% | 24.8% | 35.0% | |
| 45–54 | 19.3% | 21.8% | 38.1% | 26.4% | 37.6% | 44.2% | |
| 55–64 | 14.9% | 17.9% | 36.9% | 21.4% | 33.3% | 37.5% | |
| Age > 64 | 6.9% | 12.7% | 36.3% | 20.6% | 32.4% | 42.2% | |
| Degree | |||||||
| Elementary | 10.8% | 8.5% | 31.5% | 12.3% | 13.8% | 31.5% | |
| Middle-high | 15.4% | 13.2% | 31.8% | 12.7% | 22.9% | 39.5% | |
| High | 27.3% | 21.4% | 34.9% | 18.5% | 30.8% | 33.6% | |
Note: Consumer loans, according to the classification used by financial institutions in Poland, include: car, household good, current account, credit card, cash loan.
Table A5.
Living standards and savings (in months).
| Variable | Average Level of Living Standards (in PLN) | Average Level of Savings in Months | |
|---|---|---|---|
| Gender | |||
| Male | 3653.33 | 9.30 | |
| Female | 3709.37 | 6.08 | |
| Age | |||
| 18–24 | 3481.99 | 7.05 | |
| 25–34 | 3607.65 | 6.92 | |
| 35–44 | 3867.18 | 7.61 | |
| 45–54 | 3799.99 | 8.35 | |
| 55–64 | 3592.76 | 7.86 | |
| Age > 64 | 3618.40 | 6.12 | |
| Degree | |||
| Elementary | 3296.58 | 5.45 | |
| Middle-high | 3628.80 | 6.89 | |
| High | 3837.10 | 8.68 | |
Note: Living standards—variable specifying how many funds a given respondent needs per month to meet their basic needs (e.g., purchase of food and other everyday goods, rent, gas, electricity, heating, taxes, and other fees). Average level of savings in months—variable specifying how many months a given respondent is able to survive in case of loss of source of income using his own savings.
Table A6.
Share of a particular debt situation in a given group of respondents.
| Variable | Currently Overindebt | Currently Have No Problems with Debt Repayment | Have No Debt | Possibly Overindebt during COVID-19 Crisis | |
|---|---|---|---|---|---|
| Gender | |||||
| Male | 8.52% | 49.09% | 42.39% | 9.27% | |
| Female | 10.28% | 42.83% | 46.89% | 12.94% | |
| Age | |||||
| 18–24 | 6.11% | 27.22% | 66.67% | 6.11% | |
| 25–34 | 8.55% | 48.97% | 42.48% | 15.34% | |
| 35–44 | 7.64% | 54.46% | 37.90% | 14.01% | |
| 45–54 | 12.18% | 52.28% | 35.54% | 12.18% | |
| 55–64 | 14.88% | 38.69% | 46.43% | 4.76% | |
| Age > 64 | 8.82% | 43.14% | 48.04% | 4.90% | |
| Degree | |||||
| Elementary | 15.38% | 40.00% | 44.62% | 9.23% | |
| Middle-high | 10.99% | 44.43% | 44.58% | 11.94% | |
| High | 6.09% | 49.26% | 44.65% | 10.52% | |
Note: Currently overindebted—respondents who declare that. currently. they have too much debt and difficulty paying it off. Possibly overindebted during the COVID-19 crisis—respondents who may become insolvent during the COVID-19 pandemic. This group now regularly repays its debt, but in the survey it declares that it is afraid of losing the source of income and has a maximum of 3 months of savings.
Table A7.
Multinomial logistic regression with exclusion of respondents over 64 years old.
| Reference Variable | Variables | Overindebt | Possibly Overindebt (COVID-19) | Overindebt | Possibly Overindebt (COVID-19) | Overindebt | Possibly Overindebt (COVID-19) |
|---|---|---|---|---|---|---|---|
| Female | Gender (male) | −0.2785 (0.228) | −0.3884 * (0.025) | −0.2718 (0.238) | −0.4504 ** (0.009) | −0.3441 (0.134) | −0.4443 ** (0.010) |
| Elementary | Middle-high | −0.0073 (0.982) | 0.2106 (0.496) | −0.0757 (0.816) | 0.1171 (0.704) | −0.1374 (0.672) | 0.1220 (0.691) |
| High | −0.6596 (0.075) | −0.0834 (0.796) | −0.7248 * (0.046) | −0.2256 (0.480) | −0.8427 * (0.020) | −0.2238 (0.480) | |
| Income < 1000 | Income 1000–1500 | −0.4979 (0.214) | −0.3643 (0.322) | −0.4822 (0.232) | −0.3887 (0.289) | −0.5020 (0.211) | −0.4133 (0.263) |
| Income 1500–2500 | −1.2771 *** (0.001) | −0.4744 (0.163) | −1.2393 *** (0.001) | −0.5088 (0.134) | −1.2852 *** (0.001) | −0.5241 (0.124) | |
| Income 2500–3500 | −1.1209 ** (0.006) | −0.8013 * (0.025) | −1.0855 ** (0.008) | −0.8336 * (0.020) | −1.1255 ** (0.006) | −0.8498 * (0.018) | |
| Income > 3500 | −1.0077 * (0.017) | −0.5965 (0.100) | −0.9677 * (0.022) | −0.6137 (0.090) | −0.9774 * (0.021) | −0.6451 (0.078) | |
| Age 18–24 | Age 25–34 | 0.6191 (0.119) | 1.1125 *** (0.000) | 0.56648 (0.156) | 1.1393 *** (0.000) | 0.6569 (0.097) | 1.1375 *** (0.000) |
| Age 35–44 | 0.5230 (0.207) | 1.0884 *** (0.001) | 0.5799 (0.161) | 1.1335 *** (0.000) | 0.5998 (0.147) | 1.1388 *** (0.000) | |
| Age 45–54 | 0.8510 * (0.046) | 0.8567 * (0.014) | 0.9840 * (0.021) | 0.8761 * (0.012) | 0.9009 * (0.034) | 0.8902 ** (0.010) | |
| Age 55–65 | 1.0295 * (0.012) | 0.3090 (0.413) | 1.2075 ** (0.004) | 0.3129 (0.408) | 1.0598 ** (0.010) | 0.3389 (0.368) | |
| Concumer loan experience | 1.5186 *** (0.000) | 1.0667 *** (0.000) | 1.4999 *** (0.000) | 1.0493 *** (0.000) | 1.4986 *** (0.000) | 1.0427 *** (0.000) | |
| Mortgage loan experience | −0.0297 (0.342) | 0.6749 *** (0.000) | −0.3725 (0.233) | 0.6360 *** (0.000) | −0.0332 (0.285) | 0.6240 *** (0.001) | |
| Living standards | −0.0002 ** (0.007) | 0.0001 ** (0.006) | −0.0002 * (0.019) | 0.0001 ** (0.008) | −0.0002 ** (0.007) | 0.0001 ** (0.008) | |
| Debt Literacy | −1.1981 ** (0.010) | −0.8120 * (0.018) | |||||
| Financial literacy | −1.0176 ** (0.002) | 0.07252 (0.771) | |||||
| Self-assessment | −0.0516 (0.484) | 0.0439 (0.452) | |||||
| constans | −1.4113 ** (0.010) | −2.7366 *** (0.000) | −1.2523 * (0.025) | −2.8747 *** (0.000) | −1.4293 * (0.014) | −2.9922 *** (0.000) | |
| Sample | 1198 | 1198 | 1198 | 1198 | 1198 | 1198 | |
| Pseudo R2 | 0.0973 | 0.0972 | 0.0921 | ||||
Note: The table presents three multinomial logistic regression models depending on the literacy variable (debt, financial and self-assessment) with p-value in the brackets. The dependent variable may take the values 1 (overindebted respondent), 2 (possibly overindebted respondent during the COVID-19 pandemic), or 3 (omitted class that describes respondents who are not at risk of overindebtedness or have no debt). *, **, and *** denote a statistical significance at p < 0.05, p < 0.01, and p < 0.001, respectively.
Figure A1.
Coefficient paths for lasso model. Note: Standardized coefficient path plots show the path of each coefficient over the search grid for the lasso penalty parameter lambda. Vertical red line on the chart is a lambda level selected by cross-validation.
Figure A1.
Coefficient paths for lasso model. Note: Standardized coefficient path plots show the path of each coefficient over the search grid for the lasso penalty parameter lambda. Vertical red line on the chart is a lambda level selected by cross-validation.

References
- Agnew, Julie R., Hazel Bateman, and Susan Thorp. 2013. Financial Literacy and Retirement Planning in Australia. Numeracy 6: 7. [Google Scholar] [CrossRef] [Green Version]
- Alessie, Rob, Maarten Van Rooij, and Annamaria Lusardi. 2011. Financial literacy and retirement preparation in the Netherlands. Journal of Pension Economics & Finance 10.4: 527. [Google Scholar]
- Almenberg, Johan, and Jenny Säve-Söderbergh. 2011. Financial literacy and retirement planning in Sweden. Journal of Pension Economics and Finance 10: 585–98. [Google Scholar] [CrossRef]
- Altman, Morris. 2012. Implications of behavioural economics for financial literacy and public policy. The Journal of Socio-Economics 41: 677–90. [Google Scholar] [CrossRef]
- Arrondel, Luc, Majdi Debbich, and Frédérique Savignac. 2013. Financial Literacy and Financial Planning in France. Numeracy 6: 8. [Google Scholar] [CrossRef] [Green Version]
- Artavanis, Nikolaos, and Soumya Karra. 2020. Financial literacy and student debt. The European Journal of Finance 26: 382–401. [Google Scholar] [CrossRef]
- Azimi Doosti, Bahar, and Abdolhosein Karampour. 2017. The impact of behavioral factors on Propensity toward indebtedness Case Study: Indebted customers of Maskan Bank, Tehran province (Geographic regions: East). Journal of Advances in Computer Engineering and Technology 3: 145–52. [Google Scholar]
- Azma, Nurul, Mahfuzur Rahman, Adewale Abideen Adeyemi, and Muhammad Khalilur Rahman. 2019. Propensity toward indebtedness: Evidence from Malaysia. Review of Behavioral Finance 11: 188–200. [Google Scholar] [CrossRef]
- Banks, James, Cormac o’Dea, and Zoë Oldfield. 2010. Cognitive Function, Numeracy and Retirement Saving Trajectories. The Economic Journal 120: F381–410. [Google Scholar] [CrossRef] [PubMed]
- Beckmann, Elisabeth. 2013. Financial Literacy and Household Savings in Romania. Numeracy 6: 9. [Google Scholar] [CrossRef] [Green Version]
- Białowolski, Piotr, Andrzej Cwynar, Wiktor Cwynar, and Dorota Więziak-Białowolska. 2020. Consumer debt attitudes: The role of gender, debt knowledge and skills. International Journal of Consumer Studies 44: 191–205. [Google Scholar] [CrossRef]
- Boisclair, David, Annamaria Lusardi, and Pierre-Carl Michaud. 2017. Financial literacy and retirement planning in Canada. Journal of Pension Economics and Finance 16: 277–96. [Google Scholar] [CrossRef] [Green Version]
- Bongini, Paola, Luca Colombo, and Malgorzata Iwanicz-Drozdowska. 2015. Financial literacy: Where do we stand? Journal of Financial Management, Markets and Institutions 3: 3–12. [Google Scholar]
- Braveman, Paula A., Catherine Cubbin, Susan Egerter, Sekai Chideya, Kristen S. Marchi, Marilyn Metzler, and Samuel Posner. 2005. Socioeconomic status in health research: One size does not fit all. Journal of the American Medical Association 294: 2879–88. [Google Scholar] [CrossRef] [PubMed]
- Brown, Martin, and Roman Graf. 2013. Financial literacy and retirement planning in Switzerland. Numeracy 6.2: 2–23. [Google Scholar] [CrossRef] [Green Version]
- Brown, Meta, John Grigsby, Wilbert Van Der Klaauw, Jaya Wen, and Basit Zafar. 2016. Financial Education and the Debt Behavior of the Young. The Review of Financial Studies 29: 2490–522. [Google Scholar] [CrossRef] [Green Version]
- Bucher-Koenen, Tabea, and Annamaria Lusardi. 2011. Financial Literacy and Retirement Planning in Germany. Journal of Pension Economics and Finance 10: 565–84. [Google Scholar] [CrossRef] [Green Version]
- Buchholtz, Sonia, Jan Gąska, and Marek Góra. 2021. Myopic Savings Behaviour of Future Polish Pensioners. Risks 9: 36. [Google Scholar] [CrossRef]
- Chatterjee, Devlina, Mahendra Kumar, and Kapil K. Dayma. 2019. Income security, social comparisons and materialism. International Journal of Bank Marketing 37: 1041–61. [Google Scholar] [CrossRef]
- Chen, Haiyang, and Ronald P. Volpe. 2002. Gender Differences in Personal Financial Literacy Among College Students. Financial Services Review 11: 289–307. [Google Scholar]
- Christelis, Dimitris, Tullio Jappelli, and Mario Padula. 2010. Cognitive abilities and portfolio choice. European Economic Review 54: 18–38. [Google Scholar] [CrossRef] [Green Version]
- Courchane, Marsha, and Peter Zorn. 2005. Consumer literacy and creditworthiness. Proceedings, Federal Reserve Bank of Chicago, Conference, Promises and Pitfalls: As Consumer Options Multiply, Who Is Being Served and at What Cost? April 7, 2005 in Washington, DC. Available online: https://econpapers.repec.org/paper/fipfedhpr/950.htm (accessed on 29 March 2021).
- Crossan, Diana. 2011. How to Improve Financial Literacy: Some Successful Strategies. In Financial Literacy: Implications for Retirement Security and the Financial Marketplace. Edited by Olivia S. Mitchell and Annamaria Lusardi. Oxford: Oxford University Press, pp. 241–54. [Google Scholar]
- Cwynar, Andrzej. 2020. Financial literacy, behaviour and well-being of millennials in Poland compared to previous generations: The insights from three large-scale surveys. Review of Economic Perspectives 20: 289–335. [Google Scholar] [CrossRef]
- Cwynar, Andrzej, Wiktor Cwynar, and Przemysław Szuba. 2018. Financial education, debt literacy and credit market participation: The case of Poland. Economic Policy in the European Union Member Countries 44. Available online: https://www.researchgate.net/profile/Andrzej-Cwynar-2/publication/332496435_FINANCIAL_EDUCATION_DEBT_LITERACY_AND_CREDIT_MARKET_PARTICIPATION_THE_CASE_OF_POLAND/links/5cbee854a6fdcc1d49a89664/FINANCIAL-EDUCATION-DEBT-LITERACY-AND-CREDIT-MARKET-PARTICIPATION-THE-CASE-OF-POLAND.pdf (accessed on 29 March 2021).
- Cwynar, Andrzej, Wiktor Cwynar, and Kamil Wais. 2019. Debt literacy and debt literacy self-assessment: The case of Poland. Journal of Consumer Affairs 53: 24–57. [Google Scholar] [CrossRef]
- Dick, Christian D., and Lena Jaroszek. 2013. Knowing What Not to Do: Financial Literacy and Consumer Credit Choices. Discussion Paper, No. 13-027. Mannheim: Center for European Economic Research. [Google Scholar]
- Fan, Lu, and Swarn Chatterjee. 2018. Application of situational stimuli for examining the effectiveness of financial education: A behavioral finance perspective. Journal of Behavioral and Experimental Finance 17: 68–75. [Google Scholar] [CrossRef]
- Fornero, Elsa, and Chiara Monticone. 2011. Financial Literacy and Pension Plan Participation in Italy. Journal of Pension Economics and Finance 10: 547–64. [Google Scholar] [CrossRef]
- Gathergood, John. 2011. Self-Control, Financial Literacy and Consumer Over-Indebtedness. Journal of Economic Psychology 33: 590–602. [Google Scholar] [CrossRef] [Green Version]
- Gathergood, John, and Jörg Weber. 2017. Financial literacy, present bias and alternative mortgage products. Journal of Banking & Finance 78: 58–83. [Google Scholar]
- Gerardi, Kristopher, Lorenz Goette, and Stephan Meier. 2013. Numerical ability predicts mortgage default. Proceedings of the National Academy of Sciences of the United States of America 110: 11267–71. [Google Scholar] [CrossRef] [Green Version]
- Goode, Jackie. 2012. Brothers are doing it for themselves? Men’s experiences of getting into and getting out of debt. The Journal of Socio-Economics 41: 327–35. [Google Scholar] [CrossRef]
- Hastings, Justine, and Olivia S. Mitchell. 2020. How financial literacy and impatience shape retirement wealth and investment behaviors. Journal of Pension Economics & Finance 19: 1–20. [Google Scholar]
- Hastings, Justine, Olivia S. Mitchell, and Eric Chyn. 2011. Fees, Framing, and Financial Literacy in the Choice of Pension Managers. In Financial Literacy: Implications for Retirement Security and the Financial Marketplace. Edited by Olivia S. Mitchell and Lusardi Annamaria. Oxford: Oxford University Press, pp. 101–15. [Google Scholar]
- Huston, Sandra J. 2012. Financial literacy and the cost of borrowing. International Journal of Consumer Studies 36: 566–72. [Google Scholar] [CrossRef]
- Kalmi, Panu, and Olli-Pekka Ruuskanen. 2017. Financial literacy and retirement planning in Finland. Journal of Pension Economics and Finance 17: 1–28. [Google Scholar] [CrossRef] [Green Version]
- Keese, Matthias. 2012. Who feels constrained by high debt burdens? Subjective vs. objective measures of household debt. Journal of Economic Psychology 33: 125–41. [Google Scholar]
- Kim, Hugh Hoikwang, Raimond Maurer, and Olivia S. Mitchell. 2013. Time Is Money: Life Cycle Rational Inertia and Delegation of Investment Management. NBER Working Paper, No. 19732. Cambridge: National Bureau of Economic Research. [Google Scholar]
- Klapper, Leora F., and Georgios A. Panos. 2011. Financial Literacy and Retirement Planning: The Russian Case. Journal of Pension Economics and Finance 10: 599–618. [Google Scholar] [CrossRef] [Green Version]
- Li, Geng. 2018. Gender-Related Differences in Credit Use and Credit Scores. FEDS Notes. Washington, DC: Board of Governors of the Federal Reserve System. [Google Scholar]
- Lin, Liqiong, Mohamad Dian Revindo, Christopher Gan, and David A. Cohen. 2019. Determinants of credit card spending and debt of Chinese consumers. International Journal of Bank Marketing 37: 545–64. [Google Scholar] [CrossRef]
- Lusardi, Annamaria, and Olivia S. Mitchell. 2011. Financial literacy around the world: An overview. Journal of Pension Economics and Finance 10: 497–508. [Google Scholar] [CrossRef] [Green Version]
- Lusardi, Annamaria, and Olivia S. Mitchell. 2014. The Economic Importance of Financial Literacy: Theory and Evidence. Journal of Economic Literature 52: 5–44. [Google Scholar] [CrossRef] [PubMed] [Green Version]
- Lusardi, Annamaria, and Peter Tufano. 2015. Debt Literacy, Financial Experiences, and Overindebtedness. Journal of Pension Economics and Finance 14: 332–68. [Google Scholar] [CrossRef] [Green Version]
- Meyll, Tobias, and Thomas Pauls. 2019. The gender gap in over-indebtedness. Finance Research Letters 31. [Google Scholar] [CrossRef]
- Mitchell, Olivia S., and Annamaria Lusardi. 2015. Financial literacy and economic outcomes: Evidence and policy implications. Journal of Retirement 3: 107–14. [Google Scholar] [CrossRef] [Green Version]
- Moore, Danna L. 2003. Survey of Financial Literacy in Washington State: Knowledge, Behavior, Attitudes, and Experiences. Technical Report n. 03-39. Pullman: Social and Economic Sciences Research Center, Washington State University. [Google Scholar]
- Moure, Natalia Garabato. 2015. Financial literacy and retirement planning in Chile. Journal of Pension Economics and Finance 15: 203–23. [Google Scholar] [CrossRef]
- Nguyen, Linh, Gerry Gallery, and Cameron Newton. 2019. The joint influence of financial risk perception and risk tolerance on individual investment decision-making. Accounting & Finance 59: 747–71. [Google Scholar]
- Rahman, Mahfuzur, Nurul Azma, Md Masud, Abdul Kaium, and Yusof Ismail. 2020. Determinants of Indebtedness: Influence of Behavioral and Demographic Factors. International Journal of Financial Studies 8: 8. [Google Scholar] [CrossRef] [Green Version]
- Sandvall, Lisbeth. 2011. The Faces of Over-Indebtedness. Pathways into and out of Financial Problems. Växjö: Linnaeus University. [Google Scholar]
- Sekita, Shizuka. 2011. Financial Literacy and Retirement Planning in Japan. Journal of Pension Economics and Finance 10: 637–56. [Google Scholar] [CrossRef] [Green Version]
- Sevim, Nurdan, Fatih Temizel, and Özlem Sayılır. 2012. The effects of financial literacy on the borrowing behaviour of Turkish financial consumers. International Journal of Consumer Studies 36: 573–79. [Google Scholar] [CrossRef]
- Simon, Herbert A. 1978. Rationality as a process and as a product of thought. American Economic Review 70: 1–16. [Google Scholar]
- Smaga, Paweł. 2013. Assessing Involvement of Central Banks in Financial Stability. Center for Financial Stability Policy Paper. Available online: https://papers.ssrn.com/sol3/papers.cfm?abstract_id=2269265 (accessed on 29 March 2021).
- Smith, James P., John J. McArdle, and Robert Willis. 2010. Financial decision making and cognition in a family context. The Economic Journal 120: F363–80. [Google Scholar] [CrossRef] [PubMed] [Green Version]
- Swiecka, Beata, Yesilda Yesilda, Ercan Özen, and Simon Grima. 2000. Financial literacy: The case of Poland. Sustainability 12: 700. [Google Scholar] [CrossRef] [Green Version]
- Tibshirani, Robert. 1996. Regression shrinkage and selection via the lasso. Journal of the Royal Statistical Society: Series B (Methodological) 58: 267–88. [Google Scholar] [CrossRef]
- Toosi, Negin R., Elyse N. Voegeli, Ana Antolin, Laura G. Babbitt, and Drusilla K. Brown. 2020. Do financial literacy training and clarifying pay calculations reduce abuse at work? Journal of Social Issues 76: 581–720. [Google Scholar] [CrossRef]
- Trombetta, Marco. 2016. Accounting and Finance Literacy and Self-Employment: An Exploratory Study. IE Business School—IE University 3: 2018. [Google Scholar]
- Van Rooij, Maarten, Annamaria Lusardi, and Rob Alessie. 2011. Financial literacy and stock market participation. Journal of Financial Economics 101: 449–72. [Google Scholar] [CrossRef] [Green Version]
- Zissimopoulos, Julie M., Benjamin Karney, and Amy Rauer. 2008. Marital Histories and Economic Well-Being. MRRC Working Paper, WP2008-645. Ann Arbor: Michigan Retirement Research Center, University of Michigan, December 17. [Google Scholar]
Figure 1.
Total credit to the private non-financial sector, as % of GDP (2020 Q3). BIS (Bank for International Settlements) statistics (https://www.bis.org/statistics/c_gaps.htm accessed on 16 March 2021).
Figure 1.
Total credit to the private non-financial sector, as % of GDP (2020 Q3). BIS (Bank for International Settlements) statistics (https://www.bis.org/statistics/c_gaps.htm accessed on 16 March 2021).

Table 1.
Variables used in the multinomial logistic regression.
| Variable | Description |
|---|---|
| Indebtedness (Dependent variable) | The variable may take the values 1, 2, or 3, depending on the debt situation of a given respondent. The value 1—respondents who declare that currently they have too much debt and difficulty paying it off. The value 2—respondents who may become insolvent during the COVID-19 pandemic. This group now regularly repays its debt (i.e., selected the answer “b” in indebtedness question). However, we limited this group to those respondents, who declare worries about losing their income and have a maximum of 3 months of savings (the 3-month threshold was assumed on the basis of the average time of looking for a job in Poland during the coronavirus pandemic). The value 3—respondents who are not at risk of overindebtedness (i.e., respondents, who paying off debt regularly and declare no worries about losing their income or have more than 3 months of savings). This group also includes people who currently have no debt (i.e., selected the answer “c” in indebtedness question). Descriptive statistics for indebtedness variables are presented in Table A6 in the Appendix A. |
| Demografic variables | Gender, Education, Income (per family member), Age. |
| Consumer loan experience | Variable identifying respondents who have taken consumer loans in the past (or are repaying them currently). The variable identifies experiences with high-margin credit products, potentially burdened with higher credit risk. |
| Mortgage loan experience | Variable identifying respondents who have taken housing loans in the past (or are repaying them currently). The variable identifies experiences with long-term credit, which potentially requires the ability to better manage personal finances and is associated with higher credit requirements for the consumer. |
| Living standards | Variable specifying how many funds a given respondent needs per month to meet their basic needs (e.g., purchase of food and other everyday goods, rent, gas, electricity, heating, taxes, and other fees). |
| Debt Literacy | Percentage of correct answers to debt management questions (DL I, DL II, DL III, DL IV). |
| Financial literacy | Percentage of correct answers to the Big Three financial literacy questions (FL I, FL II, FL III). |
| Self-assessment | Self-assessment of economic and financial skills on a scale of 0 (lack of knowledge) to 7 (high level of knowledge). Following Courchane and Zorn (2005), self-assessed knowledge turned out to be a significant factor affecting consumer financial behavior. |
Table 2.
Percentage of correct answers to the Big Three financial literacy questions.
| Country | FL I | FL II | FL III | Sample | Year | % of All Correct Answers | Research |
|---|---|---|---|---|---|---|---|
| Germany | 82.40% | 78.40% | 61.80% | 1059 | 2009 | 53.20% | Bucher-Koenen and Lusardi (2011) |
| Switzerland | 79.30% | 78.40% | 73.50% | 1500 | 2011 | 50.10% | Brown and Graf (2013) |
| Netherland | 84.80% | 76.90% | 51.90% | 1665 | 2010 | 44.80% | Alessie et al. (2011) |
| Spain | 85.20% | 70% | 56.20% | 500 | 2015 | 44.80% | Trombetta (2016) |
| Australia | 83.10% | 63.90% | 54.70% | 1024 | 2012 | 42.70% | Agnew et al. (2013) |
| Canada | 77.90% | 66.18% | 59.36% | 6805 | 2012 | 42.50% | Boisclair et al. (2017) |
| Poland | 72.20% | 63.20% | 68.60% | 1300 | 2020 | 42.00% | This research |
| Finaland | 58.10% | 76.40% | 65.80% | 1477 | 2014 | 35.60% | Kalmi and Ruuskanen (2017) |
| France | 48% | 61.20% | 66.80% | 3616 | 2011 | 30.90% | Arrondel et al. (2013) |
| USA | 64.90% | 64.30% | 51.80% | 1488 | 2009 | 30.20% | Lusardi and Mitchell (2011) |
| Japan | 70.50% | 58.80% | 39.50% | 5268 | 2010 | 27.00% | Sekita (2011) |
| Italy | 40% | 59.30% | 52.20% | 3992 | 2007 | 24.90% | Fornero and Monticone (2011) |
| New Zealand | 86% | 81% | 49% | 850 | 2009 | 24.00% | Crossan (2011) |
| Sweden | 35.20% | 59.50% | 68.40% | 1302 | 2010 | 21.40% | Almenberg and Säve-Söderbergh (2011) |
| Romania | 41.30% | 31.80% | 14.70% | 1030 | 2011 | 3.80% | Beckmann (2013) |
| Russian Federation | 36.30% | 50.80% | 12.80% | 1366 | 2009 | 3.70% | Klapper and Panos (2011) |
| Chile | 47.40% | 17.70% | 40.60% | 14463 | 2009 | 7.70% | Moure (2015) |
Source: Own research and Lusardi and Mitchell (2014).
Table 3.
Results of the multinomial logistic regression.
| Reference Variable | Variables | (1) Overindebt | (2) Possibly Overindebt (COVID-19) | (3) Overindebt | (4) Possibly Overindebt (COVID-19) | (5) Overindebt | (6) Possibly Overindebt (COVID-19) |
|---|---|---|---|---|---|---|---|
| Gender Female | male | −0.3909 (0.076) | −0.3842 * (0.023) | −0.3708 (0.092) | −0.4421 ** (0.009) | −0.4495 * (0.040) | −0.4431 ** (0.008) |
| Degree Elementary | Middle-high | −0.1346 (0.661) | 0.2720 (0.362) | −0.1851 (0.541) | 0.1838 (0.535) | −0.2472 (0.413) | 0.1795 (0.544) |
| High | −0.7691 * (0.026) | −0.0646 (0.836) | −0.8128 * (0.017) | −0.1996 (0.518) | −0.9286 ** (0.006) | −0.2124 (0.489) | |
| Income < 1000 | Income 1000–1500 | −0.5350 (0.170) | −0.4667 (0.196) | −0.5272 (0.179) | −0.4906 (0.173) | −0.5326 (0.171) | −0.5222 (0.149) |
| Income 1500–2500 | −1.2620 *** (0.001) | −0.5208 (0.116) | −1.2346 *** (0.001) | −0.5549 * (0.094) | −1.2688 *** (0.001) | −0.5781 (0.082) | |
| Income 2500–3500 | −1.1031 ** (0.005) | −0.8511 * (0.015) | −1.0813 ** (0.006) | −0.8840 * (0.011) | −1.1077 ** (0.005) | −0.9087 ** (0.010) | |
| Income > 3500 | −1.0400 ** (0.010) | −0.6942 * (0.050) | −1.0335 * (0.011) | −0.7170 * (0.043) | −1.0164 * (0.012) | −0.7604 * (0.033) | |
| Age 18–24 | Age 25–34 | 0.6331 (0.110) | 1.1331 *** (0.000) | 0.5746 (0.149) | 1.1574 *** (0.000) | 0.6665 (0.092) | 1.1604 *** (0.000) |
| Age 35–44 | 0.5656 (0.170) | 1.1032 *** (0.001) | 0.6208 (0.132) | 1.1485 *** (0.000) | 0.6393 (0.121) | 1.1577 *** (0.000) | |
| Age 45–54 | 0.8921 * (0.035) | 0.8727 * (0.012) | 1.0338 * (0.015) | 0.8936 ** (0.010) | 0.9404 * (0.026) | 0.9099 ** (0.009) | |
| Age 55–64 | 1.0613 ** (0.010) | 0.3227 (0.392) | 1.2561 ** (0.002) | 0.3303 (0.382) | 1.0901 ** (0.008) | 0.3584 (0.341) | |
| Age > 64 | 0.2819 (0.572) | −0.0106 (0.982) | 0.5257 (0.293) | 0.0531 (0.907) | 0.3643 (0.464) | 0.0731 (0.872) | |
| Consumer loan experience | 1.5098 *** (0.000) | 1.0748 *** (0.000) | 1.4974 *** (0.000) | 1.0580 *** (0.000) | 1.4987 *** (0.000) | 1.0504 *** (0.000) | |
| Mortgage loan experience | −0.3127 (0.312) | 0.6839 *** (0.000) | −0.3797 (0.223) | 0.6449 *** (0.000) | −0.3435 (0.266) | 0.6275 *** (0.000) | |
| Living standards | −0.0002 * (0.011) | 0.0001 ** (0.004) | −0.0001 * (0.029) | 0.0001 ** (0.005) | −0.0002 * (0.011) | 0.0001 ** (0.005) | |
| Debt Literacy | −1.1772 ** (0.008) | −0.8196 * (0.014) | |||||
| Financial literacy | −1.0937 *** (0.000) | 0.0434 (0.859) | |||||
| Self-assessment | −0.0586 (0.412) | 0.0616 (0.285) | |||||
| constans | −1.3494 * (0.011) | −2.7423 *** (0.000) | −1.1491 * (0.033) | −2.8743 *** (0.000) | −1.3634 * (0.015) | −3.0644 *** (0.000) | |
| Observations | 1300 | 1300 | 1300 | 1300 | 1300 | 1300 | |
| Pseudo R2 | 0.0996 | 0.1003 | 0.0949 | ||||
Note: The table presents three multinomial logistic regression models depending on the literacy variable (debt—column 1 and 2, financial—column 3 and 4, and self-assessment—column 5 and 6) with p-value in the brackets. The dependent variable may take the values 1 (overindebted respondent), 2 (possibly overindebted respondent during the COVID-19 pandemic), or 3 (omitted class that describes respondents who are not at risk of overindebtedness or have no debt). *, **, and *** denote a statistical significance at p < 0.05, p < 0.01, and p < 0.001, respectively.
Publisher’s Note: MDPI stays neutral with regard to jurisdictional claims in published maps and institutional affiliations. |
© 2021 by the author. Licensee MDPI, Basel, Switzerland. This article is an open access article distributed under the terms and conditions of the Creative Commons Attribution (CC BY) license (https://creativecommons.org/licenses/by/4.0/).
Share and Cite
MDPI and ACS Style
Kurowski, Ł. Household’s Overindebtedness during the COVID-19 Crisis: The Role of Debt and Financial Literacy. Risks 2021, 9, 62. https://0-doi-org.brum.beds.ac.uk/10.3390/risks9040062
AMA Style
Kurowski Ł. Household’s Overindebtedness during the COVID-19 Crisis: The Role of Debt and Financial Literacy. Risks. 2021; 9(4):62. https://0-doi-org.brum.beds.ac.uk/10.3390/risks9040062
Chicago/Turabian StyleKurowski, Łukasz. 2021. "Household’s Overindebtedness during the COVID-19 Crisis: The Role of Debt and Financial Literacy" Risks 9, no. 4: 62. https://0-doi-org.brum.beds.ac.uk/10.3390/risks9040062
Note that from the first issue of 2016, this journal uses article numbers instead of page numbers. See further details here.