
Revisiting Investability of Heritage Properties through Indexation and Portfolio Frontier Analysis
by
 , , , and
Chin Tiong Cheng
1,* ,
,
Gabriel Hoh Teck Ling
2 ,
,
Yee-Siang Gan
3,
Wai Fang Wong
1 and
Kong Seng Lai
1 1
Centre for Construction Research, Tunku Abdul Rahman University College, Setapak, Kuala Lumpur 53300, Malaysia
2
Faculty of Built Environment and Surveying, Universiti Teknologi Malaysia, Skudai 81310, Malaysia
3
School of Architecture, Feng Chia University, Taichung 40724, Taiwan
*
Author to whom correspondence should be addressed.
Risks 2021, 9(5), 91; https://0-doi-org.brum.beds.ac.uk/10.3390/risks9050091
Submission received: 10 April 2021
/
Revised: 3 May 2021
/
Accepted: 4 May 2021
/
Published: 10 May 2021
(This article belongs to the Special Issue Portfolio Optimization, Risk and Factor Analysis)
Abstract
:In recent years, the soaring prices of heritage properties in Georgetown, Penang have gained the attention of practitioners and investors. The practitioners claim that the prices of heritage properties within the core and buffer zones in Georgetown have increased more than 300% since the city was recognized as a UNESCO World Heritage site in 2008. Such heritage properties containing historical or art elements that lead to forming a diversified portfolio could exert a low correlation of returns with conventional assets. In addition, rehabilitation of heritage properties requires high restoration costs and conversion fees. Despite the above claims, there is an absence of empirical studies relating to heritage investability, particularly to prove whether the heritage properties are truly worth investing in. Thus, this study incorporates a self-developed heritage properties Index (PIHPI_HR) into the conventional investment portfolio for assessing diversification effects. This study has collected 853 units of transacted properties for constructing a 10-year price index (PIHPI_HR). Subsequently, its diversification effect was examined through the Efficient Frontier (EF), derived from the Modern Portfolio Theory (MPT). The findings have proven the optimization of the conventional portfolio by enabling investments in heritage properties where the return is higher than other investment assets at the same risk level. This study also unveiled the price movement of heritage properties together with their investment value, which is deemed to be useful for institutional investors and the public to formulate sustainable investment strategies in the future.
1. Introduction
Buildings and land are factors of production and they are important elements of urbanization especially for the city center. They are also known as a scarce resource that creates benefit for the society and economy. The physical value of real estate has offered investment opportunities to the public and institutions. In addition, real property is also perceived as a conservative investment asset because it is not easily prone to the short-term fluctuation of economic conditions. Past studies have found that property investing could diversify the risk of the investment portfolio for both institutional and private investors (Goetzmann 1993; Keng and Hwa 2004; Ting et al. 2007).
In recent years, the soaring prices of heritage properties in Georgetown, Penang have gained the attention of practitioners and investors. One of the practitioners mentioned that the prices of heritage properties within the core and buffer zones in Georgetown had increased more than 300% since this city had been recognized as a UNESCO World Heritage site in 2008 (Lum 2018). Mat Zin et al. (2018) also agreed with the statement made by the practitioners stating that the price of heritage property has escalated since 2011 after the recognition of the heritage site of Georgetown in 2008. The growth could be highly contributed to by the tangible and intangible value of heritage property. In terms of tangible value, Zin et al. (2019) claimed that the types of transaction, structural characteristics, and spatial and historical elements are correlated with the price of heritage property. The intangible value of National Heritage Property covers historical elements, aesthetic characteristics, scientific achievements, and social or cultural associations (Harun 2011). These are the key elements that attract local or international tourists to visiting the heritage area and subsequently lead to higher rent and property prices (Wills and Eves 2005). Besides, the limited supply has caused the price of heritage properties to rise faster than unprotected or undefined buildings (Gilderbloom et al. 2009). According to the latest transactions of pre-war shophouses, the average price per unit is approximately RM 2,000,000 and this has made up the market capitalization of pre-war shophouses in Georgetown at RM 7.14b in 2019. The average price for a heritage property is also higher than commercial (RM 877,023) and residential (RM 390,025) properties in Pulau Pinang (Property Market Report 2009–2019).
Nevertheless, the estimated price change of heritage properties is questionable since there is no existing price index to calculate the risk and return of Penang Heritage Properties. The price change based on mean or median price per square feet is not accurate as it might be influenced by the quality change of the transacted properties in every period. This is because microeconomic factors such as size, age, type of building, and location are not able to explain the price change of property in a time series. For example, the transacted properties for the current quarter that have a bigger land size might contribute to the increment of the price index since the purchasers are willing to pay more to obtain it. This could mislead the public as the price change does not reflect the supply and demand forces over time. Therefore, the attributes that influence the heritage properties must be pre-determined before constructing the price index.
However, the high restoration cost and conversion fees are part of the reasons that could hinder the investor from purchasing heritage properties or heritage properties. Generally, the practitioner claimed that for a standard heritage property, the total cost of restoring the roof and floor tiles is approximately RM 150,000 and the conversion fee is about RM 19,000 (Tan 2019). This cost is not required if the investors purchased a standard shop in Malaysia. The additional capital expenditure of conserving the heritage property will reduce the profitability and increase the payback period for investors. The investment sentiment becomes worst if the historical price movement is absent for institutional investors and the public. The calculation of expected risk and return appears to be challenging without the presence of a price index. Moreover, both risk and return are important elements to be incorporated into an investment portfolio for comparative studies. As pointed out by Adair et al. (2003), investors will consider the transparency of the market before investing.
Hence, this study aims to unveil the investment value of heritage properties from two aspects. First, developing a price indicator or Pulau Pinang (Island) Heritage Property Price Index (PIHPI_HR) to represent the performance of the heritage properties market, subsequently, the historical data can be used for predicting the future price trend of the property or incorporated into any economic models. Second, this study also employed comprehensive techniques to ascertain the role of heritage properties in diversifying the portfolio. Ultimately, the findings of this study can be a reference for investors to prepare themselves for investing in heritage properties after understanding the risk and return from these aspects.
2. Literature Review
Georgetown in Penang is one of the heritage cities recognized by UNESCO World Heritage in 2008. The heritage area is conserved by the local government through the implementation of the core zone and buffer zone. The landlords that own the heritage properties within these zones must comply with the rule set by the local authority (Heritage Department of Penang Island City Council) if they intend to restore the condition of the buildings. Jasme et al. (2014) claimed that the preservation of heritage properties has been extended to the forecourt, roof, external and internal parts of the building. According to the Heritage Management Plan (State Government of Penang 2008), there are only 4649 units of heritage buildings in the core zone and buffer zone with a size of 109.38 hectares and 150.04 hectares respectively in Georgetown, Penang. Meanwhile, it comprises 3572 units of heritage buildings under category II (pre-war shophouse). Based on the current scenario, most of the heritage properties are restored by the landlords for commercial purposes. Some of the landlords of the heritage properties have transformed the old buildings for more valuable usage such as cafés, boutique hotels, restaurants, and others (Lum 2018). This approach is effective in terms of attracting national and international tourists to visit the heritage zones.
The conservation of heritage properties has been discussed widely in previous studies (Billington 2004; Samadi and Yunus 2012; Tokede et al. 2018). Investors who are interested in heritage properties should be aware of the high maintenance and restoration costs due to conserving the aesthetic value of heritage buildings (Lim et al. 2014). In addition, Shamsuddin and Sulaiman (2002) highlighted five (5) types of threats to the survival of historic cities such as disruption of the urban pattern, disappearing townscape, changing activity pattern, visual monotony, and obsolescence and gentrification. For example, large-scale commercial development, including office towers or shopping complexes, may remove the core value of a historic city. The conservation of heritage properties is necessary because those buildings can produce aesthetic and spiritual value that cannot be found in any conventional properties such as terrace houses, apartments, etc. (Licciardi and Amirtahmasebi 2012). Thus, conservation work is important for preserving the value of heritage properties.
Furthermore, Shipley (2000) claimed that the sales rates of heritage properties are better than ambient market trends and the values of heritage properties tend to be more resistant during downturns as compared to the general market. This result is also supported by another study (Mat Zin et al. 2018) in which there was evidence of an increasing trend in the price per square foot of the heritage shophouses in the long run. Elton and Gruber (1997) point out that the Markowitz Modern Portfolio Theory has considered the trade-off between mean and variance of assets. The theory aims to maximize the expected return and minimize the variance of the portfolio through the formulation of an efficient frontier. Most of the previous studies have constructed investment portfolios with traditional assets such as shares, real estate security, bonds, cash, commodities, conventional real estate. (Ghazali et al. 2015; Hiang and Adair 2009; Jin et al. 2007; Lee 2007). Delfim and Hoesli (2019) have found that medium- to long-term investors should allocate 10% to 20% of their portfolio to direct real estate due to the steady growth rate. Pagliari (2017) also suggests the optimal real estate allocations to be approximately 10–15% of the mixed-asset portfolio. Risk-averse investors are recommended to invest in private or direct real estate. In contrast to high risk-tolerance investors, public real estate or Real Estate Investment Trusts (REITs) are preferred. In addition, REITs are widely adopted to diversify the risk in a mixed investment portfolio. According to Cho (2017), J-REITs are not correlated with Japanese bonds, the Japan Unlisted Property Fund, and cash. Lee (2007) conducted a study on the performance of Malaysia REITs (M-REITs). The result shows that M-REITs are able to provide more risk reduction in the investment portfolio as compared to listed property companies and the return of the M-REIT portfolio is higher than Malaysian stocks.
Some studies have combined both financial instruments and artworks in creating a diversified portfolio due to the fact that artwork (painting market) exerts a low correlation of returns with financial assets-stocks, corporate bonds, treasury bills, and government bonds. (Wang and Zheng 2017; Campbell 2009; Worthington and Higgs 2004). The heritage properties are expected to share the same characteristics as artwork, where it consists of historical, aesthetic, and scientific heritage value (de la Torre 2013). Therefore, the correlation between Malaysian heritage and conventional properties in terms of return is expected to be low and it would provide diversification effects to a conventional portfolio.
3. Research Methodology
This study collected 1737 units of transacted heritage properties of Georgetown, Penang starting from 2009 until 2019 (10 years) for constructing a Pulau Pinang (Island) Heritage Property Price Index (PIHPI_HR). In addition, it required three steps in processing the data before it could be used for constructing the price index. Firstly, it is necessary to exclude every transaction that involves family members or non-arm’s-length transactions from the price index basket. This type of transacted price is usually below the market value. Therefore, it might understate or overstate the price change between two periods. This is to make sure the changes of the PIHPI_HR are fully reflected by the supply and demand forces without interruption of related party transactions. Secondly, this study eliminated the data containing missing information such as property address, transacted price, land area, tenure (leasehold/freehold), transacted period, and share unit (joint ownership). It is crucial to ascertain the validity of the information before it is utilized in forming the dependent and independent variables in a price index model. Lastly, this study filtered out all heritage properties with freehold status because the transaction volume of leasehold properties is very low and insignificant. After removing data based on the above criteria, the final sample for the 10-year study period contained 853 units of transacted heritage properties.
The Hedonic Regression Method (HRM) was adopted for developing a price index model of heritage properties as it is useful to overcome the quality change of the properties across different periods. Moreover, this technique is commonly used for determining the contribution of property characteristics toward the house price (Palmquist and Smith 2002). The approach can be further extended to Hedonic Time-Dummy Regression Method (HTDRM) and forming the Hedonic Price Index Model (de Haan and Diewert 2011). The negative or positive value of each time dummy parameter in the model indicates the longitudinal effect and the coefficient can be exponentiated to obtain the price index. It gives the quality-adjusted price change between the base period 0 and each comparison period t. The HTDRM also integrates with the coordinates of the property (latitude and longitude) in order to capture the variability of the property price due to the location (Clapp 2004). There are a few studies that indicate the significant relationship between spatial heterogeneity and property price (Nappi-Choulet and Maury 2009; Helbich et al. 2013; Sipan et al. 2018). Therefore, the incorporation of geocoded locations in the price index model could resolve the issue of geographical differences in property price movement at the local level.
Referring to the studies on the hedonic price model (Diewert et al. 2016; Karaganis 2011; Hill et al. 2020; Wilhelmsson 2009), physical attributes, locational attributes, and legal attributes are three major determinants of property prices. The physical attributes cover land area and the building condition. The land area of a heritage property has a direct relationship with the lettable area and revenue of the business space. Therefore, business owners are willing to increase their investment capital in order to occupy the heritage properties with larger spaces. Besides, Licciardi and Amirtahmasebi (2012) claimed that the building condition is one of the key elements in supporting the economic value of heritage property. A well-maintained heritage property such as an office, retail space, boutique hotel, café, etc. would create use value and cultural value for the occupants and tourists, respectively. Moreover, the heritage property price could also be influenced by the legal attributes in terms of the joint ownership and the conversion of land use. In Malaysia, fractional ownership is transactable and the transacted value is based on the shared unit. Hence, the omission of this variable might understate or overstate the price change between two periods. Furthermore, the residential type of heritage properties in Georgetown can be converted into commercial use to obtain higher return on investment (Barron 2017). For example, this allows the property owner to operate businesses and generate more income in the heritage property as compared to residential use, which is solely for accommodation purposes only. After considering the importance of the above variables, the final hedonic price index model of this study is illustrated as follows:
The dependent variable of this model is represented by the transacted price in the logarithm form (lnTP) followed by independent variables such as the time parameter (YEAR), land area in logarithm form (lnLAND), and the polynomial expansion of locational variables (lat = latitude and lon = longitude). The hedonic model also considers the condition (good = GOOD and average = AVG) of the heritage building and the converted unit from residential to commercial use (shophouse = SHOP). The above model is required to construct indices for respective periods.
Thus, this study needs 10 models for developing a 10-year index (2009–2019). The details of data quantification are recorded in Table 1. In order to obtain an optimal hedonic price index model, seven (7) types of regression methods were tested in this study namely ‘Linear Regression’, ‘Ridge’, ‘Lasso’, ‘Multilasso’, ‘ElasticNet’, ‘MultiTaskElasticNet’, and ‘LeastAngle’. The cross validation approach was employed in this study where 20% raw data (10 folds) were segregated from the sample for model testing. The model accuracy is based on the difference between actual and predicted value per unit or the Mean Square Error (MSE). The price index model that gives the lowest MSE was then selected for developing the heritage properties price index or PIHPI_HR. The description of each regression method is explained in the following Table 2.
Additionally, the quality of investment assets can be compared through the Sharpe Ratio (Best et al. 2007), a high value of the Sharpe Ratio indicates better asset quality. Subsequently, the Sharpe Ratio of the self-developed price index or Pulau Pinang (Island) Heritage Property Price Index (PIHPI_HR) is compared with the selected traditional assets available in Malaysia. For example, REITs, Stocks (Kuala Lumpur Composite Index), Pulau Pinang (Island) Terrace House Price Index (PIHPI_TH), Pulau Pinang Price Index (PPHPI), and Malaysian House Price Index (MHPI). The bond yield of the three-year Malaysian Government Securities (MGS) is identified as a risk-free asset in the performance analysis. The formula for the Sharpe Ratio is shown as follows:
However, relying solely on Sharpe Ratio may not be able to fully reflect the performance of heritage properties. This is because according to the Modern Portfolio Theory (MPT), the systematic risk of the portfolio can be diversified by including less correlated assets in the investment basket. Therefore, this study constructed two types of investment portfolios namely the conventional portfolio (without heritage properties) and the diversified portfolio (with heritage properties). The diversification effect of heritage properties was observed if the diversified portfolio offered higher returns at the same risk level as the conventional portfolio. This can be realized through the development of the Efficient Frontier (EF).
The expected return and risk of a portfolio is the composition of the Efficient Frontier (EF). The expected return of the portfolio is determined by its past historical return. This study has considered the average return of asset j for 10 years (2009–2019). In addition, the risk of a portfolio can be determined through the volatility of its past historical return. The formula of expected return and variance of a portfolio are listed below:
The portfolio variance is a measurement of risk, it reflects the volatility of a set of securities over time. It can be formulized as WTvW, where W is a column vector containing the weights of different assets in the portfolio. V is the covariance matrix, and WT is the transpose of the matrix W.
W1 to Wn are the weights of assets 1 to n in the portfolio, and is the covariance between assets x and y. Note that 2 means the covariance itself. The covariance matrix is required to calculate portfolio variance. By knowing that ρ is the correlation between two assets, the correlation matrix is multiplied by the diagonal matrix of standard deviations, it can be transformed into a covariance matrix. Subsequently, the portfolio variance is obtained by multiplying the covariance matrix by the weights of selected assets.
The expected return for a portfolio is the weighted average of the expected returns from the respective investment assets.
represents the expected return of the portfolio, m is the number of assets and is the weightage of the asset in the portfolio, is the expected return of the asset.
By understanding the formula for constructing the expected return and risk of a portfolio, it can be extended to the Efficient Frontier. Generally, the Efficient Frontier is the portfolio that offers the highest expected return for a defined level of risk or vice versa. In other words, the assets or portfolios that lie below the Efficient Frontier are sub-optimal because the return is insufficient for the level of risk. According to Equations (2)–(4), the expected return and variance of a portfolio are highly affected by the assets’ weightage and their correlation. Therefore, in order to develop an Efficient Frontier for both the conventional and diversified portfolios, this study has adopted ‘solver’ which is a Microsoft Excel add-in program used to simulate the risk and return under different assets’ weightage. It can be utilized to determine the maximum and minimum value of one cell by changing other cells.
4. Results and Discussions
The hedonic price index model for PIHPI_HR is evaluated based on several statistical analyses that cover adjusted R-square, t-statistic, and cross validation. The purpose of multiple validation tests is to avoid model misspecification or the development of a misleading index for heritage properties within the study period. As shown in Table 3, the adjusted R-square values for the 10 price index models range from 0.61–0.76. In other words, 61–76% of the price variability of the heritage properties can be explained by using these models. In addition, most of the independent variables tested in this model are significant with p-values lesser than 0.10 except the variable ‘AVG’. This indicates that there is no significant difference between the poor condition and average condition of heritage properties in terms of price. Particularly, the time parameters show a 1% significance level across the 10 models. Hence, the result agrees with the practitioner that the price change of heritage properties is significantly driven by time.
Apart from that, the land size shows a positive coefficient because investors or buyers are willing to pay a higher price to occupy a larger space in accordance with the theory of economic utility. The geocoded variables (latitude and longitude) are significant, which agrees with the past studies (Clapp 2004; Nappi-Choulet and Maury 2009; Helbich et al. 2013; Sipan et al. 2018). Therefore, the existence of price variability of heritage properties at the local level is proved to be significant in this study. According to Table 3, the building condition is one of the key elements in sustaining the price of heritage property. As mentioned by Licciardi and Amirtahmasebi (2012), a well-maintained heritage property would create economic and cultural values for occupants and tourists. There is a positive effect after converting the heritage property from residential to commercial use. The commercial type of heritage property will generate more revenue as it can be ventured into hotels, cafés, and retail businesses. The fractional ownership in the transaction must be considered as the property value is calculated by the share unit. In conclusion, the heritage properties experienced a drastic price change during the study period and the supply and demand force is one of the reasons that contribute to such phenomenon.
Furthermore, the hedonic price index model is optimized by several regression methods as mentioned in the previous section. By referring to Table 4, it indicates that the Ridge model offers low and consistent MSE in both cross-validation and true sample approach. Thus, the ridge regression model favors the development of PIHPI_HR. However, there is no significant difference in terms of the trend for the indices based on the algorithm of linear regression and Ridge model.
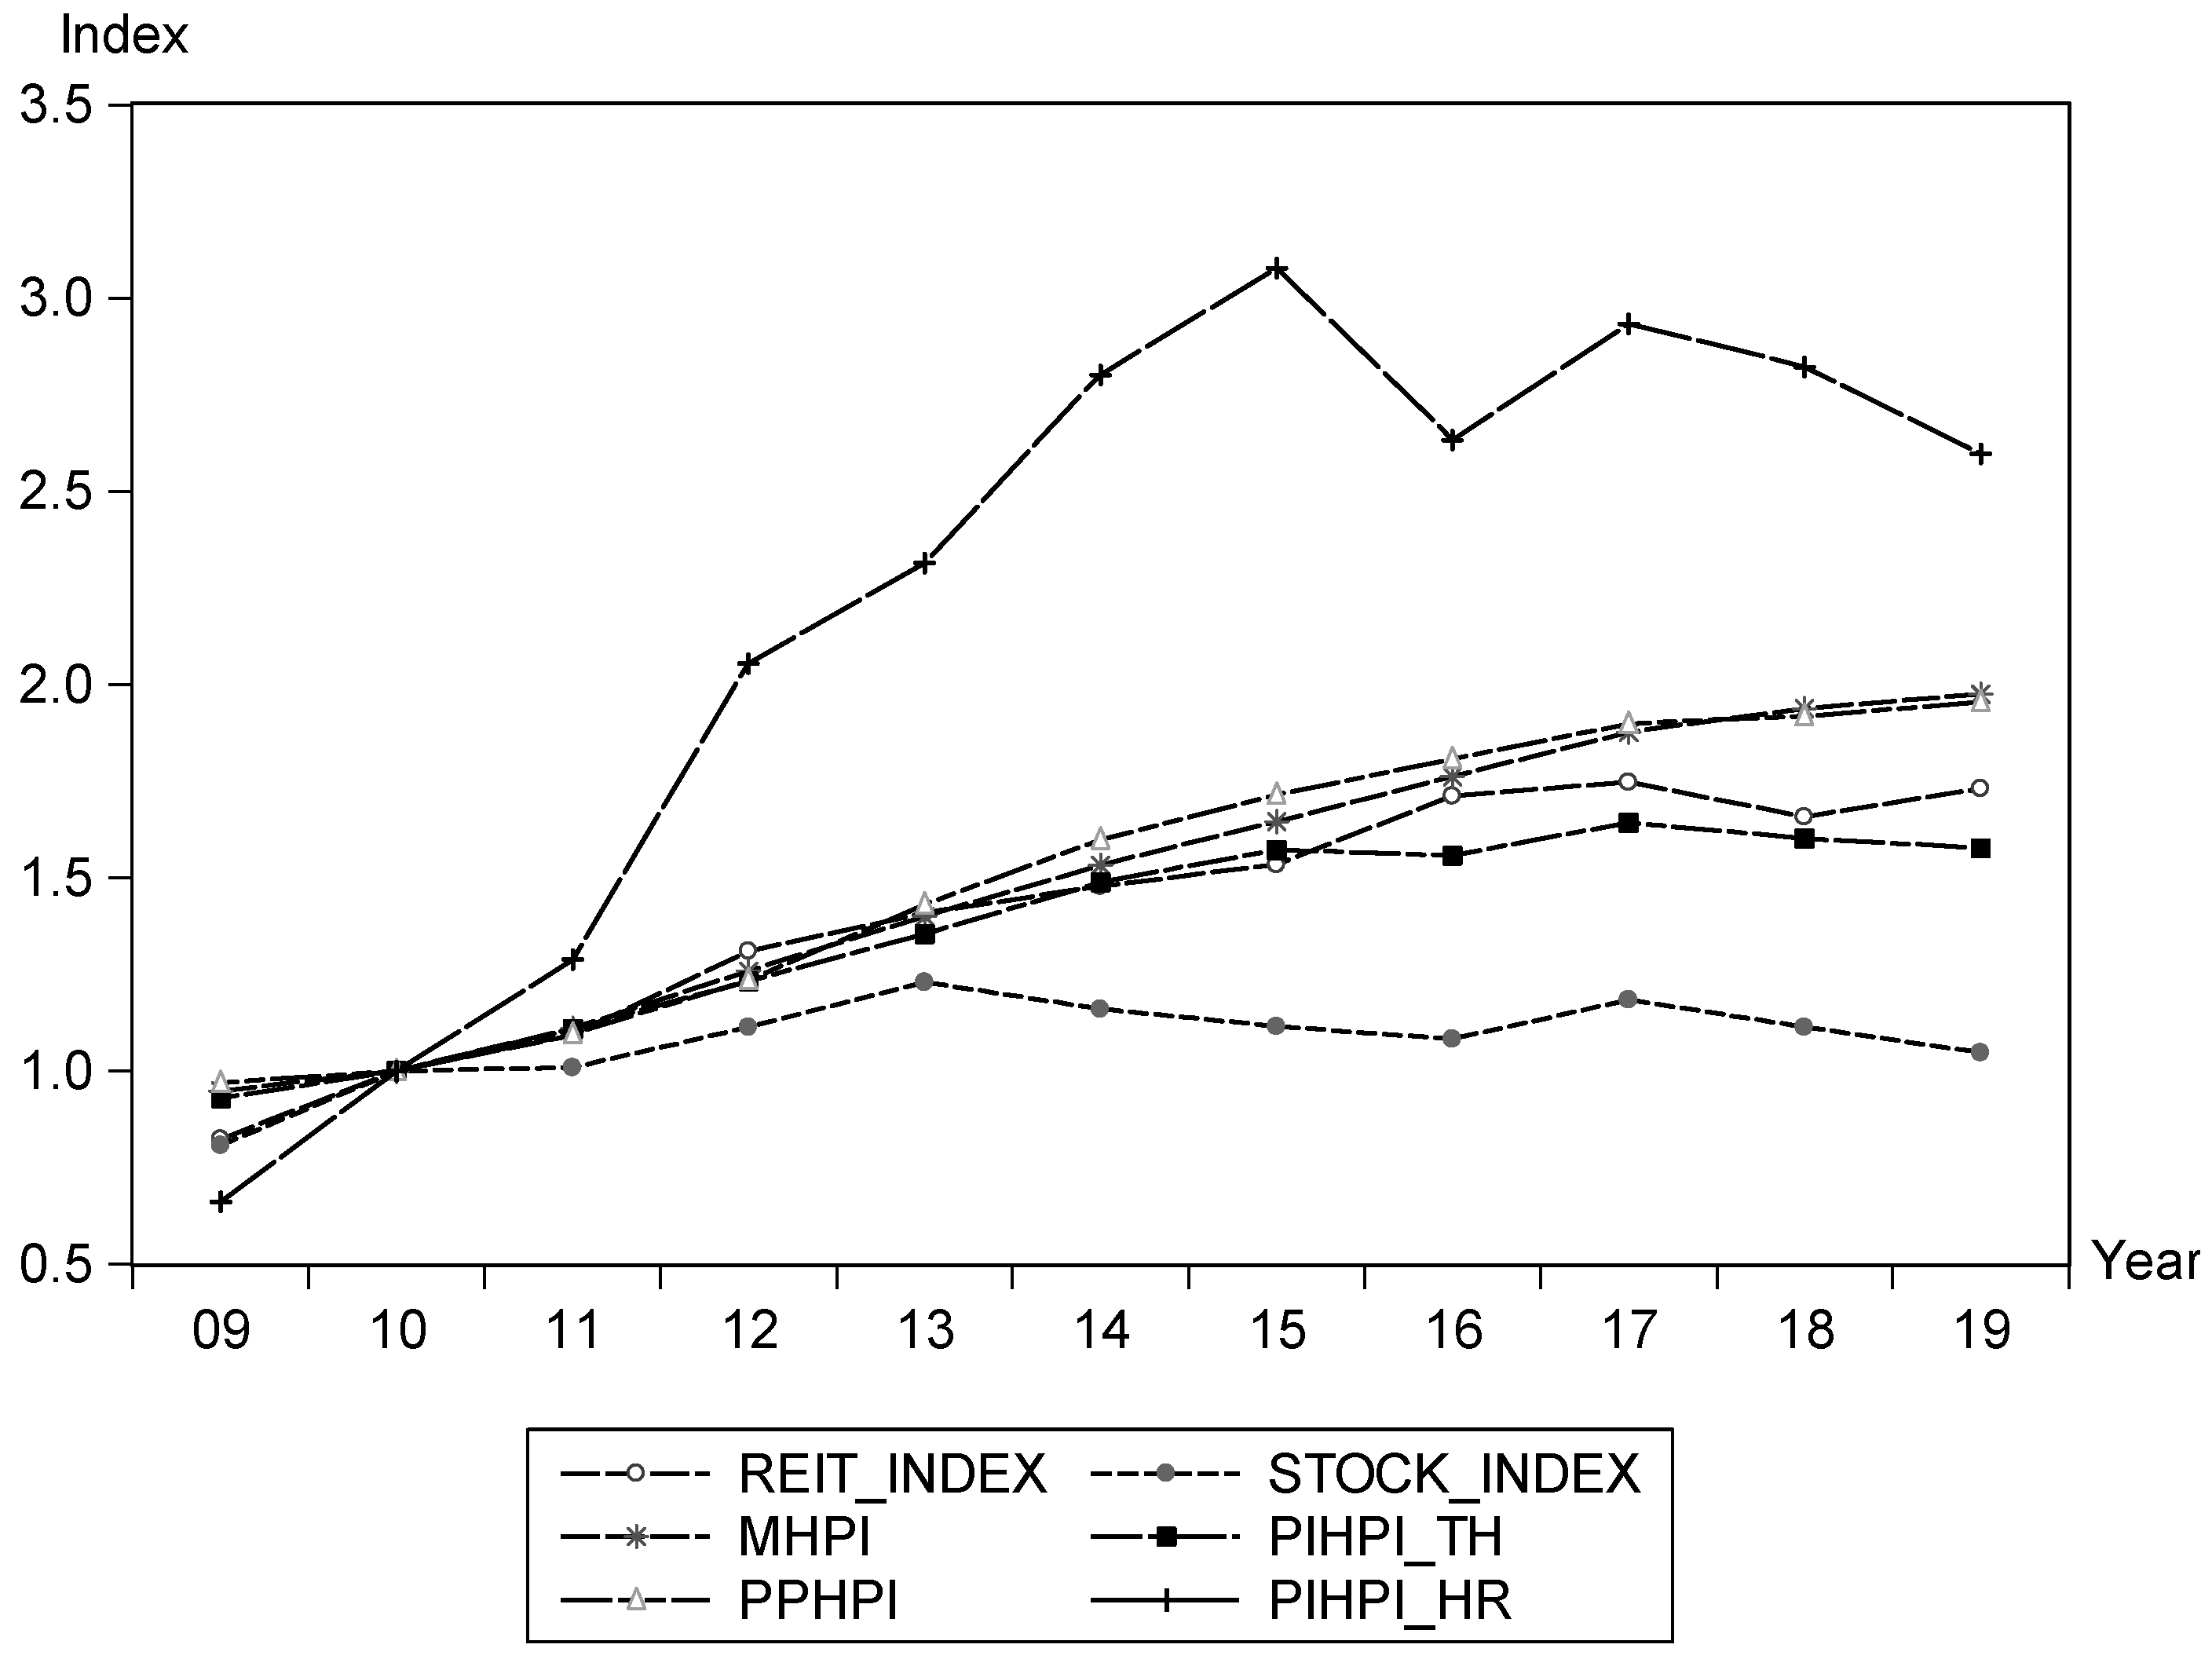
According to Figure 1, the investment return of PIHPI_HR is dominating other conventional assets in the study. Moreover, both securities base assets such as REIT_INDEX and STOCK_INDEX show moderate growth in comparison to PIHPI_HR. The volatility of PIHPI_HR has a strong correlation with PIHPI_TH, it may be due to the similar socioeconomic structure and geographical boundary of both properties in Penang Island. The correlation analysis also proves that the price trend of heritage properties is slightly different from the Malaysian House Price Index (MHPI) and Penang House Price Index (PPHPI). The price movement for both properties is moderately correlated (as shown in Table 5). Thus, it is recommended to include PIHPI_HR in optimizing the investment portfolio.
Table 6 depicts the quality of investment assets for the study period 2009–2019, Malaysia Housing Market (MHPI) outperforms all asset classes in this study that records a Sharpe ratio of 1.19. It means the investor of residential property will enjoy the most efficient risk and return trade-off. Hence, investing in residential property is recommended with the support of the previous studies (Pagliari 2017; Delfim and Hoesli 2019). The contributory factors to steady growth in Malaysian housing market could be due to the improvement in Gross Domestic Product (GDP), exchange rate, and monetary liquidity or mortgage lending (Kok et al. 2018).
Both PPHPI and PIHPI_TH are state-based indices and they are more volatile than the national indices (MHPI). In other words, it is crucial to diversify the risk of property investment across states and property types. Heritage properties are transactable in Malaysia, thus they offer the opportunity for investment and capital appreciation. As highlighted by previous studies (Harun 2011), heritage properties are embedded with aesthetic value. Substantially, it is reflected in the prices of heritage properties after Pulau Pinang was recognized by UNESCO as the world heritage site. Furthermore, the limited number of heritage properties in Malaysia might be contributing to the escalation of the price which is consistent with the study done by Gilderbloom et al. (2009). As shown in Table 6, PIHPI_HR dominates another investment asset at the geometric return of 14.66%. Although the return of investing in PIHPI_HR is higher than other assets, it is not guaranteed to be the prime asset in Malaysia due to its high volatility for the past 10 years. Therefore, for the risk-averse investor, investment solely in heritage properties is not realistic.
The stock market or KLCI experienced slow growth over the past 10 years, as a result, it lead to a negative Sharpe ratio at 0.07. The stock performance in Malaysia is easily affected by market sentiment in terms of the economic outlook, political situation, and foreign direct investment. In contrast to REIT_INDEX, it has achieved a higher geometric return than KLCI despite high volatility. Although the geometric return of REIT_INDEX is slightly higher than MHPI, it might not be a good option to switch the investment due to the sharp increase in standard deviation. Therefore, in the Malaysian context, this result contradicts Pagliari (2017) who states that REITs are beneficial to risk-averse-investor.
In order to examine the diversification effects of heritage properties (PIHPI_HR), two portfolios were developed for comparative study namely the conventional portfolio (PORTFOLIO_CV) and diversified portfolio (PORTFOLIO_HR). The conventional portfolio consists of MREITs (REIT_INDEX), Malaysian House Price index (MHPI), and three-year Malaysian Government Securities (Bond). STOCK_INDEX, which originated from Kuala Lumpur Composite Index (KLCI), is excluded from developing the portfolio because it has underperformed over the past 10 years (as shown in Table 6). Other than this, the conventional portfolio also has excluded PPHPI and PIHPI_TH because they are highly correlated with the Malaysian House Price Index (MHPI), which might not give a significant impact in diversifying the investment portfolio. Therefore, due to the higher Sharpe Ratio achieved by MHPI, it is reasonable to select MHPI for representing physical asset investment in the conventional portfolio. Subsequently, it has been extended to the diversified portfolio by including heritage properties (PIHPI_HR).
Figure 2a,b shows the asset allocation for the conventional and diversified portfolio. The expected returns for REIT_INDEX and MHPI are 7.71% and 7.62%, respectively. In contrast to Bond where it only contributes 3.29% of the expected return to the portfolio. However, the growth of the expected return in the conventional portfolio is restricted by REIT_INDEX and MHPI. In other words, investing in riskier assets through a conventional portfolio is not efficiently compensated with a higher return, this might be due to similar returns for both assets but under different risk profiles. Therefore, a combination of Bond and MHPI is possible to gain optimal return in accordance with efficient risk and return trade-off.
For the inclusion of heritage properties into the conventional portfolio forming the diversified portfolio, although PIHPI_HR offers a higher expected return, high volatility of price movement is a shortcoming of the asset. Therefore, it is advisable to combine it with less risky assets for efficient risk and return trade-off. Investors with higher risk tolerance can possibly look for the upside by increasing the weightage of heritage properties in their portfolios.
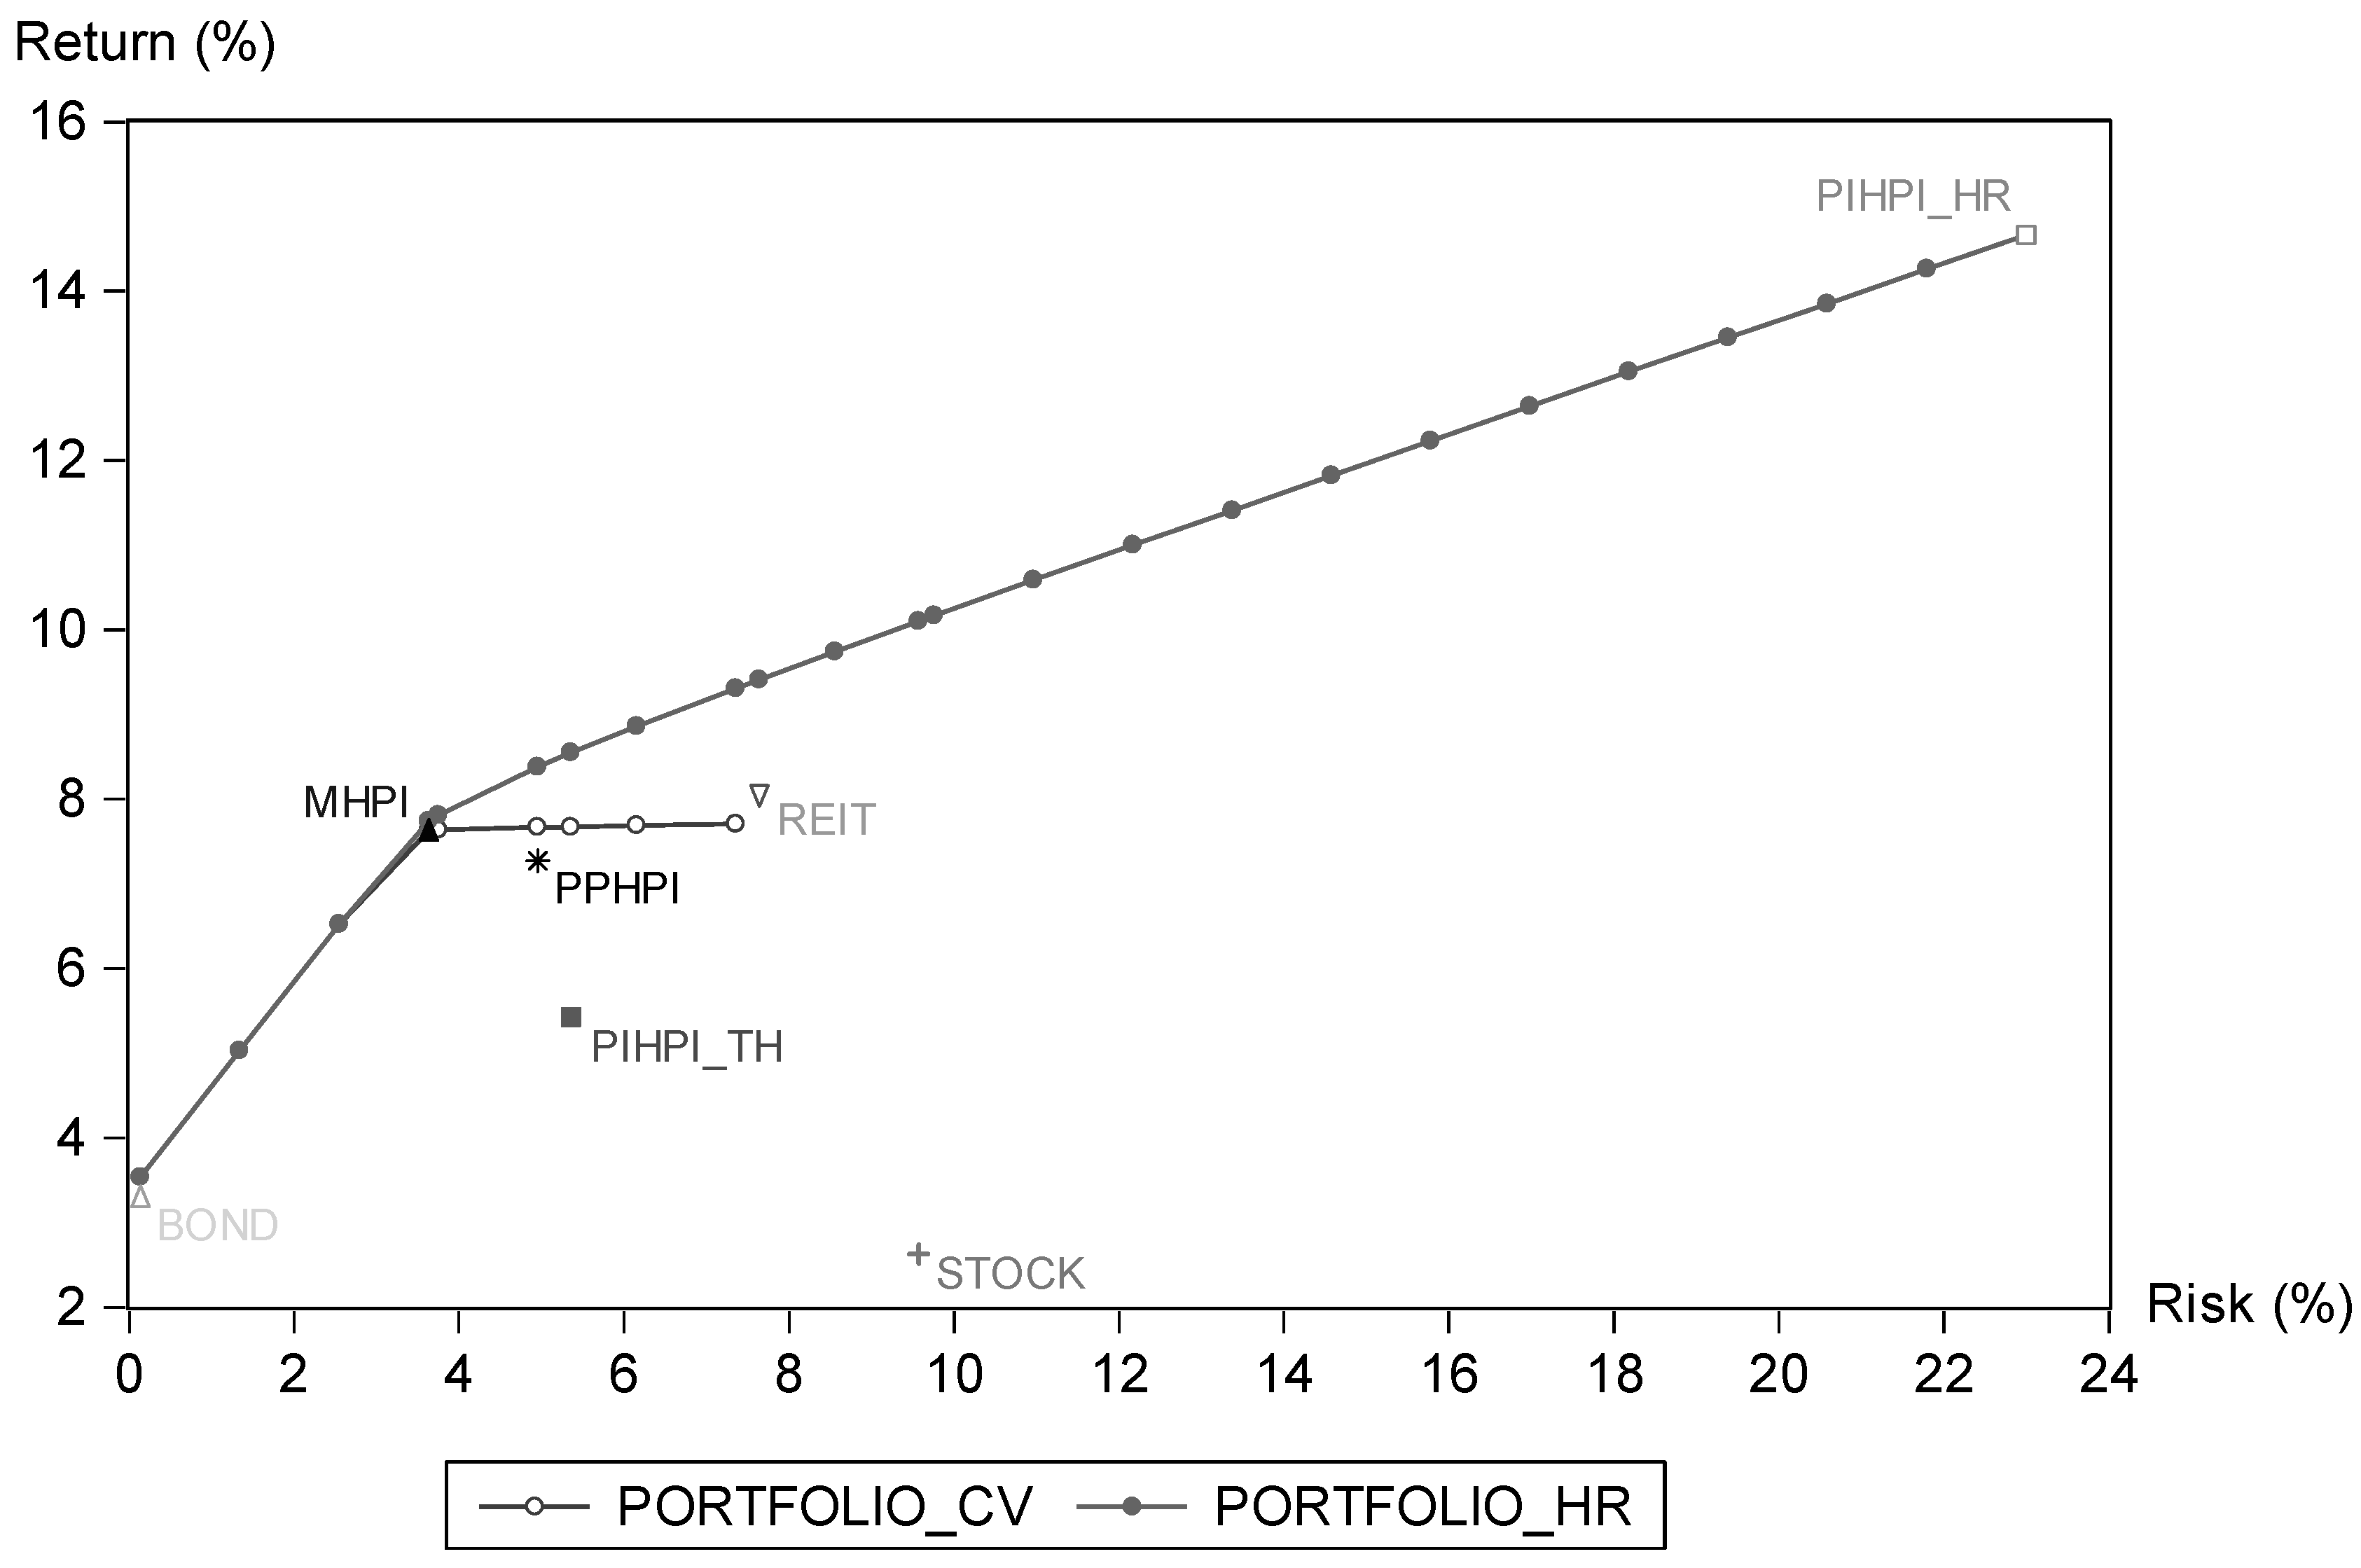
Based on Figure 3, the Efficient Frontier of the conventional portfolio (PORTFOLIO_CV) is shifted upward forming the diversified portfolio (PORTFOLIO_HR). In other words, heritage properties play a significant role in diversifying the investment portfolio. In addition, the investment assets that lie below the line of the Efficient Frontier are considered sub-optimal assets, for example, REITs, Stocks (Kuala Lumpur Composite Index), Pulau Pinang (Island) Terrace House Price Index (PIHPI_TH), and Pulau Pinang Price Index (PPHPI). They are inefficient in terms of individual risk and return trade-off compared to the diversified portfolio (PORTFOLIO_HR).
5. Conclusions and Recommendation
This study evaluated the investability of heritage properties from two aspects, namely, indexation and portfolio analysis. The heritage properties that fall within the core and buffer zones have experienced a sharp increase in transaction volume and price after obtaining recognition from UNESCO as being part of a world heritage site. Generally, the practitioners claim that property prices have increased three-fold since 2008. However, it is riskier to estimate the price change in two transacted periods without considering the issue of quality change. Hence, this study emphasizes the importance of developing a quality-adjusted price index for calculating the actual risk and return. The hedonic price index model is calibrated through multiple variables which are significant in explaining the price change of heritage properties. The results show that 61–76% of the price variability of heritage properties can be captured by this model. In addition, there are no contradictory results for all the tested variables. According to Table 3, the independent variables such as land size, location, building condition, land-use condition, and fractional ownership are significant in supporting the price change of heritage properties. In other words, these variables are crucial to producing a quality-adjusted price index to avoid overstating or understating the real risk and return of heritage properties. Additionally, in order to overcome the possible overfitting issue in the regression model, seven types of regression techniques are tested in this study. The outcome showing Ridge regression obtained the lowest and stable Mean Square Error (MSE) and it is useful for optimizing the reliability of the hedonic price index model for heritage properties. According to the above statistical results, this model is reliable and replicable for estimating the future heritage property price index in Georgetown, Penang. Transparency in terms of historical price movement is important for helping the investor to understand the risk and return embedded in any investment assets including heritage properties. According to the past literature, investing in heritage properties requires higher capital expenditures such as conversion and restoration/conservation costs. Examples of building conservation aspects include but are not limited to the roof structure, wall, tiles, door, floor, etc. Furthermore, the investor or buyer might face challenges such as conserving the heritage properties in terms of the conservation plan, lack of skilled workers, choice of material, and conservation guidelines. The risk level of the investor would significantly increase further if they were not aware of the historical price change of heritage properties.
Subsequently, portfolio frontier analysis was incorporated into this study to examine the diversification effects of heritage properties in the investment portfolio. There are seven types of common investment assets in Malaysia that were selected for the performance analysis, namely, MHPI, PPHPI, REIT_INDEX, PIHPI_HR, PIHPI_TH, STOCK_INDEX, and bond. Based on the Sharpe ratio of MHPI, it dominates all the asset classes in this study by providing a steady and stable growth rate. This result is consistent with the previous studies in which investing in direct real estate can optimize the investment portfolio. In contrast to the growth rate of securities-based assets such as REIT_INDEX and STOCK_INDEX, they appear to be more volatile than residential property and are not compensated by higher returns. In conclusion, this study found that heritage property not only offers high return, but also high risk as compared to other assets such as MHPI, PPHPI, REIT_INDEX, PIHPI_HR, PIHPI_TH, STOCK_INDEX, and bond. Therefore, the investment risk of heritage properties should be neutralized by investing in the Malaysian housing market (MHPI). The recommended asset allocation is justified in Figure 3, the return of the conventional portfolio (PORTFOLIO_CV) is enhanced further at the same risk level after including the heritage properties or forming the diversified portfolio (PORTFOLIO_HR).
Author Contributions
C.T.C.: Formal analysis, Data curation, Methodology, Writing—original draft, Validation; G.H.T.L.: Writing—review & editing; Y.-S.G.: Formal analysis; W.F.W.: Writing—review & editing; K.S.L.: Writing—review & editing. All authors have read and agreed to the published version of the manuscript.
Funding
This study was funded by the TAR UC Internal Research Grant (UC/I/G2019-00058).
Institutional Review Board Statement
Not applicable.
Informed Consent Statement
Not applicable.
Data Availability Statement
Data are available on request from the corresponding author.
Acknowledgments
This research was supported by the Centre for Construction Research, Faculty of Built Environment, Tunku Abdul Rahman University College, Malaysia.
Conflicts of Interest
The authors declare no conflict of interest.
References
- Adair, Alastair, Jim Berry, Stanley McGreal, Norman Hutchison Craig Watkins, and Kenneth Gibb. 2003. Urban regeneration and property investment performance. Journal of Property Research 20: 371–86. [Google Scholar] [CrossRef]
- Barron, Laignee. 2017. Unesco-Cide”: Does World Heritage Status do Cities more Harm than Good. The Guardian. August 30. Available online: https://www.theguardian.com/cities/2017/aug/30/unescocide-world-heritage-status-hurt-help-tourism (accessed on 2 May 2021).
- Best, W. Best, Charles W. Hodges, and James A. Yoder. 2007. The Sharpe Ratio and Long-Run Investment Decisions. The Journal of Investing 16: 70–76. [Google Scholar] [CrossRef]
- Billington, Robert. 2004. Federal leverage attracts private investment at US heritage sites: A case study. International Journal of Heritage Studies 10: 349–59. [Google Scholar] [CrossRef]
- Campbell, Rachel J. 2009. Art as a Financial Investment. Collectible Investments for the High Net Worth Investor, 119–50. [Google Scholar] [CrossRef]
- Cho, Hyunbum. 2017. The role of Sub-Sector REITs in mixed-asset portfolios in Japan. Journal of Real Estate Literature 25: 389–408. [Google Scholar] [CrossRef]
- Clapp, John M. 2004. A semiparametric method for estimating local house price indices. Real Estate Economics 32: 127–60. [Google Scholar] [CrossRef]
- de Haan, Jan, and W. E. Diewert. 2011. Handbook on Residential Property Price Indexes. Luxembourg: Eurostat. [Google Scholar]
- De la Torre, Marta. 2013. Values and Heritage Conservation. Heritage & Society 6: 155–66. [Google Scholar] [CrossRef]
- Delfim, Jean Christophe, and Martin Hoesli. 2019. Real Estate in Mixed-Asset Portfolios for Various Investment Horizons. Journal of Portfolio Management 45: 141–58. [Google Scholar] [CrossRef]
- Diewert, W. Erwin, Kevin J. Fox, and Chihiro Shimizu. 2016. Commercial Property Price Indexes and the System of National Accounts. Journal of Economic Surveys 30: 913–43. [Google Scholar] [CrossRef] [Green Version]
- Elton, Edwin J., and Martin J. Gruber. 1997. Modern portfolio theory, 1950 to date. Journal of Banking and Finance 21: 1743–59. [Google Scholar] [CrossRef] [Green Version]
- Ghazali, Mohd Fahmi, Hooi Hooi Lean, and Zakaria Bahari. 2015. Sharia compliant gold investment in Malaysia: Hedge or safe haven? Pacific Basin Finance Journal 34: 192–204. [Google Scholar] [CrossRef]
- Gilderbloom, John I., Matthew J. Hanka, and Joshua D. Ambrosius. 2009. Historic preservation’s impact on job creation, property values, and environmental sustainability. Journal of Urbanism 2: 83–101. [Google Scholar] [CrossRef]
- Goetzmann, William Nelson. 1993. The single family home in the investment portfolio. The Journal of Real Estate Finance and Economics 6: 201–22. [Google Scholar] [CrossRef]
- Harun, Siti Norlizaiha. 2011. Heritage building conservation in Malaysia: Experience and challenges. Procedia Engineering 20: 41–53. [Google Scholar] [CrossRef] [Green Version]
- Helbich, Marco, Wolfgang Brunauer, Eric Vaz, and Peter Nijkamp. 2013. Spatial Heterogeneity in Hedonic House Price Models: The Case of Austria. Tinbergen Institute Discussion Paper, No. 13-171/VIII. Amsterdam and Rotterdam: Tinbergen Institute. [Google Scholar]
- Hiang, K. Liow, and Alastair Adair. 2009. Do Asian real estate companies add value to investment portfolio? Journal of Property Investment and Finance 27: 42–64. [Google Scholar] [CrossRef]
- Hill, Robert J., Alicia N. Rambaldi, and Michael Scholz. 2020. Higher Frequency Hedonic Property Price Indices: A State-Space Approach. Empirical Economics. [Google Scholar] [CrossRef] [Green Version]
- Jasme, N., Othuman M. A. Mydin, and N. Md. Sani. 2014. Investigation of Adaptive Reuse of Heritage Buildings in Penang. SHS Web of Conferences 11: 01007. [Google Scholar] [CrossRef] [Green Version]
- Jin, Changha, Terry Grissom, and Alan Ziobrowski. 2007. The mixed asset portfolio for asia-pacific markets. Journal of Real Estate Portfolio Management 13: 249–56. [Google Scholar]
- Karaganis, Anastassios N. 2011. Seasonal and Spatial Hedonic Price Indices. Journal of Property Investment and Finance 29: 297–311. [Google Scholar] [CrossRef]
- Keng, Tan Yen, and Ting Kien Hwa. 2004. The role of residential property in personal investment portfolios: The case of malaysia. Pacific Rim Property Research Journal 10: 466–86. [Google Scholar] [CrossRef]
- Kok, Shiau Hui, Normaz Wana Ismail, and Chin Lee. 2018. The Sources of House Price Changes in Malaysia. International Journal of Housing Markets and Analysis 11: 335–55. [Google Scholar] [CrossRef]
- Lee, Chyi Lin. 2007. The Role of Malaysian Securitised Real Estate in a Mixed-Asset Portfolio. Journal of Financial Management of Property and Construction 14: 208–30. [Google Scholar] [CrossRef]
- Licciardi, Guido, and Rana Amirtahmasebi, eds. 2012. The Economics of Uniqueness. Lnvesting in Historic City Cores and Cultural Heritage Assets for Sustainable Development. Washington, DC: The World Bank. [Google Scholar]
- Lim, Yoke Mui, Suet Leng Khoo, and Kean Siang Ch’ng. 2014. Residents’ perspectives towards conservation in George town world heritage city: A post-UNESCO listing scenario. Journal of Urban and Regional Analysis 6: 161–80. [Google Scholar]
- Lum, Ka Kay. 2018. What About Investing in Heritage Buildings. THEEDGE MARKETS (Property) 29/1 [online]. Available online: https://www.theedgemarkets.com/article/what-about-investing-heritage-buildings (accessed on 1 October 2019).
- Nappi-Choulet, Ingrid Pr, and Tristan Pierre Maury. 2009. A Spatiotemporal Autoregressive Price Index for the Paris Office Property Market. Real Estate Economics 37: 305–40. [Google Scholar] [CrossRef]
- Pagliari, Joseph L. 2017. Another Take on Real Estate’s Role in Mixed-Asset Portfolio Allocations. Real Estate Economics 45: 75–132. [Google Scholar] [CrossRef]
- Palmquist, Raymond B., and V. Kerry Smith. 2001. The Use of Hedonic Property Value Techniques for Policy and Litigation. International Yearbook of Envrionmental and Resources Economics 6: 78. [Google Scholar]
- Samadi, Zalina, and Rodzyah Mohd Yunus. 2012. Conflict of Image and Identity in Heritage Commercialization. Procedia—Social and Behavioral Sciences 50: 675–84. [Google Scholar] [CrossRef] [Green Version]
- Shamsuddin, Shuhana, and Ahmad Bashri Sulaiman. 2002. The Importance of Conserving the Old Town Centre in Achieving a Sustainable Built Environment of the Future. In National Seminar on Built Environment: Sustainability through Management and Technology. Kuala Lumpur: Universiti Islam Antarabangsa Malaysia. [Google Scholar]
- Shipley, Robert. 2000. Heritage designation and property values: Is there an effect? International Journal of Heritage Studies 6: 83–100. [Google Scholar] [CrossRef]
- Sipan, Ibrahim, Abdul Hamid Mar Iman, and Muhammad Najib Razali. 2018. Spatial–Temporal Neighbourhood-Level House Price Index. International Journal of Housing Markets and Analysis 11: 386–411. [Google Scholar] [CrossRef]
- State Government of Penang. 2008. Heritage Management Plan. State Government of Penang. Available online: http://www.gtwhi.com.my/images/stories/files/heritage_management_plan_historic_city_of_george_town.pdf (accessed on 1 October 2020).
- Tan, David. 2019. Heritage Property Mismatch. TheStar (Business), 15/10 [online]. Available online: https://www.thestar.com.my/business/business-news/2016/10/15/heritage-property-mismatch/ (accessed on 15 October 2019).
- Taylor, R. 1990. Interpretation of the correlation coefficient: A basic review. Journal of Diagnostic Medical Sonography 6: 35–39. [Google Scholar] [CrossRef]
- Ting, Kien Hwa, Sherry Z. Zhou, and Helen X. H. Bao. 2007. Regional Variations of Residential Real Estate Returns in Malaysia. Paper presented at 12th Asian Real Estate Society Annual Conference, Macau, China, July 9–12. [Google Scholar]
- Tokede, Olubukola, Dona Nilupa Udawatta, and Mark Luther. 2018. Retrofitting heritage office buildings in the UK: A case study. Built Environment Project and Asset Management 8: 39–50. [Google Scholar] [CrossRef]
- Wang, Fang, and Xu Zheng. 2017. Performance analysis of investing in Chinese oil paintings based on a hedonic regression model of price index. China Finance Review International 7: 323–42. [Google Scholar] [CrossRef]
- Wilhelmsson, Mats. 2009. Construction and Updating of Property Price Index Series: The Case of Segmented Markets in Stockholm. Property Management 27: 119–37. [Google Scholar] [CrossRef]
- Wills, Peter, and Chris Eves. 2005. Heritage Australia: A Review of Australian Material Regarding the Economic and Social Benefits of Heritage Property. Parramatta: New South Wales Heritage Office. [Google Scholar]
- Worthington, Andrew C., and Helen Higgs. 2004. Art as an investment: Risk, return and portfolio diversification in major painting markets. Accounting and Finance 44: 257–71. [Google Scholar] [CrossRef] [Green Version]
- Zin, Normayuni Mat, Suriatini Ismail, and Fatin Afiqah Md Azmi. 2018. Ascertaining the Economic Sustainability of Heritage Property Market based on Sales Transaction Analysis. Environment-Behaviour Proceedings Journal 3: 247–54. [Google Scholar] [CrossRef]
- Zin, Normayuni Mat, Suriatini Ismail, Junainah Mohamad, Nurul Hana Adi Maimun, and Fatin Afiqah Md Azmi. 2019. Critical determinants of heritage property value: A conceptual framework. Planning Malaysia 17: 219–31. [Google Scholar] [CrossRef] [Green Version]
Figure 1.
Comparative Analysis of Property Price Indices and Stock Indices (2009–2019).

Figure 2.
(a): Asset Allocation of Portfolio_CV (2009–2019). (b): Asset Allocation of Portfolio_HR (2009–2019).
Figure 2.
(a): Asset Allocation of Portfolio_CV (2009–2019). (b): Asset Allocation of Portfolio_HR (2009–2019).

Figure 3.
Performance Analysis Between Conventional Portfolio and Diversified Portfolio Based on Efficient Frontiers (2009–2019).
Figure 3.
Performance Analysis Between Conventional Portfolio and Diversified Portfolio Based on Efficient Frontiers (2009–2019).


Table 1.
Data Quantification for Hedonic Price Index Model.
| Description | Unit of Measurement | Data Types | Sources | |
|---|---|---|---|---|
| Dependent variable | Transacted price of heritage properties | Ringgit Malaysia (logarithm form) | Numerical | Valuation and Property Services Department (JPPH) |
| Independent variables | Land area | Square meter (logarithm form) | Numerical | Valuation and Property Services Department (JPPH) |
| Share (ownership) | Value | Numerical | ||
| Transaction period (yearly basis) | Dummy Variable, where 1 = if the units of heritage properties were purchased at respective year, t 0 = if the units of heritage properties were purchased at base year, 0 | Categorical | ||
| Location | Latitude and Longitude (polynomial form) | Numerical | Valuation and Property Services Department (JPPH) and Google Map | |
| Types of shop | Dummy Variable, where 1= typical shop house, 0 = residential unit which permitted for commercial use | Numerical | Valuation and Property Services Department (JPPH) and Google Streetview | |
| Building Condition | Dummy Variable, where 1 = Good, 0 = otherwise 1 = Average, 0 = otherwise 0 = Bad condition | Categorical | Valuation and Property Services Department (JPPH) and Google Streetview | |
Table 2.
Types of Regression Model.
| Types | Explanatory Notes |
|---|---|
| Linear Regression | The linear regression model is the typical model that adjusting the weights (coefficients of variables) w by optimizing the problem with the cost function below: |
| is the predicted value from the model. The linear regression is usually simply derived as | |
| where j is the number of variables. | |
| Ridge | Ridge regression is the shrinkage model of linear regression that supports multicollinearity analysis for overfitting reduction by introducing a slight bias in the estimates. The procedure trades away much of the variance in exchange for a little bias for a better coefficient when multicollinearity is present. This can be achieved by introducing the lambda to the cost function to the linear regression as follow. |
| Lasso | Lasso is another shrinkage model that is similar to the Ridge regression that aims to increase the performance with a simpler model with the effect on the selection of variables. This is achieved by adding penalization to the weights of the variables as defined as follows: |
| Multilasso | The multi-task Lasso model is a Lasso model improved by jointly enforcing the selected features to be the same across tasks to stabilize the feature selection task. This can be achieved by optimizing the summing of the cost function across tasks K. |
| ElasticNet | The feature selection task by the Lasso model is based on the data causing it to be unstable with the bias in the samples. Elastic Net is aimed to optimize the solution by combining both the penalization methods of Lasso and Ridge for balancing the feature selection and the outlier elimination tasks in the data. The Elastic Net incorporates penalties from both L1 and L2 regularization by introducing the mixing ratio α into the cost function of the problem as follows: |
| MultiTaskElasticNet | Similar to the Multi-Task Lasso, the Multi-Task Elastic Net solves the regression problem by training with a mixed L1, L2-norm, and L2 for regularization to estimate the sparse coefficients for multiple regression problems jointly to achieve optimization across tasks. |
| Least Angle | The Least Angle Regression is similar to the traditional forward selection method but it is less greedy throughout the algorithm process. This is achieved by increasing the estimated parameters in a direction equiangular to each one’s correlations with the residual rather than including variables at each step. The algorithm steps are as follow: Step 1: Start with r = y and W = 0, that is most correlated with r has a greater or equal correlation with current residue. has a greater or equal correlation with the current residual. Step 5: Continue until the desired number of predictors has entered in the model and obtain the ordinary least square solution after the p-th iteration. |
Table 3.
Statistical Analysis of PIHPI_HR Model (2009–2019).
| p-Value (Linear Regression/OLS) | Coefficients | Expected Sign of Coefficients | |||||
|---|---|---|---|---|---|---|---|
| 1% Significance | 5% Significance | 10% Significance | Total Number | Positive (+) | Negative (-) | ||
| 10 | 0 | 0 | 10 | 10 | 0 | + | |
| 10 | 0 | 0 | 10 | 10 | 0 | + | |
| 9 | 0 | 0 | 9 | 10 | 0 | +/− | |
| 8 | 1 | 1 | 10 | 10 | 0 | +/− | |
| 10 | 0 | 0 | 10 | 0 | 10 | +/− | |
| 6 | 2 | 2 | 10 | 10 | 0 | +/− | |
| 8 | 0 | 2 | 10 | 0 | 10 | +/− | |
| 10 | 0 | 0 | 10 | 9 | 1 | +/− | |
| 10 | 0 | 0 | 10 | 10 | 0 | + | |
| 2 | 0 | 0 | 2 | 10 | 0 | + | |
| 5 | 2 | 2 | 9 | 10 | 0 | + | |
Note: 10 hedonic price index models were developed for the years 2009 until 2019. The adjusted R square among the models ranged from 0.61–0.76. The dependent variable of the model is the transacted price, lnTP whereas the independent variables of the model are land area = ‘’, ownership = ‘SHARE’, coordinates = ‘’; ‘’; ‘’; ‘’; ‘’, building condition = ‘GOOD’; ‘AVG’, Shophouse = ‘SHOP’, and transacted period = ‘’.
Table 4.
Comparative Analysis of Regression Models.
| Types of Regression Technique | Mean Square Error (MSE) | Standard Deviation | |
|---|---|---|---|
| Cross Validation 1 | True Sample 2 | ||
| Linear Regression | 0.55 | 0.40 | 0.32 |
| Ridge | 0.42 | 0.41 | 0.12 |
| Lasso | 0.59 | 0.41 | 0.17 |
| Multilasso | 0.59 | 0.60 | 0.17 |
| ElasticNet | 0.74 | 0.75 | 0.16 |
| MultiTaskElasticNet | 0.55 | 0.56 | 0.18 |
| LeastAngle | 0.70 | 0.70 | 0.16 |
Note: The MSE of each hedonic price index model is examined using the cross-validation method and true sample approach. 1 The cross-validation approach has segregated 20% of the data of each sample randomly for model testing. This action is repeated 10 times with different datasets from the same sample in order to get a consistent MSE for each model. 2 The true sample means that the dataset is fully used for developing a price index model.
Table 5.
Pearson Correlation Coefficient of Investment Assets.
| REIT_INDEX | STOCK_INDEX | MHPI | PIHPI_TH | PPHPI | PIHPI_HR | Bond | |
|---|---|---|---|---|---|---|---|
| REIT_INDEX | 1.000 | ||||||
| STOCK_INDEX | 0.695 * | 1.000 | |||||
| MHPI | 0.455 | 0.275 | 1.000 | ||||
| PIHPI_TH | 0.498 | 0.500 | 0.847 * | 1.000 | |||
| PPHPI | 0.287 | 0.170 | 0.918 * | 0.799 * | 1.000 | ||
| PIHPI_HR | 0.730 * | 0.704 * | 0.584 | 0.788 * | 0.405 | 1.000 | |
| Bond | −0.862 * | −0.570 | −0.531 | −0.440 | −0.407 | −0.513 | 1.000 |
Note: Higher correlations are associated with lower benefits of diversification and vice versa. The correlation coefficient is represented in positive and negative values ranging from −1 to 1. A correlation coefficient of zero indicates no relationship between the measured variables. Generally, the magnitude of correlation can be categorized into low or weak correlations (≤0.35), moderate correlations (0.36–0.67) and high correlations (0.68 to 1.0) (Taylor 1990). * The two-tailed critical t-values at a 5% level of significance with df = 10−2 = 8 are found in the t-table to be ± 2.306 (−2.306 ≤ t ≤ 2.306).
Table 6.
Quality of Investment Asset for Study Period 2009–2019.
| Types of Investment Asset | Return (Geometric Mean) | Risk (Std. Deviation) | Sharpe Ratio | PerformanceRank |
|---|---|---|---|---|
| MHPI | 7.62% | 3.63% | 1.19 | 1 |
| PPHPI | 7.27% | 4.95% | 0.80 | 2 |
| REIT_INDEX 1 | 7.71% | 8.06% | 0.55 | 3 |
| PIHPI_HR | 14.66% | 24.23% | 0.47 | 4 |
| PIHPI_TH | 5.43% | 5.36% | 0.40 | 5 |
| STOCK_INDEX 2 | 2.63% | 10.09% | −0.07 | 6 |
| Bond 3 | 3.29% | 0.15% | - | - |
Note: 1 The REIT_INDEX (base year = 2010) is computed based on the stock prices of REIT companies that had been listed in Bursa Malaysia between 2009 and 2019. This study selected 10 REITs (AXREIT, AMFIRST, YTLREIT, HEKTAR, MQREIT, ALQAREIT, ATRIUM, ARREIT, TWREIT, and UOAREIT) to represent its market performance for the study period. 2 The base year of KLCI was adjusted to the year 2010, namely STOCK_INDEX. The purpose of such adjustments is to maintain consistency among the investment assets for a comparative study. 3 Bond yield of three-year Malaysian Government Securities (MGS).
Publisher’s Note: MDPI stays neutral with regard to jurisdictional claims in published maps and institutional affiliations. |
© 2021 by the authors. Licensee MDPI, Basel, Switzerland. This article is an open access article distributed under the terms and conditions of the Creative Commons Attribution (CC BY) license (https://creativecommons.org/licenses/by/4.0/).
Share and Cite
MDPI and ACS Style
Cheng, C.T.; Ling, G.H.T.; Gan, Y.-S.; Wong, W.F.; Lai, K.S. Revisiting Investability of Heritage Properties through Indexation and Portfolio Frontier Analysis. Risks 2021, 9, 91. https://0-doi-org.brum.beds.ac.uk/10.3390/risks9050091
AMA Style
Cheng CT, Ling GHT, Gan Y-S, Wong WF, Lai KS. Revisiting Investability of Heritage Properties through Indexation and Portfolio Frontier Analysis. Risks. 2021; 9(5):91. https://0-doi-org.brum.beds.ac.uk/10.3390/risks9050091
Chicago/Turabian StyleCheng, Chin Tiong, Gabriel Hoh Teck Ling, Yee-Siang Gan, Wai Fang Wong, and Kong Seng Lai. 2021. "Revisiting Investability of Heritage Properties through Indexation and Portfolio Frontier Analysis" Risks 9, no. 5: 91. https://0-doi-org.brum.beds.ac.uk/10.3390/risks9050091
Note that from the first issue of 2016, this journal uses article numbers instead of page numbers. See further details here.