
Impact of Fintech on Bank Risk-Taking: Evidence from China

1
Business School, Hunan Normal University, Changsha 410081, China
2
School of Finance, Zhongnan University of Economics and Laws, Wuhan 430073, China
*
Author to whom correspondence should be addressed.
Risks 2021, 9(5), 99; https://0-doi-org.brum.beds.ac.uk/10.3390/risks9050099
Submission received: 26 March 2021
/
Revised: 12 May 2021
/
Accepted: 14 May 2021
/
Published: 18 May 2021
Abstract
:This article focuses on the relationship between Fintech and bank risk-taking behavior. Since Robo-Advisor is one of the mature applications of Fintech, we found that the development of Fintech will have a greater impact on small and medium-sized banks through the establishment of a Robo-Advisor model. This paper uses a benchmark regression model to analyze the municipal digital financial inclusion index compiled by Peking University and the annual report data of 155 small and medium-sized banks from 2011 to 2016. We found that the development of Fintech has significantly reduced bank risk-taking level. This result is still valid after the robustness test of replacing the bank’s risk-taking index and replacing the Fintech development index. We used the urban innovation index as an instrumental variable to deal with the endogenous problem, and obtained consistent estimation results. The test of the intermediary effect shows that the development of Fintech will affect the bank risk-taking through channels such as the bank’s internal interest margin, management capabilities, the bank’s external competition intensity, and residents’ saving willingness. Heterogeneity analysis shows the reduction effect of Fintech on bank risk-taking is more pronounced in banks in eastern and western regions in China, the large banks and the urban commercial banks.
JEL:
G21; E44; O331. Introduction
In recent years, new technologies, such as the internet finance, Blockchain, artificial intelligence, and 5G, have continued to penetrate the finance, which forms the Fintech. In 2017, the Financial Stability Board (FSB) proposed that Fintech can create new business models, applications, processes, or products, which will have an impact on financial markets, financial institutions, or the way in which financial services are provided (FSB 2017). The Basel Committee on Banking Supervision believes that international Fintech is mainly active in four areas: payment and settlement, deposits and loans and capital raising, investment management, and financial market infrastructure. It has created a variety of financial products and financial services such as digital currency, equity crowdfunding, Robo-Advisors, and customer identity authentication. The potential impact of Fintech on the financial industry is mainly reflected in financial stability and access to services. Fintech may bring profound changes, but it will also bring significant regulatory challenges (Philippon 2015). Faced with the rapid development of financial technology and potential risks, all countries are actively exploring their own regulatory methods. At present, there are three main regulatory models in the world. Countries represented by the United States mainly implement restrictive supervision models, and the direction of supervision is mainly stable; countries represented by China adopt an inclusive supervision model and adopt a passive, development-oriented supervision model; The experimental models represented by the United Kingdom, such as the regulatory sandbox and the newly established framework model, are also called smart regulation or regulatory technology. Moreover, Fintech has the dual characteristics of both technology and finance, which may have a greater impact on the risk behaviors of commercial banks. The stability of banks is also affected by the progress of information technology and the competitive pressure of Fintech companies, and banks need to review their competitive advantage to adapt to the new reality (Jakšič and Marinč 2019). On the one hand, from the perspective of technology, the new technology can reduce the cost of searching information (such as Internet search), improve the quality and speed of information acquisition (such as big data analysis), and use cryptography to build trust mechanisms (such as Blockchain) to improve the risk management level of banks. On the other hand, from a competitive point of view, the technology giant (Big Techs), with its lax regulatory and technological advantages, enters bank business, and eroded bank profits leading to increase banks risk-taking level. In order to cope with the dual challenges of technology and competition, more and more banks have either strengthened their strategic cooperation with technology giants or increased the investment layout of Fintech. From 2018 to 2020, the People’s Bank of China established a number of financial technology companies to lead the industry. As the central bank’s layout and planning in Fintech have a role as a weather vane, major domestic banking financial institutions have also accelerated the strategic deployment of financial technology. It will lead to widen the gap in Fintech strength. Moreover, technological innovation has created a “winner-take-all” banking market structure to increase the vulnerability of small and medium banks (Guellec and Paunov 2017; Schumpeter 1912). At this time, Fintech presents the ‘creative destruction’ phenomenon described by Schumpeter (1912).
2. Literature Review
In recent years, Internet finance, such as third-party payment, P2P lending platforms, has been developing rapidly. Fintech promoted by emerging technologies such as Block-chain, artificial intelligence and 5G is in the ascendant. They have a greatly impact on the business scope, business model, and risk behavior of traditional Banks. In the face of the shock, the big banks and small and medium-sized banks show a big differences in their risk-taking. Therefore, we mainly focus on the risk-taking behavior of small and medium-sized banks affected by the development of Fintech.
In this article, we focus on the impact of Fintech development on the risk-taking of small and medium banks. At present, foreign research mainly focuses on two aspects. Firstly, some researchers suggest that the development of Fintech will change the business model of commercial banks, increase the risk-taking behavior of commercial banks (Shen and Guo 2015). Fintech even promote the emergence of shadow banks by virtue of regulatory arbitrage and technological advantages to make the vulnerability of the financial system become prominent (Roger and Schreft 1999; Acharya and Kagan 2004; Claessens et al. 2012; Buchak et al. 2018). Secondly, some researchers believe that Fintech is a challenge to the traditional financial industry, but it can also be turned into an opportunity because it has greater flexibility in some areas and can provide better functions and services (Romānova and Kudinska 2016). Julapa (2018) believes that Fintech has played a great role in the relationship between finance and banking, and it has gradually penetrated into places where traditional financial institutions are underserved. The development of Fintech can improve the information asymmetry of traditional banks, reduce the transaction friction costs of banks, improve the risk management level of banks, and increase the stability of the banking system (Mishkin 1999; Lapavitsas and Dos Santos 2008; Pierri and Timmer 2020). In particular, Chen et al. (2019) provides evidence on the value of financial technology innovation, they believe that most financial technology innovations bring great value to innovators; however, when this technology is ‘disruptive technology’, it has a negative impact on the financial industry.
From domestic practice, on the business scale and the scene applications, China’s Fintech (or digital finance) in the world is in a leading position. Moreover, Fintech has impacted the banking industry. On the one hand, the Chinese banking industry is facing the impact of interest rate liberalization and profit decline caused by the narrowing interest-rate spread. On the other hand, it is also affected by economic transformation, Internet development, and financial innovations (Guo and Liang 2016). There are many web- and data-based financial products and services that customers cannot obtain from their banks or similar providers. The offerings provided by these companies already range from digital payment solutions and information services, savings and deposit-taking right through to modern online banking, multi-channel consultation (such as Robo-Advisor) and securities trading services (Dapp 2014; Gomber et al. 2018). For instance, internet wealth management products (A class of financial products purchased through the Internet platform), such as Yu’eBao (It is a cash management tool in the era of mobile Internet, which absorbs users’ fund and pay them interest daily. In addition to financial functions, Yu’eBao can also be directly used for shopping, transfer, payment, repayment and other consumer payments), have intensified competition for bank deposits, and third-party payments, such as Alipay (a third-party payment app. In addition to providing convenient payment, transfer, collection and other basic functions, it can also quickly complete credit card repayment, charging charges, water, electricity, coal charges, and other services), have intensified competition in bank payment business. Faced with this shock, banks may achieve higher profits by increasing risk-taking behavior. As Shen and Guo (2015) points out, the impact of the development of Internet finance on Banks’ risk-taking presents a ‘U’-shaped trend, which first decreases and then increases. They also believe that facing the impact of Internet finance, bank risk-taking behaviors will differ in terms of ownership and scale. Some researchers have also examined the heterogeneous impact of Fintech on risk-taking behavior of different banks (Yao and Song 2020).
It can be found from the literature review that research on Fintech and bank risk-taking is increasingly abundant, but there is still room for expansion in existing research (Petter and Geoff 2009; Shen and Guo 2015). Firstly, existing studies have focused more on the impact of Internet financial development and less on the impact of financial technology. The development of Fintech is mainly divided into Fintech IT stage (version 1.0 of Fintech), internet finance stage (version 2.0 of Fintech) and Fintech stage (version 3.0 of Fintech). Internet finance is the version 2.0 of Fintech (1990–2010), which mainly using internet technology for financial services on the scene and it is a “scale-driven financial model”. The main landmark events at this stage are: the emergence of mobile payment appeared in 1990; E*TRADE, the first internet broker in the United States, was established in 1992; internet equity crowdfunding came out in 2003. In the version 3.0 of Fintech (2011–present), the internet is no longer the main driving force to promote the development of financial technology, but makes full use of various cutting-edge digital technologies (new information technology represented by big data, cloud computing, artificial intelligence, and blockchain) to achieve financial functions. Moreover, it is a ‘data driven financial model’. Its landmark events include: the world’s first blockchain platform Ling was released on the Nasdaq Stock Exchange in October 2015. Simply understand, compared to internet finance, Fintech has more prominent technical characteristics (Huang and Huang 2018). Secondly, the bank samples studied include almost all types of commercial Banks, such as state-owned large commercial banks, joint-stock commercial banks, urban commercial banks, and rural commercial banks. As mentioned earlier, in the face of the impact of new technologies, the risk-taking behaviors of large banks and small and medium-sized banks will also be quite different. We mainly focus on small and medium-sized banks, and further examine their risk behavior. Thirdly, existing studies have proved that the development of Fintech affects the channels and mechanisms of bank risk-taking (Pi and Zhao 2014; Xie and Zou 2012). These channels include: deposit structure and the cost of paying interest; administrative expenses and capital costs; risk management, operating efficiency, profitability, and risk contagion. We believe that these channels can be further studied and analyzed.
Based on the above considerations, our work select the annual report data of 155 local banks from 2011 to 2016 and the prefecture-level digital financial index compiled by the Digital Finance Research Center of Peking University (the index uses Ant Financial’s underlying data on trading accounts to show the level of Fintech development level in various regions of China from multiple dimensions) to examine the causal relationship between Fintech and risk exposure of small and medium banks. This paper intends to further explore the mechanism of Fintech’s impact on banks’ risk-taking from the perspective of internal interest margin of banks, management cost channels, external market competition, and the channel of residents’ willingness to save. Moreover we will deeply analyze the heterogeneity of Fintech impact on risk-taking of small and medium banks.
3. Theoretical Analysis and Research Hypothesis
3.1. Theoretical Analysis
Over the past two decades, big techs like FANNG (Facebook, Apple, Microsoft, Google, Alphabet and Amazon) and BATX (Baidu, Albaba, Tencent, and Millet) have grown tremendously. Their success depends on the direct interaction between a large number of users, which in turn generates massive amounts of user behavior data, such as social networks generating massive users and real-time complete log data about user behavior. Through new technical means (such as distributed machine learning), these big data are deeply mined and analyzed to achieve customer expansion, risk evaluation and credit decision-making.
Based on the dual advantages of less supervision and technology, some large technology companies are involved in financial services, including third-party payments, online loans, and intelligent investment advisor. The entry of technology giants has brought rapid changes and profound impacts to the traditional financial system (Xie and Zou 2012). On the one hand, technology companies have rapidly scaled up by reducing information and transaction costs and developing low-cost businesses, providing basic financial services to low-income groups and small and medium enterprises (SMEs), alleviating credit rationing and promoting financial inclusion (Philippon 2019). On the other hand, technology companies enter the financial field, triggering the competitive integration of Fintech and traditional finance, bringing new factors of risk-benefit balance (BIS 2019). According to the ‘Franchise Value Theory’ proposed by Marcus (1984), competition in the deposit market weakens the ‘Franchise value’ of banks, and enhances banks’ incentives for excessive risks and risk-taking behavior.
In fact, technology companies are both banks’ partner and competitor. For instance, Bank of China has strategic cooperation with Tencent, Agricultural Bank of China has strategic cooperation with Baidu, Industrial and Commercial bank of China has strategic cooperation with JingDong, China Construction Bank has strategic cooperation with Alibaba. Many small and medium-sized banks have various cooperation with technology companies. Tech giants do well in technology, financial institutions do well in finance. At the same time, banks are paying more and more attention to independent research and development of financial technology, instead of relying solely on the technology of external technology companies. Independent research and development has high input costs, long development cycles, and slow application of scenarios. Thus, two different independent research and development (R&D) models of Fintech have been formed. That is, large banks are more inclined to build their own teams and conduct independent research and development, while small and medium banks often cannot afford huge research and development costs and have difficulties in independent innovation. Even if they cooperate with technology enterprises, small and medium-sized banks are often in a weak position and the technical cooperation is difficult. Finally, digital innovation may lead to the phenomenon of ‘winner-take-all’ (Schumpeter 1912), which leads to further concentration of bank market structure, more unstable operation of small and medium-sized banks and greater competitive risks.
Based on the above theory, because large technology companies have technical and regulatory advantages, they are the main leaders in the development of Fintech. Moreover, big technology companies are impacting the traditional financial market with banks as the main body from the asset side and risk control side. However, most of their income comes from expenses paid by the household. Therefore, the model in this article aims to analyze the impact of Fintech on bank risks by discussing the family’s investment choices (independent investment, traditional investment advisors or Robo-Advisors).
3.2. The Model
Drawing on Philippon’s research (Philippon 2019), we consider that there is a continuum of mass 1 of households whose wealth w is distributed according to the (cumulative) distribution G(w). Households are risk neutral (or, equivalently, returns are risk adjusted) and have access to an investment technology with gross return r. The reservation utility (the return of the household) of a household is thus rw. Households also have the option to hire an asset manager in order to earn higher returns.
Here, we discuss assets manager in different financial intermediaries. i represents the type of financial intermediaries. There are two types of financial intermediaries, one is the large intermediary (b) and the other is the small intermediary(s). We found that intermediaries of different sizes have different returns and costs, we assume that M asset managers in the large intermediary have access to an investment technology with return Rb and ones in a middle or small intermediary have access to an investment technology with return Rs (Rb > Rs > r). They in big and middle or small intermediaries need to respectively pay the fixed cost and () (per active firm) to be active and the relationship cost (the cost spend to maintain customers) and () (per client) to work with a household. Asset managers charge a fee for their services.
where is fixed cost and u is a markup. We suppose . In traditional asset management equilibrium (at this equilibrium, a household gets the same welfare whether it hires a traditional asset manager or not), we focus on a household’s decision whether to hire an asset manager or not. We find that when , they choose to hire an asset manager. Otherwise, they will invest by themselves. That is, when
they prefer to an asset manager in different intermediaries.
Let
Then, the net profit of any intermediary is
For free and positive entry with equality, π(M) satisfies
Therefore, the conditions in the equilibrium with positive entry are as follows.
where wi,0 satisfies formula (3).
Welfare can be expressed as
Now, we discuss that Robo-Advisors have access to the investment technology with return R (). Moreover, they have a higher fixed entry cost but a lower cost per client . To be similar to (2), when
the households choose Robo-Advisors. Otherwise, they prefer to autarky. In other words, the first participation cutoff is
The second cutoff is between the Robo-Advisor and traditional manager in a big intermediaries as follows:
That is,
Similarly, the second cutoff is between the Robo-Advisors and traditional manager in a middle or small intermediaries
It is not difficult to find that the condition for profitable entry by the Robo-Advisors is w1 < w2.
Therefore, the number of Robo-Advisors is
and the number of traditional managers is
Moreover, welfare is
If Robo-Advisors entry is profitable, i.e., , it means some poor households can get asset management services. That is, more people can get asset management services in the Fintech equilibrium (it means household has the same welfare when facing investing by himself and choosing the robot advisors) than in the traditional equilibrium (which means household who is on this situation has the same welfare no matter he chose to invest by himself or chose the traditional invest advisors).
When i.e., , Robo-Advisors improves access to asset management services. Robo-Advisors compete with the traditional advisors.
In other words, Fintech brings the traditional intermediaries competitive shocks. How big is the competitive shocks? Will the size of the competitive shock vary with the size of the intermediary? For discuss these problems, we introduce two indexes to measure the competitive shocks as follows.
Definition 1.
Num is defined
The bigger the index is, Num, the bigger the competitive shock is, since the bigger Num means Robo-Advisors are more relative to the traditional advisors.
Definition 2.
Pro is defined
The bigger the index is,, the bigger the competitive shock is, since the biggermeans the intermediary Robo-Advisors get more net profit relative to the traditional advisors. By the above indices, we compare the competitive shock for the big intermediary with one for the middle or small intermediary. Then, we can the key results as follows.
Proposition 1.
That is, the competitive shock for the big intermediary is less than one for the middle or small intermediary.
Proof.
With (18) and (12), Rb > Rs and ϕb < ϕs, one attains that
Therefore,
□
Proposition 2.
The results show that the competitive shock of small and medium-sized intermediaries is bigger than that of large-scale intermediaries.
Noticing (2.19), it is easy to find that
The result also proof that the competitive shock for big intermediary is less than one for the middle or small intermediary from the view of quantity shock. □
In summary, since banks account for a large share of the traditional investment advisory market, when Robo-Advisors enter the traditional investment advisory market as a product of Fintech development level, they will have a crowding out effect on the market share of traditional intermediary asset businesses. In the beginning, when Robo-Advisors have not entered the traditional investment advisory market, we can see from formula (4) that families only face two investment choices. Then when the robot investment adviser joins, its lower customer relationship cost () enables more families to benefit from the robot investment adviser service. Moreover, the Formula (15) shows that Fintech has a crowding-out effect on traditional bank investment advisors, seizing part of the market profits, and having a competitive impact on traditional intermediaries in terms of market share. From “Definition 1”, we further established an index to measure the intensity of competition. Comparative analysis shows that, compared with larger-scale intermediaries, smaller-scale intermediaries are more subject to the competitive impact of financial technology, which limits the risk-taking behavior of banks. Please see Appendix B for the symbols and their meanings.
3.3. Research Hypotheses
Based on previous research literature and the above theoretical analysis, this article proposes several research hypotheses to be verified:
Hypothesis 1.
The development of Fintech affects the risk behavior of banking groups, and has a greater impact on small and medium banks.
Large banks have sufficient financial resources, strong technical strength and large customer groups, and they are more inclined to build their own teams, conduct independent research and development. Moreover, they are more likely to cooperate with the companies in the field of digital technology (like GAFA and BATX). Therefore, large banks are more actively developing Fintech from debt business, intermediary business, and asset business and realizing digital transformation. Large Banks are also likely to be subject to stricter supervision and their risk behaviors are more cautious (Beltratti and Stulz 2009). In addition, in China, the customer groups of large banks are mostly relatively high-quality large enterprises or state-owned enterprises, and they are more likely to receive implicit government guarantees, while small and medium-sized banks are mostly targeted at SMEs. As a result, Fintech has a bigger impact on smaller Banks than big ones.
Hypothesis 2.
Fintech affects the bank’s risk-taking by affecting the internal interest income and management costs of the bank.
The rapid development of Fintech has two aspects on banks’ risk-taking behavior. On the one hand, Fintech gradually penetrates into the business areas of traditional banks. The increase of Banks’ capital cost, the weakening of their loan pricing ability and the acceleration of the frequency of interest rate fluctuations lead to the narrowing of the most traditional and major income source of banks’ deposit and loan spreads. All of these affect the banks’ operational stability. Compared with large banks and online banks, small and medium-sized banks have higher capital costs and a faster decline in net interest margin, which in turn increases the bank’s risk-taking. On the other hand, the spread of new technologies to banks will help improve efficiency and optimize governance, thereby reducing management costs. For example, big data technology can effectively process the bulk transaction data of traditional banks. Enable the bank to achieve precise marketing, low cost and centralized management. Moreover, it also can more effectively optimize the credit process, identify credit risks, standardize the behavior of senior executives, and reduce the risk-taking level of banks. The development of financial technology has promoted the transformation and upgrading of traditional banks to digitization, which has an impact on bank management capability and the operation stability of commercial banks. Considering the effects of both aspects, the impact of new technologies on bank risk-taking is uncertain and depends on the relative strength of the two effects (Gu and Yang 2018).
Hypothesis 3.
Fintech influences Banks’ risk-taking by influencing market competition and residents’ willingness to save.
On the one hand, Fintech promotes the marketization of interest rates in China and intensifies competition in the banking market. Moreover, the market space of banks will be greatly suppressed. China’s banking industry has experienced severe financial repression for a long time (Wang and Johansson 2013). It may not only reduce the bank franchise values through competition, thereby incentivizing them to take more risks (Allen and Gale 2000), but also may break the monopoly of large banks and new technologies through competition, and improve bank efficiency through technology spillover effects (Shen and Guo 2015). Meanwhile, Fintech has promoted the phenomenon of ‘financial disintermediation’, which means that with the development of direct financing, the supply of funds bypasses the intermediary system of commercial banks through some new institutions or new means, and is directly transported to the demand unit. Take Yu’eBao, launched by Alibaba, as an example. Its interest rate is significantly higher than the interest rate of commercial bank demand deposits, and even higher than the interest rate of commercial bank fixed deposits. At the same time, Yu’eBao also supports T + 0 deposit and withdrawal. The appearance of such internet financial products is obviously more attractive to customers than the traditional deposit products of commercial banks, and therefore may have an impact on residents’ willingness to save. To meet the challenge, banks will also attract savings back by raising deposit rates, but this will increase the cost of bank funds. As mentioned above, the impact of new technologies on banks’ risk-taking behavior depends on the relative strength of the two forces.
4. Data, Variables, and Models
4.1. Samples and Data Sources
Considering that 2013 is the first year of internet finance in China and the availability of data, we select 155 local commercial banks (including 101 urban commercial banks and 54 rural commercial banks) as the research objects from 2011 to 2016. Bank-level financial statement data comes from the Wind economic database (Wind economic database is a financial database, the database covers the stock, fund, bond, foreign exchange, insurance, futures, derivatives, spot trading, macroeconomic, financial news, and some other fields.). The Fintech index is derived from the municipal digital financial index compiled by the Peking University Digital Finance Research Center (Guo et al. 2019) and the development level of urban Fintech measured by keyword Baidu retrieval method (Using the Baidu search engine to search for relevant hot words in important policy documents, news and conferences and using the resulting number of pages to reflect a certain indicator) (Li et al. 2020). The city economic data corresponding to the bank registration place comes from the CSMAR (China Stock Market Accounting Research) database, the China Statistical Yearbook, and the statistical yearbooks of each city. And this article chooses Stata measurement software for empirical analysis, the reason please see Appendix D.
4.2. Definition and Measurement of Variables
4.2.1. Core Variables
(1) Explained variable: bank risk assumption (Risk). Since it is difficult to directly observe the bank’s risk-taking behavior and the degree of Fintech development level, in view of the availability of data, this paper selects proxy variables that are closely related to bank risk for regression. Banks’ risk-taking can be measured by several indicators, but there are some drawbacks: (i) the non-performing loan ratio focuses on the risk and quality of loan assets and has been systematically distorted under the pressure of supervision (Zhang and He 2012); (ii) missing data on indicators such as expected default rate, franchise value, and risk-to-asset ratio, the accuracy of which is questioned (Yi Fang et al. 2012). Comprehensive consideration, we choose Z as the benchmark proxy variable for bank risk exposure, the calculation formula as follows:
where ROA is the return on total assets, CAR is the ratio of capital to assets, SDROA is the standard deviation of the return on total assets (calculated over a 3-year rolling window). The banks’ risk-taking increases with the increase of Z-value. Taking into account the characteristics of the Z-value spike, thick tail, and small value, and carrying out the logarithmic treatment of ln (Z + 1). In addition, we choose SDROA, the standard deviation of the return on total assets, as the auxiliary proxy variable for bank risk, and after logarithmic processing testing its robustness.
(2) The core explanatory variable: Fintech development. We select the city-level China Digital Finance Index compiled by Peking University Digital Finance Research Center (Feng Guo et al. 2019) as the proxy variable for the degree of Fintech development. The index uses the underlying data of Ant Financial’s trading account (Ant Financial is an internet financial company, the Alipay and the Ye’Bao mentioned above are its sub business segments) to show the level of Fintech development in various regions of China from multiple dimensions. In the early stages of Fintech development, the growth of the index was mainly reflected in the breadth of coverage. In recent years, the important driver of the index has been depth of use. Therefore, based on the practice of Qiu et al. (2018), the coverage breadth of digital finance index is selected as the proxy variable (Fintech 1) to measure the degree of regional financial technology development. In the robustness test, this paper selects city-level Fintech index (Li et al. 2020) as the auxiliary proxy variable (Fintech 2). We choose this index to measure Fintech for the following reasons. On the one hand, the Baidu retrieval method in the domestic search engine market is an absolute dominant position, and Fintech-related issues cover a comprehensive range. Therefore, searching relevant hot terms on Baidu can accurately reflect the development level of Fintech in relevant regions. On the other hand, according to the relevant studies in China’s top journals, Baidu search method is widely used in the existing literature (Shi and Jin 2019; Sheng and Fan 2020; Song and Zhou 2021). In specific processing, take the logarithm after removing the zero, as there are 21 zero values in this index. Obviously, this indicator is not directly affected by the choice of banks, which helps to alleviate endogenous problems.
4.2.2. Control Variable
(1) Bank level. With reference to the existing literature, we choose the size of bank to control the difference in individual bank size (Zhang et al. 2019). Adopt debt to asset ratio (DAR) to reflect banks’ financial leverage (Xu and Chen 2012). The use of capital adequacy ratio (CAR) to reflect the bank’s capital replenishment capacity, and the net operating margin (Netprf) reflects the bank’s profitability. The cost-to-income ratio (CIR) is used to indicate the bank’s operating efficiency, and non-interest income ratio (NIRR) is used to control the difference of bank’s income structure. Learning from Ma and Li (2019), and the bank’s liquidity is represented by the deposit asset ratio (SAR). Detailed bank-level data is described in Appendix A.
(2) City level. With reference to the existing literature, this article selects GDP per capita (PGDP) to control the degree of regional economic development, and selects the total wage-deposit ratio (FinDev) to indicate the degree of regional financial development.
(3) Macro level. At the macroeconomic level, this article selects the broad money (M2) growth rate to control the impact of monetary policy trends on the entire banking industry.
4.2.3. Mediation Variable
Referring to the existing literature, we select net interest margin (NIM) and Governance as the proxy variables for the internal function channels of Banks, and choose the bank competition intensity (is tested by HHI) and per capita savings (PSaving) as the proxy variables for the external function channels of Banks. Considering the availability of data, the Herfindahl-Hirschman Index (HHI) is calculated from the sum of the squares of the ratio of each bank’s network points to the total number of local bank networks during the same period.
4.2.4. Instrument Variable
In the endogeneity test, internet penetration rate is usually selected as the instrumental variable. The paper argues that internet technology can not reflect the change of new technology well.1 To this end, we select the Urban Innovation Index (Innovation) compiled by the Industrial Development Research Center of Fudan University as an instrumental variable (Kou and Liu 2017).
Please see Table 1 for the details of the variables.
4.2.5. Descriptive Analysis
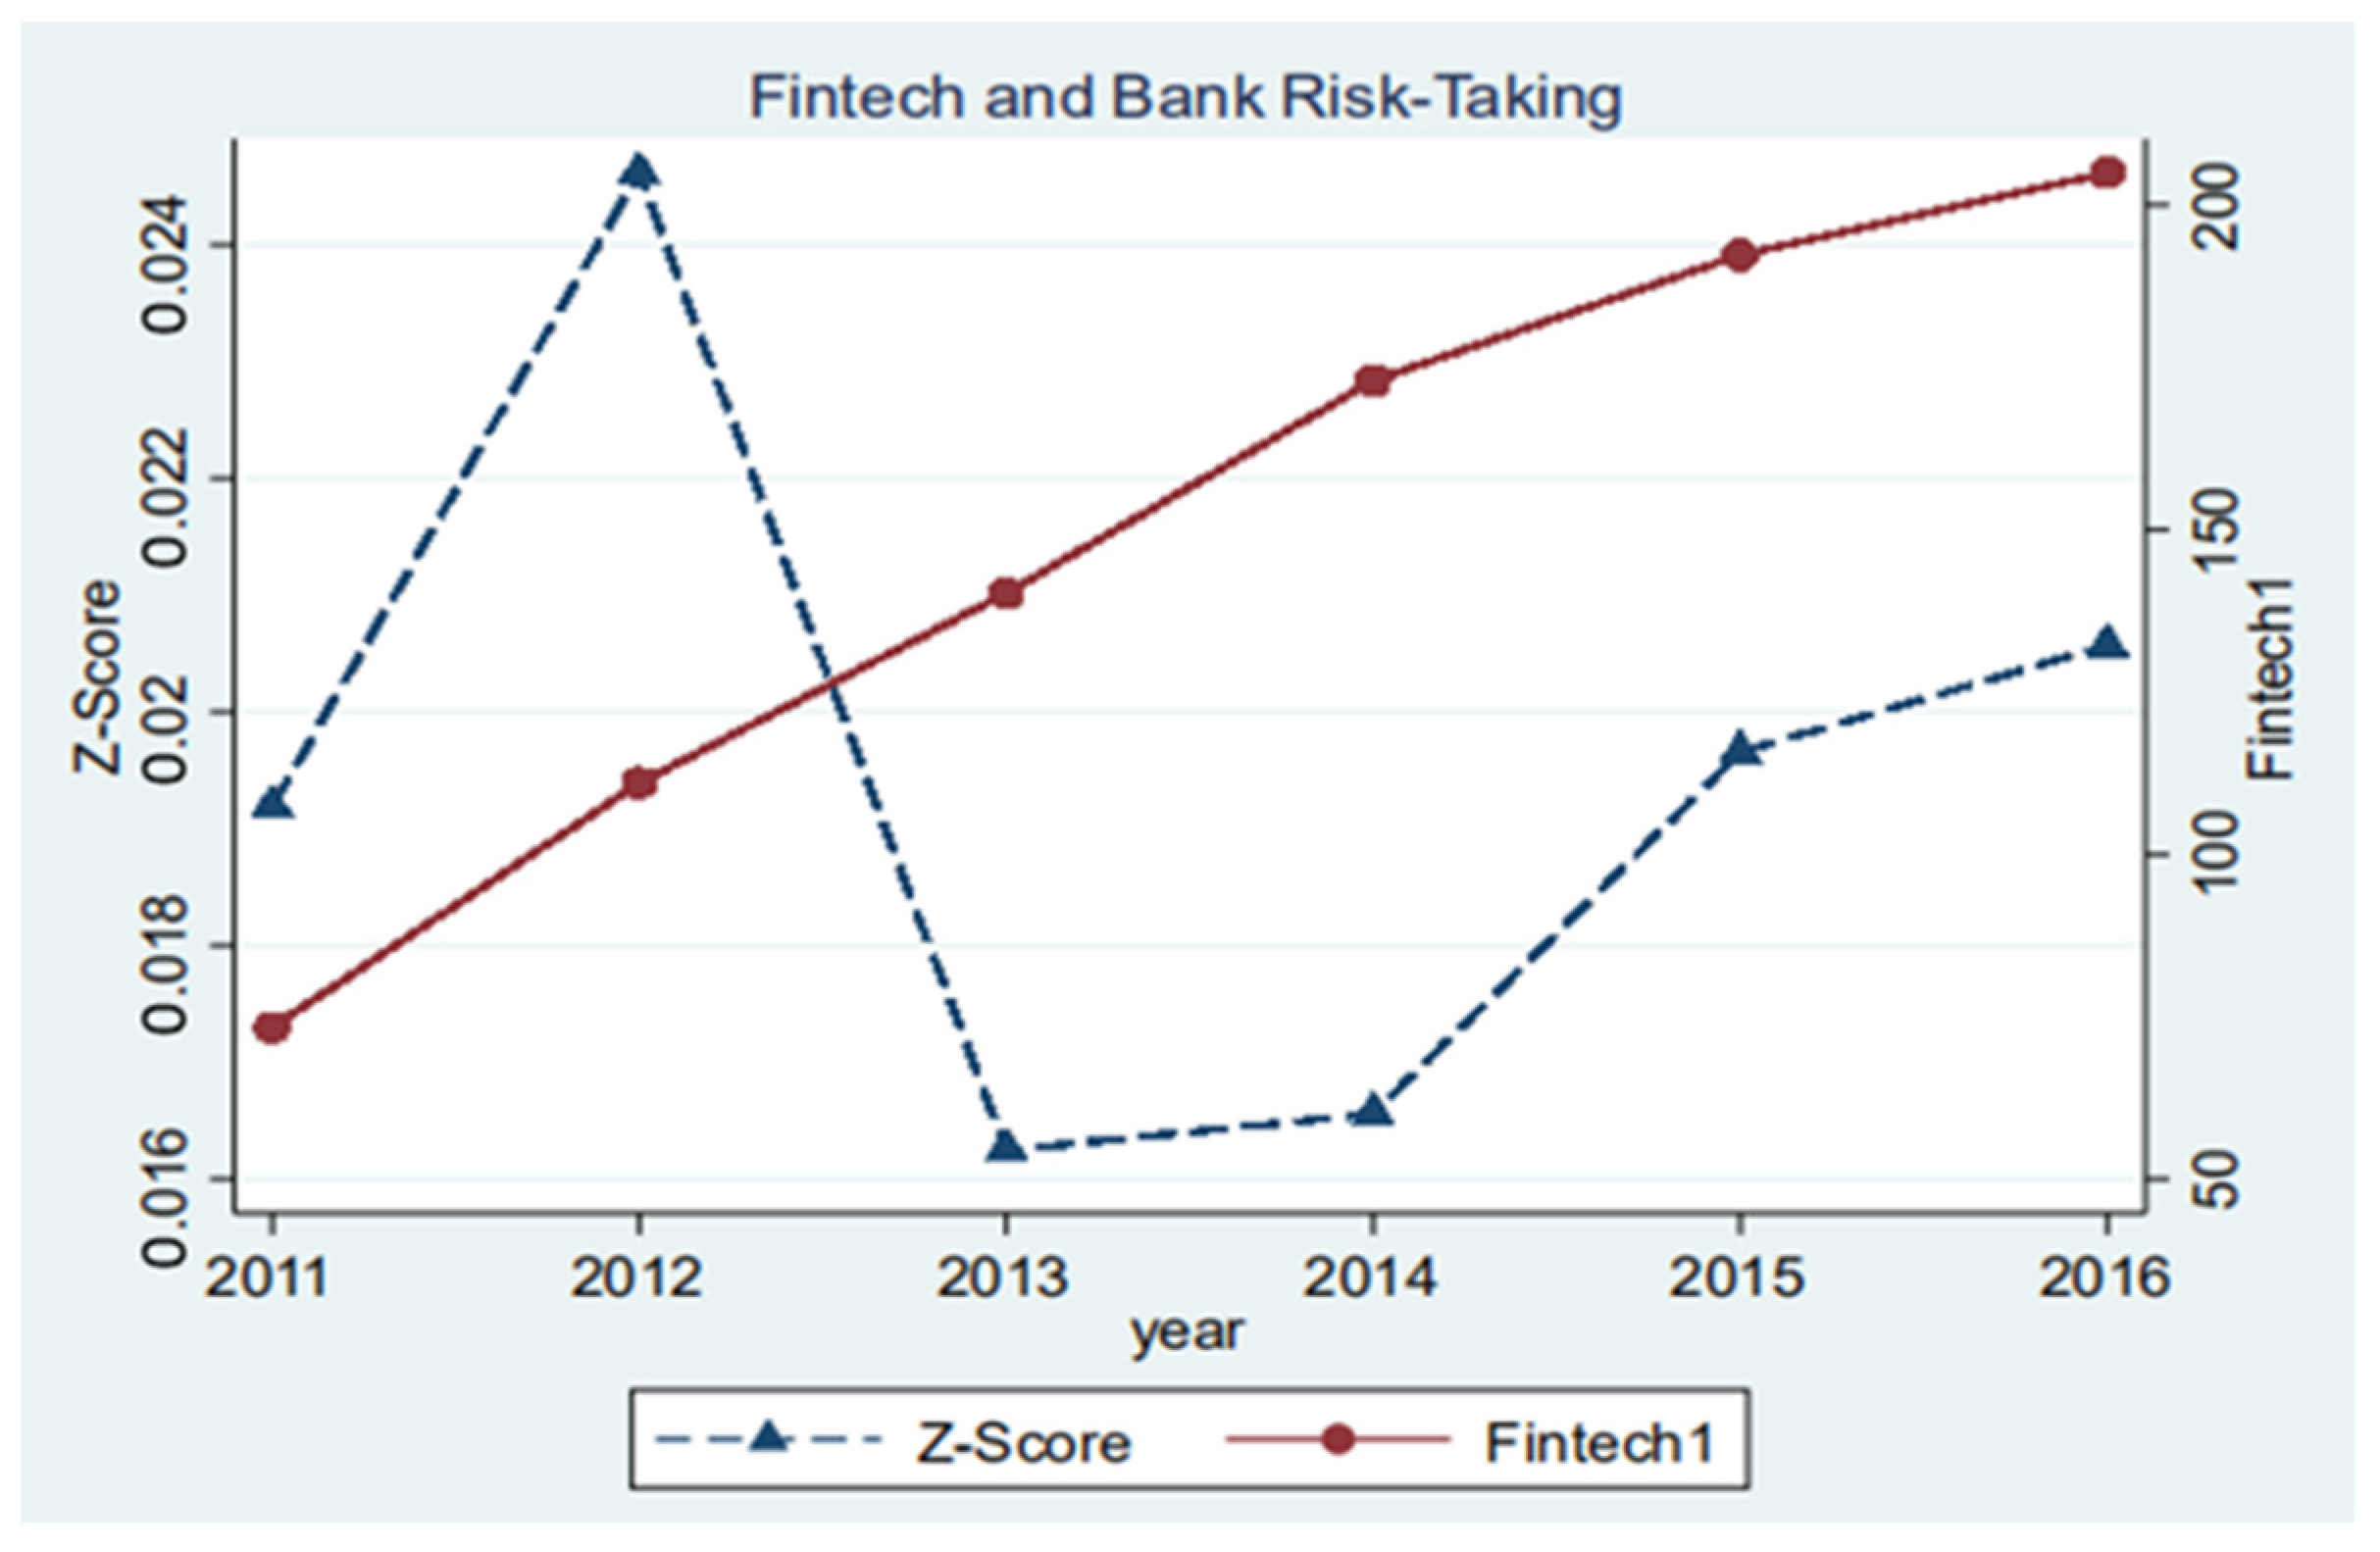
Table 2 reports the basic statistical characteristics of the variables. After logarithmic processing of Z-Score, the maximum value of the bank’s Z-Score is 0.613, and the minimum value is 0.001, but the standard deviation is small, and the average value is very close to the median. This shows that there is a large gap in the risks undertaken by small and medium banks in each region, but the overall distribution is more concentrated, and there is no obvious leftward or rightward trend. The maximum value of Fintech 1 without logarithmic processing is 248.5, the minimum value is 14.76, and the standard deviation is large, which indicates that the development of Fintech in different regions of China is uneven, and regional differences are obvious. However Fintech 1 after logarithmic processing has a smaller standard deviation and a smoother change, which shows that the method of taking the logarithm of the index is reasonable.
Figure 1 shows the time trend of Fintech and bank risk Z-Score. It can be seen that from 2011 to 2016, Fintech developed rapidly and showed an upward trend. Meanwhile, bank risk z-score shows a certain volatility, reaching a peak in 2012 and a trough in 2013. Intuitively, it is difficult to judge the correlation between Fintech and bank risk z-score.
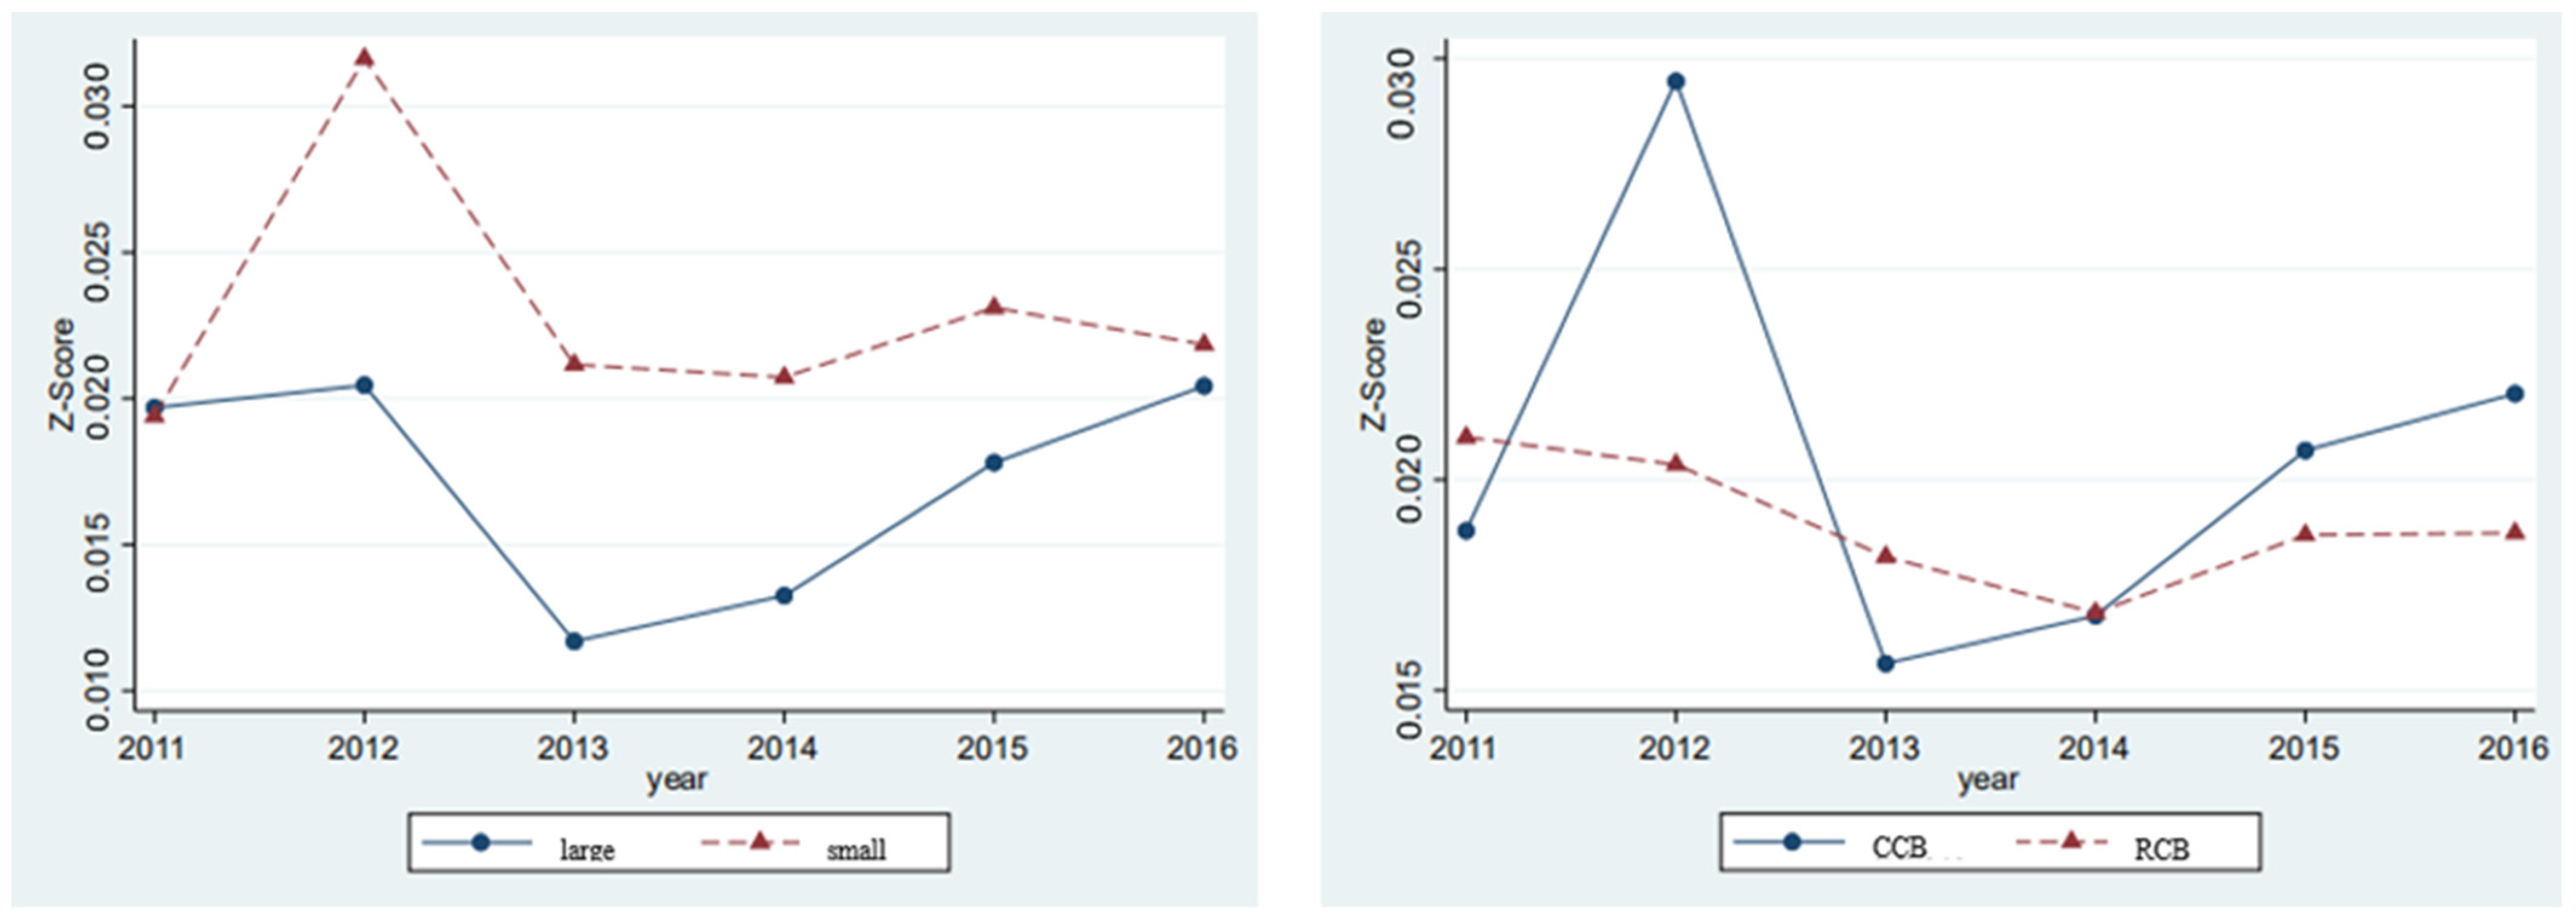
In order to better judge the risk trends of different types of banks, we divided the banks into larger banks (large) and smaller banks (small), as well as city commercial banks (CCB) and rural commercial banks (RCB). It can be seen from Figure 2 that the Z-Score of large banks is significantly lower than that of small banks, which shows that the size of banks may be an important factor affecting risk behavior. However, for city and rural commercial banks, the Z-Score trend is not very clear. Relatively speaking, the Z-Score of city commercial banks is relatively volatile. This also shows that the institutional attributes of banks may not be an important factor affecting risk behavior.
5. Benchmark Model Setting
With reference to Qiu et al. (2018) and Li et al. (2020), the benchmark model of this paper is set as follows:
Among them, the subscript indicates the -th bank, and t indicates the t-year. The explanatory variable risk indicates the bank’s risk-taking, including Z-Score and Volatility of Return on Assets (SDROA). The core explanatory variable Fintech represents the degree of Fintech development in the city where the bank is registered, including the breadth of the digital financial index (Fintech 1) and credit level (Fintech 2). Bank is a control variable at the bank level, including bank size (Size), asset-liability ratio (DAR), capital adequacy ratio (CAR), net operating margin (Netprf), cost-income ratio (CIR), non-interest income ratio (NIRR), saving-asset ratio (SAR). City represents city-level control variables, including regional per capita GDP (PGDP), and regional deposits and loans total wage ratio (FinDev). Policy is a macro-level control variable, including broad money growth rate (M2) and economic policy uncertainty index (EPU). Where is the individual fixed effect of the bank, because the regional fixed effect will be absorbed by the individual fixed effect of the bank, so it also essentially controls the regional fixed effect. Where represents the fixed effect of time, and denotes factors not being observed that change over time (except Policy). The random error term is represented by . According to this hypothesis, the expected coefficient significantly negative.
6. Empirical Results Analysis
6.1. Benchmark Regression Results
Table 3 reports the benchmark regression results of regional Fintech development affecting bank risk taking. We also report the regression results of the random effects and fixed effects models to test the correlation between the two from more dimensions.
The four regression results show that the development of regional Fintech has a significant inhibitory effect on bank risk taking. Under the two-way fixed effect model, the correlation coefficient between Fintech 1 and bank risk Z-Score is −0.0102, and significantly negative at the 10% level. This shows that the development of regional Fintech can reduce the risks faced by commercial banks, and the overall operating stability of banks will be improved. From this point of view, Fintech has promoted a series of changes such as the expansion of banking business boundaries and the transformation of banking business models, improved the bank’s operating efficiency and profit income, and also improved the bank’s operating stability. This can be proved by the correlation between net operating rate of Netprf and bank risk Z-score. Due to its regression coefficient is −0.000455, and significant at the significance level of 1%, indicating that an increase in the operating net profit margin can inhibit the risk taking of commercial banks. For bank size (size), two models show a significant positive relationship, one model shows a significant negative relationship, and one model shows no significance. Therefore, it is necessary to carry out group regression according to the size of banks and investigate the true relationship between bank size and bank risk. The bank’s asset-liability ratio (DAR) has a significant positive impact on the bank’s risk exposure. Excessive bank debt levels will increase the bank’s risk-taking. All four models show that the bank’s capital adequacy ratio, CAR, has a significant positive correlation with banks’ risk-taking, and banks’ increased capital adequacy will actually increase the bank’s risk-taking. We believe that a bank’s higher capital adequacy ratio means that the bank receives relatively less capital support from the inside when carrying out asset business, and the external capital cost is higher than the internal, which reduces the bank’s operating profit margin. Their pursuit of high profits will increase their risk appetite, thus making the overall risk of banks present an upward trend. There is a significant positive relationship between bank non-interest income ratio (NIRR) and bank risk exposure. For banks, interest income is their most traditional and major source of income. The development of Fintech has narrowed the spread between deposits and loans, forcing banks to expand operating income beyond spread income. However, these businesses have higher instability and risk, which has increased the risk exposure of banks. Bank cost-to-income ratio CIR, liquidity SAR, and bank risk generally show a negative relationship. In addition, the regression results show that there is no significant correlation between the control variables at the city level and the macro level and the bank’s risk taking. This shows that for regional small and medium banks such as city commercial banks and rural commercial banks, the quality of the meso-economic and macro-economic environment has little impact on their operations, and factors at the individual level of the bank have a decisive role in their risk behavior. We performed a Wald test of the benchmark regression model, Please see Appendix E.
6.2. Endogenous Inspection
The level of Fintech development is a macro variable at the city level, which is little affected by the risk behaviors at the individual level of banks, but there may still be some uncontrollable factors that cause endogenous problems (Li et al. 2020). Therefore, we use the instrumental variable method to control the endogenous problem.2 Specifically, this article selects the Urban Innovation Index (Innovation) compiled by the Industrial Development Research Center of Fudan University as a tool variable. In order to avoid the influence of outliers, tail shrinking is carried out. The index is compiled based on the updated information of the legal status of authorized patents for micro-inventions of the state intellectual property office, as well as the annual fee structure data of invention patents of different ages, which can well reflect urban patent renewal behavior and quality differences. There are two main reasons for choosing this index as an instrumental variable: (i) first, the index is compiled based on the number of urban patents. These patents include not only the financial industry, but also high-tech industries, such as electronic equipment, computers, and communications, and these are the hardware facilities and technical foundations on which Fintech development depends. Therefore, the index is highly correlated with the degree of Fintech development; (ii) second, this indicator is not an economic and financial indicator, it is not directly related to bank behavior, therefore, there is a certain extraneous relationship between the index and bank risk-taking.
Based on the double fixed effect model, this paper chooses two-stage least squares (2SLS) method for regression estimation. The variable settings are shown in Table 4.
The regression results of the instrumental variables are shown in Table 5. Column (1) in the table shows, the correlation coefficient between exogenous instrumental variables urban innovation index (Innovation) and the explained variable bank risk-taking (Z-Score) does not pass the significance test. This shows that there is no correlation between the two, and the instrumental variable of urban Innovation index is exogenous. Column (2) in the table shows the regression results of the first stage. The results state that there is a significant correlation between Urban Innovation Index and Fintech 1, the degree of Fintech development it replaces. Therefore, this fully shows that the instrumental variables satisfy both exogenous and correlation requirements. Column (3) in the table replaces the original Fintech 1 with the fitted values Fintech 1_hat of all regression results in the first stage, and performs regression with the explained variable Z-Score. The results show that the correlation coefficient between Fintech development degree and bank risk taking is −0.0169861, which is significantly correlated at the level of 5%. After considering the possible endogenous problems between Fintech and bank risk, the development of Fintech can significantly curb banks’ risk-taking, which is consistent with the previous results.
6.3. Robustness Test
In order to further verify the robustness of benchmark regression, three robustness tests are performed in this paper. Please refer to Appendix C for the specific method description of the robustness test. In the first test, select the standard deviation of the average return on total assets (SDROA) instead of Z-Score as the proxy variable for bank risk exposure. Regression on the above replacement index, the results are shown in Table 6. As can be seen from the table, the four models all show that there is a significant negative correlation between Fintech 1 (regional financial technology development level) and SDROA. The results of this robustness test support the basic conclusion of baseline regression.
The second test is to select Fintech 2 (the regional Fintech index) to replace Fintech 1 as the proxy variable of regional Fintech development degree. Regression on the above-mentioned replacement indicators is shown in Table 7. Similarly, all four models show a negative correlation between Fintech 1 (regional financial technology development level) and Z-Score (bank’s risk-taking). Models (1), (2), and (3) show significant correlations. We believe that the results of the second robustness test also support the basic conclusions of benchmark regression.
The third test is to remove 10 banks whose registered places are municipalities (Beijing, Shanghai, Tianjin, and Chongqing), and the results after the regression are shown in Table 8. It can be seen that the four models all show a significant negative correlation between Fintech 1 (regional financial technology development level) and Z-Score (bank risk-taking). The results of the third robustness test also support the basic conclusions of benchmark regression.
7. Further Analysis
7.1. Heterogeneity Test
In order to more accurately assess the differential impact of Fintech on bank risk-taking, referring to the practices of Guo and Shen (2019), this paper investigates regional differences, scale differences and institutional differences.
7.1.1. Regional Development Differences
Based on the objective facts of imbalanced regional development in China, this article divides the city where the bank is registered into three regions: the eastern region, the central region, and the western region. Moreover, we conduct a heterogeneous analysis of the impact of financial technology development in different regions on bank’s risk-taking. Considering that the regional fixed effect of the bank registration place will be absorbed by the individual fixed effect of the bank, the division of the region has essentially locked the individual fixed effect of the bank. This paper chooses the time fixed effect model for regression (see Table 9 for the results). The results show that in the eastern and western regions, there is a significant negative correlation between the level of Fintech development and banks’ risk-taking, while the regression coefficient in the central region has not passed the significance test. The likely explanation is that the eastern region has a high level of Fintech development, which helps reduce bank’s risk-taking. The western region is strongly supported by policies, and Fintech is developing rapidly, so it also shows a restraining effect on bank risks. Although some provinces and cities in the central region have seen the phenomenon of ‘the rise of the central region’ in Fintech (Guo et al. 2019), their development level is lower than that of the east, and its development speed is lower than that of the west, so it has not shown a restraining effect on bank risks.
We then divide the city where the bank is registered (excluding municipalities) into provincial capital cities and non-provincial capital cities. Then we conduct a heterogeneous analysis on the impact of urban Fintech development at different administrative levels on Banks’ risk-taking. The regression results of the time-fixed effect model are shown in Table 10. The results show that in non-provincial capital cities, there is a significant negative correlation between the level of Fintech development and bank risk-taking; however, the regression coefficient of provincial capital cities has not passed the significance test. The likely explanation is that provincial cities have higher administrative levels, their regional Banks have more high-quality customers, receive more administrative protection such as guarantees from local governments, and lack the incentive and impulse to apply new technologies to reduce bank risks. For banks in non-provincial capital cities, due to the lack of the above conditions, their incentives to use Fintech to suppress bank risks are greater.
7.1.2. Heterogeneity of Bank Size
Liu et al. (2014) believe that China’s large banks and small and medium banks are far from each other in terms of property rights structure, target customers, and policy constraints. This paper examines the relationship between Fintech and bank risk from the perspective of bank size heterogeneity. Although the research objects of this paper are regional urban commercial banks and rural commercial banks, in this banking group, the size of banks also has a large span. To this end, this paper takes the median of bank asset size as the cut-off point and divides the sample of regional banks into two parts. Banks greater than or equal to this cut-off point are large-scale banks, while those lower than this cut-off point are small-scale banks. Considering that the division of bank size does not control the time effect and individual effect, we select the random effect model for heterogeneity analysis (The results are shown in Table 11).
The results show that, for large Banks, there is a significant negative correlation between regional Fintech development level and banks’ risk-taking. However, the regression coefficient of small banks did not pass the robustness test, and there was no significant correlation between them. This shows that the phenomenon that the development of Fintech inhibits the risk-taking of banks exists in large-scale banks, but not in small-scale banks. In other words, the development of Fintech will have a greater impact on small and medium-sized banks, which verifies the research hypothesis 1.
7.1.3. Heterogeneity Analysis Based on the Banking System
The research samples in this article are urban commercial banks and rural commercial banks. Although urban commercial banks and rural commercial banks are all belong to regional banks, there are obvious differences between them. Generally speaking, urban commercial banks are transformed from urban credit cooperatives, mostly distributed in urban areas, and controlled by the local government where they are registered. The rural commercial banks are mostly converted from rural credit cooperatives, and they are mostly distributed in rural areas, subject to the restrictions of the provincial federations where they are registered. Normally, compared with rural commercial banks, urban commercial Banks have larger asset scale, wider business scope, more concentrated customer groups, and better development prospects, but they also bear greater competitive pressure. Therefore, considering the difference between the two, the samples studied in this paper are naturally divided into urban commercial banks and rural commercial banks according to their nature. Since the individual effect of the bank has been determined, we use the time-fixed effect model for heterogeneity analysis (the results are shown in Table 12).
Regression results show that, whether in city commercial banks or rural commercial banks, there is a significant negative correlation between the level of regional Fintech development and bank risk-taking. This means that the development of Fintech reduces the risk-taking of banks, and it also exists in urban commercial banks and rural commercial banks. Further comparative analysis shows that the regression coefficient of Fintech development level of urban commercial banks is −0.0350, while that of rural commercial banks is −0.0236. This suggests that while Fintech has a dampening effect on overall bank risk, it is more pronounced among city commercial banks. The possible reason is that the scale of urban commercial banks is generally larger than that of rural commercial banks, and the customer groups faced by urban commercial banks are better. Therefore, the financial technology of urban commercial banks has a stronger effect on curbing bank risks than rural commercial banks.
7.2. Mechanism Inspection
Referring to the practice of Gu and Yang (2018), the intermediary effect test procedure is used to examine the transmission mechanism of Fintech development affecting bank risk-taking.
7.2.1. Based on the Intermediary Effect Test within the Bank
This paper uses the internal interest margin (NIM) and the governance cost (Governance) as the intermediary variables to test the conduction path. Table 13 shows the regression results of the mediation effect. Column (1) is not included in the intermediate variable NIM. The results show that the total effect of Fintech 1 (Fintech level) on Z-Score (bank’s risk-taking) is −0.0249, and it is significant at the level of 1%. Column (2) shows that Fintech 1’s effect on the mediating variable NIM is −0.463, and it is significant at the level of 10%. After the median variable NIM is included in column (3), the coefficients of Fintech 1 and NIM are significant. The direct effect of Fintech 1 on Z-Score is −0.0240, and the direct effect of NIM on Z-Score is 0.00170. Comparing the columns (1) and (3), after including the intermediary variables, the regression coefficient of the core explanatory variable Fintech 1 decreased, but both were significant. Therefore, the bank’s net interest margin is part of the intermediary factor that Fintech affecting bank risk, and the intermediary effect accounts for 3.614%. Similarly, Columns (4), (5), and (6) are listed as the regression results of the inclusion of Governance (governance costs). The coefficients before and after the inclusion are significant, and the management cost is also a part of the mediation factor that influences bank risk in Fintech. Moreover, the mediation effect accounts for 11.217%. Therefore, the results of this paper support hypothesis 2.
7.2.2. Based on the Intermediary Effect Test Outside the Bank
In this paper, we use the external market competition intensity (HHI) and residents’ willingness to save (PSaving) as the intermediate variables to test the transmission channels. For the measurement of bank competition intensity, the commonly used Herfindahl-Hirschman index (HHI) is selected as the proxy variable, and the market share is calculated by the number of branches of each bank. For households’ willingness to save, regional per capital saving (PSaving) is selected as the proxy variable. Table 14 shows the test results of the mediation effect model. The mediating variable HHI was not included in column (1).The results showed that the total effect of Fintech 1 on z-score is −0.0141, which is significant at the 1% level. Column (2) shows that the effect of Fintech 1 on HHI is −0.0182, and it is significant at the level of 1%. By comparing the coefficient size of the core explanatory variable Fintech 1 in columns (1) and (3), the regression coefficient of Fintech 1 increased after the mediation variable was included. This means Fintech further controls banking risks by strengthening competitive channels, which is in line with the view of ‘competitive vulnerability theory’. Similarly, items (4), (5), and (6) are listed as the regression results of the per capital savings (PSaving), and the regression coefficient of Fintech 1 after inclusion is significantly higher than before. This illustrate that Fintech boosts households’ willingness to save and causes bank deposits to move, further increasing bank risks. Therefore, the research results of this paper support hypothesis 3.
8. Conclusions and Policy Recommendations
In the context of the continuous innovation of block-chain, artificial intelligence, 5G, and other emerging technologies that have brought greater impact to the business scope, business model and risk behavior of traditional banks, research on the relationship between Fintech and small and medium-sized banks risk-taking is of great significance.
This paper uses the short panel data of 155 local SME banks from 2011 to 2016 and the digital financial index compiled by the Digital Finance Research Center of Peking University to evaluate the causal connection, transmission mechanism and heterogeneity between the development of Fintech and bank risk-taking. The main conclusions of this study are as follows: (1) there is a significant negative correlation between Fintech development level and bank risk-taking, that is, the development of Fintech will reduce the bank’s risk-taking and improve the overall stability of the bank’s operations. After considering the existing endogenous problems and the robustness test, this relationship still holds. (2) The impact of Fintech on bank risk-taking is heterogeneous. This article analyzes the Fintech development level of the eastern, western and central regions of China and banks of different sizes. It can be found that the Fintech level of the eastern and western regions can reduce the risk of banks more than the central regions. The development of Fintech has a greater impact on small and medium-sized banks. From the perspective of institutional differences, Fintech has a restraining effect on the overall risk of banks, and the restraining effect of city commercial banks is stronger than that of rural commercial banks. (3) The transmission path of Fintech’s influence on banks’ risk-taking mainly includes internal channels and external channels of banks. The results show that the net interest margin and management costs within banks are part of the intermediary factors of Fintech affecting bank risk. In effect, the external market competition channels of banks will suppress bank risks, while the households’ willingness to save channels will amplify bank risks.
In general, our article and other researchers have found that the level of Fintech has heterogeneity for different types of bank risk-taking, and some scholars have even proposed an inverted U-curve relationship between them. Regarding the impact of Fintech on banks of different sizes, it is also agreed by academia that the impact on small and medium-sized banks will be greater. The main innovation of this article are as follows. First of all, compared with the development of internet finance, this article pays more attention to the impact of the technical characteristics of Fintech on the financial industry, we created a households’ welfare utility function to illustrate the impact of Fintech on the traditional financial system. For example, the P2P online lending platform has faced many risks such as credit risk and fundraising risk since its inception, but data-based risk control models established through big data such as “microfinance credit management cloud service platform” and “Bojinyun risk control system” are effectively monitoring funds and reducing risks. Secondly, for this technological impact, this article pays more attention to the behavior of small and medium-sized banks. Finally, we conduct in-depth excavations on the basis of the channels and mechanisms through which the development of Fintech affects bank risk-taking.
In light of our research conclusions, we give the following policy implications and suggestions: (1) Facing the competition and impact of Fintech, traditional banks should actively embrace Fintech and adapt to the new technological revolution. Small and medium-sized Banks can conduct in-depth cooperation with technology companies, and large Banks can set up teams for independent research and development. Apply Fintech in a variety of ways, innovate business models, improve customer experience, and quickly realize the digital transformation of banks themselves. (2) Fintech has a positive impact on bank risks, but the negative impact cannot be ignored. Banks should absorb the positive spillover effects of Fintech. Building a bank risk early warning platform and risk monitoring mechanism through new technologies, such as big data mining, improve the bank risk management level. Meanwhile we must also pay attention to preventing the negative spillover effects of Fintech. Through the use of big data, artificial intelligence and other advanced technology to take precautions against risks before and after the event, and build a firewall mechanism to resist the spread and transmission of Fintech risks. (3)The state gives preferential policies to the central and western regions and backward regions to develop financial technology. Through policy support to narrow regional differences, promote the balanced development of Fintech and drive the all-round development of inclusive finance, and then create a benign economic environment and financial conditions for the stable operation and risk management of banks. (4) Rural commercial banks have a higher risk tolerance and are more vulnerable to the impact of financial technology. To this, we should increase policy preferences for rural financial institutions such as rural commercial banks, rural credit cooperatives, and village and town banks. Establish a rural financial service system based on government supervision departments, rural financial institutions and rural economic entities, and coordinate the tripartite relationship to strengthen government supervision, improve the efficiency of rural financial institutions, and optimize the credit reporting system of rural economic entities, thereby forming a safe and efficient rural financial service system. (5) Fintech has dual factors of finance and technology. The combination of financial fragility and creative disruptive characteristics of technology may lead to more disruptive financial instability. To this end, government regulators must not only encourage the use and progress of Fintech, but also necessary to strengthen the supervision of new financial services of commercial banks and Fintech companies. Borrow from the idea of a ‘regulatory sandbox’, regulators can use new technologies to strengthen supervision of financial innovation and strike a balance between standardizing financial innovation and maintaining financial stability.
Author Contributions
Conceptualization, L.D. and Y.L. (Yongbin Lv); methodology, L.D.; software, Y.L. (Yongbin Lv) and Y.L. (Ye Liu); validation, Y.L. (Ye Liu) and Y.Z., and Y.Z.; formal analysis, L.D.; investigation, Y.L. (Ye Liu); resources, Y.L. (Ye Liu); data curation, Y.L. (Yongbin Lv) and Y.L. (Ye Liu); writing—original draft preparation, Y.Z.; writing—review and editing, Y.Z.; visualization, Y.L. (Yongbin Lv); supervision, L.D. and Y.L. (Yongbin Lv); project admin-istration, Y.L. (Yongbin Lv); funding acquisition, L.D. All authors have read and agreed to the published version of the manuscript.
Funding
This research was funded by The National Social Science Fund of China, grant number no. 19BGL002, and the APC was funded by no. 19BGL002.
Institutional Review Board Statement
Not applicable.
Informed Consent Statement
Not applicable.
Data Availability Statement
Not applicable.
Conflicts of Interest
The authors declare no conflict of interest.
Appendix A. Describing Data

Table A1.
Data used at the bank level from 2011 to 2016.
| Variable Type | Variable Name | Variable Symbol | Variable Calculation Method |
|---|---|---|---|
| Bank data used in the explained variable | The return on total assets | ROA | From Wind Economic Database |
| The ratio of capital to assets | CAR | From Wind Economic Database | |
| The standard deviation of the return on total assets | SDROA | From Wind Economic Database | |
| Bank data used in the Intermediary variables | Management ability | Governance | ln (governance fees) |
| Bank competition intensity | HHI | Regional Herfindahl index | |
| Household propensity to save | PSaving | Total savings of local residents/district population | |
| Bank data used in the core explanatory variable | Capital adequacy ratio | CAR | Net bank capital/risk-weighted assets × 100 |
| Capital adequacy ratio | CAR | Net bank capital/risk-weighted assets × 100 | |
| Net operating margin | Netprf | Net profit/operating revenues × 100 | |
| Cost-to-income ratio | CIR | Operating cost/operating revenue × 100 | |
| Proportion of non-interest income | NIRR | Non-interest income/operating revenue × 100 | |
| Proportion of non-interest income | NIRR | Non-interest income/operating revenue × 100 | |
| Liquidity of funds | SAR | Bank balance/total bank assets × 100 |
Appendix B. Symbols and Their Meaning
Table A2.
Symbols and Their Meaning.
| Symbol | Meaning | |
|---|---|---|
| Symbol | Total wealth | |
| Remanufacturer’s recovery cost | ||
| represents intermediary agency, b represents a large-scale intermediary agency s represents a small-scale intermediary agency | ||
| The number of asset managers The number of Robo-Advisors The number of traditional managers | ||
| The return of intermediaries investing on technology | ||
| fixed cost, | ||
| the relationship cost of working with a household, | ||
| is the fee paid to the investment manager | ||
| the net profit of any intermediary, | ||
| The return of robot advisors have access to the investment technology | ||
| The fixed entry cost of Robo-Advisors | ||
| the net profit of any intermediary | ||
| Num | The index to measure the intensity of competition | |
| pro | The index to measure the intensity of competition |
Appendix C. Robustness Test
In the Table A3, we list the heterogeneity test methods used in this article.
Table A3.
Robustness test.
| The Type of Robustness Test | Practice in the Text | The Reason |
|---|---|---|
| Variable substitution method | Replace the explained variable with SDROA | There are many ways to measure a variable, in order to enhance the reliability of the conclusion. We replace the dependent variable and independent variable respectively to verify the robustness of the results of this paper. |
| Replace the core explanatory variable with Fintech 2 | ||
| Change sample size | Remove the bank whose registered place is the municipality | Because the existence of extreme values in the sample will affect our results. Therefore, in the robustness test, we need to eliminate individual outliers, or select the most suitable sample for our research purposes in the sample to test whether our conclusions are still robust. |
Appendix D. Stata Measurement Software
This article chooses Stata measurement software for empirical analysis.
Table A4.
Metrology software used in this article.
| The Name of Software | The Advantage of Stata | Data Characteristics |
|---|---|---|
| Stata | Stata is a package that many beginners and power users like because it is both easy to learn and yet very powerful; Stata has numerous powerful yet very simple data management commands that allows you to perform complex manipulations of your data with ease; The greatest strengths of Stata are probably in regression (it has very easy to use regression diagnostic tools) | This article has many variables and complex data, it is more convenient to use Stata to perform regression. |
Appendix E. Wald Test
We performed a Wald test of the benchmark regression model. Table A5 shows the test results of the core explanatory variable being Fintech 1; Table A6 shows the test results of the core explanatory variable being Fintech 2. When the core explanatory variable is Fintech 1, the p-value of the Wald Test in the benchmark model is less than 0.01, which means it is significant at the 1% level, thus rejecting the null hypothesis.
Table A5.
Wald test (Fintech 1).
| Explained Variable | F-Value | p-Value |
|---|---|---|
| Z-Score | 15.55 | 0.0000 |
| SDROA | 30.58 | 0.0018 |
Source: own calculations. Software: Stata.
When the core explanatory variable is Fintech 2, the p-value of the Wald Test in the benchmark model is less than 0.01, which means it is significant at the 1% level, thus rejecting the null hypothesis.
Table A6.
Wald test (Fintech 2).
| Explained Variable | F-Value | p-Value |
|---|---|---|
| Z-Score | 15.56 | 0.0000 |
| SDROA | 29.66 | 0.0018 |
Source: own calculations. Software: Stata.
References
- Acharya, Ram N., and Albert Kagan. 2004. Community Banks and Internet Commerce. Journal of Internet Commerce 3: 23–30. [Google Scholar] [CrossRef]
- Allen, Franklin, and Douglas Gale. 2000. Financial Contagion. Journal of Political Economy 1: 1–33. [Google Scholar] [CrossRef]
- Beltratti, Andrea, and René M. Stulz. 2009. Why Did Some Banks Perform Better During the Credit Crisis? A Cross-Country Study of the Impact of Governance and Regulation; National Bureau of Economic Research Working Paper 15180. National Bureau of Economic Research. Available online: https://www.nber.org/papers/w15180 (accessed on 13 February 2021).
- BIS. 2019. Annual Economic Report: Promoting Global Monetary and Financial Stability. Printed in Switzerland, Werner Druck & Medien AG, Basel. Basel: BIS. [Google Scholar]
- Buchak, Greg, Gregor Matvos, Tomasz Piskorski, and Amit Seru. 2018. Fintech, Regulatory Arbitrage, and the Rise of Shadow Banks. Journal of Financial Economics 130: 453–83. [Google Scholar] [CrossRef]
- Chen, Mark A., Qinxi Wu, and Baozhong Yang. 2019. How Valuable Is Fintech Innovation? The Review of Financial Studies 32: 2062–106. [Google Scholar] [CrossRef] [Green Version]
- Claessens, Stijn, M. Ayhan Kose, and Marco E. Terrones. 2012. How do business and financial cycles interact? Journal of International Economics 87: 178–90. [Google Scholar] [CrossRef] [Green Version]
- Dapp, Thomas F. 2014. Fintech: The digital (r)evolution in the financial sector. Deutsche Bank Research 11: 1–39. [Google Scholar]
- Fang, Yi, Shengmin Zhao, and Xiaowen Xie. 2012. Analysis of Banking Risk Assurance of Monetary Policy: Concurrently Discussing the Coordination of Monetary Policy and Macro-prudential Policy. Management World 11: 9–19. [Google Scholar]
- FSB (Financial Stability Board). 2017. Fintech. Research Report. Available online: https://www.fsb.org/work-of-the-fsb/financial-innovation-and-structural-change/fintech/ (accessed on 3 May 2021).
- Gomber, Peter, Robert J. Kauffman, Chris Parker, and Bruce W. Weber. 2018. On the Fintech Revolution: Interpreting the Forces of Innovation, Disruption, and Transformation in Financial Services. Journal of Management Information Systems 35: 220–65. [Google Scholar] [CrossRef]
- Gu, Haifeng, and Lixiang Yang. 2018. Internet Finance and Banking Risk-taking: Based on evidence from the Chinese banking industry. World Economy 10: 75–100. [Google Scholar]
- Guellec, Dominique, and Caroline Paunov. 2017. Digital Innovation and the Distribution of Income. NBER Working Paper 23987. Cambridge: National Bureau of Economic Research. [Google Scholar]
- Guo, Ye, and Chen Liang. 2016. Blockchain application and outlook in the banking industry. Financial Innovation 24: 1–12. [Google Scholar] [CrossRef] [Green Version]
- Shen, Yue, and Guo Pin. 2015. Internet Finance, Technology Spillover and Total Factor Productivity of Commercial Banks. Finance Research 3: 160–75. [Google Scholar]
- Guo, Pin, and Yue Shen. 2019. Internet Finance, Deposit Competition and Banking Risk-taking. Financial Research 8: 58–76. [Google Scholar]
- Guo, Feng, Jingyi Wang, Fang Wang, Tao Kong, Xun Zhang, and Zhiyun Cheng. 2019. Measurement of China’s Digital Inclusive Financial Development: Index Compilation and Spatial Features. China Economic Quarterly 19: 1401–1418. [Google Scholar]
- Huang, Yiping, and Zhuo Huang. 2018. Digital Finance Development in China: Present and Future. Economics 4: 1489–502. [Google Scholar]
- Jakšič, Marko, and Marinč Matej. 2019. Relationship banking and information technology: The role of artificial intelligence and Fintech. Risk Management 21: 1–18. [Google Scholar] [CrossRef]
- Julapa, Jagtiani, and Catharine Lemieux. 2018. Do Fintech Lenders penetrate areas that are underserved by tradition banks? Journal of Economics and Business 100: 43–54. [Google Scholar]
- Kou, Zonglai, and Xueyue Liu. 2017. China City and Industry Innovation Report 2017; Shanghai: Industrial Development Research Center of Fudan University. Available online: http://www.cbnri.org/news/5389402.html (accessed on 5 January 2021).
- Lapavitsas, Costas, and Paulo L. Dos Santos. 2008. Globalization and Contemporary Banking: On the Impact of New Technology. Contributions to Political Economy 27: 31–56. [Google Scholar] [CrossRef]
- Li, Chuntao, Xuwen Yan, Min Song, and Wei Yang. 2020. Fintech and Enterprise Innovation: Evidence from NEEQ Listed Companies. China Industrial Economy 1: 81–98. [Google Scholar]
- Liu, Liya, Minghui Li, Sha Sun, and Jinqiang Yang. 2014. Research on The Relationship Between Net Interest Margin and Non Interest Income of China’s Banking Industry. Economic Research 49: 110–24. [Google Scholar]
- Ma, Yong, and Zhen Li. 2019. Liquidity and Banking Risk-taking: Empirical Evidence from China’s Banking Industry. Finance and Trade Economy 7: 67–81. [Google Scholar]
- Marcus, Alan J. 1984. Deregulation and bank financial policy. Journal of Banking & Finance 8: 557–65. [Google Scholar]
- Mishkin, Fredric S., and Philip E. Strahan. 1999. Global financial instability: Framework, events, issues. Journal of Economic Perspectives 13: 193–201. [Google Scholar] [CrossRef] [Green Version]
- Petter, Gottschalk, and Geoff Dean. 2009. A review of organised crime in electronic finance. International Journal of Electronic Finance 3: 46–63. [Google Scholar]
- Philippon, Thomas. 2015. The Fintech Opportunity; National Bureau of Economic Research Working Paper. Cambridge: National Bureau of Economic Research. Available online: http://www.nber.org/papers/w22476 (accessed on 5 March 2021).
- Philippon, Thomas. 2019. On Fintech and Financial Inclusion. NBER Working Paper. Available online: https://www.nber.org/papers/w26330 (accessed on 13 January 2021).
- Pi, Tianlei, and Tie Zhao. 2014. Internet Finance: Category, revolution and Prospect. Finance & Economics 6: 22–30. [Google Scholar]
- Pierri, Nicola, and Yannick Timmer. 2020. Tech in Fin before Fintech: Blessing or Curse for Financial Stability? International Monetary Fund Working Paper 8067. International Monetary Fund. Available online: https://ssrn.com/abstract=3623873 (accessed on 14 March 2021).
- Qiu, Han, Yiping Huang, and Yang Ji. 2018. The Impact of Fintech on Traditional Banking Behaviors: From the Perspective of Internet Finance. Financial Research 11: 17–29. [Google Scholar]
- Roger, Lagunoff, and Stacey L. Schreft. 1999. Financial Fragility with rational and irrational Exuberance. Journal of Money, Credit and Banking 31: 531–60. [Google Scholar]
- Inna, Romānova, and Marina Kudinska. 2016. Banking and Fintech: A Challenge or Opportunity? In Contemporary Issues in Finance: Current Challenges from Across. Bingley: Emerald Group Publishing Limited. [Google Scholar]
- Schumpeter, Joseph Alois. 1912. Theorie Der Wirtschaftlichen Entwicklung. München und Leipzig: Duncker & Humblot. [Google Scholar]
- Sheng, Tianxiang, and Conglai Fan. 2020. Financial Science and Technology, Optimal Banking Market Structure and Credit Supply of Small and Micro Enterprises. Financial Research 6: 114–32. [Google Scholar]
- Shi, Bingzhan, and Xiangyi Jin. 2019. Attention disposition, Internet Search and International Trade. Economic Research Journal 54: 71–86. [Google Scholar]
- Song, Min, Peng Zhou, and Haitao Si. 2021. Fintech and firm total factor productivity: A perspective of “enabling” and credit rationing. China Industrial Economics 4: 138–55. [Google Scholar]
- Wang, Xun, and Anders Johansson. 2013. Financial Repression and Economic Structural Transformation. Economic Research 1: 54–67. [Google Scholar]
- Xie, Ping, and Chuanwei Zou. 2012. Research on Internet Finance Model. Financial Research 12: 11–22. [Google Scholar]
- Xu, Mingdong, and Xuebin Chen. 2012. Monetary environment, basic adequacy ratio and risk taking of commercial banks. Financial Research 7: 48–62. [Google Scholar] [CrossRef]
- Yao, Ting, and Liangrong Song. 2020. The Impact of Financial Technology on The Risk of Commercial Banks and Its Heterogeneity. Journal of Yunnan University of Finance and Economics 36: 53–63. [Google Scholar]
- Zhang, Xuelan, and Dexu He. 2012. Monetary Policy Position and Bank Risk-taking: An Empirical Study Based on Chinese Banking Industry. Economic Research 5: 31–44. [Google Scholar]
- Zhang, Yilin, Yifu Lin, and Qiang Gong. 2019. Enterprise Scale, Bank Scale and Optimal Banking Industry Structure—Based on The Perspective of New Structural Economics. Management World 3: 31–47. [Google Scholar]
| 1 | This article introduces the cross-multiplying terms of internet penetration and financial technology development to examine the moderating effect of regional internet penetration on the correlation between financial technology and bank risk. |
| 2 | This paper also uses one-stage lag independent variable to weaken the endogenous problem. Due to space limitations, we will not go into details. |
Figure 1.
Z-score trend of Fintech and bank risk.

Figure 2.
Z-Score trend of different types of bank risks. Software: MATLAB.

Table 1.
Variable selection and definition.
| Variable Type | Variable Name | Variable Symbol | Variable Meaning |
|---|---|---|---|
| Explained variable | Z | Z-Score | ln (Z + 1) |
| Volatility of return on assets | SDROA | ln (SDROA + 1) | |
| Core explanatory variable | Fintech level | Fintech 1 | ln (the coverage breadth dimension of regional digital finance index) |
| Fintech 2 | Refer to Li et al. (2020) | ||
| Instrumental variable | Urban innovation index | Innovation | Refer to Kou and Liu (2017) |
| Intermediary variables | Net interest margin | NIM | Net interest income/average interest-bearing assets × 100 |
| Management ability | Governance | ln (governance fees) | |
| Bank competition intensity | HHI | Regional Herfindahl index | |
| Household propensity to save | PSaving | Total savings of local residents/district population | |
| Bank-level control variables | Bank size | Size | ln (total bank assets) |
| Asset-liability ratio | DAR | Total bank liabilities/total bank assets × 100 | |
| Capital adequacy ratio | CAR | Net bank capital/risk-weighted assets × 100 | |
| Net operating margin | Netprf | Net profit/operating revenues × 100 | |
| Cost-to-income ratio | CIR | Operating cost/operating revenue × 100 | |
| Proportion of non-interest income | NIRR | Non-interest income/operating revenue × 100 | |
| Liquidity of funds | SAR | Bank balance/total bank assets × 100 | |
| City-level control variables | Level of economic development | PGDP | ln(GDP per capita) |
| Degree of financial development | FinDev | (Total regional deposits + total regional loans)/total wages of all employees | |
| Macro-level control variables | Monetary Policy Trend | M2 | Broad money growth rate |
Table 2.
Descriptive statistics of variables.
| Variable Name | Average | Standard Deviation | Median | Minimum | Maximum | Observed Value |
|---|---|---|---|---|---|---|
| Z-Score | 0.019 | 0.025 | 0.015 | 0.001 | 0.613 | 898 |
| SDROA | 0.002 | 0.002 | 0.001 | 0.000 | 0.026 | 904 |
| Fintech 1 | 4.925 | 0.434 | 5.034 | 2.692 | 5.515 | 930 |
| Fintech 2 | 3.210 | 1.460 | 3.260 | 0.000 | 15.78 | 909 |
| Innovation | 42.56 | 93.66 | 13.72 | 0.099 | 1061 | 930 |
| Internet | 0.274 | 0.203 | 0.214 | 0.018 | 1.386 | 930 |
| NIM | 3.275 | 1.227 | 3.100 | −0.040 | 13.42 | 899 |
| Governance | 2.407 | 0.093 | 2.411 | 2.128 | 2.640 | 902 |
| HHI | 0.114 | 0.040 | 0.106 | 0.055 | 0.250 | 930 |
| PSaving | 5.690 | 3.761 | 4.759 | 0.949 | 24.29 | 930 |
| Size | 15.69 | 1.225 | 15.70 | 12.13 | 19.17 | 926 |
| DAR | 92.19 | 2.518 | 92.58 | 58.04 | 96.99 | 926 |
| CAR | 14.32 | 14.80 | 13.16 | 5.550 | 446.0 | 890 |
| Netprf | 33.74 | 9.642 | 34.45 | −56.89 | 56.43 | 923 |
| CIR | 33.48 | 7.653 | 32.92 | 14.83 | 152.9 | 921 |
| NIRR | 17.69 | 16.76 | 12.15 | −5.340 | 101.6 | 900 |
| SAR | 73.81 | 11.18 | 74.64 | 33.26 | 101.5 | 924 |
| PGDP | 1.906 | 0.666 | 1.833 | −1.905 | 3.525 | 930 |
Source: winds. Software: Source: own calculations. Software: Stata.
Table 3.
Benchmark model regression results.
| (1) Random Effect | (2) Individual Fixed Effect | (3) Time-Fixed Effect | (4) Two-Way Fixed Effect | |
|---|---|---|---|---|
| Fintech 1 | −0.00419 ** | −0.00977 *** | −0.0141 *** | −0.0102 * |
| (−2.39) | (−3.40) | (−3.15) | (−1.76) | |
| Size | −0.00233 *** | 0.00524 * | −0.00222 *** | 0.00504 |
| (−3.29) | (1.68) | (−3.21) | (1.26) | |
| DAR | 0.00113 *** | 0.00101 *** | 0.00111 *** | 0.000994 ** |
| (4.31) | (2.70) | (4.26) | (2.48) | |
| CAR | 0.000105 *** | 0.000136 *** | 0.000108 *** | 0.000134 *** |
| (3.34) | (4.21) | (3.44) | (4.04) | |
| Netprf | −0.000402 *** | −0.000452 *** | −0.000389 *** | −0.000455 *** |
| (−7.27) | (−4.85) | (−6.85) | (−4.61) | |
| CIR | −0.000129 ** | −0.0000276 | −0.000109 * | −0.0000292 |
| (−1.98) | (−0.22) | (−1.64) | (−0.22) | |
| NIRR | 0.0000638 ** | 0.0000711 * | 0.0000516 ** | 0.0000709 * |
| (2.45) | (1.85) | (1.97) | (1.84) | |
| SAR | −0.000182 *** | −0.000108 | −0.000158 *** | −0.0000972 |
| (−3.58) | (−1.15) | (−3.12) | (−1.03) | |
| PGDP | −0.00180 * | −0.00257 | −0.000612 | −0.00281 |
| (−1.93) | (−1.23) | (−0.59) | (−1.33) | |
| FinDev | 0.000192 *** | 0.000144 | 0.000195 *** | 0.000117 |
| (3.30) | (1.54) | (3.25) | (1.21) | |
| M2 | −0.000268 | 0.000322 | −0.00487 *** | −0.000635 |
| (−0.56) | (0.87) | (−2.97) | (−0.22) | |
| _cons | 0.00226 | −0.0915 | 0.102 ** | −0.0724 |
| (0.08) | (−1.51) | (2.28) | (−0.68) | |
| Observations | 846 | 846 | 846 | 846 |
| R2 | 0.148 | 0.161 | 0.164 | 0.176 |
Note: z statistics are shown in brackets; ***, ** and * mean significant at the level of 1%, 5% and 10%, respectively; the same below. Source: own calculations. Software: Stata.
Table 4.
Variable setting in 2SLS.
| Variable Name | Variable Symbol | |
|---|---|---|
| Dependent variable | Z | Z-Score |
| Exogenous variables | Urban innovation index | Innovation |
| Endogenous variables | Fintech level | Fintech 1 |
| Bank-level control variables | Size, DAR, CAR, Netprf, CIR, NIRR, SAR | |
| City-level control variables | PGDP, FinDev | |
| Macro-level control variables | M2 | |
| Instrumental variable | Urban innovation index | Innovation |
Source: own calculations.
Table 5.
Regression results of two-stage least square method (2SLS).
| (1) Z-Score | (2) Fintech 1 | (3) Z-Score | |
|---|---|---|---|
| Innovation | −0.0000258 | 0.0019945 *** | |
| (−0.77) | (5.94) | ||
| Fintech 1_hat | −0.0169861 ** | ||
| (−2.11) | |||
| observations | 846 | 846 | 846 |
| R2 | 0.487 | 0.623 | 0.115 |
Note: all regression models include other control variables and constants in the benchmark model (both here and below); *** and ** mean significant at the level of 1% and 5%, respectively. Source: own calculations. Software: Stata.
Table 6.
Robustness test: replace the explanatory variable with SDROA.
| (1) Random Effect | (2) Individual Fixed Effect | (3) Time-Fixed Effect | (4) Two-Way Fixed Effect | |
|---|---|---|---|---|
| Fintech 1 | −0.000451 ** | −0.000779 ** | −0.00186 *** | −0.00146 ** |
| (−2.04) | (−1.97) | (−3.28) | (−2.07) | |
| observations | 847 | 847 | 847 | 847 |
| R2 | 0.272 | 0.283 | 0.289 | 0.303 |
Note: *** and ** mean significant at the level of 1% and 5%, respectively. Source: own calculations. Software: Stata.
Table 7.
Robustness test: replace the core explanatory variable with Fintech 2.
| (1) Random Effect | (2) Individual Fixed Effect | (3) Time-Fixed Effect | (4) Two-Way Fixed Effect | |
|---|---|---|---|---|
| Fintech 2 | −0.00108 ** | −0.00154 * | −0.00113 ** | −0.00102 |
| (−2.22) | (−1.87) | (−2.03) | (−1.13) | |
| observations | 828 | 828 | 828 | 828 |
| R2 | 0.154 | 0.158 | 0.174 | 0.184 |
Note: ** and * mean significant at the level of 5% and 10%, respectively. Source: own calculations. Software: Stata.
Table 8.
Robustness test: remove the bank whose registered place is the municipality.
| (1) Random Effects | (2) Individual Fixed Effect | (3) Time-Fixed Effect | (4) Two-Way Fixed Effect | |
|---|---|---|---|---|
| Fintech 1 | −0.00969 *** | −0.0189 *** | −0.0286 *** | −0.0200 * |
| (−2.76) | (−2.88) | (−3.55) | (−1.67) | |
| observations | 786 | 786 | 786 | 786 |
| R2 | 0.491 | 0.509 | 0.501 | 0.532 |
Note: *** and * mean significant at the level of 1% and 10%, respectively. Source: own calculations. Software: Stata.
Table 9.
Test results of differences in the eastern, western and central parts of China.
| (1) Eastern Region | (2) Central Region | (3) Western Region | |
|---|---|---|---|
| Fintech 1 | −0.0116 ** | −0.0122 | −0.0348 ** |
| (−2.20) | (−0.94) | (−2.28) | |
| observations | 549 | 155 | 142 |
| Number of banks | 100 | 27 | 25 |
| R2 | 0.147 | 0.338 | 0.244 |
Note: ** means significant at the level of 5%. Source: own calculations. Software: Stata.
Table 10.
Heterogeneity test between provincial capital cities and non-provincial capital cities.
| (1) Provincial Capitals | (2) Non-Provincial Capital | |
|---|---|---|
| Fintech 1 | −0.0122 | −0.0147 ** |
| (−1.01) | (−2.54) | |
| observations | 233 | 553 |
| Number of banks | 41 | 101 |
| R2 | 0.403 | 0.101 |
Note: ** means significant at the level of 5%. Source: own calculations. Software: Stata.
Table 11.
Heterogeneity test results of bank size.
| (1) Large-Scale | (2) Small-Scale | |
|---|---|---|
| Fintech 1 | −0.0086 *** | −0.0019 |
| (−3.73) | (−0.67) | |
| observations | 456 | 390 |
| Number of banks | 102 | 100 |
| R2 | 0.285 | 0.100 |
Note: *** means significant at the level of 1%. Source: own calculations. Software: Stata.
Table 12.
Heterogeneity test results of banking system.
| (1) Urban Commercial Bank | (2) Rural Commercial Bank | |
|---|---|---|
| Fintech 1 | −0.0350 *** | −0.0236 ** |
| (−3.35) | (−2.15) | |
| observations | 589 | 257 |
| Number of banks | 101 | 51 |
| R2 | 0.518 | 0.302 |
Note: *** and ** mean significant at the level of 1% and 5%, respectively. Source: Own calculations. Software: Stata.
Table 13.
Based on the intermediation effect test within the bank.
| (1) Z-Score | (2) NIM | (3) Z-Score | (4) Z-Score | (5) Governance | (6) Z-Score | |
|---|---|---|---|---|---|---|
| Fintech 1 | −0.0249 *** | −0.463 * | −0.0240 *** | −0.00419 ** | 0.00903 *** | −0.00372 ** |
| (−3.15) | (−1.80) | (−3.00) | (−2.39) | (3.32) | (−2.13) | |
| NIM | 0.00170 * | |||||
| (1.73) | ||||||
| Governance | −0.0580 *** | |||||
| (−2.81) | ||||||
| observations | 846 | 848 | 837 | 846 | 860 | 845 |
| R2 | 0.499 | 0.627 | 0.501 | 0.148 | 0.734 | 0.163 |
Note: ***, ** and * mean significant at the level of 1%, 5% and 10%, respectively. Source: own calculations. Software: Stata.
Table 14.
Based on the bank’s external intermediary effect test.
| (1) Z-Score | (2) HHI | (3) Z-Score | (4) Z-Score | (5) PSaving | (6) Z-Score | |
|---|---|---|---|---|---|---|
| Fintech 1 | −0.0141 *** | −0.0182 *** | −0.0168 *** | −0.00419 ** | 1.441 *** | −0.0168 *** |
| (−3.15) | (−4.38) | (−3.58) | (−2.39) | (12.16) | (−3.59) | |
| HHI | −0.0268 * | |||||
| (1.67) | ||||||
| PSaving | 0.000557 * | |||||
| (1.85) | ||||||
| observations | 846 | 863 | 846 | 846 | 863 | 846 |
| R2 | 0.164 | 0.627 | 0.163 | 0.148 | 0.751 | 0.162 |
Note: ***, ** and * mean significant at the level of 1%, 5% and 10%, respectively. Source: own calculations. Software: Stata.
Publisher’s Note: MDPI stays neutral with regard to jurisdictional claims in published maps and institutional affiliations. |
© 2021 by the authors. Licensee MDPI, Basel, Switzerland. This article is an open access article distributed under the terms and conditions of the Creative Commons Attribution (CC BY) license (https://creativecommons.org/licenses/by/4.0/).
Share and Cite
MDPI and ACS Style
Deng, L.; Lv, Y.; Liu, Y.; Zhao, Y. Impact of Fintech on Bank Risk-Taking: Evidence from China. Risks 2021, 9, 99. https://0-doi-org.brum.beds.ac.uk/10.3390/risks9050099
AMA Style
Deng L, Lv Y, Liu Y, Zhao Y. Impact of Fintech on Bank Risk-Taking: Evidence from China. Risks. 2021; 9(5):99. https://0-doi-org.brum.beds.ac.uk/10.3390/risks9050099
Chicago/Turabian StyleDeng, Liurui, Yongbin Lv, Ye Liu, and Yiwen Zhao. 2021. "Impact of Fintech on Bank Risk-Taking: Evidence from China" Risks 9, no. 5: 99. https://0-doi-org.brum.beds.ac.uk/10.3390/risks9050099
Note that from the first issue of 2016, this journal uses article numbers instead of page numbers. See further details here.