
Corruption, Shadow Economy and Deforestation: Friends or Strangers?
by
 and
and
Adeline-Cristina Cozma
*, 
Corina-Narcisa (Bodescu) Cotoc
,
Viorela Ligia Vaidean
and
Monica Violeta Achim

Faculty of Economics and Business Administration, Babes-Bolyai University, 400591 Cluj-Napoca, Romania
*
Author to whom correspondence should be addressed.
Risks 2021, 9(9), 153; https://0-doi-org.brum.beds.ac.uk/10.3390/risks9090153
Submission received: 29 July 2021
/
Revised: 16 August 2021
/
Accepted: 17 August 2021
/
Published: 25 August 2021
(This article belongs to the Special Issue Economic and Financial Crimes)
Abstract
:This study aims to reveal the connection between corruption and shadow economy, on one hand, and deforestation, on the other. The research considers 131 countries from all over the world, in the timeframe between the years 2012 and 2020, and it reveals that corruption and shadow economy positively influence deforestation. Determinants like democratic governance quality, press freedom, wood export share, and culture are also key factors in implementing the right, efficient countermeasures aimed at reducing the levels of illegal deforestation and sustainably managing the forestland. The importance of this study is to provide a solid quantitative basis to decision-makers that come across this problem of illegal logging through a better, fact-based understanding of the phenomenon.
1. Introduction
The need for understanding the factors that determine this serious phenomenon of illegal logging is stringent, as climate change has become very real. The carbon dioxide level has increased in a straight line, straight to unsustainability, as a report by NASA (2021) reveals.
The most recent official report about the global emissions of greenhouse gas by sector and sub-sectors was published in 2020 using data from 2016.
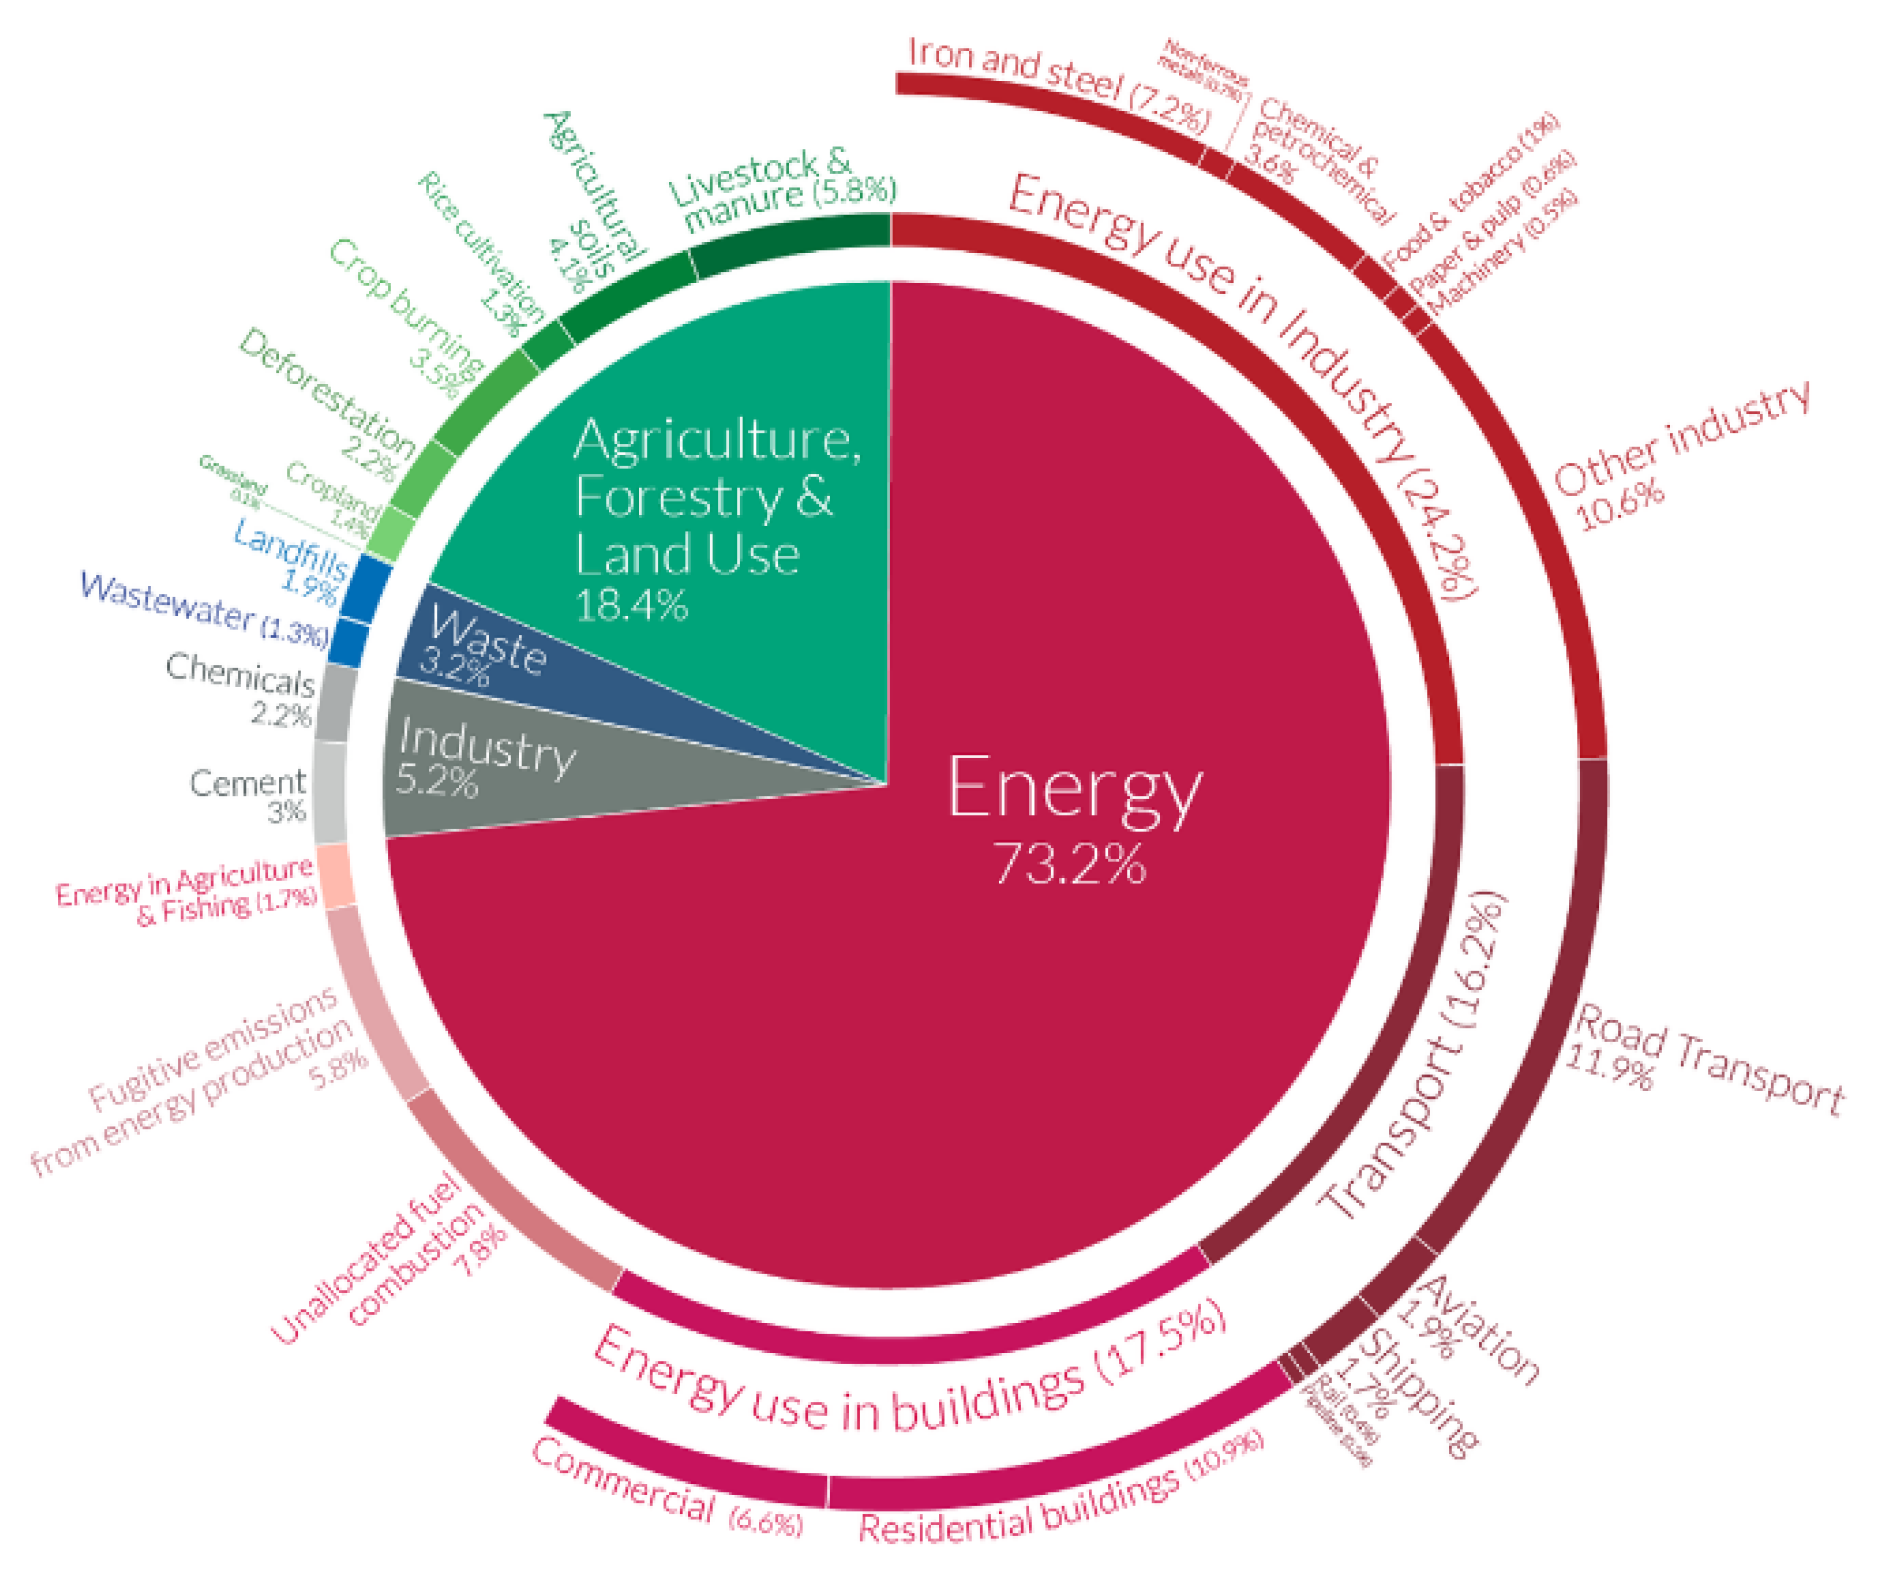
As shown in Figure 1, although it may not seem much, deforestation accounts for 2.2% of the total global greenhouse gas emissions. If we rank the most powerful causes, deforestation would be at 13th place of all the 27 sub-sectors. Nevertheless, wood is also important because it is the only renewable building material available at the moment. Furthermore, trees remove CO2 from the atmosphere and store it inside (about 50% of the dry weight of wood is carbon). This is one thing that none of the other sub-sectors can do: reverse the effect of all others. Moreover, deforestation negatively affects biodiversity by loss of habitat and causes desertification, soil erosion, fewer crops, and flooding. Therefore, these are some grounded reasons why deforestation must be done in a sustainable way and why the fight against illegal logging is extremely important.
Having its research targeted on the link between deforestation and corruption, this study aims to reveal the connection between these two, as well as the influence they have on each other. Shadow economy is also analyzed with respect to deforestation, and control variables are used in order to obtain accurate results and to identify significant determinant factors.
Most studies that aim to identify the causes of massive deforestation barely discuss the corruption phenomenon regarding illegal deforestation. This is an important cause of climate change, but it is rarely approached, as the media continues to display shocking stories about the timber mafia and the terrible consequences for those that had the courage to speak up against this issue.
International specialized research is mostly focused on Amazon forests, Indonesia, Ghana, Brazil, and Tanzania. However, there are so many other places on Earth with virgin or secular forests. For example, Romania has the largest area of virgin forests in the whole European Union. They are home to a wide variety of species of animals and plants, including carnivores, some of whom have long since vanished from Western Europe. Much of these primitive forests are now threatened by illegal deforestation. But we were wondering how the bigger picture looks like. According to Global Forest Resources Assessment 2020 (FAO 2020), more than half (54%) of the world’s forests is situated in only five countries—the Russian Federation, Brazil, Canada, the United States of America, and China, while the rest of the world owns only 46% of the world’s forests.
However, the health of the justice system and the level of corruption all over the world is at the very root of determining the sustainability of exploiting this valuable resource: wood. While there is no official ranking regarding the power and size of the timber mafia in each country, media constantly reveals terrible news about these organized networks of criminals from Brazil, Congo, India, Indonesia, and Romania. The phenomenon is huge: half of all Romanian timber is illegally harvested. Those who cross the timber mafia or attempt to enforce Romania’s forest laws are targeted for retribution. According to a report by Ritchie and Roser (2021), from 57% forestland (6 billion hectares out of 10.6 in total) 10,000 years before present time, to 52% in 1700, to 44% in 1950, and to 38% (4 billion) in 2018, the forestland has been decreasing severely, as the sources of pollution have become more and more destructive. The loss of forests, on the one hand, and the exponential multiplication of pollution sources, on the other hand, are two significant forces that act in the same direction: the destruction of the environment.
The outline of this study is presented as follows: the paper begins with summarizing the most relevant researches on corruption in terms of illegal logging. The variables used and the types of statistical analysis made are described in the methodology section, followed by the results and discussions. Then, conclusions are drawn, as well as limitations of the research and future work.
2. Literature Review
Studies on this topic are quite few, as the bibliometric review in Table 1 shows. The overwhelming majority of them are descriptive researches, based on interviews, focus groups, or other articles and studies, as detailed in Section 2.1. However, there are few articles that address this subject in a quantitative manner, and they are sorted by analyzed factors in Section 2.2, in order to support the selection of variables used in the present study. Even so, only three studies that directly address the subject of corruption and illegal deforestation in a quantitative manner have been published, as presented in Section 2.3. This chapter goes from the bibliometric review of the literature to the theoretical descriptive background on the subject, to sorting the studies in a manner that will explain the reasons behind selecting each variable for this paper, and finally, that will reveal the gap that this study aims to fill.
ACM Digital Library, Science Direct, Emerald Full Text, IEEE Transactions, Springer-Link Journals and Web of Science databases were used in searching for all types of academic research (journal articles, book parts, case studies, etc.) on this topic, from 1950 to 2021. The keywords used are deforestation and corruption, and also deforestation and the shadow economy, in order to cover the applying types of economic and financial crimes. The results revealed the rather poor academic research performed in this field, as shown in Table 1.
The specialized academic literature is not at all generous in analyzing the influence of economic and financial crime on deforestation. Most research is descriptive, analyzing the phenomenon of illegal deforestation and corruption of civil servants only from a theoretical, qualitative point of view, without presenting a practical, quantitative approach. Analysis and correlation of data, figures, and measurement attempts are rather timid and inconsistent. The academic studies can be classified by the type of used methodology, by the determinant factors in relation to deforestation, and by the topic relevance.
2.1. Descriptive Studies Sorted by Type of Research
By selecting the most relevant ones in terms of journal quality and the number of citations, the biggest category of research is descriptive studies, which are based either on the analysis of primary qualitative data (interviews, focus groups, etc.) or on the analysis of secondary data (other articles and analyses).
Studies based on interviews are conducted by various researchers. This type of analysis not only uses qualitative, descriptive methods but also has a qualitative, descriptive outcome. All the papers reveal not only the connection between corruption and illegal deforestation but also the mechanisms behind it. For example, Harwell (2009) notes that in Indonesia, there are numerous and varied practices of illegal logging, which he identified in interviews with state officials, journalists, and activists. Pellegrini (2011) finds out that Pakistan forest officials allow illegal logging to obtain a larger volume of timber than the legal limit. A “wood mafia” is well infiltrated in the political field and pays bribes to allow timber trafficking. Another study in this category is conducted by Milledge et al. (2007) in Southern Tanzania, which concludes that illegal timber exports are facilitated by the phenomenon of corruption. Robbins (2000) manages to gather 162 interviews with Indian foresters and concludes that corrupt practices allow some local barons to circumvent forest laws and clear forests beyond permitted levels. The influence that corruption has on illegal logging is obvious. Miller (2011) analyzes the results of 15 interviews with various experts and observes the most common practice by which corruption facilitates illegal deforestation: police take bribes to allow the transport of wood without the necessary documents; forestry officials issue permits that are never stamped, so an operator can reuse this document several times. Teye (2013) conducts a comprehensive study based on interviews with 102 employees of the Forest Service Division of Ghana, 105 citizens of Amutu and Bami, and 24 companies with illegal deforestation activity. The findings of this study show that corruption is partly responsible for the high level of illegal exploitation in Ghana. He concludes that the national good is sacrificed for the interests of state officials and private timber companies.
Another category of descriptive research is based on the analysis of other studies. These studies help identify the current needs of research in this field and propose new directions for future work. Sundstrom (2016) analyzes 27 empirical studies and 10 additional studies and observes that all of them suggest in unison that corruption at different levels allows illegality in forest management and that this is generally true, in both time and space. Callister (1999) makes a number of recommendations to the World Bank, including the establishment of a working group against illegal forestry activities and the establishment of an alliance between the World Bank and the World-Wide Fund for Nature. However, in order to understand the relation between corruption and deforestation, Amacher (2006) says that we need to understand the following concepts: the process behind bribery, forest management decisions (legal and illegal) of foresters, and government policy decisions, by taking into consideration various assumptions about various forms of corruption, markets, information, and bargaining power of every country. Adela and Saragih (2017) focus on research in Indonesia and point to the need for collaborative management in administration to eradicate corruption. Maina (2018) discovers from previous research that corruption has the potential to decimate a country’s forest and states that there is an urgent need for studies to provide additional explanations on the extent to which corruption contributes to the continuous decline of forested areas in the context of multiple reforms to improve the performance of the forestry sector.
The third category of studies is based on the usage of mathematical models. Notorious researchers in the field analyze elements and mechanisms of this phenomenon of corruption in illegal deforestation from a quantitative point of view. Thus, Mendes et al. (2016) show that a government’s strategy of using a constant salary scheme can increase the possibility of giving and taking bribes. The created mathematical model proves that the salary paid in the public sector can be an important tool in combating deforestation in developing countries. Amacher et al. (2012) show how bribery by corrupt forest inspectors significantly changes government concession policy. The authors note that efforts to implement the government’s intention to punish forest crimes cannot be considered independent of bribery incentives. It is clear that corruption and illegal exploitation are inseparable, each aggravated by the presence of the other. Wilson and Damania (2004) show that higher levels of political competition will lead to the adoption of a stricter legal framework in terms of the environment and higher fines for violating them. It is important to note that stricter regulations always reduce emissions. In this regard, the model suggests that a very relevant factor in reducing environmental damage is real political competition. However, Damania (2002) notes that a sufficiently effective judicial system in prosecuting criminals involves policies that combine efforts to reduce corruption and those that reduce emissions.
There is also a category of researches based on benchmarking, case studies, or other methods of processing secondary data. The timeframes, the geographic locations, the angles of the topic, the specific contexts are diverse, but they all present the causes of illegal deforestation with respect to corruption. An article that uses case studies is written by Siebert and Elwert (2014), who investigate deforestation in Benin, Africa, and finds that corruption of civil servants plays a major role in illegalities that occur in public property forests. Bulkan and Palmer (2008) see corruption as the major factor preventing proper control of long-term deforestation concessions by government agencies in Guyana, South America. Corruption has a favorable context due to very low forest taxes and high profits on undeclared log exports. The state itself behaves like a criminal enterprise, allowing to ignore technical regulations available to improve forest management or used selectively against loggers who have no political influence. Senior and young forest officers maintain mutual relations with forest operators. Small-scale loggers increase their incomes by excessively cutting the quota, for which they pay government staff from lower hierarchical levels in the inspection field.
Another article by Fadli and Purnomo (2019) aims to study a set of laws in Indonesia and shows that holders of large sums of capital have influence in politics, leading to legislation that favors individual interests to the detriment of the well-being of the low-income population. The integrity of regional leaders determines the degree of corruption in a region. They recommend that the government ensured the integrity of regional leaders and maintained an internal commitment in all areas in order to eradicate corruption. Another study in Indonesia, this time by Saint-Paul and Palmer (2005) examines the causes of corruption, starting with historical and cultural heritage, followed by the nature of business transactions motivated by private earnings from resource rents and their impact. They argue that until the whole culture of giving and taking bribes is minimized, from the highest to the lowest level, all environmental protection initiatives will be just for show. However, given the interest of those in power, it is unlikely that those at the top will legislate against themselves. Another study conducted in Indonesia by Smith et al. (2003) demonstrates that a weak and fragmented governance, characterized by power struggles, anarchy, conflict, and conflicting laws, can blur the lines between legality and illegality and, therefore, it has facilitated the flourishing of illegal exploitation. Periods of transition from autocracy to democracy are particularly vulnerable to corruption because, during the transitions, the essential institutions for real democracy are still underdeveloped, leading to a governance vacuum.
An article rewritten by Tacconi et al. (2019) presents the comparison between logging policies in Brazil and those in Indonesia and it notices that, unlike Brazil, Indonesia does not appear to have a centralized and strategic approach to law enforcement. It seems that the application of Indonesian forest law could significantly benefit from a careful examination of Brazil’s experience, not by copying, but by adapting it to the specific context. Irland (2008) analyzes 46 vulnerable countries and draws up a short list of efforts against the forest mafia that deserves attention: ending the conspiracy of silence, legal timber labeling systems, buyer commitments, transparency, corporate responsibility, and realistic planning of forest programs and projects. An important conclusion drawn by Irland is that whenever the government is absent or dysfunctional, forest policy will not work. Addressing the limitation of realistic measurements in the environmental field, Wijewardana (2006) analyzes over 60 countries and observes that environmental indicators are not just data, but are dynamic processes in ecosystems. They need to capture the complexities of the ecosystem but remain simple enough to be easy to monitor. Indicators need to be properly analyzed to determine trends and to identify policy interventions needed to address imbalances. It requires a common understanding of key concepts and definitions, along with the ability, training, and experience to interpret them.
However, Guertin (2003) states that even if there is no consensus on how to define and measure illegal logging activities, more and more experts are discussing this issue on the international stage within governments, NGOs, and producers’ associations of wooden goods. Given the scale of the problem and the potential impact on world trade, illegal forestry activities pose a threat to the forest products industry. Leitao (2016) sketches a list of facts that are now discussed at an international level: corruption and poor governance can exacerbate social and environmental issues that compromise communities and ecosystems; environmental corruption is higher when economic development is low; corruption is prevalent in a wide range of political systems—however, it is higher in countries with weak democracies; weaknesses in governance structures inhibit good governance and facilitate environmental corruption; monopolies, whether controlled by the state or controlled by a corporation, create an opportunity for corruption in the economic sectors of the environment; countries that depend on the exploitation of their natural resources face high levels of corruption and therefore poor environmental governance; and corrupt governments’ exporting partners often increase the volume of illegal activities that degrade the environment, increasing the demand for natural resources.
As a response to all the problems discussed, Gupta and Siebert (2004) focus their research on the Forest Integrity Network (FIN). It seems that the fundamental goal of the organization is to reduce forest corruption and that it aims to raise awareness of forest corruption as a key obstacle to forest conservation and sustainable forest use. FIN is a comprehensive basis for information on forest corruption, including policy research and benchmarking. Its purpose is to develop and disseminate innovative ideas for combating forest corruption, as well as those of other organizations involved in the sustainable use of natural resources worldwide. The central objective of the network is to build a strong basis for stakeholders to work together in the exchange of experiences and to identify best practices in combating forest corruption. FIN responds to the urgent need to address the relationship between corruption and the misuse of natural resources.
2.2. Quantitative Research Sorted by Analyzed Factors
Nevertheless, some quantitative studies discuss different relationships and impacts of certain elements related to the topic of illegal deforestation. One important factor can be the type of political regime. We might think that democracies take better care of their resources, and it is probably right. Damania et al. (2000) analyze 48 countries between 1982 and 1992 to show the link between grams of lead per liter of gasoline as an explained variable, and government openness and honesty as explanatory variables. The gross domestic product per capita is used as a control variable. The authors show that countries that are more corrupt tend to have less stringent pollution control policies, and countries with more open trade regimes tend to have stricter environmental regulations. Thus, a reduction in corruption has a greater effect on environmental policy in relatively closed economies. Moreover, Neumayer (2002) studies 122 countries to show that democracies have a stronger international commitment to the environment than non-democracies. Then what about political stability? Fredriksson and Svensson (2003) analyze 63 countries to show the link between environmental policy, as a dependent variable, and corruption and political instability, as independent variables. Demand factors and structural differences between countries were used as control variables. The authors managed to show that very corrupt countries, but quite politically stable, have the worst results from the perspective of their environmental policy. Furthermore, Deacon (1994) uses a sample of 120 countries and chooses 1975–1985 as the analysis period to show the link between deforestation, as a dependent variable, and population pressure, income growth, and property insecurity, as independent variables. Consistent associations have been found between deforestation and policy variables that reflect property insecurity. Untying this chain of causation is important for any policy that seeks to control deforestation.
Another factor is the wealth of the country (usually measured using GDP per capita). Vehkamaki (1986) conducts a study in Finland between the 1960s and 1980s that demonstrates the significant relationship between gross national product, as a dependent variable, and national consumption, forestry investments, and other investments, as independent variables. In the illustrated model, the gross national product depends linearly on the supply of raw timber, while the development of the forest depends on the forestry investments, which the government has allocated to forestry from the gross national product. Thus, we observe a relationship of mutual dependence between the gross national product and forest exploitation. In addition, Galinato and Galintao (2013) conduct a study on 22 countries for the 1990–2003 period and use as a dependent variable the extension of agricultural land to forest land, and as independent variables gross domestic product per capita, crop price index, direct investment in forestry, the index of political stability, the index of corruption control, the opening of trade, the length of paved roads and the price of investments. The authors note that there is a persistent long-term effect of controlling corruption and, to a lesser extent, political stability in terms of forest area, taking into account the expansion of agricultural land. They also find that the gross domestic product per capita has a strong negative effect on the forested area in the short term, but it does not have a persistent effect and is insignificant in the long term. The results highlight the need to understand the effect of governance through various direct factors that affect deforestation. Anti-corruption policies can help slow down deforestation.
The quality of political governance might play a role in this matter. Meehan and Tacconi (2017) use Indonesia to explain the relationship between forest degradation by deforestation, as a dependent variable, and forest management, granting concessions for the territory, and monitoring and execution of forestry projects as independent variables. The authors state that the impact of different types of corruption on forests can be direct, indirect, ambiguous, or even negligible. They suggest that anti-corruption efforts should be more targeted at specific types of corruption that are most likely to contribute to deforestation and forest degradation. Moreover, Andersen (1996) considers 316 countries in the period 1975-1988 in order to study the relationship between deforestation, as an explained variable, and the size and growth of the total population, the size and growth of the rural population, the length of roads, road constructions, the size and increase in gross domestic product per capita, size and increase in agricultural production per capita, firewood collection, cattle herds, and others, as independent variables. The analysis shows that factors under the direct influence of government policy, such as road construction, credit, and fiscal incentives, appear to have relatively small effects on deforestation compared to the effects of local forces, such as population growth and economic growth. Thus, deforestation seems to be largely driven by local economic forces.
In terms of exports, conclusive research on foreign trade relations has been published by Golovko and Sahin (2021), which conclude that Eurasian countries are 35% less integrated with the global trade system between 1994 and 2018 than the projected potential amount. This correlates with the quality of political governance discussed above.
However, corruption and shadow economy are the key factors we are really interested in. Achim and Borlea (2020) state that the phenomena of corruption and that of shadow economy impact economic and sustainable development in high-income countries more intensely and adversely than in the case of low-income countries The authors successfully identify several determinants of economic and financial crime and find out that a high level of economic development is correlated with a low level of corruption, by regression analysis between GDP per capita and CPI. They also discovered that 47.6% of the variance of corruption can be explained by the average level of financial satisfaction. Moreover, they refer to the studies conducted by Treisman (2000) and Paldam (2001, 2002) that show how the corruption phenomenon is a defect of poverty that disappears as the country develops and becomes richer. Therefore, it is undeniable that corruption and GDP per capita have a strong and indirect relationship, as poverty is one of the primary causes of corruption. All in all, poverty may be an indirect cause of illegal deforestation, through corruption.
2.3. Researches Sorted by Relevance of Topic
Some studies are tangential to the subject of forestry corruption, like the one by Barbier et al. (2005). They consider low- and middle-income tropical countries in the period 1960–1999 and demonstrate the relationship between the cumulative expansion of agricultural land, as an explained variable, and trade conditions, corruption control, agricultural export share, and growth value added in agriculture, cereal production, increasing the size of the rural population, gross domestic product per capita and crop share, as independent variables. The theoretical and empirical findings of the paper confirm that the bribe given by economic agents that benefit from resource conversion activities would have a substantial effect on the control of conversion by a corrupt government. Thus, if a government is corrupt, a resource transformer that produces a commercial good can have considerable incentives to influence the resource conversion decisions of that government. Wright et al. (2007) conduct a study on 823 forest natural reserves in tropical countries between 2002 and 2004 and use as a dependent variable the rate of fire detection within nature reserves, explained by independent variables such as forest capital, deforestation rate, economic diversity, human development index, population size and growth rate, corruption, and fire density. The global burning of forests is in close connection with illegal deforestation, as it is a tool often used by those who want to hide the traces of illegal deforestation by burning stumps. The study shows that protected areas are managed more efficiently where corruption is reduced.
Pellegrini and Gerlagh (2006) conduct research in 62 countries for the 1980–1985 period that aims to explain the relationship between the stringency index of environmental protection, as a dependent variable, and gross domestic product per capita, the level of corruption, and the index of democracy, as independent variables. Urbanization rate, education, percentage of agricultural workers, and regional variables are used as control variables. The authors find that corruption stands out as a substantial and significant determinant of environmental policies. Koyuncu and Yilmaz (2011) use a sample of 128 countries to show the influence of corruption, as an explained variable, on forest privatization, as an explanatory variable. Political rights and civil liberties, economic openness, and education are used as control variables. A significant negative correlation is found between forest privatization and corruption. Thus, the privatization of the forest should be considered together with other measures in order to combat deforestation.
Welsch (2004) analyzes over 60 countries throughout the 1990–1996 period to demonstrate the relationship between the level of pollution, as a dependent variable, and the gross domestic product and the level of corruption, as independent variables. Pollution increases linearly in relation to the level of corruption. In terms of the indirect effect that contributes to this overall result, corruption can reduce or increase pollution, depending on the level of revenue. In many cases, the indirect effect reinforces the direct effect: corruption reduces revenues, and lower revenues mean a higher level of pollution. Even in cases where corruption reduces pollution through its effect on revenue, this indirect effect is invariably dominated by the direct effect.
If these articles did not exactly discuss our topic of interest, only three articles address the topic in a direct manner. Firstly, Ferreira (2004) builds a sample of over 90 countries for the 1990–2000 period and they study the relationship between deforestation rate, as a dependent variable, and contract repudiation, risk of expropriation, corruption, the rule of law, and bureaucratic quality, as independent variables. The control variables are the intensity of trade, the gross domestic product per capita, the population density, the price of wood, the length of the coast scaled on the land surface, and the length of the roads. The author demonstrates that trade liberalization has negative effects on the forested area when corruption is widespread.
Secondly, Cornelis van Kooten and Wang (2003) study 117 countries in order to demonstrate the relationship between the average annual deforestation rate, as an explained variable, and gross domestic product, forest exports, agricultural production, OECD membership, capital market, property rights, currency diversity, government size, corruption, literacy rate, and rural population. The results provide a solid basis for saying that as per capita income grows, so does environmental degradation in an effort to increase growth, but beyond a certain level of income, the natural environment improves due to citizens seeking a higher environmental quality. The results of this analysis indicate the need for institutional reforms, such as greater government involvement and the freedom of financial markets, to stabilize economies and increase the demand for a higher quality of the natural environment.
Thirdly, Koyuncu and Yilmaz (2008) use a sample of over 100 countries from 1980–2000 in order to study the relationship between deforestation, as an explained variable, and corruption, rural population growth, cropland area, and gross domestic product growth, as explanatory variables. Research clearly shows how corruption has a positive effect on the rate of deforestation. Therefore, policies and measures taken to reduce corruption will help reduce illegal forestry.
Many limitations of these studies can be observed: some of them use too small or niched samples, while others use data from 20 years ago. Many research studies are related, treating broader or tangential topics to the subject of illegal deforestation, and the vast majority do not use control variables and do not take into consideration either demographic or qualitative factors such as socio-cultural ones.
Thus, the topic of illegal deforestation has a very shy presence in the academic research field and the results of these studies are quite modest. The need for complex and fact-based research to fill that gap is urgent, especially in the context of the massive loss of wood in the last 30 years, which directly and substantially affects the quality of our environment and, therefore, of our lives.
With all these in mind, the present research addresses two research hypotheses:
Hypothesis 1 (H1).
The level of corruption increases as deforestation increases.
Hypothesis 2 (H2).
The level of shadow economy increases as deforestation increases.
3. Methodology
The methodology used is based on quantitative research on secondary data. This research considers 131 countries from all over the world, selected based on the available data and the relief in terms of forestland, in the timeframe between the years 2012 and 2020. The list of countries that were taken into consideration may be found in Table A1.
The first category of variables are the ones related to deforestation: Forestland (FL), Net Forest Conversion (NFC), and Net Forest Conversion Rate (NFCR). The second one is equal to the differences in Forestland (FL) from one year to the previous one. Negative values mean that deforestation exceeded the planting activities, while positive values mean that more trees were planted than cut down. Net Forest Conversion Rate (NFCR) is calculated by diving the Net Forest Conversion (NFC) to the total forestland in the previous year, with the same meaning of the positive and negative values.
The second category of variables is the applying types of economic and financial crime, respectively corruption—Corruption Perception Index (CPI) and Shadow Economy (SE).
Other variables used are the wealth of the country - GDP per capita (GDP), the Wood Export Share in total exports (WES), the quality of the politic regime—Democracy Index (DI), the Press Freedom Index (PFI), and six cultural dimensions (Indulgency—IND, Long-Term Orientation—LTO, Uncertainty Avoidance—UAI, Masculinity—MAS, Individualism—IND, Power Distance—PD). Table 2 presents the types of variables and data used.
Because there is no available data on illegal deforestation, the closest measurement is the change in forestland. Food and Agricultural Organization (FAO) offers complete forestland data, as it takes into consideration the land spanning more than 0.5 hectares with trees higher than 5 m and a canopy cover of more than 10%, or trees able to reach these thresholds in situ. It excludes land that is predominantly under agricultural or urban land use, and land that is predominantly used for maintenance and restoration of environmental function. The Net Forest Conversion (NFC) is calculated as the difference of forest area for two consecutive years, and the Net Forest Conversion Rate (NFCR) is the result of the division of the Net Forest Conversion (NFC) by the Forestland (FL) for a specific country, calculated as percentage. The general measurement unit used is 1000 ha.
The most complex and closest to reality indicator for the level of corruption is the Corruption Perception Index (CPI). It is an index published annually since 1995 by Transparency International, headquartered in Berlin, which rates countries by their perceived levels of corruption in the public sector, as indicated by expert evaluations and opinion polls. It uses a scale from 0 to 100 where a value of 0 equals the highest level of perceived corruption and 100 equals the lowest level of perceived corruption. Therefore, high scores of CPI mean low levels of corruption.
For the shadow economy, the database created by Medina and Schneider (2019) is the most used and reliable one and it is calculated as percentage from the official GDP. Their work consists of a new global database about the shadow economy for 157 countries from 1991 to 2017. It is measured by using the multiple indicator-multiple trigger (MIMIC) method. A limitation is that the most recent measurement is for 2017, as it is not yet updated.
The wealth of the country is an important factor that needs to be controlled in order to not interfere with the outcome. GDP per capita can be found in the official World Bank database. It is measured by dividing the gross domestic product by midyear population, and the measurement unit is current US dollars. GDP is the amount of the gross value added, plus any product taxes and minus any discounts not included in the value of the goods, from all the resident suppliers of the economy.
Wood Export Share (WES) is another control variable. The data are taken from World Bank and it is the share of total wood export accounted for in a given year, expressed as percentage of total exports.
The Democracy Index (DI), created by Economist Intelligence Unit, measures the quality of the political regime. It uses a scale from 0 to 100, with 0 representing the most authoritarian regime and 100 the most democratic one. For 165 sovereign states and two territories, the EIU Democracy Index offers a snapshot of the state of world democracy. Five categories are the core of the Democracy Index: democratic procedure and pluralism, civil rights, government working, civic engagement, and political culture.
World Bank also stores data about the Press Freedom Index (PFI). It uses a scale from 0 to 100, with 0 being the best possible score and 100 the worst. The information is gathered for 180 countries from an online questionnaire sent to editors, media lawyers, analysts, and other media experts chosen by Reporters without Borders (RSF).
Cultural factors play a major role in a country’s relation with nature and therefore its natural resources. Geert Hofstede created the famous six cultural dimensions, using a scale from 0 to 100 to measure the levels of collectivist vs. individualist, small power distance vs. large power distance, feminine vs. masculine, uncertainty tolerant vs. uncertainty avoiding, long-term orientation vs. short-term orientation, restrained vs. indulgent nations. One of the most important contributions to the development of cross-cultural research is the analytical concept of cultural dimensions introduced by Geert Hofstede as a result of the assessment of the beliefs of more than 100,000 IBM employees from 50 countries, which were published in 1980. The Hofstede dimensions and country scores have been checked in replications by others, using the same or related questions for other cross-national populations, after the initial validation of the country variations in IBM in results from management trainees elsewhere. Between 1990 and 2002, six main replications (14 or more countries) used national elite demographics, workers, and administrators of other companies and organizations, airline pilots, customers, and civil servants.
As stated above, for this research, the biggest and most important databases were used, as follows: World Bank Data, Food and Agriculture Organization, World Value Survey, Transparency International, and Economist Intelligence Unit. The Corruption Perception Index (CPI), one of the key indicators used, has drastically changed its methodology in 2012. Therefore, in order to have consistent, homogenous data, the analyzed period is 2012–2020. The advantage is the up-to-date homogeneous data corroborated with better measuring systems. Even so, for 2020, most databases are not yet updated. Moreover, there is no point in analyzing old data, once because old measurement mostly relies on vague estimations, but also due to the fact that every aspect of our lives is dynamic and changes quite quickly as years go by. Even with all the technological and academic improvements throughout the years, the database for this study lacks approximately 14% of the much-needed data.
Table 3 below contains the main descriptive statistics of the variables used in this study. Forestland (FL) measures the total forest surface in a country, with Bahrain in 2012 having the smallest forestland, and with Russia in 2020 with the largest forestland. The country that shrank its forestland the most is Brazil, from 2012 to 2015, with more than 1.539.000 ha each year, according to the Net Forest Conversation (NFC) indicator. The country that enlarged its forestland is China, with more than 1.936.000 ha each year from 2016 to 2020. However, relative measurements give us a better perspective, by using the Net Forest Conversion Rate (NFCR) indicator: in 2015, Egypt shrank −7.1128% of its total forestland, as in 2013, Albania doubled its forestland.
As for the economic and financial crime factors, Corruption Perception Index (CPI) takes the lowest value from 2012 to 2015, showing that Somalia is the most corrupt country. However, in 2014, Denmark has the lowest level of perceived corruption. The lowest level of shadow economy (SE) is recorded in Switzerland in 2014, with 5.1% of GDP consisting in underground economic activities, as the highest level was recorded in Bolivia in 2016, with 58.2%.
The smallest Gross Domestic Product per capita (GDP) is retributed to Burundi in 2012, as the highest to Norway in 2013. The country with the biggest Wood Export Share (WES) is Liberia in 2012, as Malawi had the highest in the same year. The lowest level of the Democratic Index (DI) is recorded in 2019 for the Congo Democratic Republic, as Norway reached the highest in 2016. Finland registered the lowest level of Press Freedom Index (PFI) in 2012, which means the press had the biggest freedom, as Eritrea the highest in 2014, which means mass media had the lowest freedom. As for the cultural dimensions, Austria is the country with the lowest Power Distance (PD), with Malaysia being the largest. According to the Individualism dimension (IDV), Guatemala is the most collectivist country, as Austria is the most individualist. As for Masculinity (MAS), Japan is the most masculine country, as Norway is the most feminine. Singapore scores the lowest when it comes to Uncertainty Avoidance (UAI), as Greece is the highest. The country with the highest level of Long-Term Orientation (LTO) is China, as Ghana has the lowest. The lowest score for Indulgency (IND) is recorded by Egypt, as the highest by Venezuela.
4. Results and Discussions
The purpose of this study is to study the effects of financial and economic crime upon deforestation. Net Forest Conversion (NFC) is used as the dependent variable, plus Net Forest Conversion Rate (NFCR) within the Robustness checks subsection. The independent variables are CPI and SE, in turn. The added controls include Gross Domestic Product per capita (GDP), Wood Export Share (WES), Democracy Index (DI), Press Freedom Index (PFI), and the six cultural dimensions from Hofstede’s model (Indulgency—IND, Long-Term Orientation—LTO, Uncertainty Avoidance—UAI, Masculinity—MAS, Individualism—IND, Power Distance—PD).
Table 4 contains the correlation matrix of the variables used within this study. There is a negative correlation existing between CPI and FL, which means that as FL increases, CPI decreases. But because as higher the CPI, the lowest the corruption, it means that countries with significant resources of wood are also more corrupt. Also, there is a positive correlation between CPI, on the one hand, and NFC and NFCR, on the other. This means that as CPI increases, NFC and NFCR also increase. Because a country is more corrupt if it has a lower CPI score, and because in the countries where the cutting of trees exceeds the planting, NFC and NFCR have negative values, it means that countries that shrink their forestland are more corrupt. Then, SE and FL move in tandem, while there’s an indirect relationship between SE, on the one hand, and NFC and NFCR on the other. This means that countries with a higher percentage of Shadow Economy are the ones that shrink their total forestland, by cutting more trees than planting (the percentage of Shadow Economy increases, as the Net Forest Conversion and the Net Forest Conversion Rate decrease, which means the difference between planting and cutting trees is lower).
The main results of this study are included within Table 5 As such, it explicates NFC as a function of CPI and control variables (estimations from Table 5—section (a)) and as a function of SE and control variables (estimations from Table 5—section (b)). Each first model is estimated as a simple regression model, on the Pooled OLS technique for panel data. Further on, a combinatorial approach (forward and backward estimations) is used in order to build multiple regressions up, keeping the significant controls within the regressions. Moreover, besides the Pooled OLS technique for panel data, the alternatives to the Pooled OLS technique are also tested between Fixed Effects Modeling (FEM) and Random Effects Modeling (REM). The bottom line of this table contains the panel diagnosis tests: the Hausman test points towards the optimal estimation technique, further kept on the last column of each table.
Thus, Table 5—section (a) uses simple and multiple regression modeling for estimating the determinants of NFC as a dependent variable, as a function of CPI, and various previously validated controls. Model (1) is a simple regression model on the Pooled OLS technique for panel data that basically estimates the direct relationship between CPI and NFC: each one unit increase in CPI determines an expected increase in the value of NFC by 2.4917, significant at 1% level, everything else unchanged. For models (1)–(5), the estimated coefficients for CPI validate this positive sign, and a slightly increased magnitude (2.4312 from model (2) is significant at a 1% level, 3.4135 from model (3) is significant at 1% level, 4.542 is significant at 1% level and 2.8029 is significant at 5% level). This means that high corruption (low CPI score) determines high deforestation levels (small, even negative values of NFC). Therefore, a corrupt country will have an intensive and unsustainable logging industry.
Models (2)–(4) in Table 5—section (a) reflect the combinatorial approach on multiple regression build-up, adding supplementary explanatory variables in the decreasing order of their explanatory power for NFC: WES in model (2), with a positive effect on NFC and then PFI in model (3), with a positive effect on NFC. This means that the declared, legal exports and also the press freedom are high in the countries that manage their forests in a durable way. Unfortunately, DI and or GDP are not significant determinants of NFC, on this sample. Ultimately, model (4) keeps the cultural dimensions that are significant: MAS and UAI, with a direct relationship to NFC for the former and an indirect relationship to NFC for the latter. So, a country that poorly manages its forestland is more feminine and uncertainty avoiding.
The last model from Table 5—section (a), model (5) estimates the regression built as model (4) on the fixed effects modeling technique for panel data, because the Hausman test, presented within the panel diagnosis bottom line of this table, points to it as being optimal. The positive estimated coefficient for CPI stays significant, revalidating the previous results. The cultural dimensions are omitted. Finally, corruption determines high level of deforestation. In their studies based on interviews, Pellegrini (2011), Milledge et al. (2007), Robbins (2000), Teye (2013), and Miller (2011) show how bribery facilitates illegal deforestation. By using relevant case studies, Siebert and Elwert (2014), Bulkan and Palmer (2008), Fadli and Purnomo (2019), and Irland (2008) also discuss the phenomenon of corruption in the logging industry.
Then, Table 5b uses linear regression modeling for estimating the effects of SE and other control variables on NFC. The estimated coefficient of SE is always significant (models (1)–(5)), and negative. In model (1), each 1-unit increase in SE decreases the value of NFC by 7.1123 units/points. Models (2)–(4) from Table 5b gradually add explanatory variables to the baseline model, increasing its explicative power up to 30.09% in model (4), which is a medium intensity power. Therefore, as the shadow economy increases, the forests are managed more poorly. In a country with a high shadow economy, deforestation is high. Furthermore, WES (model (2)), DI (model (3)), PFI (model (4)), and significant cultural dimensions (model (5)) are added gradually, keeping the signs from Table 5—section (a): WES has a direct effect upon NFC (positive coefficients), while DI has an indirect effect upon NFC (negative coefficients). The cultural dimensions from model (4) are again MAS and UAI, as in Table 5—section (a), but also PD and IDV, with a negative effect upon NFC. So, countries that do not manage their forestland in a sustainable way have poor democratic governance, declare less legal exports, and are more feminine, more uncertainty avoiding, individualistic, and with large power distance. Thus, the quality of the governance, the exports and the culture influence the way in which a country exploits its wood resources. Also, studies conducted by Mendes et al. (2016), Amacher et al. (2012), Wilson and Damania (2004), and Damania (2002) show through mathematical models that the governance context, including the salary system, the judicial system, and the political competition, significantly impact the corruption in the logging industry.
Model (5) FEM is pointed out through panel diagnosis as being optimal. Again, the estimated coefficient for SE is negative and significant. Although the positive coefficient of WES is not significant as within the previous models, DI’s negative impact upon NFC is emphasized by this model, too. Again, the cultural dimensions are omitted by the fixed effects technique. Finally, a high level of shadow economy and poor democratic governance determine high levels of deforestation. Even if the relationship between shadow economy and deforestation is not directly discussed in the specialized literature, Achim and Borlea (2020) state that shadow economy has a significant impact on the economic and sustainable development of a country.
As for the robustness checks, Table 6 uses NFCR as a dependent variable, estimated as a function of CPI and SE, in turn, and various controls. The estimated coefficients for CPI (Table 6—section (a) models (1)–(4)) are positive when significant, reinforcing our main results from Table 5—section (a). So, high levels of corruption (low CPI scores) determine high percentages of deforestation from the total forestland (high values of NFCR). In model (2), just WES is kept, besides CPI, with a positive impact upon NFCR. Again, countries with high deforestation rates (low, even negative NFCR) declare less legal wood exports (low WES percentages), as Golovko and Sahin (2021) observed in the Eurasian countries. Model (3) further validates PD, MAS, LTO, and IND as significant cultural dimensions, yet again emphasizing that culture determines the way in which a country manages its wood resources. Moreover, besides the Pooled OLS technique for panel data that were used for estimating models (1)–(3), the alternatives to the Pooled OLS technique were also tested between Fixed Effects Modeling (FEM) and Random Effects Modeling (REM). The bottom line of this table also contains the panel diagnosis: the Hausman tests point towards the optimal estimation technique: in the case of Table 6—section (a), that is FEM, model (4). The cultural dimensions are automatically omitted for collinearity reasons and the estimated coefficient of CPI is negative this time but without any significance.
Table 6b estimates NFCR as a function of SE (model (1)), WES (model (2)), then PD, MAS, UAI, LTO, and IND from Hofstede’s model (model (3)), while the last column keeps REM as the optimal model validated by the Hausman test. The estimated coefficients for SE are significant in models (1)–(4), having a negative relationship with NFCR. Therefore, a high deforestation rate is determined by a high rate of shadow economy. WES has a positive effect upon NFCR, so yet again countries with high deforestation rates declare less legal wood exports. The cultural dimensions keep their impact between models (3) and then (4), although the technique is different. Saint-Paul and Palmer (2005) find that the causes of corruption include the historical and cultural heritage, but culture proves to be a significant determinant not only of corruption but of deforestation too.
All in all, our main results are mostly confirmed as robust, strengthening their validity.
Taking everything into consideration, both research hypotheses are confirmed: corruption and shadow economy positively influence deforestation. The fact that there is quantitative and up-to-date proof of the link between logging and economic and financial crime is crucial in motivating the measures that need to be taken in order to address the problem of illegal deforestation. Determinants like democratic governance quality, press freedom, wood export share, and culture are also key factors in implementing the right, efficient countermeasures aimed at reducing the levels of illegal deforestation and sustainably managing the forestland. Similar results obtained through studying simple and multiple regressions are revealed in studies conducted by Ferreira (2004), Cornelis van Kooten and Wang (2003), and Koyuncu and Yilmaz (2008). They all use different variables of deforestation as dependent and include corruption in their list of independent or control variables, but none of them discuss shadow economy and the most recent data used in these studies date back 21 years ago.
5. Conclusions
The importance of this study is to provide a solid quantitative basis to decision-makers that come across this problem of illegal logging through a better, fact-based understanding of the phenomenon. Corrupt senior officials, politicians, police officers, foresters, private companies, on one hand, and bribery, blood, murders, chopped protected areas, angry locals and activists, barren land fields, on the other hand: this is the picture of “wooden mafia”. In order to take proper action, to select the correct and suitable tools for reducing these criminal activities, the whole phenomenon needs to be properly analyzed. For a proper image, it is not enough to look for numbers, as it is not enough to look around us. It becomes enough only when one is looking at both: the numbers and the real-life situations.
In order to do so, the determinants of deforestation need to be identified not only qualitatively, but also quantitatively. The theory based on interviews, focus groups, other articles, and case studies is essential, but it needs to be supported by fact-based quantitative researches. This study comes as proof that economic and financial crime positively influences deforestation. As expected, the amount of deforestation (in both absolute and relative terms) is positively influenced by the level of economic and financial crime in a country (by both corruption and shadow economy), as well as other determinants like the democratic governance quality, the press freedom, the wood export share, and the culture of that country.
The results are important for a better understanding of the dangerous phenomenon of illegal deforestation, as well as for adopting the most efficient countermeasures aimed at ensuring a safe and healthy environment for us all.
In a nutshell, corruption, and deforestation certainly are best friends!
The availability of data, the changes in the methodology for measuring the indicators, the slow update of the databases, and the differences in constructing datasets are limitations of the study, resulting in a rather small number of observations when taking into consideration more variables. Further research might focus on improving the models by introducing new significant variables and raising the overall adjusted R-squared, in order to explain a higher percentage of the dependent’s variability. We are also considering performing the estimations on subsamples of high-income and low-income countries, in order to determine their potential peculiarities, as poverty may influence both economic and financial crimes and deforestation. Therefore, the phenomenon can be better explained, understood, and proven.
Author Contributions
Conceptualization, A.-C.C.; methodology, A.-C.C. and V.L.V.; validation, A.-C.C.; formal analysis, A.-C.C. and V.L.V.; investigation, C.-N.C.; resources, A.-C.C.; data curation, V.L.V.; writing—original draft preparation, A.-C.C., V.L.V., and C.-N.C.; writing—review and editing, M.V.A. and A.-C.C.; visualization, A.-C.C.; supervision, M.V.A.; project administration, A.-C.C. and C.-N.C. All authors have read and agreed to the published version of the manuscript.
Funding
This work was supported by a grant from the Romanian Ministry of Education and Research, CNCS—project number PN-III-P4-ID-PCE-2020-2174, within PNCDI III.
Data Availability Statement
Data used in this analysis are not public, but available upon request.
Conflicts of Interest
The authors declare no conflict of interest.
Appendix A

Table A1.
List of countries.
| 1. Afghanistan | 2. Albania | 3. Algeria |
| 4. Angola | 5. Armenia | 6. Australia |
| 7. Austria | 8. Azerbaijan | 9. Bahamas |
| 10. Bahrain | 11. Bangladesh | 12. Belarus |
| 13. Belgium | 14. Belize | 15. Benin |
| 16. Bosnia and Herzegovina | 17. Botswana | 18. Brazil |
| 19. Brunei Darussalam | 20. Bulgaria | 21. Burundi |
| 22. Cambodia | 23. Cameroon | 24. Cape Verde |
| 25. Central African Republic | 26. China | 27. Colombia |
| 28. Croatia | 29. Cyprus | 30. Denmark |
| 31. Djibouti | 32. Dominica | 33. Ecuador |
| 34. El Salvador | 35. Equatorial Guinea | 36. Estonia |
| 37. Finland | 38. France | 39. Gambia |
| 40. Georgia | 41. Germany | 42. Ghana |
| 43. Greece | 44. Guinea-Bissau | 45. Guyana |
| 46. Haiti | 47. Iceland | 48. India |
| 49. Iran | 50. Iraq | 51. Ireland |
| 52. Israel | 53. Italy | 54. Jamaica |
| 55. Japan | 56. Jordan | 57. Kenya |
| 58. Kiribati | 59. Korea (North) | 60. Kosovo |
| 61. Kuwait | 62. Kyrgyzstan | 63. Laos |
| 64. Latvia | 65. Lebanon | 66. Lesotho |
| 67. Liberia | 68. Libya | 69. Luxembourg |
| 70. Macao | 71. Macedonia | 72. Madagascar |
| 73. Malawi | 74. Malaysia | 75. Malta |
| 76. Mauritius | 77. Mexico | 78. Moldova |
| 79. Mongolia | 80. Nepal | 81. Netherlands |
| 82. New Zealand | 83. Nicaragua | 84. Nigeria |
| 85. Norway | 86. Oman | 87. Pakistan |
| 88. Panama | 89. Papua New Guinea | 90. Paraguay |
| 91. Peru | 92. Poland | 93. Portugal |
| 94. Puerto Rico | 95. Qatar | 96. Romania |
| 97. Saint Vincent and the Grenadines | 98. Samoa | 99. Sao Tome and Principe |
| 100. Saudi Arabia | 101. Senegal | 102. Seychelles |
| 103. Singapore | 104. Slovakia | 105. Slovenia |
| 106. Somalia | 107. South Korea | 108. Sri Lanka |
| 109. Suriname | 110. Swaziland | 111. Sweden |
| 112. Switzerland | 113. Syria | 114. Taiwan |
| 115. Tanzania | 116. Thailand | 117. Timor-Leste |
| 118. Tonga | 119. Trinidad and Tobago | 120. Tunisia |
| 121. Uganda | 122. Ukraine | 123. United Arab Emirates |
| 124. United Kingdom | 125. United States of America | 126. Uruguay |
| 127. Uzbekistan | 128. Venezuela | 129. Viet Nam |
| 130. Zambia | 131. Zimbabwe |
Source: own processing.
References
- Achim, Monica Violeta, and Sorin Nicolae Borlea. 2020. Economic and Financial Crime. Berlin: Springer. [Google Scholar]
- Adela, Fernada Putra, and Anwar Saragih. 2017. Corruption, Deforestation and Disaster in the Taman National Gunung Leuser Forest. Paper presented at 2nd International Conference on Social and Political Development (ICOSOP 2017), Medan, Indonesia, December 4–5; pp. 633–39. [Google Scholar]
- Amacher, Gregory. 2006. Corruption: A Challenge for Economists Interested in Forest Policy Design. Journal of Forest Economics 12: 85–89. [Google Scholar] [CrossRef]
- Amacher, Gregory, Markku Ollikainen, and Erkki Koskela. 2012. Corruption and Forest Concessions. Journal of Environmental Economics and Management 63: 92–104. [Google Scholar] [CrossRef]
- Andersen, Lykke. 1996. The Causes of Deforestation in the Brazilian Amazon. The Journal of Environment & Development 5: 309–28. [Google Scholar]
- Barbier, Edward, Richard Damania, and Daniel Leonard. 2005. Corruption, Trade and Resource Conversion. Journal of Environmental Economics and Management 50: 276–99. [Google Scholar] [CrossRef]
- Bulkan, Janette, and John Palmer. 2008. Breaking the Rings of Forest Corruption: Steps Towards Better Forest Governance. Forests, Trees and Livelihoods 18: 103–31. [Google Scholar] [CrossRef]
- Callister, Debra. 1999. Corrupt and Illegal Activities in the Forestry Sector: Current Understandings, and Implications for World Bank Forest Policy. World Bank. Available online: www.illegal-logging.info/papers/Corruption.rtf (accessed on 8 July 2021).
- Cornelis van Kooten, Gerrit, and Sen Wang. 2003. Institutional, Social and Economic Roots of Deforestation: A Cross-Country Comparison. The International Forestry Review 5: 29–37. [Google Scholar]
- Damania, Richard. 2002. Environmental Controls with Corrupt Bureaucrats. Environment and Development Economics 7: 407–27. [Google Scholar] [CrossRef] [Green Version]
- Damania, Richard, Per Fredriksson, and John List. 2000. Trade Liberalization, Corruption, and Environmental Policy Formation: Theory and Evidence. Journal of Environmental Economics and Management 46: 490–512. [Google Scholar] [CrossRef]
- Deacon, Robert. 1994. Deforestation and the Rule of Law in a Cross-Section of Countries. Land Economics 70: 414–30. [Google Scholar] [CrossRef]
- Economist Intelligence Unit (EIU). 2019. Democracy Index. Economist Intelligence Unit. Available online: https://www.eiu.com/n/campaigns/democracy-index-2020/?utm_source=google&utm_medium=cpc&utm_name=democracy_index&utm_term=latin_america&utm_content=general&gclid=Cj0KCQiA4L2BBhCvARIsAO0SBdZxtcUrxRIGMFD6fchJp8Te_LAbzXbSiBKYbtKeBT9SyYJ5ycUJFw0aAhktEALw_wcB (accessed on 8 June 2021).
- Fadli, Moh, and Joko Purnomo. 2019. Decentralisation and Corruption in the Forestry Sector. The Journal of Social Sciences Research 5: 1657–65. [Google Scholar] [CrossRef] [Green Version]
- Food and Agriculture Organization (FAO). 2020. Global Forest Resources Assessment. Rome: FAO. [Google Scholar]
- Ferreira, Susana. 2004. Deforestation, Property Rights, and International Trade. Land Economics 80: 174–93. [Google Scholar] [CrossRef]
- Fredriksson, Per, and Jakob Svensson. 2003. Political Instability, Corruption and Policy Formation: The Case of Environmental Policy. Journal of Public Economics 87: 1383–405. [Google Scholar] [CrossRef]
- Galinato, Gregmar, and Suzette Galintao. 2013. The short-run and long-run effects of corruption control and political stability on forest cover. Ecological Economics 89: 153–61. [Google Scholar] [CrossRef]
- Golovko, Anna, and Hasan Sahin. 2021. Analysis of international trade integration of Eurasian countries: Gravity model approach. Eurasian Economic Review. [Google Scholar] [CrossRef]
- Guertin, Carl-Eric. 2003. Illegal Logging and Illegal Activities in the Forestry Sector: Overview and Possible Issues for the UNECE Timber Commitee and FAO European Forestry Commission. Geneva. Available online: https://unece.org/fileadmin/DAM/timber/docs/tc-sessions/tc-61/presentations/guertin-paper.pdf (accessed on 3 May 2021).
- Gupta, Aarti, and Ute Siebert. 2004. Combating Forest Corruption. Journal of Sustainable Forestry 19: 337–49. [Google Scholar] [CrossRef]
- Harwell, Emily. 2009. The Human Rights Consequences of Illegal Logging and Corruption in Indonesia’s Forestry Sector. New York: Human Rights Watch. [Google Scholar]
- Hofstede, Geert. 1980. Dimension Data Matrix. Geert Hofstede. Available online: https://geerthofstede.com/research-and-vsm/dimension-data-matrix/ (accessed on 20 May 2021).
- Irland, Lloyd. 2008. State Failure, Corruption, and Warfare: Challenges for Forest Policy. Journal of Sustainable Forestry 27: 189–223. [Google Scholar] [CrossRef]
- Koyuncu, Cuneyt, and Rasim Yilmaz. 2008. The Impact of Corruption on Deforestation: A Cross-Crountry Evidence. Journal of Developing Areas 42: 213–22. [Google Scholar] [CrossRef]
- Koyuncu, Cuneyt, and Rasim Yilmaz. 2011. Deforestation, Corruption, and Private Owership in the forest sector. Quality & Quantity 47: 227–36. [Google Scholar]
- Leitao, Alexandra. 2016. Corruption and the Environment. Journal of Socialomics 5: 173. Available online: https://www.longdom.org/open-access/corruption-and-the-environment-2471-8726-1000173.pdf (accessed on 3 May 2021). [CrossRef]
- Maina, Paul Mwari. 2018. Impact of Poor Governance on Deforestation in Africa. Available online: https://www.researchgate.net/publication/326416387_Impact_of_poor_governance_on_deforestation_in_Africa (accessed on 3 May 2021).
- Medina, Leandro, and Friedrich G. Schneider. 2019. Shedding Light on the Shadow Economy: A Global Database and the Interaction with the Official One. CESifo Working Paper 7981. Available online: https://ssrn.com/abstract=3502028 (accessed on 15 July 2021).
- Meehan, Fiona, and Luca Tacconi. 2017. A Framework to Assess the Impacts of Corruption on Forests and Prioritize Responses. Land Use Policy 60: 113–22. [Google Scholar] [CrossRef]
- Mendes, Cassandro, Sabino Junior, and Fabricio Tourrucoo. 2016. Corruption and Deforestation: A Differential Game Model. Business and Economic Research 6: 481–91. [Google Scholar] [CrossRef] [Green Version]
- Milledge, Simon, Ised Gelvas, and Antje Ahrends. 2007. Forestry, Governance and National Development: Lessons Learned from a Logging Boom in the Southern Tanzania. Tanzania: TRAFFIC East/Southern Africa. [Google Scholar]
- Miller, Michael. 2011. Persistent Illegal Logging in Costa Rica: The Role of Corruption Among Forestry Regulators. The Journal of Environment & Development 20: 50–68. [Google Scholar]
- National Aeronautics and Space Administration (NASA). 2021. Carbon Dioxide. Available online: https://climate.nasa.gov/vital-signs/carbon-dioxide/ (accessed on 8 June 2021).
- Neumayer, Eric. 2002. Do Democracies Exhibit Stronger International Environmental Commitment? A Cross-Country Analysis. Journal of Peace Research 39: 139–64. [Google Scholar] [CrossRef] [Green Version]
- Paldam, Martin. 2001. Corruption and religion. Adding to the economic model. Kyklos 54: 383–414. [Google Scholar] [CrossRef]
- Paldam, Martin. 2002. The big pattern of corruption: Economics, culture and the seesaw dynamics. European Journal of Political Economy 18: 215–40. [Google Scholar] [CrossRef]
- Pellegrini, Lorenzo. 2011. Corruption, Development and the Environment. Berlin: Springer. [Google Scholar]
- Pellegrini, Lorenzo, and Reyer Gerlagh. 2006. Corruption, Democracy, and Environmental Policy: An Empirical Contribution to the Debate. The Journal of Environment & Development 15: 332–54. [Google Scholar]
- Ritchie, Hannah, and Max Roser. 2020. Emissions by Sector. Our World in Data. Available online: https://ourworldindata.org/emissions-by-sector (accessed on 11 June 2021).
- Ritchie, Hannah, and Max Roser. 2021. Forests and Deforestation. Our World in Data. Available online: https://ourworldindata.org/forests-and-deforestation (accessed on 11 June 2021).
- Robbins, Paul. 2000. The Rotten Institution: Corruption in Natural Resource Management. Political Geography 19: 423–43. [Google Scholar] [CrossRef]
- Saint-Paul, Gilles, and Charles Palmer. 2005. The Nature of Corruption in Forest Management. World Economics 6: 1–10. [Google Scholar]
- Siebert, Ute, and Georg Elwert. 2014. Combating Corruption and Illegal Logging in Benin, West Africa. Journal of Sustainable Forestry 19: 239–61. [Google Scholar] [CrossRef]
- Smith, J., K. Obridzinski, Sumirta Subarudi, and I. Suramenggala. 2003. Illegal Logging, Collusive Corruption and Fragmented Governments in Kalimantan, Indonesia. The International Forestry Review 5: 293–302. [Google Scholar] [CrossRef]
- Sundstrom, Aksel. 2016. Understanding Illegality and Corrpution in Forest Governance. Journal of Environ Manage 181: 779–90. [Google Scholar] [CrossRef]
- Tacconi, Luca, Rafael Rodrigues, and Ahmad Maryudi. 2019. Law Enforcement and Deforestation: Lessons for Indosenia from Brazil. Forest Policy and Economics 108: 101943. Available online: https://0-www-sciencedirect-com.brum.beds.ac.uk/science/article/pii/S1389934118304623?via%3Dihub (accessed on 3 May 2021). [CrossRef]
- Teye, Joseph Kofi. 2013. Corruption and Illegal Logging in Ghana. International Development Planning Review 35: 1–19. [Google Scholar] [CrossRef]
- Transperancy International. 2020. Corruption Perception Index. [Google Scholar]
- Treisman, Daniel. 2000. The causes of corruption: A cross-national study. Journal of Public Economics 76: 399–457. [Google Scholar] [CrossRef] [Green Version]
- Vehkamaki, Seppo. 1986. The Economic Basis of Forest Policy: A Study on the Goals and Means of Forest Policy. Acta Forestalia Fennica 194. Available online: https://www.silvafennica.fi/pdf/article7640.pdf (accessed on 3 May 2021). [CrossRef] [Green Version]
- Welsch, Heinz. 2004. Corruption, Growth, and the Enivronment: A Cross-Country Analysis. Environment and Development Economics 9: 663–93. [Google Scholar] [CrossRef] [Green Version]
- Wijewardana, Don. 2006. Criteria and Indicators for Sustainable Forest Management: The Road Travelled and the Way Ahead. Ecological Indicators 8: 115–22. [Google Scholar] [CrossRef]
- Wilson, John, and Richard Damania. 2004. Corruption, Political Competition and Environmental Policy. Journal of Environmental Economics and Management 49: 516–35. [Google Scholar] [CrossRef] [Green Version]
- World Bank. 2021a. GDP per Capita. Available online: https://data.worldbank.org/indicator/NY.GDP.PCAP.CD?end=2019&start=2012 (accessed on 3 May 2021).
- World Bank. 2021b. Press Freedom Index. Available online: https://tcdata360.worldbank.org/indicators/h3f86901f?country=BRA&indicator=32416&viz=line_chart&years=2001,2019 (accessed on 3 May 2021).
- World Bank. 2021c. Wood Exports by Country and Region in Thousands US $. Available online: https://wits.worldbank.org/CountryProfile/en/Country/WLD/Year/2018/TradeFlow/Export/Partner/all/Product/44-49_Wood# (accessed on 3 May 2021).
- Wright, Joseph, Arturo Sanchez-Azofeifa, Carlos Portillo-Quintero, and Diane Davies. 2007. Poverty and Corruption Compromise Tropical Forest Reserves. Ecological Applications 17: 1259–66. [Google Scholar] [CrossRef] [Green Version]
Figure 1.
Global Greenhouse Gas Emissions by Sectors. Source: Ritchie and Roser (2020) (https://ourworldindata.org/emissions-by-sector) (accessed on 9 August 2021).
Figure 1.
Global Greenhouse Gas Emissions by Sectors. Source: Ritchie and Roser (2020) (https://ourworldindata.org/emissions-by-sector) (accessed on 9 August 2021).

Table 1.
Academic research on deforestation in respect with corruption and shadow economy—number of results adjusted by keywords and relevance.
Table 1.
Academic research on deforestation in respect with corruption and shadow economy—number of results adjusted by keywords and relevance.
| Keywords | ACM Digital Library | Science Direct | Emerald Insight | IEEE Transactions | Springer-Link Journals | Web of Science Database |
|---|---|---|---|---|---|---|
| Deforestation, corruption | 20 results | 23 results | 1 result | 0 results | 0 results | 145 results |
| Deforestation, Shadow economy | 137 results | 0 results | 0 results | 0 results | 0 results | 1 result |
Source: Own processing.
Table 2.
Types of variables and data used.
| Variables | Way of Estimations | Description | Unit Measure | Source |
|---|---|---|---|---|
| Dependent variable | ||||
| Deforestation | Forest land (FL) | Total forest land in a country | 1000 ha | FAO (2020) |
| Net forest conversion (NFC) | The amount of forest land added or subtracted in a year, in a country; own formula: NFC = FL(t) − FL(t − 1), with t representing the current period and t − 1 representing the previous period; negative values show that cutting exceeds planting trees, as positive values show that planting exceeded the logging | 1000 ha | FAO (2020) | |
| Net forest conversion rate (NFCR) | The percentage of forest land added or subtracted in a year, in a country; NFC = [FL(t) − FL(t − 1)]/FL(t − 1), with t representing the current period and t − 1 representing the previous period; negative values show that cutting exceeds planting trees, as positive values show that planting exceeded the logging | % | FAO (2020) | |
| Independent variable | ||||
| Economic and financial crime | Corruption Perception Index (CPI) | The level of perceived corruption in a country | a scale from 0 to 100 | Transperancy International (2020) |
| Shadow economy (SE) | Shadow economy as percentage from the total GDP in a country | % | 2017 data of Medina and Schneider (2019) | |
| Control variables | ||||
| Wealth of the country | Gross domestic product (GDP) | GDP per capita in a country | current US dollars ($) | World Bank (2021a) |
| International Trade | Wood export share (WES) | Wood export share in total exports in a country | % | World Bank (2021b) |
| Democracy | Press Freedom Index (PFI) | The level of press freedom in a country | a scale from 0 to 100 | World Bank (2021c) |
| Democracy Index (DI) | Quality of the political regime in a country | a scale from 0 to 100 | EIU (2019) | |
| Culture | Six cultural dimensions: power distance (PD), individualism (IDV), masculinity (MAS), uncertainty (UAI), long-term orientation (LTO), indulgency (IND) | The levels of collectivist vs. individualist, small power distance vs. large power distance, feminine vs. masculine, uncertainty tolerant vs. uncertainty avoiding, long-term orientation vs. short-term orientation, restrained vs. indulgent characteristics of a country | a scale from 0 to 100 | Hofstede (1980) |
Source: own processing.
Table 3.
Summary statistics.
| Variable | Observations | Mean | Std. Dev. | Min | Max |
|---|---|---|---|---|---|
| FL | 1179 | 29,497.79 | 93,832.59 | 0.552 | 815,311.6 |
| NFC | 1143 | −32.593 | 267.9454 | −1539.18 | 1936.786 |
| NFCR | 1143 | −0.12071 | 3.15281 | −7.1128 | 100 |
| CPI | 1176 | 42.47364 | 19.13293 | 8 | 92 |
| SE | 732 | 27.80587 | 11.28058 | 5.1 | 58.2 |
| GDP | 1016 | 13,406.01 | 18,470.13 | 252.359 | 102,913.5 |
| WES | 910 | 2.822165 | 1.041994 | 0.14 | 8.9 |
| DI | 1170 | 56.48103 | 21.31302 | 11.3 | 99.3 |
| PFI | 792 | 32.12266 | 16.01165 | 6.38 | 80.96 |
| PD | 648 | 62.72222 | 21.92787 | 11 | 100 |
| IDV | 648 | 40.55556 | 22.4077 | 8 | 91 |
| MAS | 648 | 47.91667 | 19.95751 | 5 | 100 |
| UAI | 648 | 63.43056 | 21.34775 | 8 | 100 |
| LTO | 567 | 42.52381 | 22.82285 | 4 | 100 |
| IND | 522 | 50.67241 | 22.78477 | 13 | 100 |
Source: own processing.
Table 4.
Correlation matrix.
| FL | NFC | NFCR | CPI | SE | GDP | WES | DI | PFI | PD | IDV | MAS | UAI | LTO | IND | |
|---|---|---|---|---|---|---|---|---|---|---|---|---|---|---|---|
| FL | 1 | ||||||||||||||
| NFC | −0.7591 | 1 | |||||||||||||
| NFCR | −0.0845 | 0.2923 | 1 | ||||||||||||
| CPI | −0.0292 | 0.3077 | 0.3405 | 1 | |||||||||||
| SE | 0.0697 | −0.3113 | −0.4541 | −0.5816 | 1 | ||||||||||
| GDP | 0.0962 | 0.2711 | 0.3642 | 0.7725 | −0.5602 | 1 | |||||||||
| WES | −0.3386 | 0.3444 | 0.2583 | 0.263 | −0.1253 | 0.1871 | 1 | ||||||||
| DI | 0.1155 | 0.1257 | 0.0988 | 0.6971 | −0.3277 | 0.5242 | 0.2987 | 1 | |||||||
| PFI | −0.0495 | 0.0781 | 0.1792 | −0.1652 | −0.1096 | −0.0897 | 0.0303 | −0.1859 | 1 | ||||||
| PD | −0.118 | 0.0415 | 0.289 | 0.0249 | −0.2621 | 0.0063 | 0.0936 | 0.0823 | 0.524 | 1 | |||||
| IDV | −0.0163 | −0.0646 | −0.1793 | −0.0078 | 0.0933 | −0.0567 | −0.0404 | −0.1416 | −0.5693 | −0.6669 | 1 | ||||
| MAS | 0.0012 | 0.1685 | −0.0953 | −0.0053 | −0.2233 | 0.089 | 0.0325 | 0.0262 | 0.1332 | 0.1943 | 0.0136 | 1 | |||
| UAI | 0.2814 | −0.2101 | 0.1034 | 0.0534 | −0.1428 | 0.1357 | 0.1022 | 0.0013 | −0.2353 | 0.0946 | −0.0409 | 0.1601 | 1 | ||
| LTO | 0.0305 | 0.0321 | 0.2061 | 0.1424 | −0.2385 | 0.2035 | −0.2378 | −0.0784 | 0.0213 | 0.0145 | 0.2255 | 0.2797 | 0.0699 | 1 | |
| IND | −0.0028 | 0.024 | −0.0271 | −0.0456 | 0.0919 | 0.0345 | 0.2194 | 0.1532 | −0.2331 | −0.1731 | −0.0429 | −0.1874 | −0.0816 | −0.6454 | 1 |
Source: own processing.
Table 5.
Simple and multiple regressions.
| NFC | (a) | (b) | ||||||||
|---|---|---|---|---|---|---|---|---|---|---|
| Pooled OLS (1) | Pooled OLS (2) | Pooled OLS (3) | Pooled OLS (4) | FEM (5) | Pooled OLS (1) | Pooled OLS (2) | Pooled OLS (3) | Pooled OLS (4) | FEM (5) | |
| Const | −137.6743 *** | −225.7972 *** | −408.8788 *** | −515.026 *** | −172.6027 *** | 167.5212 *** | 67.3842 * | 319.2324 *** | 571.9687 *** | 116.9021 |
| CPI | 2.4917 *** | 2.4312 *** | 3.4135 *** | 4.542 *** | 2.8029 ** | |||||
| SE | −7.1123 *** | −6.8743 *** | −10.3458 *** | −11.2609 *** | −2.9676 * | |||||
| WES | 32.099 *** | 51.4196 *** | 84.5931 *** | 9.1967 | 33.7038 *** | 47.2974 *** | 117.4417 *** | 10.0484 | ||
| DI | −3.3268 *** | −1.9576 ** | −2.8153 * | |||||||
| PFI | 2.1417 *** | 1.6795 ** | −2.1296 * | |||||||
| PD | −3.2546 *** | |||||||||
| IDV | −2.9437 *** | |||||||||
| MAS | 2.3023 *** | 2.3157 *** | ||||||||
| UAI | −2.4491 *** | −4.4143 *** | ||||||||
| LTO | −1.2703 * | |||||||||
| R2 = 0.0306 | R2 = 0.0472 | R2 = 0.1350 | R2 = 0.2321 | within = 0.0281 | R2 = 0.0803 | R2 = 0.0946 | R2 = 0.1305 | R2 = 0.3189 | within = 0.0250 | |
| Adj R2 = 0.0297 | Adj R2 = 0.0450 | Adj R2 = 0.1307 | Adj R2 = 0.2217 | between = 0.0380 | Adj R2 = 0.0790 | Adj R2 = 0.0920 | Adj R2 = 0.1269 | Adj R2 = 0.3009 | between = 0.0072 | |
| No obs. | 1140 | 879 | 601 | 373 | overall = 0.0406 | 712 | 712 | 712 | 312 | overall = 0.0057 |
| Panel diagnosis | Prob > chi2 = 0.0041 → FEM | Prob > chi2 = 0.0000 → FEM | ||||||||
Source: own processing. Note: *** designates the 1% significant coefficients, ** designates the 5% significant coefficients and * designates the 10% significant coefficients.
Table 6.
Robustness checks.
| NFCR | (a) | (b) | ||||||
|---|---|---|---|---|---|---|---|---|
| Pooled OLS (1) | Pooled OLS (2) | Pooled OLS (3) | FEM (4) | Pooled OLS (1) | Pooled OLS (2) | Pooled OLS (3) | REM (4) | |
| Const | −0.6119 *** | −1.2114 *** | −3.626 *** | −0.2439 | 0.7119 * | −0.1978 | −0.882 ** | −1.8284 ** |
| CPI | 0.0116 ** | 0.0101 * | 0.0171 *** | −0.0003 | ||||
| SE | −0.0269 ** | −0.0247 * | −0.0392 *** | −0.0193 *** | ||||
| WES | 0.2503 ** | 0.1867 *** | 0.0125 | 0.3061 ** | 0.2461 *** | 0.0475 | ||
| PD | 0.0174 *** | 0.0123 *** | 0.0148 ** | |||||
| MAS | −0.0079 *** | −0.0097 *** | −0.0109 * | |||||
| UAI | −0.0039 * | −0.0015 | ||||||
| LTO | 0.0195 *** | 0.0148 *** | 0.0209 *** | |||||
| IND | 0.0136 *** | 0.0088 *** | 0.016 ** | |||||
| R2 = 0.0048 | R2 = 0.009 | R2 = 0.3270 | within = 0.0006 | R2 = 0.006 | R2 = 0.0121 | R2 = 0.3627 | within = 0.0119 | |
| Adj R2 = 0.0040 | Adj R2 = 0.0068 | Adj R2 = 0.3164 | between = 0.0062 | Adj R2 = 0.0046 | Adj R2 = 0.0093 | Adj R2 = 0.3480 | between = 0.3153 | |
| No obs. | 1140 | 879 | 390 | overall = 0.0019 | 712 | 712 | 312 | overall = 0.2873 |
| Panel diagnosis | Prob>chi2 = 0.0152→ FEM | Prob>chi2 = 0.0588 → REM | ||||||
Source: own processing. Note: *** designates the 1% significant coefficients, ** designates the 5% significant coefficients and * designates the 10% significant coefficients.
Publisher’s Note: MDPI stays neutral with regard to jurisdictional claims in published maps and institutional affiliations. |
© 2021 by the authors. Licensee MDPI, Basel, Switzerland. This article is an open access article distributed under the terms and conditions of the Creative Commons Attribution (CC BY) license (https://creativecommons.org/licenses/by/4.0/).
Share and Cite
MDPI and ACS Style
Cozma, A.-C.; Cotoc, C.-N.; Vaidean, V.L.; Achim, M.V. Corruption, Shadow Economy and Deforestation: Friends or Strangers? Risks 2021, 9, 153. https://0-doi-org.brum.beds.ac.uk/10.3390/risks9090153
AMA Style
Cozma A-C, Cotoc C-N, Vaidean VL, Achim MV. Corruption, Shadow Economy and Deforestation: Friends or Strangers? Risks. 2021; 9(9):153. https://0-doi-org.brum.beds.ac.uk/10.3390/risks9090153
Chicago/Turabian StyleCozma, Adeline-Cristina, Corina-Narcisa (Bodescu) Cotoc, Viorela Ligia Vaidean, and Monica Violeta Achim. 2021. "Corruption, Shadow Economy and Deforestation: Friends or Strangers?" Risks 9, no. 9: 153. https://0-doi-org.brum.beds.ac.uk/10.3390/risks9090153
Note that from the first issue of 2016, this journal uses article numbers instead of page numbers. See further details here.