
Option Pricing, Zero Lower Bound, and COVID-19

1
Department of Statistical Sciences, Sapienza University of Rome, 00185 Rome, Italy
2
MEMOTEF Department, Sapienza University of Rome, 00161 Rome, Italy
*
Author to whom correspondence should be addressed.
Risks 2021, 9(9), 167; https://0-doi-org.brum.beds.ac.uk/10.3390/risks9090167
Submission received: 10 August 2021
/
Revised: 2 September 2021
/
Accepted: 8 September 2021
/
Published: 13 September 2021
Abstract
:This paper provides a quantitative assessment of equity options priced at the Zero Lower Bound, i.e., when interest rates are set essentially to zero. We obtain closed form formulas for American options when the Zero Lower Bound policy holds. We perform numerical implementation of American put options written on the stock Federal National Mortgage Association (FNMA) and of related bounds for the optimal exercise. The results show similarities with the corresponding European options priced at the Zero Lower Bound during the COVID-19 crisis.
1. Introduction
The valuation and optimal exercise of American options is a challenging problem in option pricing theory (Kim 1990). It is even more demanding in the current situation in which financial markets have been affected by the outbreak of the COVID-19 pandemic. In February 2020, investors’ worries about the spread of COVID-19 outside of China caused the rapid freefall of equity markets around the world. For example, from 19 February 2020 to 23 March 2020, the S&P 500 index fell by 34%. In response to the financial market decline, regulators have tied the sort-term interest rates to zero, including the Federal Funds rate that is employed by the Federal Reserve to address the money supply in the U.S. economy. This policy is called Zero Lower Bound because interest rates do not go negative (Keister 2011). At the Zero Lower Bound, future or forward rates commonly used for gauging the market’s view are of limited use because they do not reflect the most likely future path of the short-term interest rate. A possible way out is to study the behavior of the shadow short rate, as discussed in Krippner (2013). Alternatively, market expectations can be inferred from option prices.
The aim of this paper is to provide a quantitative assessment of equity options priced at the Zero Lower Bound policy, i.e., when interest rates are set essentially to zero. We obtain closed form formulas for American options when the Zero Lower Bound holds and perform numerical implementation as a specific case of Barone-Adesi and Whaley (1987). Our results provide general pricing formulas for American options at the Zero Lower Bound. We apply the formulas to price American options written on the stock Federal National Mortgage Association (FNMA) during the COVID-19 crisis, where the Zero Lower Bound policy has been adopted. The results for the optimal exercise of American options are compared with the corresponding European options written on the same stock and show similarities for the pricing of American and European options during the COVID-19 crisis.
The pioneering work of Merton (1973) introduced the valuation of American calls on a stock with proportional dividends deriving the solution as a free-boundary problem. Since then, several contributions have discussed the pricing of American options written on a single underlying asset (Broadie and Glasserman 1997; Carr et al. 1992; Ibanez and Zapatero 2004; Jacka 1991; Karatzas 1988; Kim 1990). Longstaff and Schwartz (2001) and Tsitsiklis and Van Roy (2001) derived price estimates with fast computation that relies on the approximation to the dynamic programming principle. Two major mathematical difficulties encountered using traditional deterministic approaches for the valuation of American options, such as lattice- and tree-based techniques, have been the curse of dimensionality and the fact that the optimal exercise boundary must be determined as a part of the solution. For these reasons, theoretical works have been directed at either numerical methods relying on Monte Carlo simulation or approximation methods to estimate option prices. For example, Barone-Adesi and Whaley (1987) employed the quadratic approximation to value early-exercise premiums. The optimal exercise boundary and the corresponding valuation formula for contracts with nonconvex payoffs, such as American call options with constant and growing caps, are studied in Broadie and Detemple (1995), whereas the analytic valuation formula for American options written on assets that pay continuous dividends is introduced in Allegretto et al. (1995), where the pricing is obtained as the continuous limit of the valuation formula for American calls with early exercise at a finite number of points in time. More recently, Zhu (2015) derived asymptotic prices of call options with very large strikes and put options with very small strikes. Gapeev and Al Motairi (2018) obtained closed-form formulas for the pricing of perpetual American random dividend-paying put and call options in a set-up that extends Black–Merton–Scholes model considering full and partial information. The optimal exercise time is shown to be the first time that the underlying risky asset hits a constant barrier. Liu et al. (2019) proposed to value financial options using a data-driven approach that builds on the Artificial Neural Network (ANN), reducing the computational time for pricing significantly. Boire et al. (2021) studied a new method that exploits the importance sampling technique for pricing American options while reducing estimator bias and variance with simulation-and-regression-based methods. Tseng et al. (2021) developed a theoretical framework of two-factor lattices to investigate the impact of negative probabilities on option pricing where lattice feasibility is achieved with the adjustment in the lattice’s configuration. They find that out-of-the-money options are more affected by negative probabilities than in-the-money and at-the-money options. Chan and Zhu (2021) proposed a two-state regime-switching model for the American option pricing problem where the dynamics of the underlying are driven by a Markov-modulated Geometric Wiener process and interest and appreciation rates, and the volatility of the underlying rely on hidden states of the economy that are conveniently modeled with Markov chains.
Our work also adds to the recent literature that links option and stock prices during the COVID-19 outbreak. Data from option trade reflect the attempt of risk-averse investors to hedge against adverse index movements. Jackwerth (2020) uses option pricing on the S&P 500 index to estimate the risk-neutral density of the future index values that reveals concerns about potential market crash expectations during COVID-19 and other pandemics. Similarly, Ramelli and Wagner (2020) and Nguyen (2020) find that only a few stocks with strong exposure to China were affected during the early stage of the pandemic. Investors only realized belatedly the contagion effect to other stocks in the S&P 500 (Hanke et al. 2020). Kose and Li (2021) study how information influences price dynamics in stock and option markets during COVID-19. This is also documented in Yilmazkuday (2020), where an increase of 1% of daily COVID-19 cases in the U.S. has been shown to reduce the S&P 500 index about 0.01% after one day and about 0.03% after one month.
Our paper is relevant for quantitative analysts, risk managers, as well as policymakers to assess the impact of the restrictions related to COVID-19 on financial markets. The short-term rate is the main policy instrument used by regulators and reflects the short-term investors’ expectations about the central bank moves. During normal times, it is far away from zero. However, during the COVID-19 outbreak, regulators have tightened the rate at the Zero Lower Bound. Therefore, the understanding of market expectations needs to be addressed relying on other financial instruments, such as options. The rapid spread of COVID-19 favored the transmission of shocks from the real economy to financial markets and vice versa, emphasizing the importance of developing accurate analytic models to assess and quantify such shocks. Notably, the synchronous tumble in the stock market has played a central role for the propagation of the shock through the global financial market. Despite the announcement that the intervention of the regulators increased the expected upside potential for stock prices, market risks remained high. For this reason, we study stock option.
The Zero Lower Bound policy does not come free of costs as it limits the central bank’s capacity to stimulate the economic growth. Low interest rates that do not go below zero induce the liquidity trap, a macroeconomic condition where people prefer to hold cash or very liquid assets rather than other financial assets that only yield low returns. The major problem returned to prominence with the Subprime mortgage crisis that occurred between 2007 and 2010. During the Subprime crisis, monetary authorities have tried to avoid the liquidity trap by resorting to Quantitative Easing to further stimulate the economy. Quantitative Easing is an unconventional monetary policy adopted when inflation is very low or negative and relying on standard monetary policies have become ineffective. When it is put into force, the central bank purchases predetermined amounts of government bonds as well as riskier financial assets from commercial banks and other financial institutions. The injection of a money supply raises the prices of those financial assets and lowers their yield expanding, in turn, the economic activity.
2. Theoretical Framework
In this section, we introduce the theoretical set-up and derive closed form formulas for the pricing of American options at the Zero Lower Bound policy hold during COVID-19.
On the probability space , where is the risk-neutral measure, we consider an asset price described by the diffusion
where is a standard Brownian motion, r the interest rate, and . Modeling the asset price through the geometric Brownian motion, we assume log-Gaussianity of the probability distribution function of the asset, do not to take into account jumps, and rule out the observation of a chaotic time-varying asset (Grabinski et al. 2019; Klinkova and Grabinski 2017). We recall the following well-known result whose proof can be found in classical probability textbooks, see, for example, Revuz and Yor (2013).
Theorem 1.
- (1)
- Given a martingale and a convex function, the process is a submartingale.
- (2)
- Given a submartingale and a non-decreasing convex function, the process is a submartingale.
Considering the convex payoff of an America option, , the general pricing problem requires finding the solution to
From Theorem 1, the following result holds.
Proposition 1.
Consider the non-negative convex function such that and assume . Then, the finite expiration American option price written on the underlying asset price with the payoff function ϕ is:
Proof.
Under the risk-neutral measure , is a martingale, and Theorem 1 shows that the process is a martingale given that the function is convex. Therefore, for all bounded stopping times , we have
implying, in turn, that
Since T is a stopping time, it achieves the supremum above. □
Proposition 1 shows that it is optimal exercise is at maturity when . Using the probability density function
of the minimum of a Brownian motion with drift over
we find
with . The price of the American put option is recovered as follows:
- When , we have
- When we have
Pricing at the Zero Lower Bound
During the COVID-19 crisis, regulators have used the Zero Lower Bound policy, which implies setting interest rates never below the threshold . This implies the following:
Proposition 2.
When the interest rate is equal to the Zero Lower Bound, it holds:
Proof.
□
The price of an American option can then be derived in the next Proposition.
Proposition 3.
The price of an American option when the Zero Lower Bound holds, i.e., , is
- when :
- when :
Proof.
The proof follows as an application of Proposition 2. □
3. Empirical Application
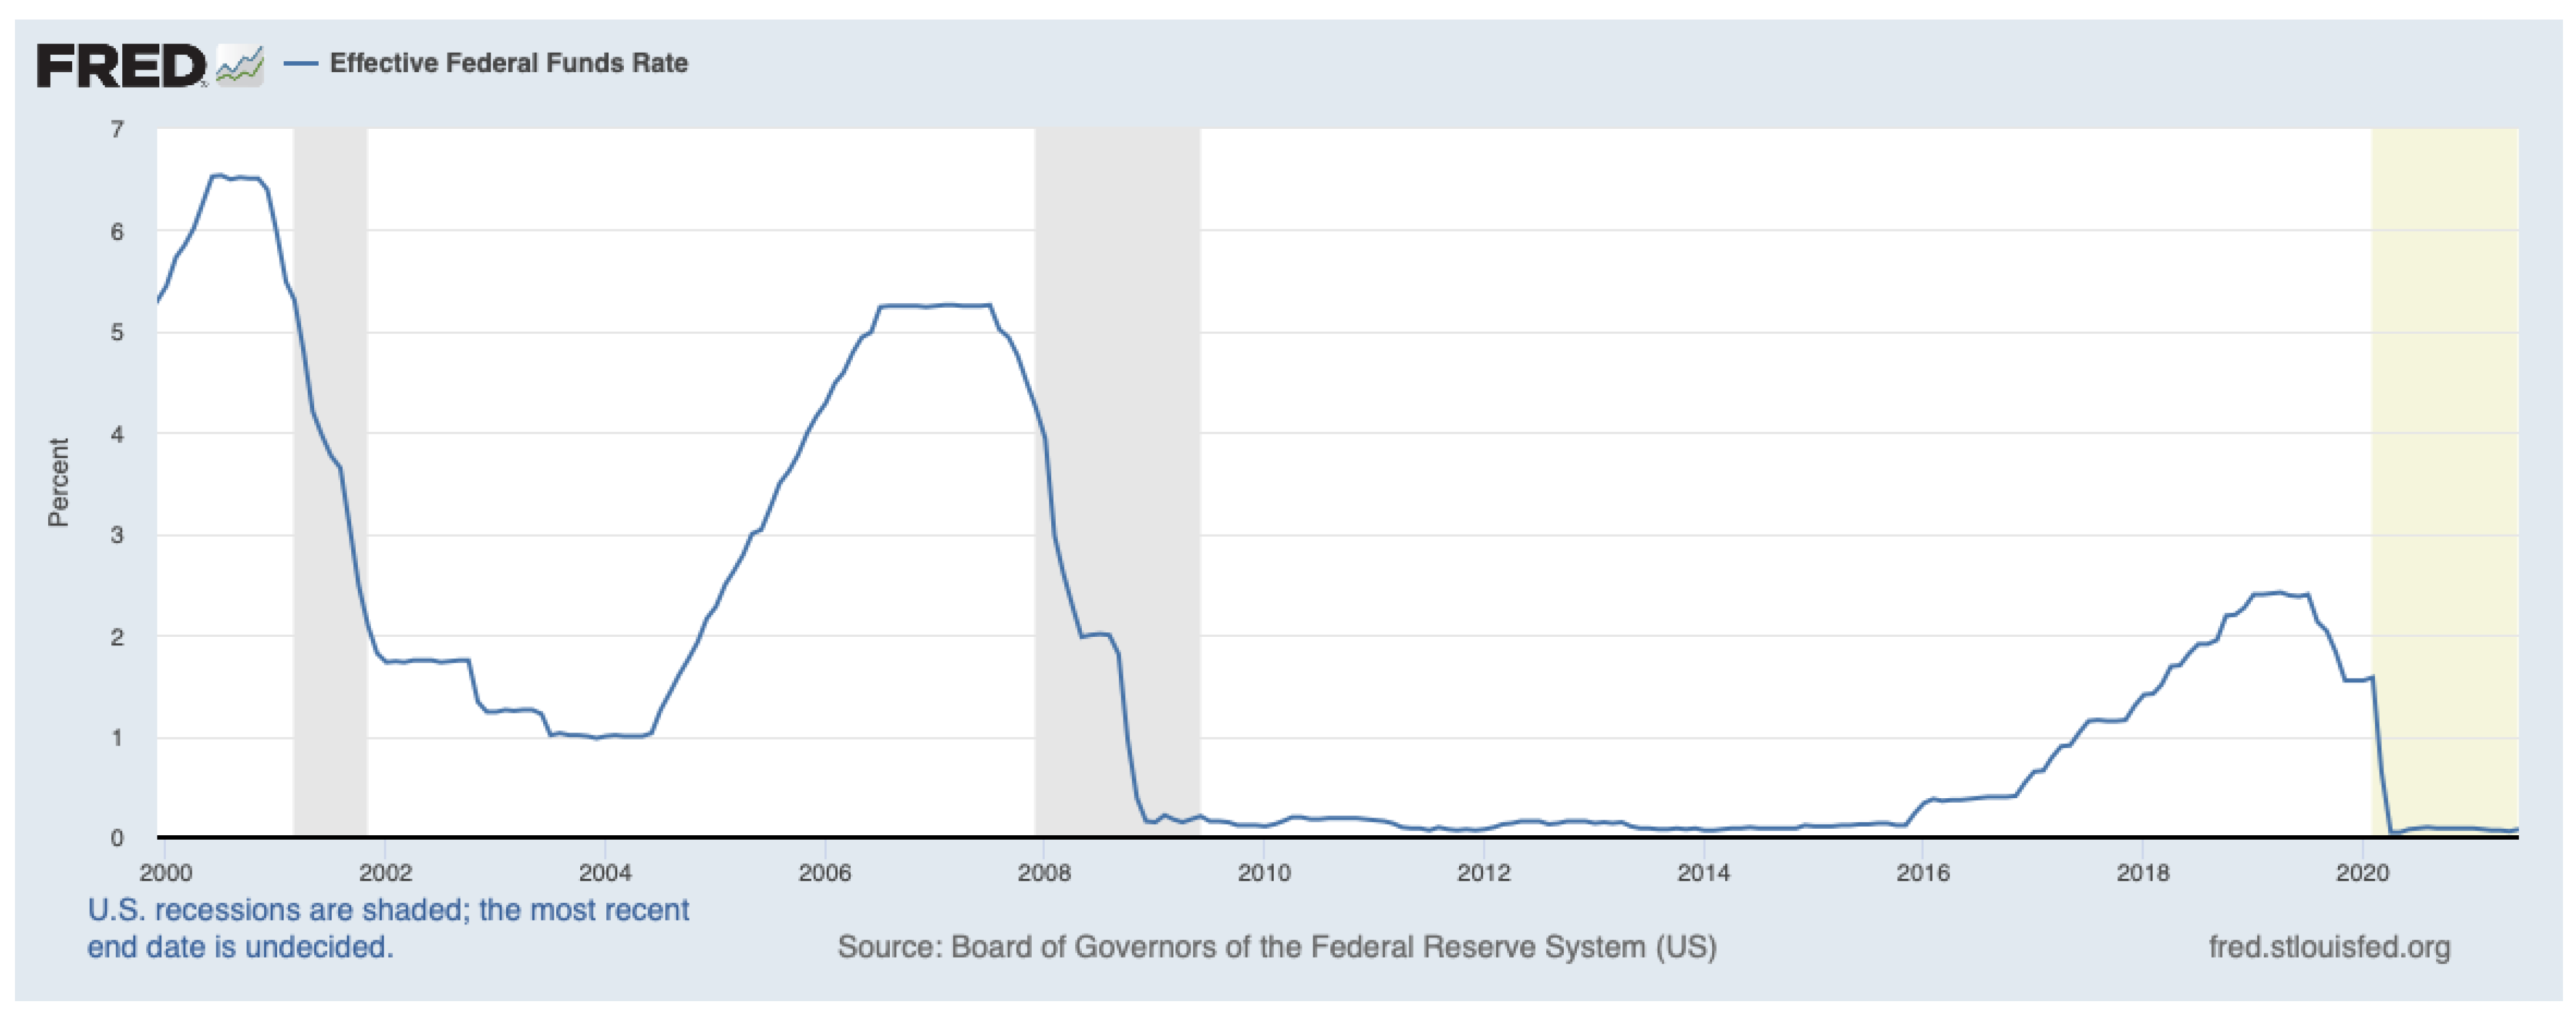
We illustrate an application of the results derived to price American options at the Zero Lower Bound during COVID-19 on real data. We consider the times series of Federal Fund Rate monthly data, which have been collected from the Board of Governors of the Federal Reserve System (US): https://fred.stlouisfed.org/series/FEDFUNDS (accessed on 1 July 2021) and span from January 2000 to June 2021. The Federal Fund Rate is the interest rates set by the Federal Open Market Committee (FOMC)—the body of the Federal Reserve System that addresses the monetary policy—where commercial banks borrow and lend their excess reserves to each other, usually on an overnight basis. The target is to adjust the supply of available liquidity, funds, inflation and have, depending on the leading economic conditions. Therefore, it represents a valid instrument to investigate the role of the COVID-19 outbreak on the financial market expectations. Figure 1 plots the time series of the rates highlighting the decline of the rate from February 2020 due to the introduction of the Zero Lower Bound policy.
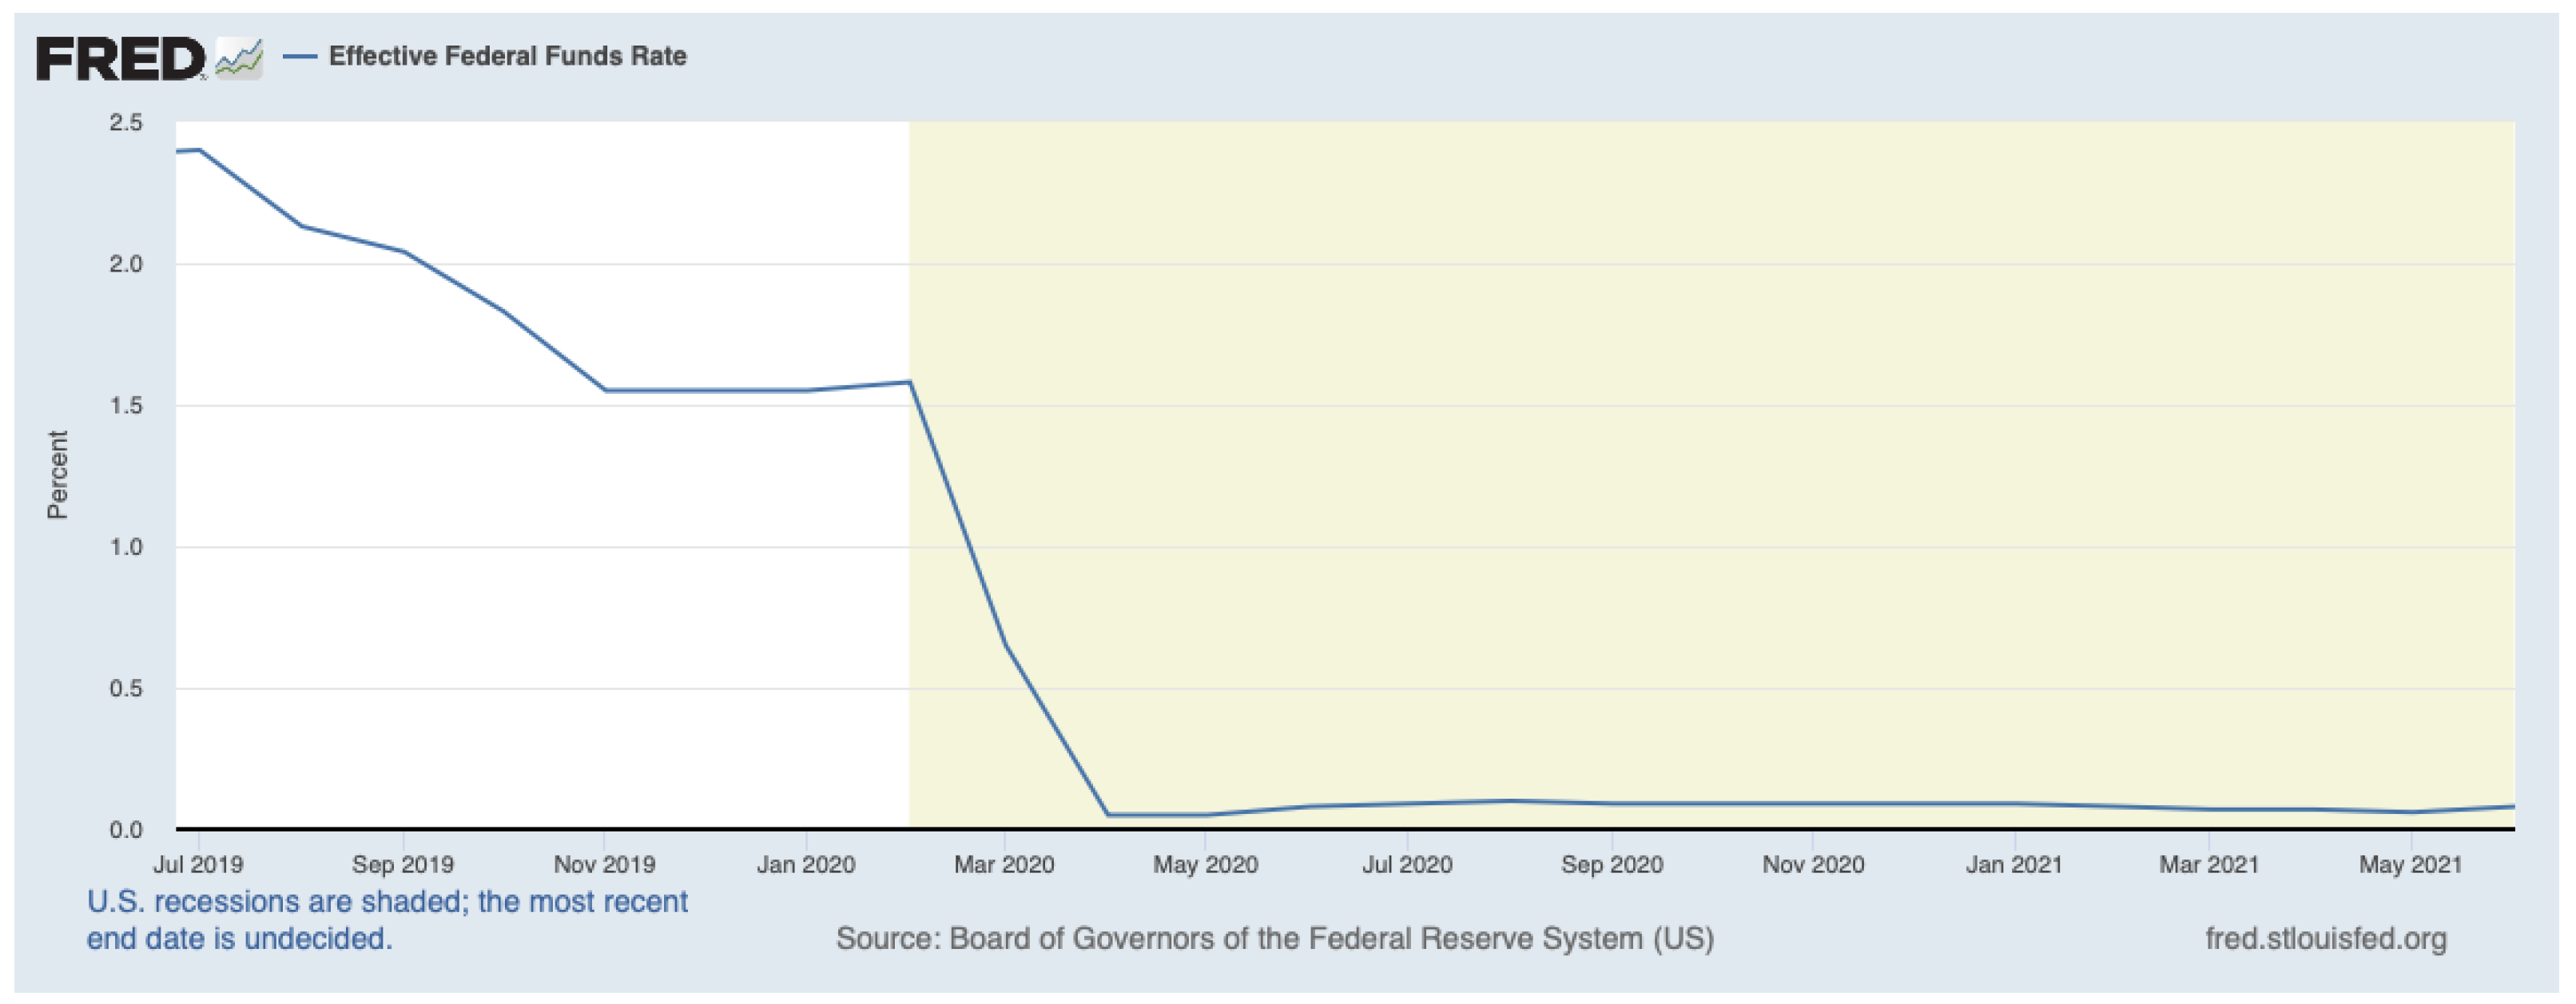
For the purpose of our application, which is to compare American and European option prices during COVID-19, we consider the Federal Fund Rate from February 2020 to June 2021. The values of the rate during the COVID-19 outbreak together with a plot showing the rapid decline in the curve are reported in Figure 2 and in Table 1. The rate has fallen from 1.58% in February 2020 to 0.08% in June 2021, which has also been the average value assumed by the rate during the COVID-19 outbreak. Moreover, we obtained monthly stock prices in USD of the stock Federal National Mortgage Association (FNMA), known as Fannie Mae, for the same period from January 2020 to June 2021 from Thomson Reuters. Fannie Mae is a government enterprise that stimulates homeownership and one of the two largest providers of liquidity to the secondary mortgage market. It purchases or guarantees mortgages issued by financial institutions (e.g., credit unions, banks, thrifts) and pools them together, building the well-known mortgage-backed securities, which are asset-backed securities that are secured by a mortgage or pool of mortgages. Such products are then sold to the market with the guarantee of payments of the principal and interests. This large purchase of mortgages in the secondary market creates liquidity for lenders and allows them to inject the liquidity into the market, underwriting additional mortgages. In 2020, Fannie Mae provided $1.4 trillion in liquidity to the mortgage market, granting six million homes to low-income Americans. Therefore, option prices on FNMA are a good proxy for the understanding the mortgage market’s view during the COVID-19 outbreak.
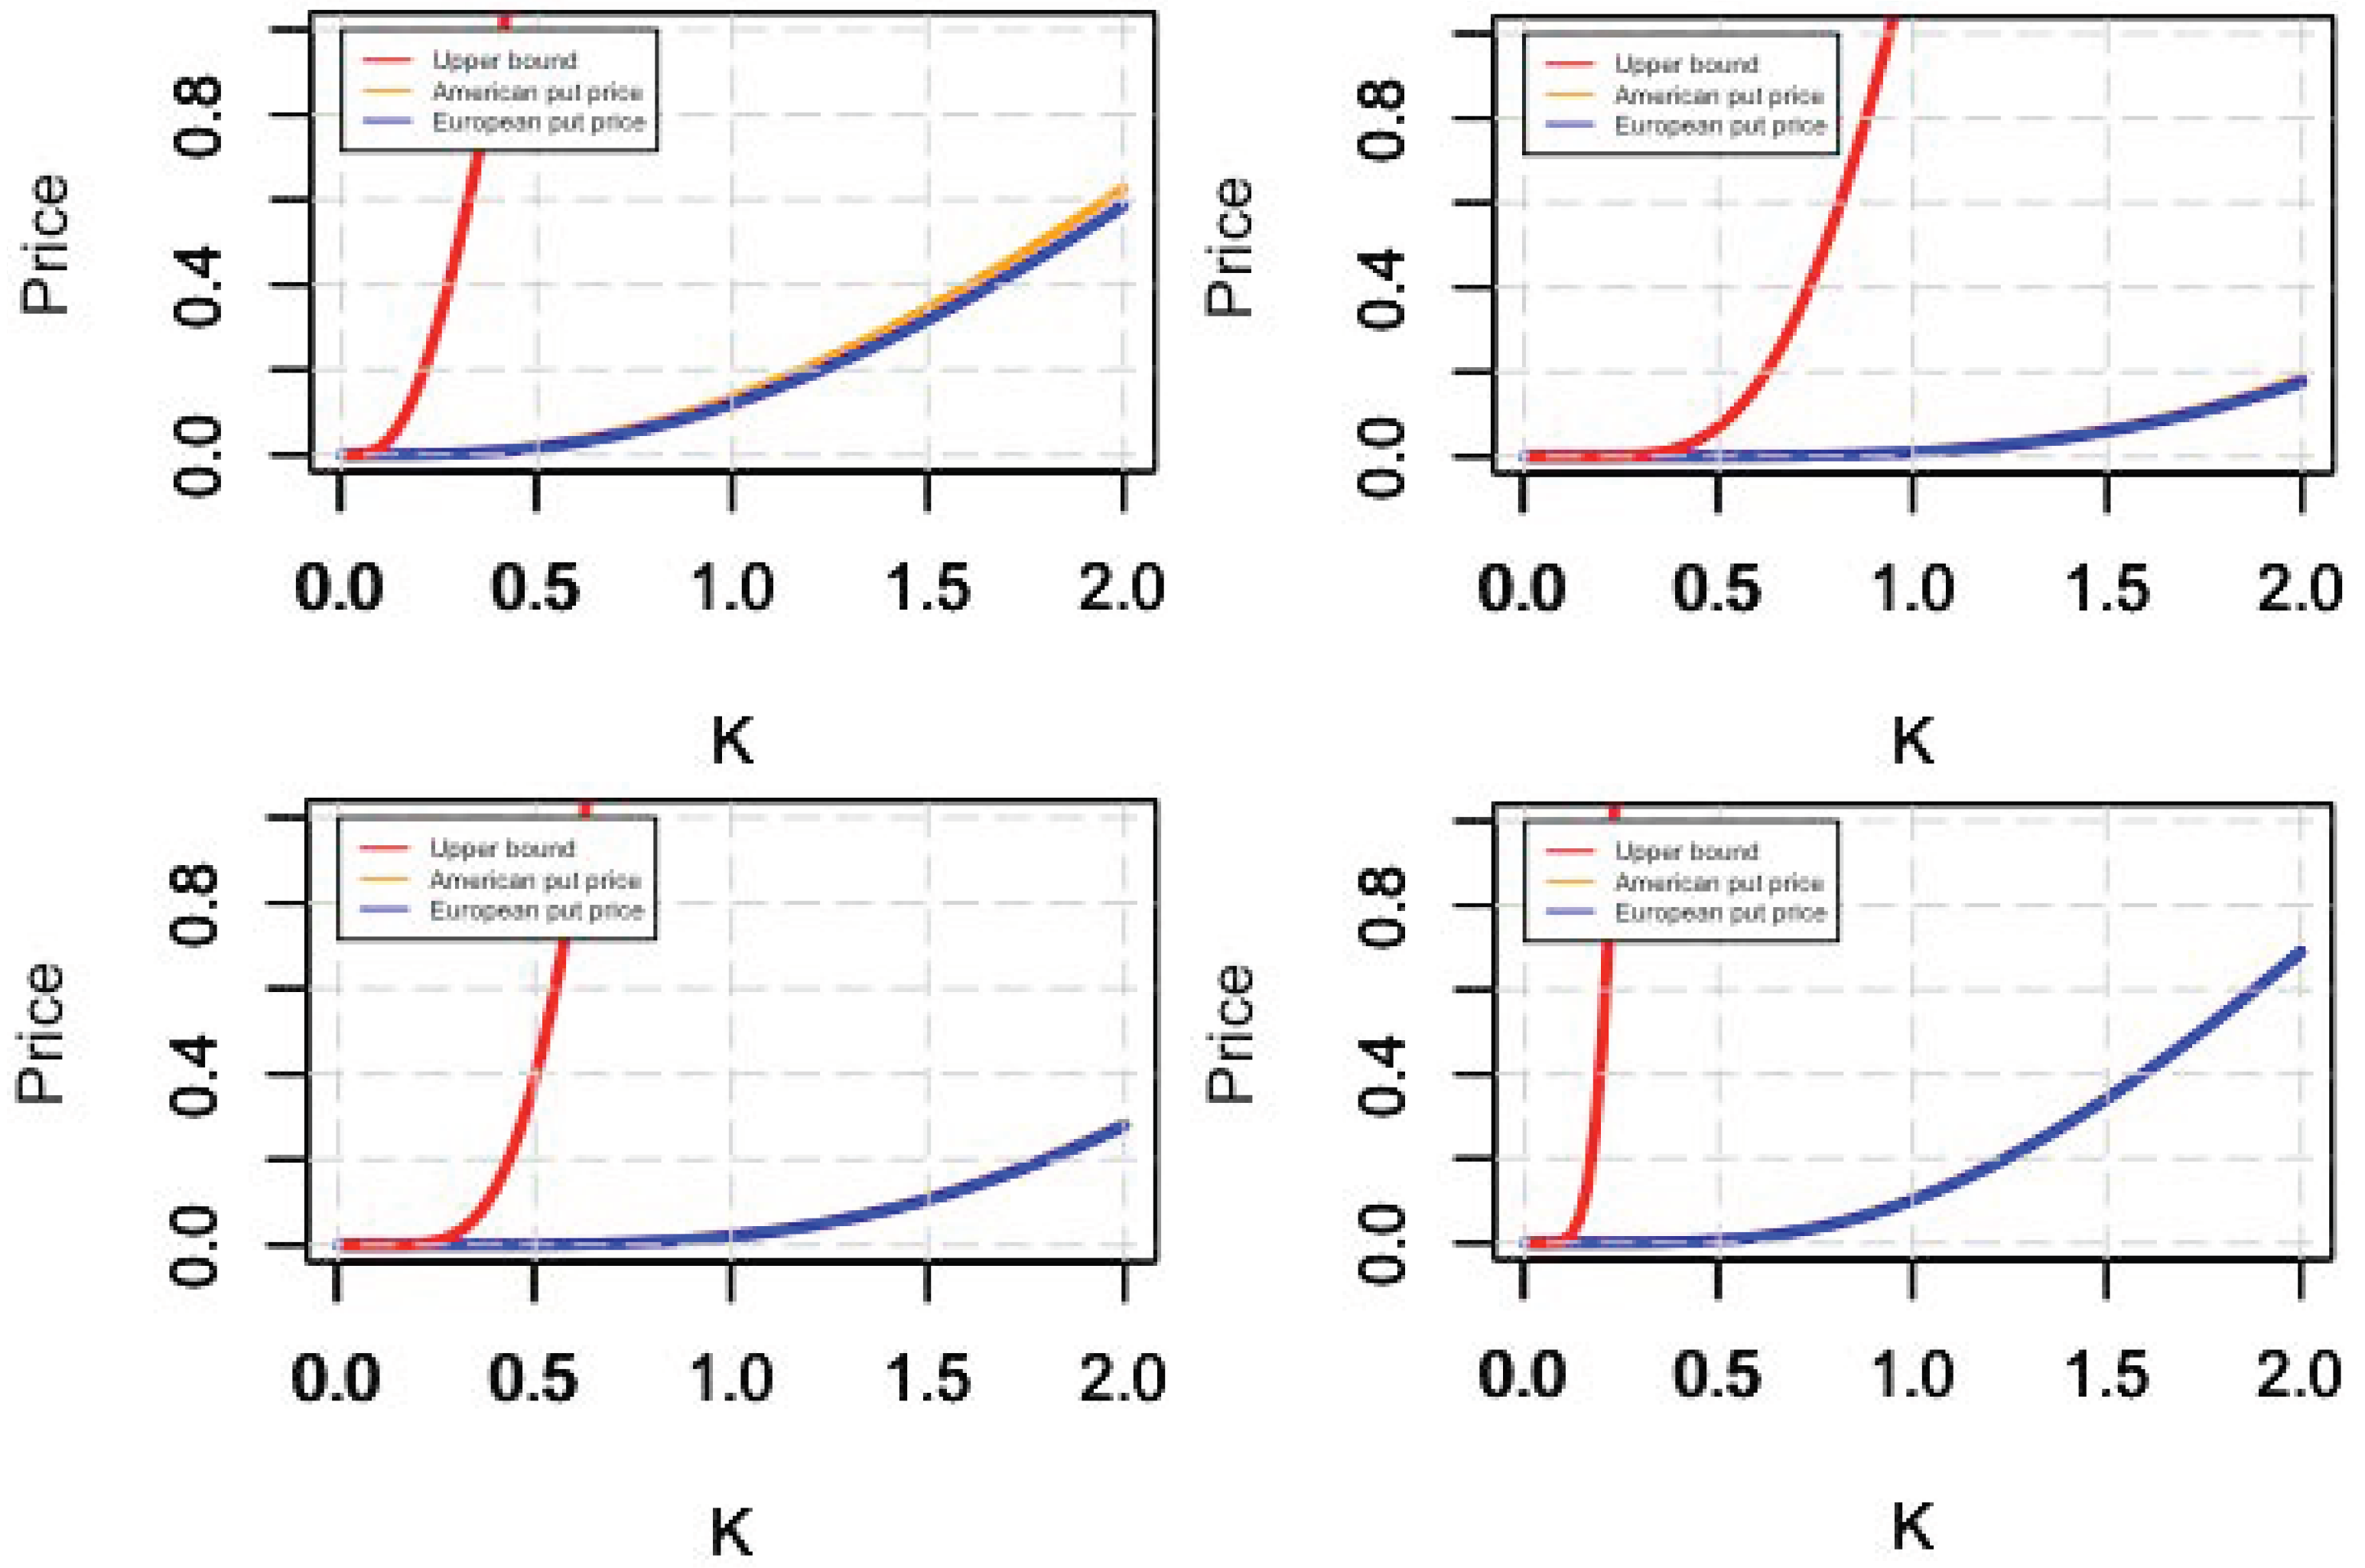
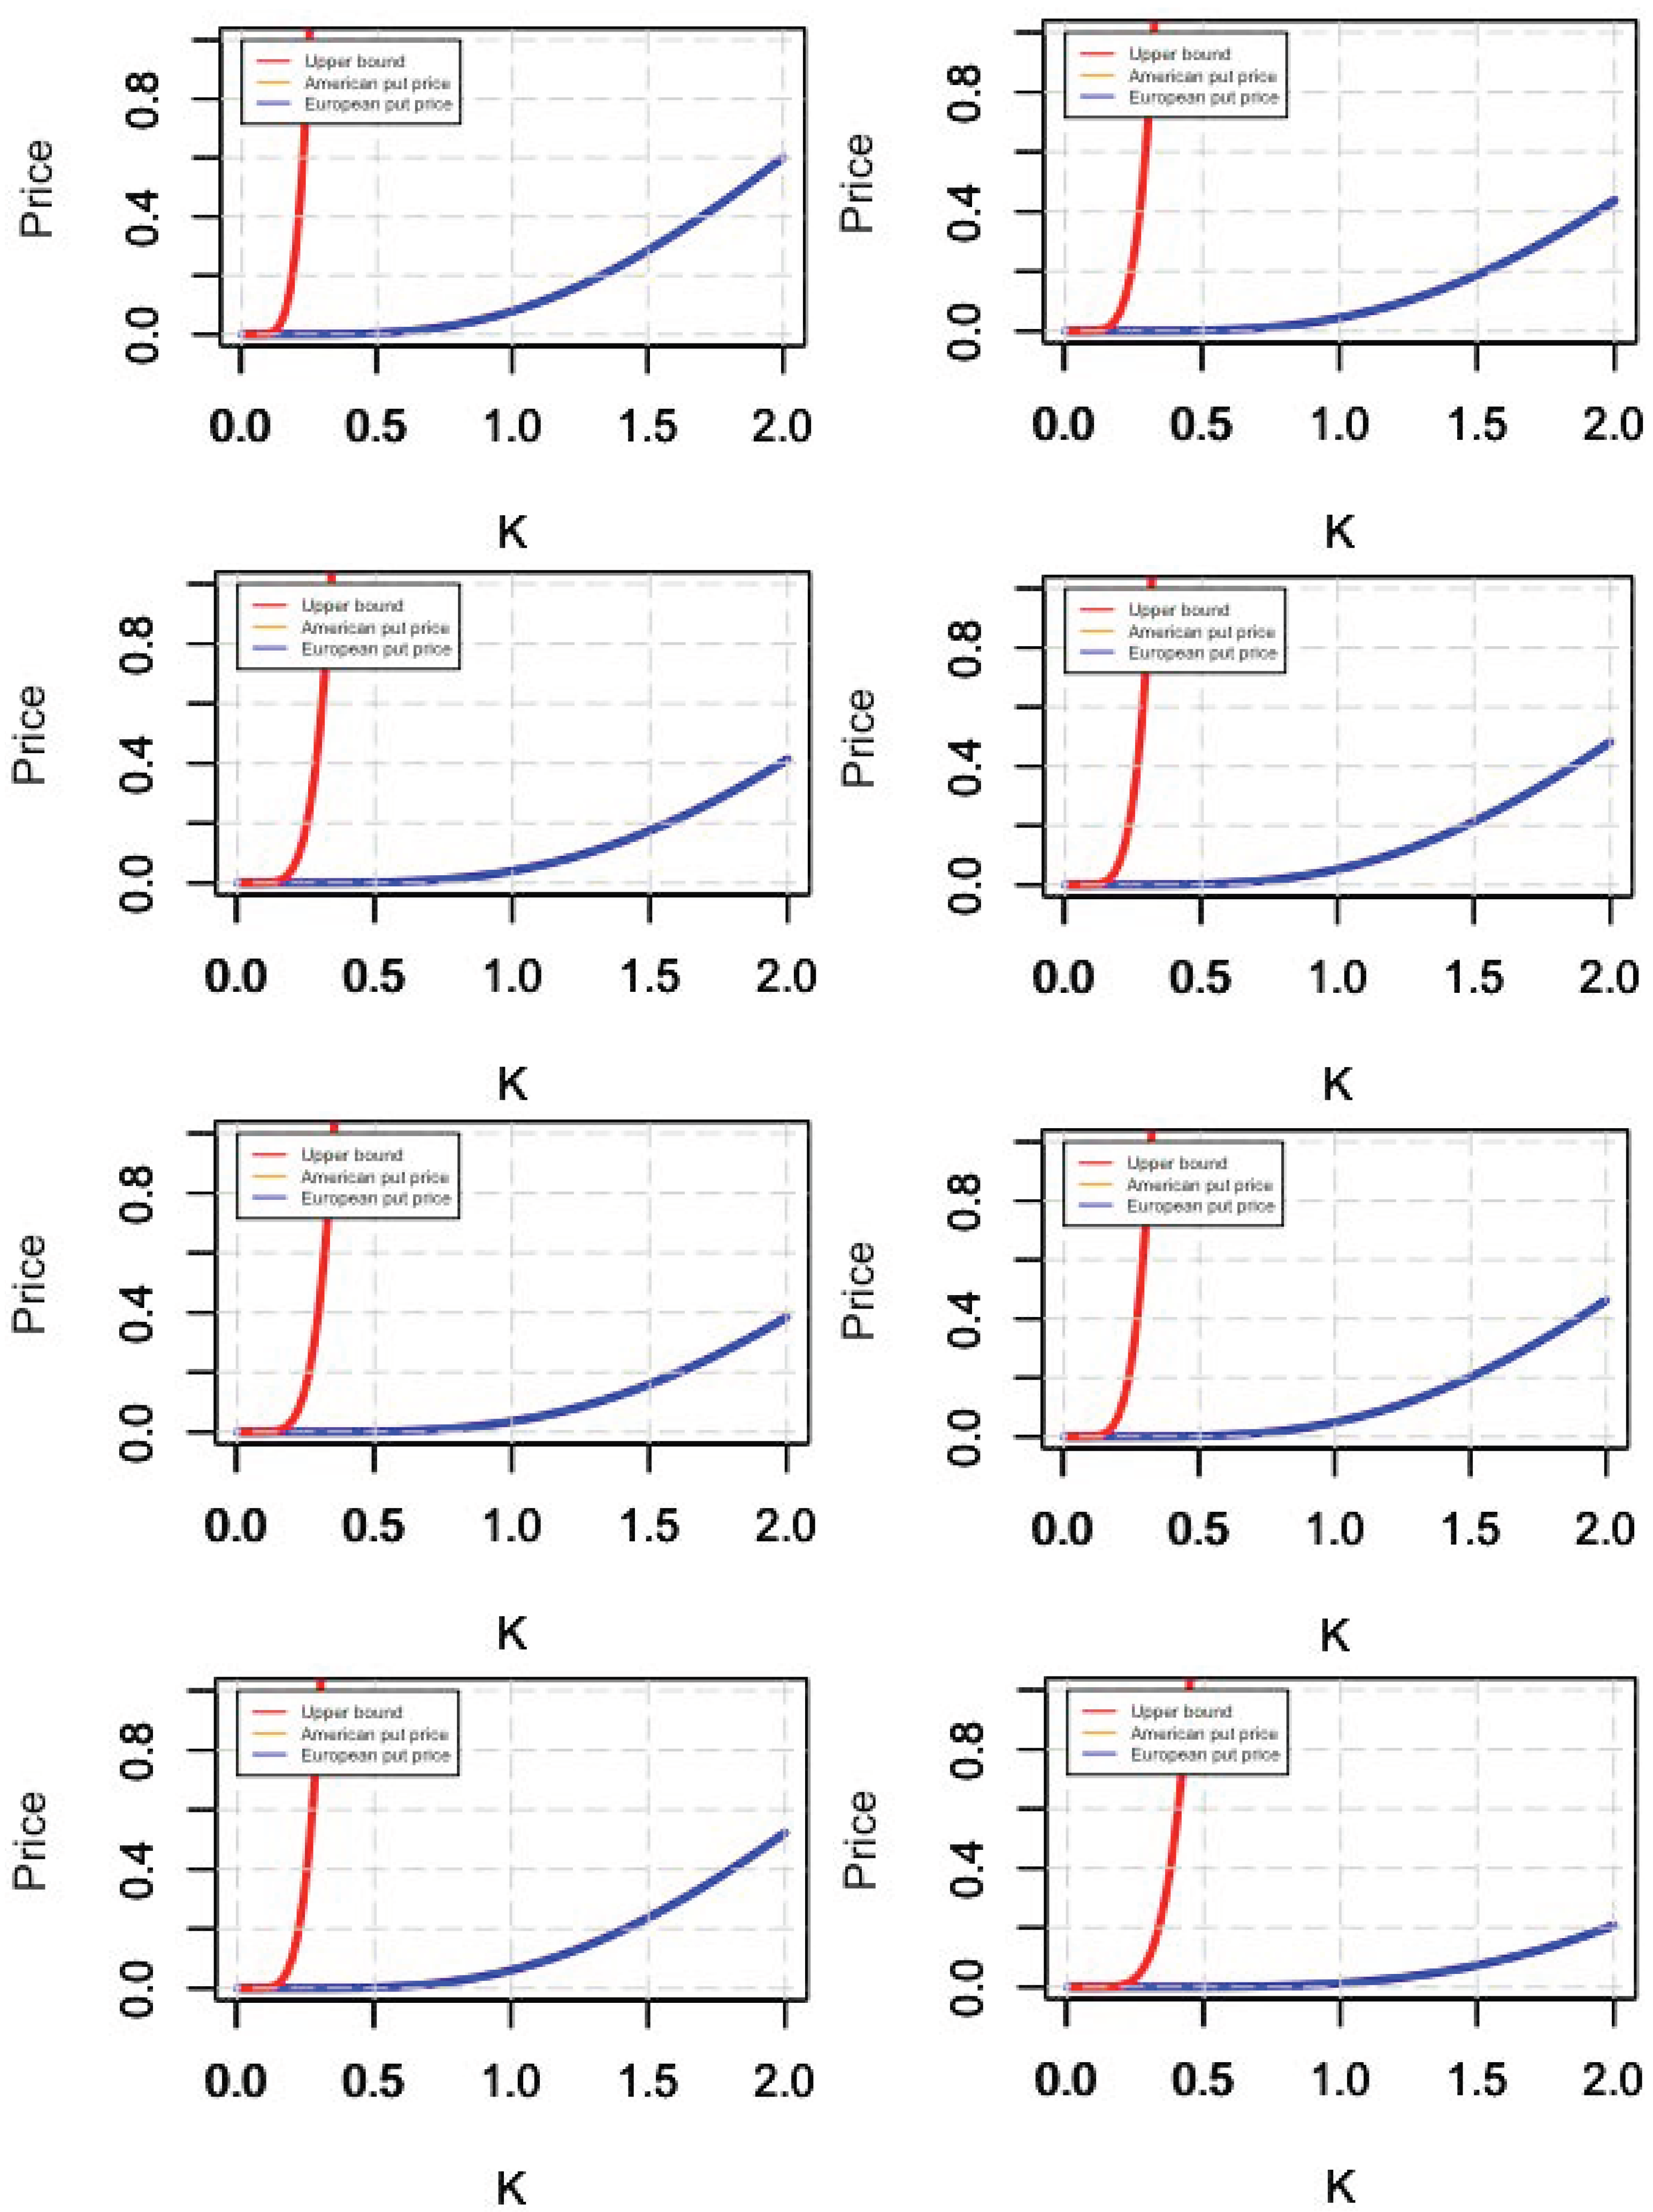
Figure 3, Figure 4 and Figure 5 compare the graphs of the price of finite expiration American put option written on the stock FNMA, as obtained in Equations (7) and (8), with the corresponding European put option written on the same underlying and priced according to the standard Black and Scholes (1973) formula. Both American and European option prices are computed for the stock prices of FNMA during the entire period of the COVID-19 crisis. We report in Figure 3, Figure 4 and Figure 5 the monthly option prices for FNMA since the changes in the value of interest rates during COVID-19 have been very slow, as described in Table 1, often at a frequency lower than a monthly basis. For the purpose of illustration, we only report the option prices computed accordingly. Therefore, the graphs from the second to the eighteenth show the pricing of American and European options written on FNMA stock prices of months from February 2020 to June 2021 and for different values of the strike price K during the CODIV-19 pandemic. The implementation of finite expiration American put option prices is based on the Barone-Adesi and Whaley (1987) approximation. We refer to Allegretto et al. (1995) for a related approximation of the early exercise premium. Interestingly, the graphs show that when the Zero Lower Bound holds, the interest rate approaches zero () and the price of the finite expiration American put option written on FNMA coincides with the price of the corresponding standard European put option. Indeed, the yellow lines indicating the price of American options overlap the blue lines indicating that of European options for almost the entire period in which regulators have used the Zero Lower Bound policy. This is in contrast with the implementation of American and European options written on the stock FNMA on July 2019 before the COVID-19 outbreak, as reported in the first graph of Figure 3, where the yellow and blue lines do not overlap.
The theoretical values obtained from real data can be exploited to infer the risk-neutral density function. This is a probability density function for which the current price of the option is equal to the theoretical price obtained discounting the expectation of its future price. The quantitative assessment of option prices during Zero Lower Bound policies may have given insight into understanding the markets’ views during other financial crises. Well-known examples are the US Subprime mortgage crisis in 2007–2010 that very much contributed to the EU sovereign debt crisis (2009–2019), where the Zero Lower Bound policy was associated with strong injections of Quantitative Easing, and the Chinese stock market crash in 2015.
4. Conclusions
The simple observation of the interest rate curve reflects money market futures and forward rates for government bonds revealing the market’s expectations. However, during the COVID-19 outbreak, regulators have tightened the rate to the Zero Lower Bound. Therefore, the understanding of the market’s view needs to be addressed in other ways. One possibility is to rely on other financial instruments, such as options. Using available option market prices, it is possible to reverse-engineer the valuation formula and obtain the volatility implied by these market prices. The implied volatility is considered better and more accurate than volatility measures based on the historical variation of price or statistical measures, such as standard deviation, as it is based on the current market prices of the option. For example, one indication of the anxiety of investors during COVID-19 is the fact that the 3-month downside implied the volatility skew, which compares put option prices with at-the-money option prices, has reached new all-time highs. A high skew reflects investors’ perception that a high volatility would return should markets sell off. It also indicate views that stocks would become increasingly correlated in such a scenario. The pandemic has recorded a rapid sell-off of stocks in financial markets, mainly explained by an increase in the amount of risk perceived by investors. Relying on the information hidden in the decline of equity prices may help policymakers detect its persistence and guide the evaluation of the policy response.
In this paper, we provided a quantitative assessment of equity options priced during the COVID-19 outbreak when the Zero Lower Bound policy holds, i.e., when interest rates are set essentially to zero. We obtained closed form formulas for American options and performed numerical implementation for the period of the COVID-19 crisis, where regulators adopted the Zero Lower Bound policy. We considered options written on the stock price of the Federal National Mortgage Association (FNMA), known as Fannie Mae, one of two large purchasers of mortgages in the secondary market, which issues guaranteed mortgage-backed securities to stimulate housing ownership for low to middle-income Americans. The results for the pricing of American options written on the Federal National Mortgage Association (FNMA) and of related optimal exercise bounds are compared with the corresponding European options, showing similarities for the pricing of American and European options during the COVID-19 outbreak.
The multivariate enhancement of this work is directed to study the effects of COVID-19 on a portfolio of stocks, and it is the object of current investigation. The goal is to consider Chinese and European stocks and compare them with the American market. Further extensions may include the empirical investigation of American and European options priced at the Zero Lower Bound during the COVID-19 pandemic and written on stocks similar to the FNMA. This may provide a response to the impact of the COVID-19 outbreak on credit.
Author Contributions
Conceptualization, G.M.; methodology, G.M.; software, G.M.; validation, G.M.; formal analysis, G.M.; investigation, G.M.; data curation, G.M.; writing—original draft preparation, G.M.; writing—review and editing, G.M. and L.P.; supervision, G.M. and L.P.; project administration, G.M. and L.P. All authors have read and agreed to the published version of the manuscript.
Funding
This research received no external funding.
Data Availability Statement
The data presented in this study are openly available in Yahoo Finance and https://fred.stlouisfed.org/series/FEDFUNDS (accessed on 1 July 2021).
Conflicts of Interest
The authors declare no conflict of interest.
References
- Allegretto, Walter, Giovanni Barone-Adesi, and Robert J. Elliott. 1995. Numerical evaluation of the critical price and american options. The European Journal of Finance 1: 69–78. [Google Scholar] [CrossRef]
- Barone-Adesi, Giovanni, and Robert E. Whaley. 1987. Efficient analytic approximation of american option values. The Journal of Finance 42: 301–20. [Google Scholar] [CrossRef]
- Black, Fischer, and Myron Scholes. 1973. The pricing of options and corporate liabilities. Journal of Political Economy 81: 637–54. [Google Scholar] [CrossRef] [Green Version]
- Boire, Francois-Michel, R. Mark Reesor, and Lars Stentoft. 2021. American option pricing with importance sampling and shifted regressions. Journal of Risk and Financial Management 14: 340. [Google Scholar] [CrossRef]
- Broadie, Mark, and Jerome Detemple. 1995. American capped call options on dividend-paying assets. The Review of Financial Studies 8: 161–91. [Google Scholar] [CrossRef]
- Broadie, Mark, and Paul Glasserman. 1997. Pricing american-style securities using simulation. Journal of Economic Dynamics and Control 21: 1323–52. [Google Scholar] [CrossRef]
- Carr, Peter, Robert Jarrow, and Ravi Myneni. 1992. Alternative characterizations of american put options. Mathematical Finance 2: 87–106. [Google Scholar] [CrossRef]
- Chan, Leunglung, and Song-Ping Zhu. 2021. An analytic approach for pricing american options with regime switching. Journal of Risk and Financial Management 14: 188. [Google Scholar] [CrossRef]
- Gapeev, Pavel V., and Hessah Al Motairi. 2018. Perpetual american defaultable options in models with random dividends and partial information. Risks 6: 127. [Google Scholar] [CrossRef] [Green Version]
- Grabinski, Michael, and Galiya Klinkova. 2019. Wrong use of averages implies wrong results from many heuristic models. Applied Mathematics 10: 605. [Google Scholar] [CrossRef] [Green Version]
- Hanke, Michael, Maria Kosolapova, and Alex Weissensteiner. 2020. Covid-19 and market expectations: Evidence from option-implied densities. Economics Letters 195: 109441. [Google Scholar] [CrossRef] [PubMed]
- Ibanez, Alfredo, and Fernando Zapatero. 2004. Monte carlo valuation of american options through computation of the optimal exercise frontier. Journal of Financial and Quantitative Analysis 39: 253–75. [Google Scholar] [CrossRef]
- Jacka, Saul D. 1991. Optimal stopping and the american put. Mathematical Finance 1: 1–14. [Google Scholar] [CrossRef]
- Jackwerth, Jens. 2020. What do index options teach us about covid-19? The Review of Asset Pricing Studies 10: 618–34. [Google Scholar] [CrossRef]
- Karatzas, Ioannis. 1988. On the pricing of american options. Applied Mathematics and Optimization 17: 37–60. [Google Scholar] [CrossRef] [Green Version]
- Keister, Todd. 2011. Why Is There a “Zero Lower Bound” on Interest Rates? Federal Reserve Bank of New York. Liberty Street Economics Blog. Available online: https://libertystreeteconomics.newyorkfed.org/2011/11/why-is-there-a-zero-lower-bound-on-interest-rates/ (accessed on 2 April 2020).
- Kim, In Joon. 1990. The analytic valuation of american options. The Review of Financial Studies 3: 547–72. [Google Scholar] [CrossRef]
- Klinkova, Galiya, and Michael Grabinski. 2017. Due to instability gambling is the best model for most financial products. Archives of Business Research 5: 255–61. [Google Scholar] [CrossRef] [Green Version]
- Kose, John, and Jingrui Li. 2021. Covid-19, volatility dynamics, and sentiment trading. Journal of Banking & Finance, 106162. [Google Scholar] [CrossRef]
- Krippner, Leo. 2013. Measuring the stance of monetary policy in zero lower bound environments. Economics Letters 118: 135–38. [Google Scholar] [CrossRef] [Green Version]
- Liu, Shuaiqiang, Cornelis W. Oosterlee, and Sander M. Bohte. 2019. Pricing options and computing implied volatilities using neural networks. Risks 7: 16. [Google Scholar] [CrossRef] [Green Version]
- Longstaff, Francis A., and Eduardo S. Schwartz. 2001. Valuing american options by simulation: A simple least-squares approach. The Review of Financial Studies 14: 113–47. [Google Scholar] [CrossRef] [Green Version]
- Merton, Robert C. 1973. Theory of rational option pricing. The Bell Journal of Economics and Management Science 4: 141–83. [Google Scholar] [CrossRef] [Green Version]
- Nguyen, Khoa. 2020. A Coronavirus Outbreak and Sector Stock Returns: The Tale from the First Ten Weeks of 2020. Available online: https://ssrn.com/abstract=3559907 (accessed on 1 July 2021).
- Ramelli, Stefano, and Alexander F. Wagner. 2020. Feverish stock price reactions to covid-19. The Review of Corporate Finance Studies 9: 622–55. [Google Scholar] [CrossRef]
- Revuz, Daniel, and Marc Yor. 2013. Continuous Martingales and Brownian Motion. Berlin/Heidelberg: Springer Science & Business Media, vol. 293. [Google Scholar]
- Tseng, Chung-Li, Daniel Wei-Chung Miao, San-Lin Chung, and Pai-Ta Shih. 2021. How much do negative probabilities matter in option pricing?: A case of a lattice-based approach for stochastic volatility models. Journal of Risk and Financial Management 14: 241. [Google Scholar] [CrossRef]
- Tsitsiklis, John N., and Benjamin Van Roy. 2001. Regression methods for pricing complex american-style options. IEEE Transactions on Neural Networks 12: 694–703. [Google Scholar] [CrossRef] [PubMed] [Green Version]
- Yilmazkuday, Hakan. 2020. Covid-19 Effects on the s&p 500 Index. Available online: https://ssrn.com/abstract=3555433 (accessed on 1 July 2021).
- Zhu, Lingjiong. 2015. Options with extreme strikes. Risks 3: 234–49. [Google Scholar] [CrossRef] [Green Version]
Figure 1.
Federal Fund Rate time series. 1 January 2000–1 June 2021.

Figure 2.
Federal Fund Rate time series: zoom on the COVID-19 outbreak. 1 July 2019–1 June 2021.

Figure 3.
Put option prices written on FNMA during COVID-19. The figure shows the price of American options (yellow lines), European options (blue lines), and bounds for optima exercise of American options (red lines). July 2019, February, March and April 2020.
Figure 3.
Put option prices written on FNMA during COVID-19. The figure shows the price of American options (yellow lines), European options (blue lines), and bounds for optima exercise of American options (red lines). July 2019, February, March and April 2020.

Figure 4.
Put option prices written on FNMA during COVID-19. The figure shows the price of American options (yellow lines), European options (blue lines), and bounds for optima exercise of American options (red lines). May, June, July, August, September, October, November and December 2020.
Figure 4.
Put option prices written on FNMA during COVID-19. The figure shows the price of American options (yellow lines), European options (blue lines), and bounds for optima exercise of American options (red lines). May, June, July, August, September, October, November and December 2020.

Figure 5.
Put option prices written on FNMA during COVID-19. The figure shows the price of American options (yellow lines), European options (blue lines), and bounds for optima exercise of American options (red lines). January, February, March, April, May and June 2021.
Figure 5.
Put option prices written on FNMA during COVID-19. The figure shows the price of American options (yellow lines), European options (blue lines), and bounds for optima exercise of American options (red lines). January, February, March, April, May and June 2021.


Table 1.
Federal Fund Rate. 1 February 2000–1 June 2021.
| Month | FFR | Month | FFR | Month | FFR |
|---|---|---|---|---|---|
| 02-2020 | 1.58% | 08-2020 | 0.09% | 02-2021 | 0.08% |
| 03-2020 | 0.65% | 09-2020 | 0.09% | 03-2021 | 0.07% |
| 04-2020 | 0.05% | 10-2020 | 0.09% | 04-2021 | 0.07% |
| 05-2020 | 0.05% | 11-2020 | 0.09% | 05-2021 | 0.06% |
| 06-2020 | 0.08% | 12-2020 | 0.09% | 06-2021 | 0.08% |
| 07-2020 | 0.09% | 01-2021 | 0.09% |
The table shows the Federal Fund rates (FFR) for the sample period February 2020–June 2021.
Publisher’s Note: MDPI stays neutral with regard to jurisdictional claims in published maps and institutional affiliations. |
© 2021 by the authors. Licensee MDPI, Basel, Switzerland. This article is an open access article distributed under the terms and conditions of the Creative Commons Attribution (CC BY) license (https://creativecommons.org/licenses/by/4.0/).
Share and Cite
MDPI and ACS Style
Morelli, G.; Petrella, L. Option Pricing, Zero Lower Bound, and COVID-19. Risks 2021, 9, 167. https://0-doi-org.brum.beds.ac.uk/10.3390/risks9090167
AMA Style
Morelli G, Petrella L. Option Pricing, Zero Lower Bound, and COVID-19. Risks. 2021; 9(9):167. https://0-doi-org.brum.beds.ac.uk/10.3390/risks9090167
Chicago/Turabian StyleMorelli, Giacomo, and Lea Petrella. 2021. "Option Pricing, Zero Lower Bound, and COVID-19" Risks 9, no. 9: 167. https://0-doi-org.brum.beds.ac.uk/10.3390/risks9090167
Note that from the first issue of 2016, this journal uses article numbers instead of page numbers. See further details here.