Article

Improving Semantic Similarity with Cross-Lingual Resources: A Study in Bangla—A Low Resourced Language

by
Rajat Pandit
1,*,
Saptarshi Sengupta
2,
Sudip Kumar Naskar
3,
Niladri Sekhar Dash
4 and
Mohini Mohan Sardar
5
1
Department of Computer Science, West Bengal State University, Kolkata 700126, India
2
Department of Computer Science, University of Minnesota Duluth, Duluth, MN 55812, USA
3
Department of Computer Science & Engineering, Jadavpur University, Kolkata 700032, India
4
Linguistic Research Unit, Indian Statistical Institute, Kolkata 700108, India
5
Department of Bengali, West Bengal State University, Kolkata 700126, India
*
Author to whom correspondence should be addressed.
Informatics 2019, 6(2), 19; https://doi.org/10.3390/informatics6020019
Submission received: 17 February 2019 / Revised: 14 April 2019 / Accepted: 20 April 2019 / Published: 5 May 2019

Abstract

:
Semantic similarity is a long-standing problem in natural language processing (NLP). It is a topic of great interest as its understanding can provide a look into how human beings comprehend meaning and make associations between words. However, when this problem is looked at from the viewpoint of machine understanding, particularly for under resourced languages, it poses a different problem altogether. In this paper, semantic similarity is explored in Bangla, a less resourced language. For ameliorating the situation in such languages, the most rudimentary method (path-based) and the latest state-of-the-art method (Word2Vec) for semantic similarity calculation were augmented using cross-lingual resources in English and the results obtained are truly astonishing. In the presented paper, two semantic similarity approaches have been explored in Bangla, namely the path-based and distributional model and their cross-lingual counterparts were synthesized in light of the English WordNet and Corpora. The proposed methods were evaluated on a dataset comprising of 162 Bangla word pairs, which were annotated by five expert raters. The correlation scores obtained between the four metrics and human evaluation scores demonstrate a marked enhancement that the cross-lingual approach brings into the process of semantic similarity calculation for Bangla.

1. Introduction

Semantic similarity between two words represents semantic closeness (or semantic distance) between the two words or concepts. It is an important problem in natural language processing as it plays a crucial role in information retrieval, information extraction, text mining, web mining and many other applications. In artificial intelligence and cognitive science also, semantic similarity has been used for different scientific evaluation and measurement as well as for deciphering the intricate interface operating behind the process of conceptualizing senses for a long time.
Theoretically, semantic similarity refers to the idea of commonality in characteristics between any two words or concepts within a language. Although it is a relational property between the concepts or senses, it can also be defined as a measurement of conceptual similarity between two words, sentences, paragraphs, documents, or even two pieces of texts.
Similarity among concepts is a quantitative measure of information and is calculated based on the properties of concepts and their relationships. Semantic similarity measures have applications in information extraction (IE) [1], information retrieval (IR) [2], bioinformatics [3,4], word sense disambiguation [5] etc.
Semantic relatedness, introduced by Gracia and Mena [6], and semantic similarity, are two related terms but, semantic relatedness is less specific than semantic similarity. For instance, when we say that two words are semantically similar, it means that they are used in the same way in relation to other words. For example, পেট্রোল (petrol) and ডিজেল (diesel) are similar terms owing to their common relation with fossil fuels. On the other hand, two words are related if they tend to be used near one another in different contexts. For example, পেট্রোল (petrol) and গাড়ি (car) are related terms but they are not similar in sense.
All similar concepts may be related but the inverse is not true. Semantic similarity and semantic distance of words or concepts are defined inversely. Let us suppose A1 and A2 are two concepts that belong to two different nodes N1 and N2 in a particular ontology. The similarity between these two concepts is determined by the distance between the nodes N1 and N2. Both N1 and N2 can be considered as an ontology or taxonomy that contains a set of synonymous terms. Two terms are synonymous if they are in the same node and their semantic similarity is maximized. Whenever we take up the question of semantic similarity, relatedness or distance we expect our system of evaluation to return a score lying between −1 and 1 or 0 and 1 where 0 indicates no similarity and 1 indicates extremely high similarity.
English is a well-resourced language and as such, a wide array of resources and methods can be applied for determining similarity between English words. However, languages such as Bangla do not enjoy this status owing to the lack of well-crafted resources. Thus, determining similarity between word pairs in such a language is a more complex task.
This paper focuses on semantic similarity measurement between Bangla words and tries to describe four different methods for achieving the same. Each method of semantic similarity measure is evaluated in monolingual and cross lingual settings and compared with other methods. The rest of the paper is structured as follows. Section 2 presents the related works of semantic similarity measure in English and other languages. Section 3 describes the proposed methodology adopted for achieving the goal. Section 4 describes the experimental setup. Section 5 gives details of the resource used for our work. Section 6 provides the experimental results and their analysis. Finally, the paper concludes in Section 7.

2. Related Work

Many works have been done on semantic similarity-based on either word similarity or concept similarity. Based on semantic relationships, work has been done on approaches involving usage of Dictionary and Thesaurus. Ones that are more complex depend on WordNet [7] and ConceptNet [8]. Fellbaum [9] introduced a method for similarity measures based on WordNet. Liu and Singh [10] worked on a technique based on ConceptNet. So far, four strategies are known for measuring similarity. These are: (i) structure-based measures, (ii) information content (IC)-based measures, (iii) feature-based measures and (iv) hybrid measures.
The structure-based similarity measures use a function to compute semantic similarity. The function calculates path length of the words or concepts and their position in the taxonomy. Thus, more linked words or concepts are more similar they are to each other. Rada et al. [11] calculated shortest path-based similarity using semantic nets. This measure is dependent on the distance method and is designed mainly to work with hierarchies. It is a very powerful measuring technique in hierarchical semantic nets. Weighted links [12] is an extension of the shortest path-based technique measure. Here the similarities between two concepts are computed using weighted links. There are two factors which affect the weight of a link viz. the depth of hierarchy (namely density of taxonomy), and the strength between child and parent nodes. The summation of the weights of the traversed links gives the distance between two concepts. Hirst and St–Onge [13] came up with a method to find relatedness between the concepts using the path distance between the concept nodes. The concepts are said to be semantically related to each other if there is relational closeness between the meanings of two concepts or words.
Wu and Palmer [14] proposed a similarity measure between two concepts in a taxonomy, which depends on the relative position of the concepts with respect to the position of the most common concept. Based on edge counting techniques, Slimani et al. [15] created a similarity measuring technique, which was an extension of the Wu and Palmer measure. To calculate sentence similarity Li et al. [16] proposed a method to include the semantic vector and word order in taxonomy. Leacock and Chodorow [17] put forth the relatedness similarity measure. In this technique, similarity of two concepts is evaluated by taking the negation of the logarithm of the shortest path length divisible by twice the maximum depth of the taxonomy.
The IC of concepts is another approach for tackling the similarity problem. The frequency of a particular term in a document collection is the key for calculating the IC value. There are many methods for calculating semantic similarity based on the IC of words or concepts. Resnik [18] presented a technique that uses IC of the shared parents. The reasoning behind this technique was that two concepts are more similar if they have more shared information. Lin et al. [19] put forth a semantic similarity measure based on ontology and corpus. The technique used the same formula as that of Resnik for information sharing but the difference lied in the definition of concepts, which gave a better similarity score. Other IC-based methods for handling the similarity problem were proposed such as the Jiang–Conrath [20] approach, which is an extension of the Resnik similarity. Jiang–Conrath and Lin similarity have almost identical formulae for calculating semantic similarity in the sense that both approaches compute the same components. However, the final similarity is formulated in two different ways using the exact components.
The problem with thesaurus-based approaches is that they are not available for every language. Furthermore, they are hard to create and maintain and sometimes many words and links between them are absent. To circumvent such problems, distributional or vector space models of meaning are used. In this domain, mention must be made about the cosine similarity metric, which is perhaps the most widely used measure. The Jaccard index, also known as the Jaccard similarity coefficient is another distributional similarity metric. Cosine similarities along with several other distributional similarity measures are calculated using the term document matrix of a given corpus, which is essentially a 2D array where the rows correspond to terms, and the columns represent the documents. Each cell of the matrix holds the count of the number of times a particular term has appeared in a particular corpus (or document). The intuition behind this approach is that two documents are similar if their vectors are similar.
Mikolov et al. [21,22,23] published three papers on the topic of distributed word embedding to capture the notion of semantic similarity between words, which resulted in Google’s unique Word2Vec model. The Word2Vec can operate in two forms; continuous bag-of-words (CBOW) or skip-gram. Both are variants of a neural network language model proposed by Bengio et al. [24] and Collobert and Weston [25]. However, rather than predicting a word conditioned on its predecessor, as a traditional bi-gram language model does, a word is predicted from its surrounding words (CBOW) or multiple surrounding words are predicted from one input word (skip-gram). Arefyev et al. [26] used the Word2Vec model in their research to detect similarity between Russian words. After comparing the results from the Word2Vec experiment with two other corpus-based systems for evaluating semantic similarity, it became clear that the Word2Vec model is a far superior approach and further work needs to be done on it.
However, traditional word embeddings only allow a single representation for each word. Newer methods have been proposed to overcome the shortcomings of word embeddings by modeling sub-word level embeddings (Bojanowski et al. [27]; Wieting et al. [28]) or learning separate sense embeddings for each word sense (Neelakantan et al. [29]).
Bojanowski et al. [27] approached the embedding task by representing words as bag-of-characters n-grams and the embedding for a word is defined as the sum of the embeddings of the n-grams. The method (popularly known as FastText) is particularly suited for morphologically-rich languages and it can compute word representation for words that are not present in the training data.
Faruqui and Dyer [30] presented a multi-lingual view of word embeddings. In this method, firstly, monolingual embeddings are trained on monolingual corpora for each language independently. Then a bilingual dictionary is used to project monolingual embeddings in both languages into a shared bilingual embedding space where the correlation of the multilingual word pairs is maximized using canonical correlation analysis (CCA). They reported that the resulting embeddings can model word similarities better than the original monolingual embeddings.
In a very recent development, Conneau et al. [31] presented a method for learning translation lexicons, (or cross-lingual alignments) in a completely unsupervised manner without the need for any cross-lingual supervision. The method involves learning monolingual embeddings independently and learning a linear mapping weight to overlap the monolingual semantic spaces of both languages leveraging adversarial training. This method has paved the way for unsupervised machine translation which is particularly suitable for low- or zero-resource (i.e., parallel corpora) language pairs.
Several other methods based on feature and hybrid measures have been suggested. Tversky [32] proposed a method using features of terms for measuring semantic similarity between them. The position of the terms in the taxonomy and their IC were ignored in this method. The common features between the concepts increase the similarity in this method. Petrakis et al. [33] gave a word matching method called X-similarity, which was a feature-based function. The words are extracted from the WordNet by parsing term definition for a match between the words. Two terms are said to be similar when concepts of the words and their neighborhoods are lexically similar. Sinha et al. [34] introduced a new similarity measure for the Bangla language based on their developed Mental Lexicon, a resource inspired by the organization of lexical entries of a language in the human mind.
Sinha et al. [35] proposed a semantic lexicon in Bangla which is hierarchically organized and also a method to measure semantic similarity between two Bangla words using a graph-based edge weighting technique.

3. Methodology

Our work on measuring semantic similarity between Bangla words involves both path-based semantic similarity and distributional (Word2Vec-based) semantic similarity. WordNet [7], being the only semantic ontology available for Bengali, is used for implementing the path-based semantic similarity method in the present work.
The information content-based semantic similarity of Li et al. [16] requires sense annotated corpus which is unavailable for Bangla. The Bangla semantic lexicon proposed in [35] is not publicly available and the method proposed in [35] for computing semantic similarity is not directly applicable to the Bangla Wordnet as such. The semantic similarity of Wu and Palmer [14] and Slimani et al. [15] are applicable on WordNet. However, in this paper, we limit the study of semantic similarity in Bangla to path-based similarity, the most rudimentary method of computing similarity based on semantic ontology, and distributional similarity, the state-of-the-art method in semantics.
We use the path-based semantic similarity and distributional semantic similarity in both monolingual as well as cross-lingual settings, thus giving rise to four different methods. The four methods are described below and they are summarized in Table 1.
  • S S P _ M : Path-based semantic similarity using Bangla WordNet.
  • S S P _ C : English translations of Bangla words and path-based semantic similarity using English WordNet.
  • S S D _ M : Monolingual distributional(Word2Vec) semantic similarity in Bangla.
  • S S D _ C : Cross-lingual distributional(Word2Vec) semantic similarity using Translations.
The monolingual approaches described in the study are applied on Bangla only as our objective is to study semantic similarity in Bangla whereas, the cross-lingual approaches involve translating Bangla words into their English counterparts and calculating semantic similarity in English. IC-based methods [4,18,19,20] are more reliable than path-based method. Unfortunately, they could not be attempted due to unavailability of sense-annotated corpora in Bangla. Obviously, we could apply IC-based methods of semantic similarity for the translation-based approaches. However, to keep our evaluation metrics fair in all settings, we chose only the path-based method as the baseline, which could easily be applied for both the languages.
We considered a cross-lingual approach in the study since the English WordNet is much more enriched than the Bangla WordNet and the English Word2Vec model is supposed to be better than the Bangla Word2Vec model. Also, it is one of the objectives of this study to experiment whether an enriched WordNet and better Word2Vec model in English lead to improved similarity metric in Bangla when we take a cross-lingual approach (i.e., via translation of Bangla words). An explanatory figure for the cross-lingual approaches is given in Figure 1.
In order to measure semantic similarity between Bangla words B 1 and B 2 using the cross-lingual approach, we consider the English translations of B 1 and B 2 . According to the figure, B 1 has M translations in English i.e., T r ( B 1 ) = { E B 1 1 , E B 1 2 , E B 1 M } and B 2 has N translations in English i.e., T r ( B 2 ) = { E B 2 1 , E B 2 2 , E B 2 N } . We compute semantic similarity (either path-based or distributional) between each pair of English words, denoted by the table row and column header and fill up the entire semantic similarity matrix. For example, the matrix cell corresponding to the i t h row and j t h column represents the similarity between E B 1 i and E B 2 j . Finally, the semantic similarity (SS) between B 1 and B 2 is computed following Equation (1).
S S ( B 1 , B 2 ) = m a x E B 1 i T r ( B 1 ) , E B 2 j T r ( B 2 ) S S ( E B 1 i , E B 2 j )

3.1. Path-Based Semantic Similarity Using Bangla WordNet ( S S P _ M )

The path-based approach is one of the oldest methods used for calculating semantic similarity between senses or concepts. It belongs to the thesaurus-based class of semantic similarity algorithms and measures semantic similarity between a pair of senses in terms of path length of the shortest path between the two senses in an ontology. WordNet is the most popular resource for measuring path-based semantic similarity.
WordNets for all languages share a common foundation in construction. They all follow three main principles: minimalism, coverage, and substitution for the synsets they contain. Minimalism refers to the property of representing a concept by a small (minimal) set of lexemes, which clearly define the sense. Coverage refers to the property of a synset for including all the words representing the concept for a language considered. Finally, substitution indicates the property of swapping or substituting words in a context with words appearing in their corresponding synset in a reasonable amount of corpora.
Formally, path-based similarity between two senses is defined as the inverse of the shortest path length between them, as in Equation (2).
S I M P A T H ( s 1 , s 2 ) = 1 / P a t h l e n g t h ( s 1 , s 2 ) .
To avoid division by zero, path length is defined as in Equation (3).
P a t h l e n g t h ( s 1 , s 2 ) = 1 + number of edges in the path between sense nodes s 1 and s 2 in the WordNet Hypernym Graph .
This formulation of the pathlength and S I M P A T H also keeps the path-based similarity in a scale of 0 to 1 and assigns the maximum similarity of 1 between a sense and itself. The path-based semantic similarity algorithm measures similarity between senses or concepts. However, the same algorithm can be used to measure semantic similarity between words as in Equation (4). In Equation (4), B 1 and B 2 represent the Bangla words between which we want to measure the semantic similarity and S(w) returns the senses of w.
S S ( B 1 , B 2 ) = m a x s 1 i S ( B 1 ) , s 2 j S ( B 2 ) S I M P A T H ( s 1 i , s 2 j ) .
Let us consider path-based similarity between the Bangla words দিন and রাত. দিন has 10 senses according to the Bangla WordNet—{সময়, কাল, জমানা, দিন, বেলা}1 [ {time} the time as given by a clock], {দিন, দিবস, দিবা}2 [ {day} time from sunrise to sunset], etc. Similarly, রাত has only one sense in the Bangla WordNet {রাত,রাত্রি, ত্রিযামা, নিশি, নিশা}1 [ {night} time from sunset to sunrise]. The superscripts indicate sense identifiers. Words within a synset (enclosed within curly brackets) are essentially a set of synonymous words.
According to the Bangla WordNet, sense 1 of দিন and sense 1 of রাত have the least path length between them equalling to 2. Thus, S I M P A T H [দিন, রাত] = 1 / 2 = 0.5 .
Figure 2 shows an excerpt of the hypernym-hyponym structure from the Bangla WordNet showing the shortest path (indicated by the bold arrow) between synsets containing the Bangla words, দিন and রাত. Thus, the pathlength between দিন and রাত comes out to be 2.

3.2. Path-Based Semantic Similarity Using Translation and English WordNet ( S S P _ C )

English can be considered as a ‘well-resourced’ language because of the myriad of richly designed resources and tools available for language processing tasks. The English WordNet is one such example. It is much more developed in comparison to the Bangla WordNet and has coverage far superior to the WordNets for other languages. The Bangla WordNet shares similar roots with the English WordNet as it was created using an expansion approach from the Hindi WordNet, which in turn was inspired by the English WordNet. However, there exists some dissimilarities in terms of the number of senses a word carries, such as রাত (night) which has eight senses in the English WordNet but only one sense in the Bangla WordNet.
The idea here is to obtain a projection of Bangla words in English through translation and then calculate the path-based similarity using the English WordNet. The translation pair with the maximum value (least path length) is assigned as the similarity score for the Bangla word pair.
Let us consider the similarity between রোগী and যন্ত্রণা using this approach. The set of English translations for the Bangla word রোগী is Tr(রোগী) = {‘sick’, ‘unwell’, ‘patient’}. Similarly, the set of translations for যন্ত্রণা is Tr(যন্ত্রণা) = {‘gall’, ‘pain’, ‘anguish’, ‘grief’, ‘agony’, ‘torture’, ‘torment’, ‘affliction’, ‘troublesome’}.
Path-based similarity is computed using English WordNet for every English word pair [ E i , E j ] such that E i T r ( রোগী), E j T r ( যন্ত্রণা). Finally, the maximum of S I M P A T H ( E i , E j ) (0.2 in this case) is assigned as the similarity between রোগী and যন্ত্রণা according to this approach.

3.3. Monolingual Distributional (Word2Vec) Semantic Similarity in Bangla ( S S D _ M )

Word2Vec is one of the most effective and efficient models for semantic similarity. It is a distributional or corpus-based approach for finding semantic similarity between word pairs and is emerging as one of the most promising and popular approaches for context modeling. It is a shallow word-embedding model, which means that the model learns to map each word into a low-dimensional continuous vector space from their distributional properties observed in raw text corpus. The beauty of the Word2Vec model is that not only does the model generate positive similarity scores between word pairs, it also produces negative scores which indicate that the “word vectors” are opposite in direction and thus the words have an antonym type of relationship.
As mentioned earlier, the Word2Vec is a group of models, which generate word embeddings. Word embedding is a collective term for a set of language modeling and feature learning techniques in NLP where words in a given corpus are mapped onto a vector of real numbers. This is where the Word2Vec’s ability is seen in that it uses word vectors to calculate semantic similarity. There are two modes of operation of Word2Vec i.e., skip-gram and CBOW. CBOW is an architecture of Word2Vec, which calculates the word vector for a target word given its surrounding words or context while skip-gram calculates the context word(s) from the given word. Put another way, CBOW learns to predict the word given context whereas skip-gram can be considered as the reverse CBOW predicting the context given the target word because we are ‘skipping’ over the current word in the calculation.
As our work deals with semantic similarity, we wanted to generate the word vectors in order to calculate their distance (an inverse measure of similarity) from each other in semantic space and as such chose the CBOW approach. Moreover, prediction of context was not of much relevance to our work and as such, we stuck to the CBOW method.
We trained the model on a Bangla corpus (cf. Section 4) and obtained similarity scores reflected by the cosine of the angle between the word vectors.
Example: The distributional semantic similarity for মা (Mother) and মহিলা (Woman) is 0.67, which is slightly greater than double the score of the previous approach, which was shown to be 0.33.

3.4. Cross-lingual Distributional (Word2Vec) Semantic Similarity using Translations ( S S D _ C )

The principal of distributional semantics is that, larger the training corpus better is the model created. Bangla is a less digitized language and therefore, obtaining a well-developed sizable Bangla corpus is difficult task. However, getting hold of good quality large English corpus is almost a trivial task owing to their ready availability. The idea here is similar to the S S P _ C approach (cf. Section 3.2). We obtain the English translations (Tr) of the Bangla words to be compared (say, B 1 and B 2 ) (cf. Figure 1) and compute semantic similarity between every word in Tr ( B 1 ) and Tr ( B 2 ) according to the English Word2Vec model. Finally, the maximum of these similarity scores is assigned as the semantic similarity between B 1 and B 2 .
Example: For the example word pair মা (Mother) and মহিলা (Woman), the following English translations are obtained.
Translations for মা = {‘Mother’, ‘Mamma}
Translations for মহিলা = {‘Woman’, ‘Lady’}
The English Word2Vec model returns the highest similarity of 0.80 between ‘Mother’ and ‘Woman’, which is assigned as the similarity score between মা and মহিলা.

4. Experimental Setup

The Bangla corpus used for training the Word2Vec model consisted of 1270 text files. These files were combined into a single text file and all unnecessary information such as XML like tags was removed using a suitable text editor. The English corpus comprised of a collection of 182 XML files, all of which were agglomerated into a single XML file which was ultimately converted into a text file by removing the XML tags. Both corpora are described in Section 5.
In order to build the word vectors, the Word2Vec model was trained on the preprocessed corpora.
  • Word2Vec can operate in two modes i.e., skip-gram or CBOW. For our experiments, we chose the CBOW mode.
  • We used two English corpora in our work. The Gigaword corpus (cf. Section 5) is available as pre-trained word vectors created using the GloVe (https://nlp.stanford.edu/projects/glove/) algorithm [36]. However, since we are dealing with the Word2Vec model, we had to convert the GloVe vectors to their corresponding vectors for use with Word2Vec using a converter program (https://github.com/manasRK/glove-gensim).

5. Resources Used

The resources used for our work are as follows.
  • We used both the Bangla WordNet (http://www.cfilt.iitb.ac.in/indowordnet/) [7] and the English WordNet 3.0 (http://wordnetweb.princeton.edu/perl/webwn) [37] in our study. Some statistics of the Bangla and the English WordNet are given in Table 2, which clearly shows the superiority of the English WordNet over the Bangla WordNet.
  • The gensim (https://radimrehurek.com/gensim/) library, developed for the Python programming language, was used for the implementation of the Word2Vec model.
  • Translations of the Bangla words were obtained from three online sources—Google Translate, www.shabdkosh.com and www.english-bangla.com. Coverage is always an issue with dictionaries; bilingual (translation) dictionaries often miss some source words, or some translations of the source words. Therefore, we considered translations from three different sources so that most of the translations are covered for each of the testset word. We used a python package, mtranslate 1.3 (https://github.com/mouuff/mtranslate), an API for collecting the translations from Google Translate. The source code of mtranslate was modified to collect translations from all three sources.
  • Bangla Corpus: The technology development for Indian languages (TDIL) (http://www.isical.ac.in/~lru/downloadCorpus.html) corpus was used for training the Word2Vec model in Bangla. This corpus is a collection of modern Bangla prose texts published between 1981 and 1995. The subject matters of this corpus span across several domains such as literature, social science, commerce, mass media and many more [38]. In total, the TDIL corpus covers texts from 85 subject areas [39]. Table 3 provides some statistics of the TDIL corpus.
  • English Corpus: The British National Corpus (BNC)-Baby Edition (http://ota.ox.ac.uk/desc/2553) maintained by the University of Oxford was used for training the English Word2Vec model. The BNC Baby corpus comprises of texts from four domains—academic, fiction, newspapers and conversations between speakers of British English. Table 3 shows some statistics of the British National Corpus. We also used pre-calculated word vectors trained on a combined corpus including Google Inc.’s Gigaword corpus 5th edition, developed by Parker et al. [40] and Wikipedia 2014. The Gigaword corpus is a collection of newswire text data that was collected over many years by LDC (Linguistics Data Consortium) at the University of Pennsylvania. It has 6 billion tokens and a vocabulary size of 400,000 uncased words. The vectors are available in 4 dimension variants—50, 100, 200 and 300.
  • We used the natural language tool kit (NLTK) [41] for its path-based model implementation using the English WordNet.

6. Experimental Results

6.1. Evaluation Dataset

For the evaluation of the semantic similarity methods, we used a dataset (the dataset will be made available for public access upon acceptance of the article) comprising of 162 Bangla word pairs. The dataset was carefully created by an expert linguist with over twenty years of research experience and the semantic similarity score for each word pair was assigned by students well versed with the problem of semantic similarity and having foundational knowledge in linguistic theory which provided them with the strong intuition needed for ascertaining their scores. The scores provided by them for each pair, was considered as the gold standard against which our results were measured. There were five raters in total and each rater provided a score for semantic similarity on a Likert scale of 1 to 5 where 1 indicates complete dissimilarity and 5 indicates absolute similarity.
The selection of 162-word pairs is controlled by several linguistic-cum-cognitive criteria which enabled us to delimit the dataset within a fixed number that can be openly verified and measured on the account of semantic proximity by the respondents engaged in the experiment. The first criterion that is invoked for the selection of the dataset is the frequency of occurrence of the word-pairs in the present Bangla text corpus. The word-pairs that have been selected as controls for the experiment registered a very high frequency of usage across all text domains included in the corpus (Dash [42]). The second criterion is the ‘imageability’ which signifies that each word-pair that is put to the dataset for the experiment must have a real image-like quality based on which a reference to the word-pair will evoke a clear and concrete image in the mind of the respondents, and they will be able to visualize the conceptual-interfaces underlying between the word-pairs. The third or last criterion, which is far more important and crucial here, is the ‘degree of proximity’ between the concepts represented by the word-pairs and the respondents reacting against these word-pairs within an ecosystem of language use controlled by various praxis of discourse and ethnographic constraints. Although, in a true pragmatic sense, we should refrain ourselves from claiming the present dataset is ‘global’, we can, however, argue that it is maximally wide and adequately representative for the present scheme of research; it may be further augmented keeping in mind the nature requirement of future studies when we try to measure the length of semantic proximity across cross-lingual databases.

6.2. Results and Analysis

Inter-rater agreement was computed according to Fleiss’ kappa ( κ ) and Krippendorff’s alpha ( α ) (cf. Table 4). Pairwise percentage agreement and Cohen’s kappa (cf. Table 5) between each rater was also calculated.
There is widespread disagreement within the research community regarding the interpretation of the Fleiss’ kappa scores partly because an “acceptable” level of inter-rater agreement largely depends on the specific field of study. Among the several interpretations of kappa ( κ ) values, the one proposed by Landis and Koch [43] seems to have been cited most by researchers. As such, according to this scheme, our raters had a slight agreement among themselves, as a 0.17 (cf. Table 4) kappa score falls in the range 0.01–0.20, which is the range for such a category of agreement. With such a low agreement score among our raters, the correlation results calculated subsequently (between the raters and the system scores) was bound to lie within a spectrum of high and low values i.e., some raters scores would have high correlation with the evaluation metrics while others, not so much. The same fact is further corroborated by the alpha value obtained. From the pairwise inter-rater agreement figures given below, it is clear that several pairs of raters agreed more, than they did with the rest.
The cells marked in ‘green’ (in the upper triangle) indicate pairwise inter-rater percentage agreement while those marked in blue (in the lower triangle) indicate pairwise Cohen’s kappa agreement.
We compute similarity between each word pair using the four different similarity metrics and compare the metric scores with the gold standard similarity scores as defined by human annotators to evaluate the similarity metrics. Table 6 shows the evaluation results. Each cell in this table indicates the Pearson correlation value between the scores provided by a rater and the corresponding similarity metric scores. The column titled ‘majority’ denotes the correlation scores obtained when the majority score from among the five annotators is considered. In case of a tie, we selected a score randomly from among the scores that tied. The column titled ‘overall’ represents the correlation values for a particular metric with respect to all the raters.
The path-based similarity metric based on Bangla WordNet S I M P A T H _ B A S E D B E N G produces correlation scores in between 0.16 and 0.20. However, it is to be noted that out of a total 162 test cases, it returned a score of zero in 55 (33.95%) cases. A detailed analysis of these 55 cases revealed the following.
  • In 21(12.96%) cases, one of the words (cases) was absent in the Bangla WordNet. There were no cases where both words in a test word pair were absent in the Bangla WordNet.
  • Ineight8 (4.94%) cases, one of the words, in spite of being present in the WordNet, did not have any hypernym relations. Similarly, in three (1.85%) cases, neither word in the test word pair possessed any hypernym.
  • For 18 (11.11%) cases, the words in the test word pairs did not share a common ancestor and thus obtaining zero S I M P A T H _ B A S E D B E N G score.
From the statistics above, it can be noticed that the numbers do not add up to the number of cases (55) producing zero score. This is owing to the fact that there were several cases among the 55, in which a word in a test pair was repeated in another test pair producing zero score for both test pairs. As such, we wanted the analysis of the cases to reflect only the unique test pairs. These discrepancies reveal the weaknesses of the Bangla WordNet and in turn the path-based similarity metric S I M P A T H _ B A S E D B E N G built on it.
The main motive behind using cross-lingual approaches to semantic similarity was to take advantage of the well-developed resources in English. The path-based similarity model with translation and English WordNet S I M P A T H _ B A S E D B E N G E N G shows significant improvements over the monolingual counterpart as can be observed from the results in Table 6. It improved the correlation scores across all the annotators; the improvements being very high (more than double) with respect to R2, R4 and R5 and moderate for R1 and R3. The correlation for S I M P A T H _ B A S E D B E N G E N G with respect to majority voting annotation scores was also found to be more than double than that for S I M P A T H _ B A S E D B E N G , thus marking significant improvements from the monolingual path-based setting.
S I M P A T H _ B A S E D B E N G E N G is really put into perspective when we consider only those cases (106, 65.43% of the test set) for which both the path-based approaches produced non-zero similarity scores. Such a setup is needed in order to truly appreciate the improvements obtained in light of the English WordNet. This is because several pairs obtained zero scores for the S I M P A T H _ B A S E D B E N G approach thus lowering the correlation for the S I M P A T H _ B A S E D B E N G method. As such, observing those zero scores along with the other non-zero scores for other pairs would not lead to comparable results. Therefore, we recomputed the correlation scores considering only those scores for which both path-based metrics produced non-zero scores which would help in truly identifying how much improvement the English WordNet results in. The results for this setup are presented in Table 7.
Correlation values improved for S I M P A T H _ B A S E D B E N G E N G with respect to each annotator as well as majority voting and overall scoring when compared to S I M P A T H _ B A S E D B E N G . As a consequence of removing the zero similarity scored pairs from both path-based metrics, we find several changes in the correlation values for the setup in comparison to when all the test cases were included (cf. Table 6). It can be seen that S I M P A T H _ B A S E D B E N G correlation scores increased for annotators R2, R4 and R5 with a good improvement with respect to the majority and overall scores as well. This was quite expected owing to the fact that 55 zero scores were removed from the analysis and only the non-zero scores were used for measuring correlation. However, scores declined for raters R1 and R3. On the other hand, S I M P A T H _ B A S E D B E N G E N G was found to produce lower correlation scores (except for R3 and overall) in comparison to the ones obtained with the metric when all the pairs were considered. Intuitively, it can be understood that eliminating the zero scored pairs for S I M P A T H _ B A S E D B E N G from the dataset also removed good scores obtained with S I M P A T H _ B A S E D B E N G E N G which in turn caused the reduction in correlation values. However, the overall S I M P A T H _ B A S E D B E N G E N G correlation score remains the same. It is evident from Table 7 that, although the correlations improve substantially for S I M P A T H _ B A S E D B E N G for this subset, S I M P A T H _ B A S E D B E N G E N G still outclasses S I M P A T H _ B A S E D B E N G even on this dataset.
Compared to 55 (33.95%) cases of 0 scores for S I M P A T H _ B A S E D B E N G , S I M P A T H _ B A S E D B E N G E N G resulted in 0 scores for only 2 (1.23%) cases; a significant (96.36%) improvement as is visible from both Table 6 and Table 7. In both these two cases, a proper translation of Bangla words was not obtained using our resources; the cases being রোদ্দুর (sunlight) and ধারে (nearby). Thus, this method becomes reliant on the translation resources, considering the errors creeping in by the translation process. All in all, improvement can be attributed due to the wide coverage of the English WordNet.
However, this method did show weaknesses in certain cases, e.g., in case of computing similarity between বন্যা (flood) and পর্বত (mountain). The translations produced by the translation tools for these two words are as follows.
  • Tr (বন্যা) = {‘cataclysm’, ‘diluvium’, ‘feral’, ‘flood’, ‘inundation’, ‘spate’}
  • Tr (পর্বত) = {‘fell’, ‘hill’, ‘mountain’, ‘rock’}.
The path-based similarity between ‘spate’ and ‘mountain’ turned out to be 1 since spate#n#1 and mountain#n#2 belong to the same synset (“a large number or amount or extent”) in English WordNet. Although, according to the English WordNet this approach results in such a high similarity score between বন্যা and পর্বত, native speakers seldom think of this similarity in the metaphoric (and rare) usage of these two words. This example is perhaps an indication that when considering similarity between word pairs, we should not consider their very rare usages.
The Bangla Word2Vec model S I M W O R D 2 V E C B E N G produced really poor correlation scores compared to the path-based models with the correlation scores ranging from 0.08 to 0.16. However, an interesting finding is that it correlated better than the S I M P A T H _ B A S E D B E N G model with respect to the majority score. The S I M W O R D 2 V E C B E N G based correlation score with respect to the majority score was also found to be higher than the S I M W O R D 2 V E C B E N G -based correlation scores with respect to individual rater scores. It is interesting to note that whenever we obtain a zero similarity score for a test word pair for either of the path-based methods, it can be due to a variety of factors as discussed before. However, when we obtain a zero score from a distributional approach, it simply implies that either (or both) of the words is absent from the corpus on which the model was trained and as such their vectors could not be generated.
The cross-lingual Word2Vec models S I M W O R D 2 V E C B E N G E N G produced much better correlation scores than the S I M W O R D 2 V E C B E N G model; the correlation scores being much higher than for the S I M W O R D 2 V E C B E N G model with respect to each annotator. Predictably, among the two English Word2Vec models, the model (pre)trained on the Gigaword corpus performed better than the one trained on the BNC corpus with a sharp increase in correlation score with respect to majority voting; however the scores either declined or stayed same for raters R3 and R5. The comparative study (cf. Table 6) of the results obtained with S I M W O R D 2 V E C B E N G and S I M W O R D 2 V E C B E N G E N G is an indicator of the fact that using a richer and more diverse corpus results in better word vectors and in turn better similarity scores.
When contrasted with S I M W O R D 2 V E C B E N G , the distributional model trained on the Gigaword corpus showed as much as 125% increase in correlation scores with respect to rater R1 while it showed a maximum of 87.5% increase over the model trained on the British National corpus for the same rater. Correlation scores improved for annotators R1, R2 and R4 increasing to almost double whereas the improvement was slightly less evident for R3 and R5 when contrasting S I M W O R D 2 V E C G i g a w o r d B E N G E N G with S I M W O R D 2 V E C B E N G . Similar to S I M W O R D 2 V E C B E N G , the correlation score with respect to majority score for the Word2Vec model trained on the Gigaword corpus was higher than the correlation scores with respect to all annotators.
It is to be noted that S I M W O R D 2 V E C B N C B E N G E N G performs better than S I M W O R D 2 V E C B E N G despite the size of the English BNC corpus being smaller than the Bangla TDIL training data. This result is quite surprising. One could perhaps conjecture that Bangla is a morphologically richer language and therefore for corpora of comparable size, the Bangla corpus would have a much larger vocabulary size than English corpus. However, that is not the case here; in fact, the English corpus despite being smaller than the Bangla corpus has a larger vocabulary than the Bangla corpus. Linguistically speaking there are other reasons behind this phenomenon, which however is not elaborated in this paper.
The S I M W O R D 2 V E C B E N G E N G models could not beat the performance of the S I M P A T H _ B A S E D B E N G model with respect to raters R1, R2 and R3 and overall, however they correlate better than the S I M P A T H _ B A S E D B E N G model with respect to R4, R5 and majority score. These observations were quite consistent with our expectations and could be justified as such owing to the robust nature of the cross-lingual distributional model on account of the vast vocabulary size of the English corpora leading to the generation of high quality word vectors.
It was presupposed that when detecting similarity between Bangla words using the distributional models, the monolingual Word2Vec approach would offer near competitive human correlated scores with respect to the cross-lingual approach. This is because the language in which we are trying to discover similarity is Bangla and as such, the Bangla corpora should have been able to provide more insightful and varied contexts and in turn better word embeddings suitable for measuring semantic similarity in Bangla. However, as can be seen from Table 6, this is not the case.
By manually analyzing the distributional similarity scores on the evaluation dataset, we found that S I M W O R D 2 V E C B N C B E N G E N G typically provided higher similarity scores than S I M W O R D 2 V E C B E N G model (107 cases, 66.05%). It was also observed that for 62 (38.27%) cases, both S I M W O R D 2 V E C B E N G E N G models provided higher similarity scores than the S I M W O R D 2 V E C B E N G model, and for 61 (37.65%) cases S I M W O R D 2 V E C G i g a w o r d B E N G E N G similarity scores were higher than the corresponding S I M W O R D 2 V E C B E N G similarity scores. However, higher similarity scores do not necessarily indicate better similarity scores unless it correlates well with human evaluation. For example, considering the word pair গ্রাম (village) and জীবন (life), the distributional semantic similarity scores are as shown below.
  • S I M W O R D 2 V E C B E N G generated a score of 0.12.
  • S I M W O R D 2 V E C B N C B E N G E N G generated a score of 0.84.
  • S I M W O R D 2 V E C G i g a w o r d B E N G E N G generated a score of 0.53.
Here four out of the five annotators gave a score of 1 to this word pair indicating least similarity. Thus, S I M W O R D 2 V E C B E N G provides the best similarity score among the distributional-based metrics for this word pair. Furthermore, it goes without saying that the S I M W O R D 2 V E C B E N G E N G model does not always produce scores highly correlating with human assignments for all the test pairs in our dataset.
However, as can be seen from Table 8, which reports the correlation scores for cases when both S I M W O R D 2 V E C B E N G E N G models provide greater similarity than the S I M W O R D 2 V E C B E N G with respect to the majority-voting scheme, the correlation was stronger for the cross-lingual Word2Vec models. The improvement was much more pronounced for the British National corpus than for the Gigaword corpus.
Almost all the word pairs in our dataset followed the general trend that their semantic similarity scores according to the cross-lingual approach outshined their monolingual counterparts. Nevertheless, examples such as those described previously revealed a few weaknesses with the cross-lingual approaches. Thus, it cannot be said definitively that using English resources would always guarantee better results.
S I M P A T H _ B A S E D B E N G generated poor similarity and correlation scores. This was quite expected owing to the limited coverage of the Bangla WordNet. Several words in the dataset are missing from the WordNet such as অসুখ (illness) and বাতাস (wind); words like প্রথমে (initially) have no hypernym structure and as such, their similarity scores could not be generated using the path-based method. Thus, it can be out rightly stated that the Bangla WordNet needs further improvement in terms of both structure and scope based on the examples provided and the statistics reported.
S I M P A T H _ B A S E D B E N G was used as the baseline method in our work over which we needed ways to improve. This is where the translation came into the picture. S I M P A T H _ B A S E D B E N G E N G involved projecting the Bangla words into their corresponding English counterparts (i.e., translations). This approach showed a marked improvement by as much as 156% increase in correlation score with respect to annotator R1 as can be seen from Table 7. The difference in the results yielded by S I M P A T H _ B A S E D B E N G E N G clearly demonstrates the edge of the English WordNet over the Bangla WordNet in terms of coverage and design.
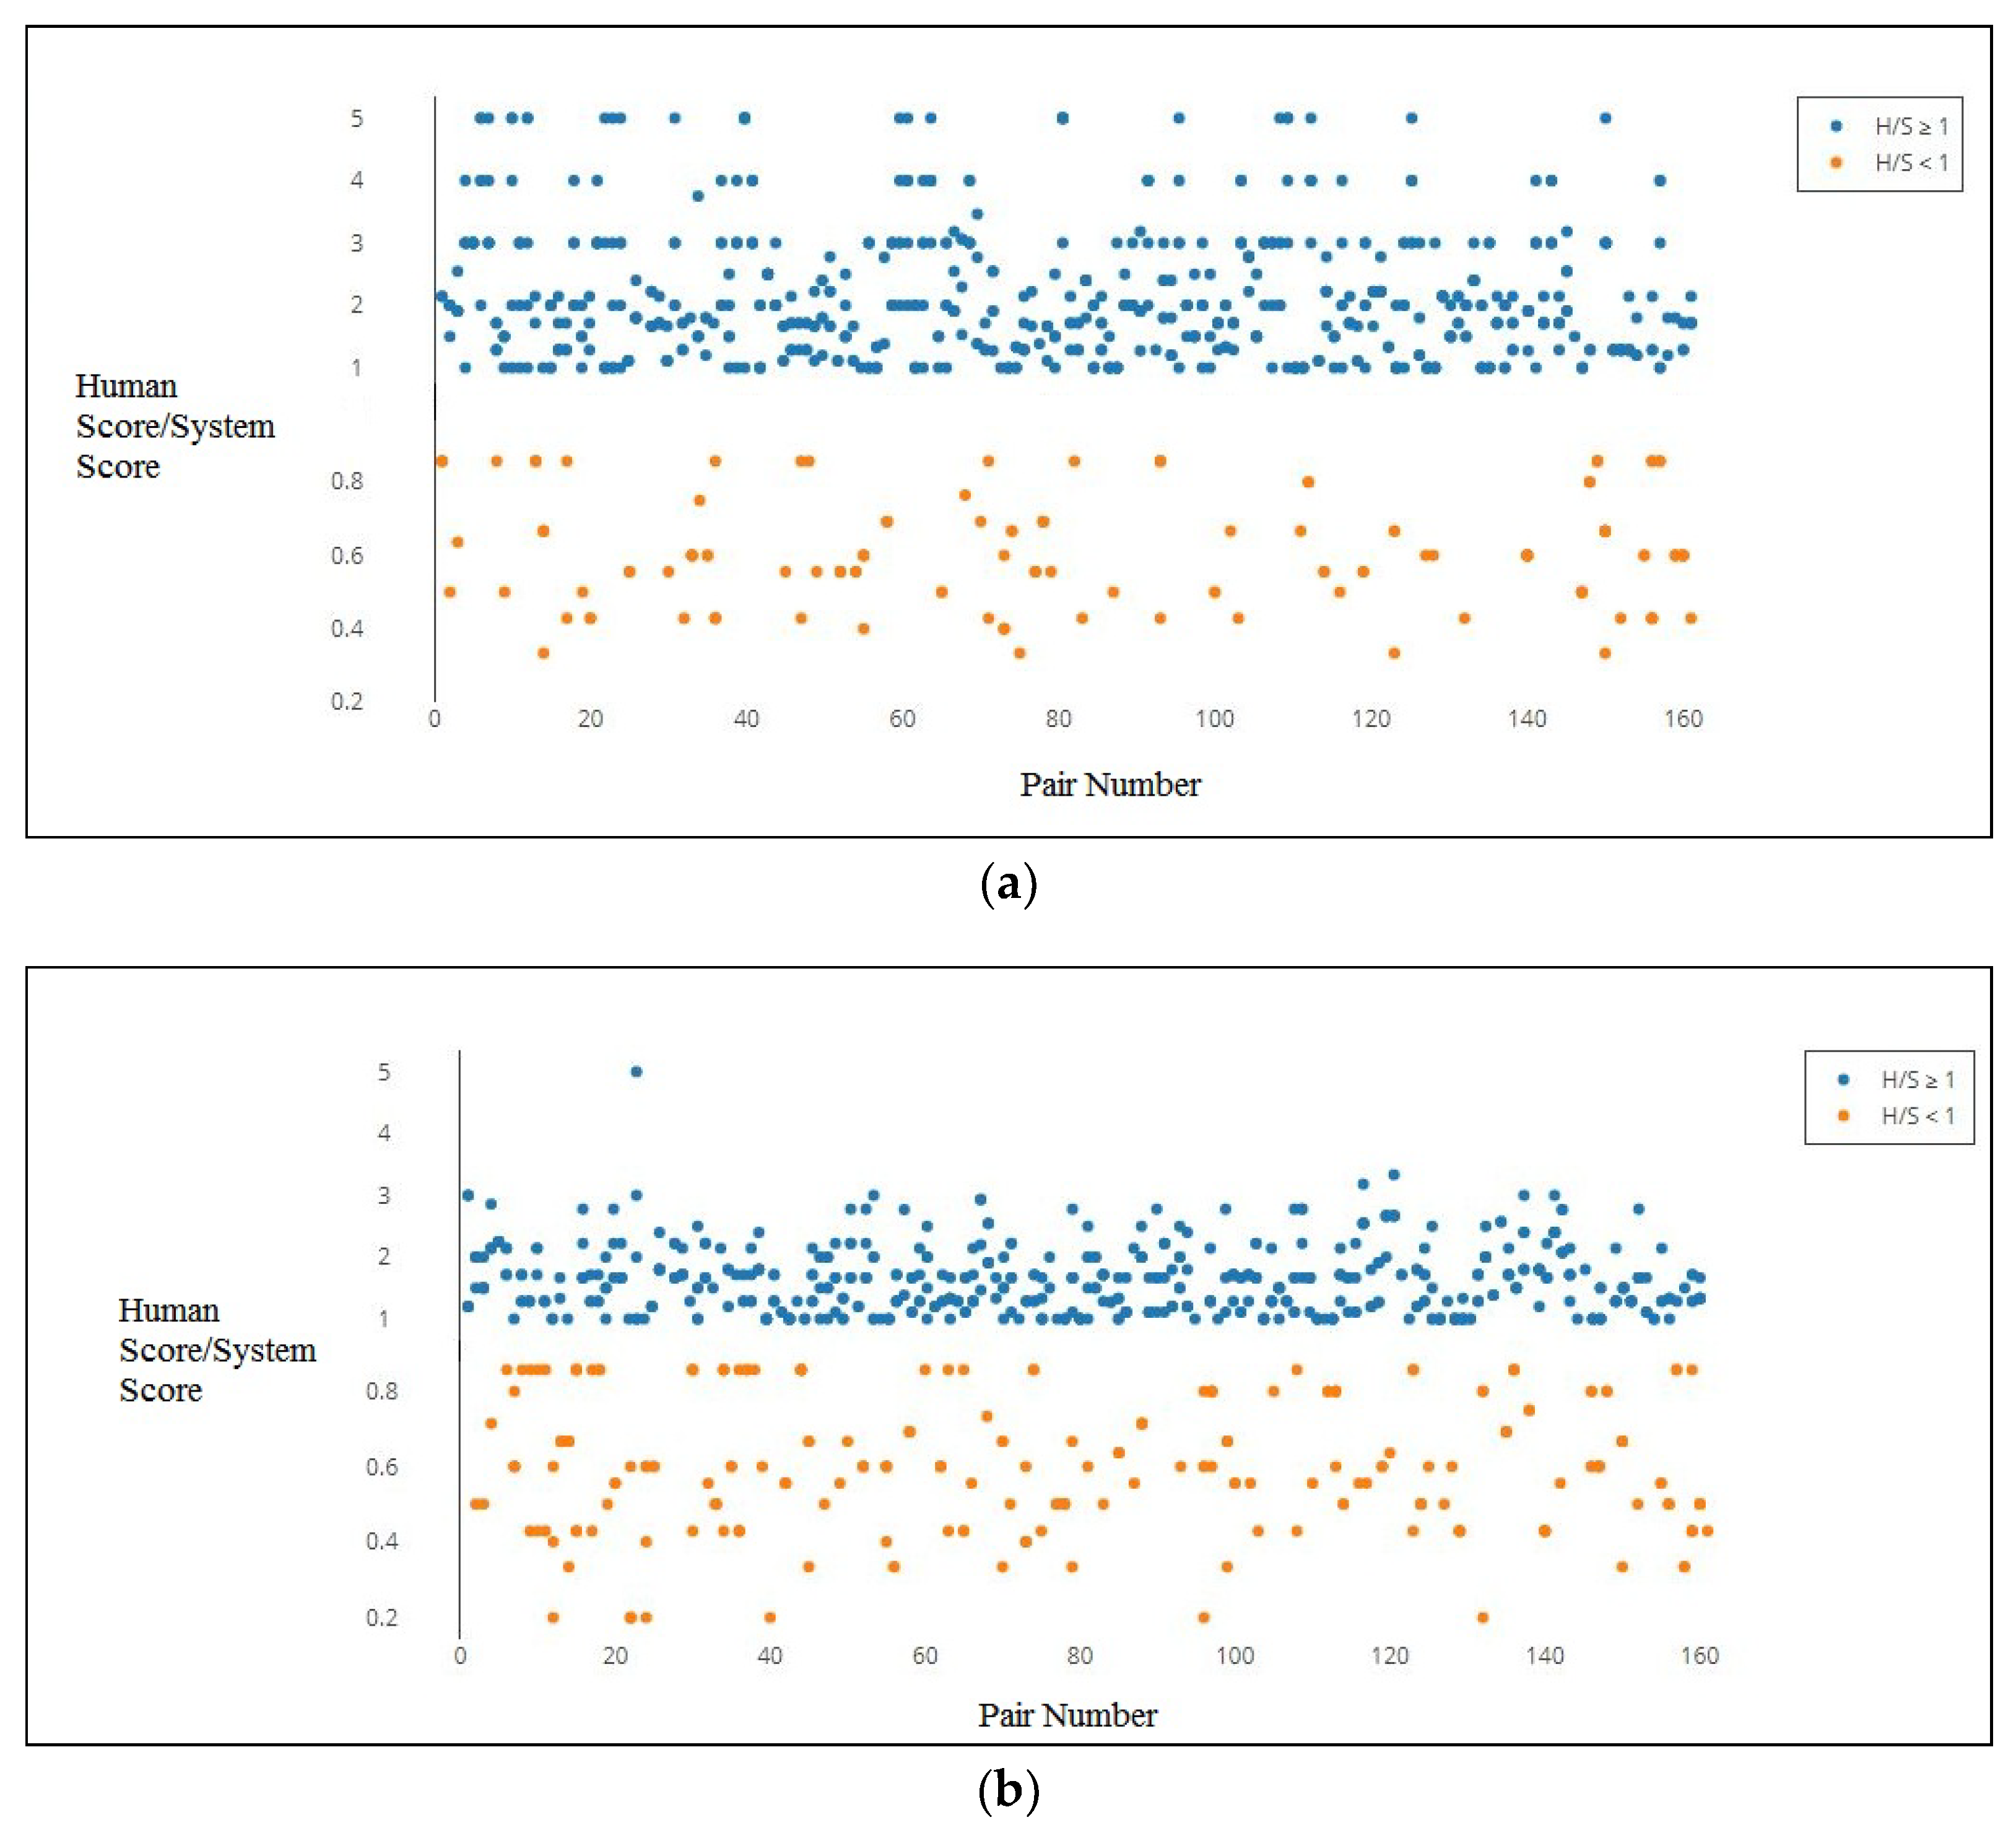
In order to further investigate and visualize how human scores relate to the similarity metric scores, we plotted graphs (for all the metrics) where the x-axis denotes the test pair (i.e., word pair) ids and y-axis represents the R a t i o S H = ( H u m a n S c o r e ) / ( S y s t e m S c o r e ) . These graphs were created first by up scaling the system scores, which originally lie in the [0, 1] range, to the annotator scoring range [1, 5] so as to avoid division by zero errors, and then by plotting the R a t i o S H s. The reason for choosing such a plotting scheme is to examine the proximity of the plotted points to the y = 1 line in the graphs. If a similarity metric perfectly correlates (i.e., r = 1) with a human annotation, then the corresponding points will fall on the y = 1 line. More the number of points that lie on or near this line, stronger will be the correlation between the metric considered and the human annotation scores. Since both the human score and the up-scaled system scores lie in the [1, 5] range, the R a t i o S H lies in the [0.2, 5] range. Since the score pairs (2, 1) and (1, 2) results in R a t i o S H of 2.0 and 0.5 respectively and the both the ratios are equally divergent from y = 1, we make the lines y = 2 and y = 0.5 equally distant from the y = 1 line in the graphs. Similarly (3, 0.333), (4, 0.25), (5, 0.2) line pairs are also shown equally distant from the y = 1 line in the graphs. The graphs for the five metrics are shown in Figure 3.
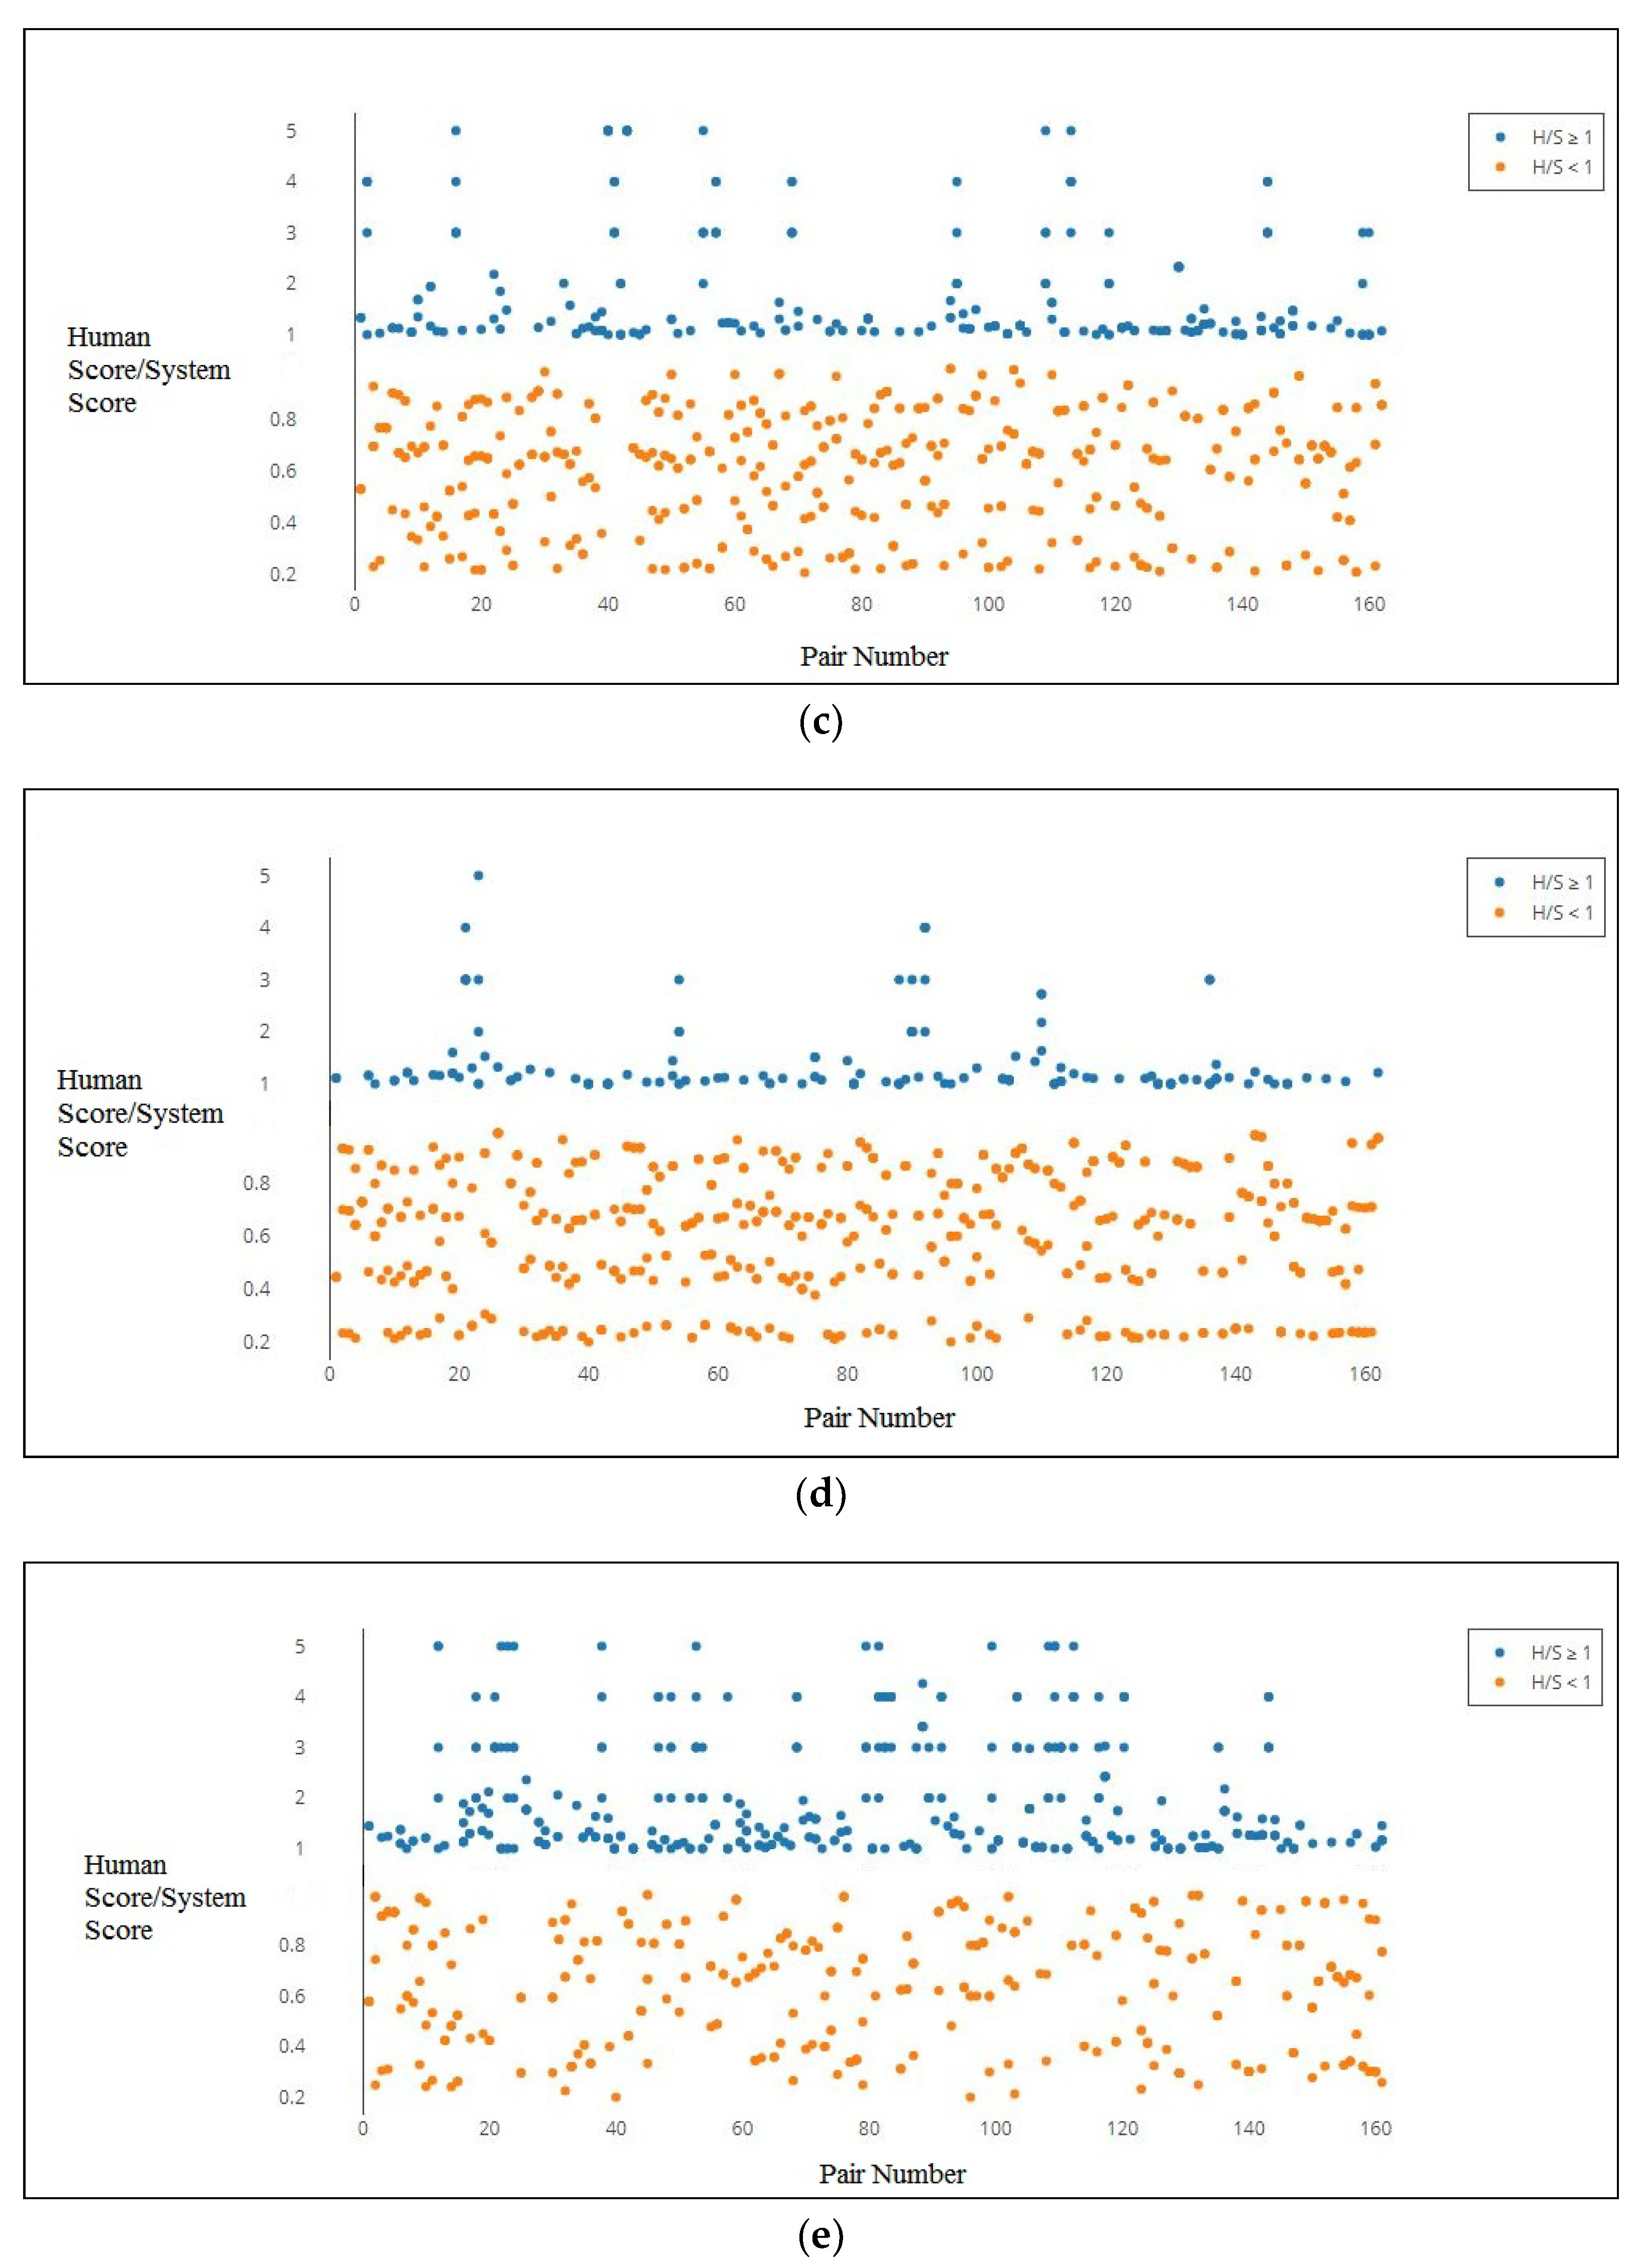
Table 9 shows some statistics of the results presented in Figure 3. Finding the number of points lying in the vicinity of the y = 1 line in these graphs gives a strong indication about the correlation. We observed that both S I M P A T H _ B A S E D B E N G and S I M P A T H _ B A S E D B E N G E N G produced highest number of points (92) aligned on the y = 1 line, followed by S I M W O R D 2 V E C G i g a w o r d B E N G E N G (61), S I M W O R D 2 V E C B N C B E N G E N G (43) and S I M W O R D 2 V E C B E N G (19).
From the obtained scatter plots in Figure 3 and the statistics in Table 9, a phenomenon becomes visible. The distributional models very frequently produce higher scores resulting in R a t i o S H less than one, forming several dense regions prominently visible below the y = 1 line in the plots for S I M W O R D 2 V E C B E N G , S I M W O R D 2 V E C B N C B E N G E N G and S I M W O R D 2 V E C G i g a w o r d B E N G E N G models. On the other hand, the path-based metrics typically provided lower similarity scores yielding R a t i o S H greater than one which is visible from the majority of the plotted points above the y = 1 line in Figure 3a,b. Most of the points in the S I M P A T H _ B A S E D B E N G E N G graph (cf. Figure 3b) being close to the y = 1 line is reasoned out to be providing the most accurate similarity scores, a fact which is further corroborated by the correlation results (cf. Table 6). Furthermore, a sharp drop in the spread of the data points between the graphs of S I M P A T H _ B A S E D B E N G (cf. Figure 3a) and S I M P A T H _ B A S E D B E N G E N G can also be observed indicating that S I M P A T H _ B A S E D B E N G E N G produces more correlated similarity scores than S I M P A T H _ B A S E D B E N G which shows divergent scores all across its plot. This fact goes on to show what a marked improvement translation brings to semantic similarity.
Among the graphs for S I M W O R D 2 V E C B E N G and S I M W O R D 2 V E C B N C B E N G E N G , the graph of the latter showed less dispersion from the y = 1 line meaning that the scores produced from the method were better correlated with the human judgments; a fact which can also be verified from Table 6. Figure 3e shows the graph for the S I M W O R D 2 V E C G i g a w o r d B E N G E N G metric. When it is examined in light of the other two distributional methods, it was found that it produced the best such plot for that class of methods. The points were relatively more divergent from the y = 1 line, although giving a higher number of points lying on the y = 1 line (61) as compared to the other two distributional methods (19 and 43).
Our initial intuition drove us to believe that the Word2Vec model would produce the best results. However, from the correlation scores obtained, we were proven otherwise. Overall, the S I M P A T H _ B A S E D B E N G E N G model provides the best correlation scores with respect to all individual raters, majority score and all rating scores together (overall), which are much higher than the correlation scores yielded by the other similarity metrics. Finally, it could also be pointed out that in comparison to the Word2Vec models, the path-based metrics performed far better with respect to the overall correlation scores (cf. Table 6), an explanation for which is proffered in Section 6.3. Clearly, the path-based model has visible advantages in spite of being compared with one of the more robust and state-of-the-art models for semantic similarity, i.e., Word2Vec.

6.3. Comparative Analysis of the Various Methods

When discovering semantic similarity in monolingual domain, the path-based model clearly performs better than the Word2Vec model as can be seen from the correlation scores. This is because the Word2Vec algorithm requires a well-designed corpus with large vocabulary size and contexts, which properly reflect the correct senses of a word in order to build a comprehensive model for detecting similarity. However, obtaining such a well-designed large corpus in Bangla is a difficult task. The correlation scores obtained with S I M W O R D 2 V E C B E N G is a clear indication of the limitation of the corpus used. Even though the Bangla WordNet is lacking in terms of coverage, the higher correlation scores provided by S I M P A T H _ B A S E D B E N G in comparison to S I M W O R D 2 V E C B E N G is fairly justifiable.
It was clear that the cross-lingual approach via translation helped improve the similarity scores for both the path-based and Word2Vec models. However, it was noticed that the cross-lingual approach works better for the path-based metric than the distributional ones. This could perhaps be attributed to the fact that when obtaining cross-lingual senses (through translations) in English for a given Bangla word, we were retrieving the most appropriate or the nearest one in sense from the bucket of all possible conceptual equivalents of the word; whereas in the Word2Vec approach, we are dealing with only a subset of the translations limited by the corpus, where the possibility of having multiple translational equivalents is restricted due to imposition of contextual constraints. This explanation would also be in line with the way a human annotator assigns scores to the word pairs. They would always realize what possible senses the words within a word pair encompass and which sense pair has the strongest conceptual proximity. It is evident that when obtaining the entire array of translations (senses) of a word, some or all of them maybe absent from the WordNet or a corpus (even the word itself maybe absent in both of them). The Word2Vec approach depends only on a raw corpus to generate a model for calculating similarity. The problem with corpora is that they may not include the word itself and even if they do, there may not be the contexts for encapsulating all the possible senses that the word defines. The advantage of a corpus, on the other hand, is that it can describe contexts for a word, which represent new senses that are not present in the WordNet. However, when assigning similarity score to a word pair, a rater (or assigner) considers all possible senses of the words but rarely takes into account the newer senses which may have evolved with time and been incorporated into the present corpus.
Overall, the cross-lingual path-based metric excels due to excellent coverage of concepts in the English WordNet. Finding a missing word in it is a seldom occurrence as could be seen from the number of cases (2, 1.23%) producing a zero score with S I M P A T H _ B A S E D B E N G E N G as opposed to the number of cases producing 0 for S I M W O R D 2 V E C B N C B E N G E N G (8, 4.94%) and S I M W O R D 2 V E C G i g a w o r d B E N G E N G (31, 19.14%).

7. Conclusions and Future Work

Linguistic resources available for poorly resourced languages like Bangla are few in number and are underdeveloped when compared with richly resourced languages like English. This is one of the main reasons as to why research in under-resourced languages relies either on unsupervised or cross-lingual techniques. Our work clearly highlights the power of the Word2Vec model and its ability to overcome the limitations of thesaurus-based approaches, the biggest drawback of which is how to calculate similarity in the absence of resources like WordNet. The Word2Vec is an extremely efficient model and is capable of analyzing large volumes of text in minutes and generating similarity scores for word pairs present in corpus. However, the model does fail to tackle problems such as detecting words with multiple meanings and out of vocabulary words. These issues deserve further exploration.
Semantic similarity plays a very crucial role in many NLP applications. Even without such applicational relevance, semantic similarity, in itself, is a fundamental linguistic query and crucial conceptual hypothesis. Since it is a subjective issue, it is destined to receive different interpretations from different evaluation approaches. Accurate understanding of semantic similarity will mean getting a closer look into the enigmatic world of human cognition to speculate how human beings associate words (or word pairs, for that matter) based on their sense relations, semantic closeness, and conceptual proximity. The present study has certain theoretical relevance on the ground that it helps us to identify the probability of semantic association of a word following a given word with or without reference to any given context. Such a knowledge base is indispensable for many tasks of language engineering, such as machine translation, machine learning, information retrieval, lexical clustering, text categorization, word sense induction, language teaching, semantic net and many more.
The objective of our work was to determine semantic similarity between Bangla word pairs. We have proposed here that translation based approaches, which take help of existing algorithms and can show improved results. We have also identified that the strategies adopted for some advanced languages like English cannot be used blindly on less resourced languages like Bangla, since successful operation of those strategies require large amount of processed and structured linguistic resources in the forms of corpora and WordNets, which are not yet made ready in these poorly resourced languages. However, the most striking finding of our study is that language corpora, be it for the richly or poorly resourced languages, are not a useful hunting ground for executing semantic similarity measurement techniques. Owing to certain contextual constraints, corpora usually fail to reflect on the wide range of possible semantic similarity of words, which a human being or a WordNet can easily do.
In future, we would also like to compare semantic similarity of Wu and Palmer [14] and Slimani et al. [15] with the path-based similarity employed in the paper and distributional similarity.
Semantic similarity is a crucial NLP task for both well-resourced and under-resourced languages like English, Hindi, Bangla etc. The next step in this direction should be an effort that can try to enrich WordNets as well as create better corpora so that the semantic similarity problem can be addressed for any word pair.

Author Contributions

Conceptualization, R.P. and S.S.; Methodology, R.P. and S.S.; Software, R.P. and S.S.; Validation, S.S., R.P. and S.K.N.; Formal Analysis, R.P. and S.K.N.; Investigation, S.S. and S.K.N.; Resources, S.K.N and N.S.D.; Data Curation, N.S.D. and M.M.S.; Writing—Original Draft Preparation, S.S. and R.P.; Writing—Review and Editing, S.K.N.; Visualization, R.P. and S.S.; Supervision, S.K.N. and M.M.S.; Project Administration, S.K.N. and M.M.S.; Funding Acquisition, S.K.N.

Funding

This research was partially funded by Digital India Corporation (formerly Media Lab Asia), MeitY, Government of India, under the Visvesvaraya PhD Scheme for Electronics & IT.

Acknowledgments

Sudip Kumar Naskar is partially supported by Digital India Corporation (formerly Media Lab Asia), MeitY, Government of India, under the Young Faculty Research Fellowship of the Visvesvaraya PhD Scheme for Electronics & IT.

Conflicts of Interest

The authors declare no conflicts of interest. The funding agency had no role in the design of the study; in the collection, analyses, or interpretation of data; in the writing of the manuscript, or in the decision to publish the results.

References

  1. Budan, I.; Graeme, H. Evaluating wordnet-based measures of semantic distance. Comutational Linguist. 2006, 32, 13–47. [Google Scholar]
  2. Sim, K.M.; Wong, P.T. Toward agency and ontology for web-based information retrieval. IEEE Trans. Syst. Man Cybern. C Appl. Rev. 2004, 34, 257–269. [Google Scholar] [CrossRef]
  3. Nguyen, H.A.; Al-Mubaid, H. New ontology-based semantic similarity measure for the biomedical domain. In Proceedings of the 2006 IEEE International Conference on Granular Computing, Atlanta, GA, USA, 10–12 May 2006. [Google Scholar]
  4. Lord, P.W.; Stevens, R.D.; Brass, A.; Goble, C.A. Investigating Semantic Similarity Measures across the Gene Ontology: The Relationship between Sequence and Annotation. Bioinformatics 2003, 19, 1275–1283. [Google Scholar] [CrossRef] [PubMed]
  5. Patwardhan, S. Incorporating Dictionary and Corpus Information into a Context Vector Measure of Semantic Relatedness. Master’s Thesis, University of Minnesota, Minneapolis, MN, USA, 2003. [Google Scholar]
  6. Gracia, J.; Mena, E. Web-Based Measure of Semantic Relatedness. In Lecture Notes in Computer Science, Proceedings of the International Conference on Web Information Systems Engineering, Auckland, New Zealand, 1–4 September 2008; Springer: Berlin/Heidelberg, Germany, 2008; pp. 136–150. [Google Scholar]
  7. Dash, N.S.; Bhattacharyya, P.; Pawar, J.D. The WordNet in Indian Languages; Springer: Singapore, 2017. [Google Scholar]
  8. Speer, R.; Chin, J.; Havasi, C. Conceptnet 5.5: An open multilingual graph of general knowledge. In Proceedings of the Thirty-First AAAI Conference on Artificial Intelligence (AAAI-17), San Francisco, CA, USA, 4–9 February 2017. [Google Scholar]
  9. Poli, R.; Healy, M.; Kameas, A. Theory and Applications of Ontology: Computer Applications; Springer: New York, NY, USA, 2010. [Google Scholar]
  10. Liu, H.; Singh, P. Conceptnet—A practical commonsense reasoning tool-kit. BT Technol. J. 2004, 22, 211–226. [Google Scholar] [CrossRef]
  11. Rada, R.; Mili, H.; Bicknell, E.; Blettner, M. Development and Application of a Metric on Semantic Nets. IEEE Trans. Syst. Man Cybern. 1989, 19, 17–30. [Google Scholar] [CrossRef]
  12. Richardson, R.; Smeaton, A.; Murphy, J. Using WordNet as a Knowledge Base for Measuring Semantic Similarity between Words; Technical Report Working Paper CA-1294; School of Computer Applications, Dublin City University: Dublin, Ireland, 1994. [Google Scholar]
  13. Hirst, G.; St-Onge, D. Lexical Chains as Representations of Context for the Detection and Correction of Malapropisms; The MIT Press: Cambridge, MA, USA, 1995; pp. 305–332. [Google Scholar]
  14. Wu, Z.; Palmer, M. Verb Semantics and Lexical Selection. In Proceedings of the 32th Annual Meeting on Association for Compu-Tational Linguistics, Las Cruces, NM, USA, 27–30 June 1994; pp. 133–138. [Google Scholar]
  15. Slimani, T.; Yaghlane, B.B.; Mellouli, K. A New Similarity Measure Based on Edge Counting, Proceedings of the World Academy of Science, Engineering and Technology. 2006. Available online: http://citeseerx.ist.psu.edu/viewdoc/download?doi=10.1.1.307.1229&rep=rep1&type=pdf (accessed on 17 February 2019).
  16. Li, Y.; Bandar, Z.A.; McLean, D. An Approach for Measuring Semantic Similarity between Words Using Multiple Information Sources. IEEE Trans. Knowl. Data Eng. 2003, 15, 871–882. [Google Scholar]
  17. Leacock, C. Filling in a Sparse Training Space for Word Sense Identification. Ph.D. Thesis, Macquarie University, Sydney, Australia, 1994. [Google Scholar]
  18. Resnik, P. Semantic Similarity in Taxonomy: An Information-Based Measure and Its Application to Problems of Ambiguity in Natural Language. J. Artif. Intell. Res. 1999, 11, 95–130. [Google Scholar] [CrossRef]
  19. Lin, D. Principle-based parsing without overgeneration. In Proceedings of the 31st Annual Meeting on Association for Computational Linguistics (ACL ’93), Columbus, OH, USA, 22–26 June 1993; pp. 112–120. [Google Scholar]
  20. Jiang, J.J.; Conrath, D.W. Semantic similarity based on corpus statistics and lexical taxonomy. In Proceedings of the International Conference on Research in Computational Linguistics, Taipei, Taiwan, 20 September 1997. [Google Scholar]
  21. Mikolov, T.; Yih, W.T.; Zweig, G. Linguistic Regularities in Continuous Space Word Representations. In Proceedings of the NAACL-HLT 2013, Atlanta, GA, USA, 9–14 June 2013; pp. 746–751. [Google Scholar]
  22. Mikolov, T.; Chen, K.; Corrado, G.; Dean, J. Distributed representations of words and phrases and their compositionality. In Proceedings of the 26th International Conference on Neural Information Processing Systems, Lake Tahoe, NV, USA, 5–10 December 2013; pp. 3111–3119. [Google Scholar]
  23. Mikolov, T.; Chen, K.; Corrado, G.; Dean, J. Efficient estimation of word representations in vector space. In Proceedings of the Workshop at International Conference on Learning Representations (ICLR), Scottsdale, AZ, USA, 2–4 May 2013. [Google Scholar]
  24. Bengio, Y.; Schwenk, H.; Senécal, J.S.; Morin, F.; Gauvain, J.-L. Neural probabilistic language models. J. Mach. Learn. Res. 2003, 3, 1137–1155. [Google Scholar]
  25. Collobert, R.; Weston, J. A unified architecture for natural language processing: Deep neural networks with multi-task learning. In Proceedings of the 25th International Conference on Machine Learning (ICML ’08), Helsinki, Finland, 5–9 July 2008; pp. 160–167. [Google Scholar]
  26. Nikolay, A.; Panchenko, A.; Lukanin, A.; Lesota, O.; Romanov, P. Evaluating Three Corpus-Based Semantic Similarity Systems for Russian. In Computational Linguistics and Intellectual Technologies, Dialog 28; HSE Publishing House: Moscow, Russian, 2015; pp. 106–118. [Google Scholar]
  27. Bojanowski, P.; Grave, E.; Joulin, A.; Mikolov, T. Enriching word vectors with subword information. In Transactions of the Association for Computational Linguistics; MIT Press: Cambridge, MA, USA, 2017; Volume 5, pp. 135–146. [Google Scholar]
  28. Wieting, J.; Bansal, M.; Gimpel, K.; Livescu, K. CHARAGRAM: Embedding words and sentences via character n-grams. In Proceedings of the 2016 Conference on Empirical Methods in Natural Language Processing, Austin, TX, USA, 1–5 November 2016. [Google Scholar]
  29. Neelakantan, A.; Shankar, J.; Passos, A.; McCallum, A. Efficient nonparametric estimation of multiple embeddings per word in vector space. In Proceedings of the 2014 Conference on Empirical Methods in Natural Language Processing (EMNLP), Doha, Qatar, 25–29 October 2014; pp. 1059–1069. [Google Scholar]
  30. Faruqui, M.; Dyer, C. Improving vector space word representations using multilingual correlation. In Proceedings of the 14th Conference of the European Chapter of the Association for Computational Linguistics, Gothenburg, Sweden, 26–30 April 2014; pp. 462–471. [Google Scholar]
  31. Conneau, A.; Lample, G.; Ranzato, M.A.; Denoyer, L.; Jégou, H. Word translation without parallel data. In Proceedings of the International Conference on Learning Representations (ICLR), Vancouver, BC, Canada, 30 April–3 May 2018. [Google Scholar]
  32. Tversky, A. Features of similarity. Psychol. Rev. 1977, 84, 327–352. [Google Scholar] [CrossRef]
  33. Petrakis, E.G.; Varelas, G.; Hliaoutakis, A.; Raftopoulou, P. X-Similarity: Computing Semantic Similarity between Concepts from Different Ontologies. J. Digit. Inf. Manag. 2006, 4, 233–237. [Google Scholar]
  34. Sinha, M.; Jana, A.; Dasgupta, T.; Basu, A. New Semantic Lexicon and Similarity Measure in Bangla. In Proceedings of the 3rd Workshop on Cognitive Aspects of the Lexicon (CogALex-III), Mumbai, India, 15 December 2012; pp. 171–182. [Google Scholar]
  35. Sinha, M.; Dasgupta, T.; Jana, A.; Anupam, B. Design and Development of a Bangla Semantic Lexicon and Semantic Similarity Measure. Int. J. Comput. Appl. 2014, 95, 8–16. [Google Scholar] [CrossRef]
  36. Pennington, J.; Socher, R.; Manning, C. GloVe: Global Vectors for Word Representation. In Proceedings of the 2014 Conference on Empirical Methods in Natural Language Processing (EMNLP), Doha, Qatar, 25–29 October 2014; pp. 1532–1543. [Google Scholar]
  37. Miller, G. WordNet: An Electronic Lexical Database; MIT Press: Cambridge, MA, USA, 1998. [Google Scholar]
  38. Dash, N.S. Corpus Linguistics: A General Introduction. In Proceedings of the National Workshop on Corpus Normalization of the Linguistic Data Consortium for the Indian Languages (LDC-IL), Mysore, India, 25 August 2010. [Google Scholar]
  39. Dash, N.S. Some Corpus Access Tools for Bangla Corpus. Indian J. Appl. Linguist. 2016, 42, 7–31. [Google Scholar]
  40. Parker, R.; Graff, D.; Chen, J.K.K.; Maeda, K. English Gigaword Fifth Edition; LDC2011T07, DVD; Linguistic Data Consortium: Philadelphia, PA, USA, 2011. [Google Scholar]
  41. Bird, S.; Klein, E.; Loper, E. Natural Language Processing with Python; O’Reilly Media Inc.: Sebastopol, CA, USA, 2009. [Google Scholar]
  42. Dash, N.S. A Descriptive Study of Bangla Words; Cambridge University Press: Cambridge, UK, 2015. [Google Scholar]
  43. Landis, J.R.; Koch, G.G. The Measurement of Observer Agreement for Categorical Data. Biometrics 1977, 33, 159–174. [Google Scholar] [CrossRef]
Figure 1. Schematic diagram for cross-lingual approaches.
Informatics 06 00019 g001
Figure 2. A snapshot of the hypernym–hyponym relations in the Bangla WordNet.
Informatics 06 00019 g002
Figure 3. Human Score (H)/System Score (S) vs. Pair Number for (a) S I M P A T H _ B A S E D B E N G , (b) S I M P A T H _ B A S E D B E N G E N G , (c) S I M W O R D 2 V E C B E N G , (d) S I M W O R D 2 V E C B N C B E N G E N G (e) S I M W O R D 2 V E C G i g a w o r d B E N G E N G .
Informatics 06 00019 g003aInformatics 06 00019 g003b
Table 1. Semantic Similarity Methods( P path-based, D Distributional, M Monolingual, C Cross-lingual).
Semantic Similarity Approach
Mono/Cross-LingualPath-BasedDistributional
Monolingual S S P _ M S S D _ M
Cross-Lingual S S P _ C S S D _ C
Table 2. WordNet Statistics.
WordNetPos Wise Synset Statistics
NounVerbAdverbAdjectiveTotal
Bengali27,2812804445581536,345
English 3.082,11513,767362118,156117,659
Table 3. Statistics of the Corpora used.
CorpusNumber of SentenceNumber of WordsVocabulary Size
British National Corpus (BNC)—Baby Edition333,0454,000,000203,367
Technology Development for Indian Languages (TDIL) Bangla Corpus
635,0005,000,000193,879
Table 4. Fleiss’ Kappa (F κ ) and Krippendorff’s Alpha for Inter-Rater Agreement.
Fleiss’ Kappa0.17
Krippendorff’s Alpha0.18
Table 5. Pairwise Inter-Rater percentage and Cohen’s Kappa agreement.
Rater
RaterR1R2R3R4R5
R121.6116.0519.7519.75
R20.0425.9357.4134.57
R30.020.0543.2164.81
R40.020.440.2654.32
R50.030.150.530.40
Table 6. Pearson correlation values for all approaches.
Similarity MetricHuman Rating
R1R2R3R4R5MajorityOverall
S I M P A T H _ B A S E D B E N G 0.200.190.200.200.160.190.19
S I M P A T H _ B A S E D B E N G E N G 0.220.380.250.410.410.400.31
S I M W O R D 2 V E C B E N G 0.080.090.160.150.160.200.12
S I M W O R D 2 V E C B N C B E N G E N G 0.150.150.190.180.280.210.16
S I M W O R D 2 V E C G i g a w o r d B E N G E N G 0.180.170.190.240.230.260.19
Table 7. Correlation scores for cases where both S I M P A T H _ B A S E D B E N G and S I M P A T H _ B A S E D B E N G E N G produced non-zero scores.
Similarity MetricHuman Rating
R1R2R3R4R5MajorityOverall
S I M P A T H _ B A S E D B E N G 0.140.270.160.280.200.240.20
S I M P A T H _ B A S E D B E N G E N G 0.210.350.340.390.350.390.31
Table 8. Correlation scores for cases when both the S I M W O R D 2 V E C B E N G E N G models provide higher similarity scores than the S I M W O R D 2 V E C B E N G .
Similarity MetricMajority Score Correlation
S I M W O R D 2 V E C B E N G 0.29
S I M W O R D 2 V E C B N C B E N G E N G 0.53
S I M W O R D 2 V E C G i g a w o r d B E N G E N G 0.45
Table 9. Statistics of the points plotted in Figure 3.
Similarity Metric Ratio S H
1<1>10.5 ≤ R ≤ 2
S I M P A T H _ B A S E D B E N G 92134579522
S I M P A T H _ B A S E D B E N G E N G 92237476640
S I M W O R D 2 V E C B E N G 19558228573
S I M W O R D 2 V E C B N C B E N G E N G 43648114549
S I M W O R D 2 V E C G i g a w o r d B E N G E N G 61404340562

