Personas Design for Conversational Systems in Education

Department of Computer Science, Brunel University London, London UB8 3PH, UK
*
Author to whom correspondence should be addressed.
Informatics 2019, 6(4), 46; https://0-doi-org.brum.beds.ac.uk/10.3390/informatics6040046
Submission received: 5 May 2019
/
Revised: 3 July 2019
/
Accepted: 2 October 2019
/
Published: 21 October 2019
(This article belongs to the Special Issue Selected Papers from 24th UK Academy for Information Systems International Conference)
Abstract
:This research aims to explore how to enhance student engagement in higher education institutions (HEIs) while using a novel conversational system (chatbots). The principal research methodology for this study is design science research (DSR), which is executed in three iterations: personas elicitation, a survey and development of student engagement factor models (SEFMs), and chatbot interaction analysis. This paper focuses on the first iteration, personas elicitation, which proposes a data-driven persona development method (DDPDM) that utilises machine learning, specifically the K-means clustering technique. Data analysis is conducted using two datasets. Three methods are used to find the K-values: the elbow, gap statistic, and silhouette methods. Subsequently, the silhouette coefficient is used to find the optimal value of K. Eight personas are produced from the two data analyses. The pragmatic findings from this study make two contributions to the current literature. Firstly, the proposed DDPDM uses machine learning, specifically K-means clustering, to build data-driven personas. Secondly, the persona template is designed for university students, which supports the construction of data-driven personas. Future work will cover the second and third iterations. It will cover building SEFMs, building tailored interaction models for these personas and then evaluating them using chatbot technology.
1. Introduction
Student engagement refers to the extent to which students are interested or involved in their learning and how they are linked to other students, their classes, and their institutions [1]. Three dimensions of student engagement have been identified [2]: (1) behavioural engagement, represented by behavioural norms, such as attendance and involvement; (2) emotional engagement, represented by emotions, such as enjoyment, interest, and a sense of belonging; and, (3) cognitive engagement, represented by investing more time in learning beyond that required [2]. This study focuses on behavioural and cognitive engagement.
Student engagement has received significant attention in the literature since the 1990s [3], particularly in terms of its value for learning and achievement [4]. Trowler believes that “the value of engagement is no longer questioned” [3] (p. 4). Student engagement is considered to be a predictor of student performance [5,6] and one of the main factors behind students’ boredom, alienation, low performance, and high dropout rates [5]. The literature shows that higher education institutions (HEIs) are facing a critical problem with low-level student engagement. Several teaching methods, tools, and strategies have been developed to solve this problem. For example, with the significant increase in the number of internet users and mobile phone owners, there has been great interest in employing these devices in class and outside of class to improve student participation [7,8] and, currently, chatbots are being used in education [9].
According to [3], a large proportion of the student engagement literature reports studies in the United States (US) and Australia, with most of the research focusing on the implementation of the National Survey of Student Engagement (NSSE). [10] studied the linkage between student engagement and student learning. The study sample consisted of 1058 students from 14 universities and colleges and used the NSSE survey instrument to collect the data. The instrument consists of 70 items that evaluate the effort and time that students spend on educational activities. The results of the study show that student engagement is only one factor that affects student performance.
The UK represents a small proportion of existing literature [3] on student engagement. For example, [3] concentrated on specific aspects of learning, including tools (learning management systems), techniques (particular feedback), or approaches to specific situations (inductions for distance learners). Moreover, [3] surveyed students to measure their perceptions of these specific aspects. In UK studies on student engagement, the sample size is usually small, and the survey focuses on the experiences of a single class of a single module at a particular level.
A chatbot is a conversational agent and a computer program that can conduct a conversation with the user while using natural language speech [11]. ELIZA [12] is considered to be one of the earliest created chatbots [13]; it was developed in the 1960s by Joseph Weizenbaum to simulate a psychotherapist in clinical treatment [9,12]. The idea was straightforward, and it used a keyword matching approach [9]. ELIZA accepts input text, analyses it, and then produces responses by applying the reassembly rules that come with input decomposition [13]. ELIZA’s responses show concern for users. However, it has no memory to retain the conversation, and it is unable to become involved in any targeted types of negotiation or collaboration. ELIZA’s syntactic language processing has been dramatically developed. Thus, a large number of chatbot language processes have been created.
Chatbots are also referred to as ‘artificial conversational entities’ (ACEs) or ‘conversational systems’. Currently, well-known examples of chatbots are Amazon Alexa, Siri on iPhone, Cortana, and Google Assistant [14]. Although chatbots seem to work intelligently by interpreting users’ input before providing answers, some chatbots merely scan the keywords that are inputted and respond with the most suitable matching keyword replies from their databases [15]. Although chatbots are a fundamental and straightforward application of artificial intelligence (AI), they are critical due to their various applications and potential uses.
Chatbots can be used as a powerful tool for teaching and educating students. They can work as a language tutor, as in the example known as Sofia. Additionally, they can assist with the teaching of mathematics and help users to solve algebra problems, as with the Pari and Mathematica chatbots. Moreover, they help medical students by simulating patients and providing responses during interviews with medical students; an example of this type of chatbot is the Virtual Patient bot (VPbot) [16].
Using chatbots in education can have many benefits for students and teachers, as presented by [17], including: (1) they make learning more enjoyable, as students feel more relaxed and comfortable and enjoy chatting with chatbots more than their teachers or peers in traditional teaching [9,17]; (2) they support continuous learning, as chatbots enable students to repeat and view the same learning materials many times without feeling tired or bored, in contrast to teachers [9,17]; (3) they enhance student motivation by offering a new way of learning that attracts students [9,17]; and, (4) they enhance students’ listening and reading abilities [9,17].
Chatbots can be used in health intervention approaches. The study by [18] aimed to assess whether chatbots are suitable for use in mental health interventions. The study was conducted in Australia, and the participants were adults aged between 18 and 25 years old, specifically those with high alcohol consumption. A chatbot was created to carry out an essential assessment of the participants’ alcohol drinking habits and to specify the health risk level. Moreover, it educated users regarding alcohol use. Seventeen participants evaluated the usability of the chatbot and their user satisfaction; the overall results show that the users had strong positive perceptions of the intervention. The main limitations of the study were the small sample size and the lack of a control group [18].
Chatbots can be a source of entertainment, alleviating boredom [16]. Mistuku and Jessie Humani are chatbots that fulfil the human need for social interaction and entertainment [19]. Chatbots can be used to kill time when people are bored, as reported by [19]. Some chatbots are used for small talk and socialising, such as A.L.I.C.E. and Cleverbot [19]. Chatbots can be great tools for retrieving information [17]. They can provide answers to questions, like “when?”, “what?”, “where?”, and “how?”, in a conversational setting. Therefore, many businesses use them for question-answer services [16]. Chatbots can also be used to provide user assistance via various interfaces, such as Siri on iPhones [16].
Moreover, chatbots can provide customer services. Many websites contain frequently asked question (FAQ) pages, which contain answers to common issues that concern users. However, when the FAQ page contains many addressed issues, it becomes impractical for users to read through the many distinct entries to find the one that they are searching for. Moreover, the user might not feel confident regarding the terms used to address the issues on the page. Therefore, in website design, chatbots can be used to address these problems by creating a conversational interface for the FAQ page [20]. Further studies are needed to develop chatbots that allow users to give feedback on how their queries have been addressed by such chatbots [20].
Personas are a design tool for creating a conversational system. However, in this study, the conversational system will interact differently based on the students’ persona type, which means that the conversational system is based on personas and it is referred to as a persona-based conversational system. Personas can be created from existing data or no data, or data can be collected to create the personas [21]. A study by [21] created personas for a training organisation, so the data attributes were related to professional certification and training experiences. Data-driven personas have several advantages over traditional methods [21]. (1) Personas can be created based on real customer data, so the generated personas are acceptable to the client. (2) The attributes of the collected data can be carefully selected to support the purpose of creating personas. (3) The collected dataset can have a significant number of records. Data-driven personas can be created from qualitative data, quantitative data, or both [21,22,23]. Generally, personas are qualitative in nature [23]; however, this study focuses on quantitative data-driven personas. According to [24], qualitative data-driven personas that are built based on a few interviews do not validly represent the real groups, and the generated personas are not considered to be appropriate decision-making instruments. On the other hand, if personas are created based on quantitative data and statistical analysis, they represent valid personas [23], as in our study.
After analysing the literature, a literature gap has been identified: no previous study has investigated the use of context-based and personas-based conversational systems in HEIs to enhance student engagement. Therefore, this study aims to enhance undergraduate student engagement while using a context-based and personas-based conversational system (chatbots) using design science research that covers three iterations: (1) personas elicitation, (2) survey and SEFMs, and (3) chatbot interaction analysis. In the first iteration, student groups and personas are identified using the K-means clustering method, which is applied to two datasets. Before that, three methods are used to identify the optimal value of K: the elbow, gap statistic, and silhouette methods. K-means clustering is a clustering method that is used to divide a dataset (e.g., student data) into groups based on a specified number. The results present groups that have similar attributes or features, so, in this study, students in the same groups have similar features and they differ from students in other groups.
The contribution of this paper is that it proposes a straightforward and applicable quantitative data-driven persona development method (DDPDM) that can be used in higher education institutions (HEIs) to identify student groups and personas from existing data. It could help other researchers and practitioners to propose tools or techniques to enhance student engagement and thus performance based on different student personas. In addition, we propose eight undergraduate student personas that are mainly based on student engagement and performance data. This study, alongside our future improvements, could help in the development of new forms of pedagogical practices that rely on virtual learning environments (VLEs) and chatbots instead of (or in combination with) traditional teaching approaches.
The remainder of the paper is structured, as follows: Section 2 discusses previous work related to this research. Section 3 describes the materials and methods that are used to pre-process the data. Section 4 presents the analysis and results of the two data analysis, starting with identifying the optimal value of K and then applying K-means clustering to the two datasets. Section 5 discusses the results and interprets the decision of combining the two data analysis results in one. The paper is then summarised in Section 6, which includes limitations of the study, suggestions for further research, and speculates on future directions.
2. Related Work
Initially, with the popularity of user-centred design (UCD), the usability of systems, websites, and products were improved [25,26,27]. User-centred design is also referred to as ‘customer-centred design’ or ‘human-centred design’ and it is a type of design that brings customers or users into the design process [26,27]. UCD has spread widely. However, there has been some frustration that is related to the design of modern products. Many corporations have failed to focus on consumer needs as the most important aspect of the design process [27]. Therefore, many design processes have failed to reach the target users or consumers [27,28,29]. The well-documented usability issues of products, systems, and websites prove that current product design processes need improvement. For example, many products are returned because they are difficult to use, or the users are unable to use their preferred features [26].
Personas provide a solution to some of the problems with the current UCD approach. The ‘persona’ concept was proposed by [29] as a design process methodology [30]. Personas are not real people but imaginary archetypes of actual users [30]. A persona is defined as “a precise description of a hypothetical user and what s/he wishes to accomplish” [21] (p. 1). A persona is also referred to as a ‘target customer characterisation’, ‘profile’, or ‘user archetype’ [31]. Persona development is an alternative method for representing and communicating users’ needs [26]. There is much research in the literature that discusses persona templates [32,33], creating personas [34,35,36] and what they are suitable for [22,30,31,36]—in particular, using personas for interface and interaction design has attracted great attention [31]. Persona development as a design technique is becoming increasingly popular, as it presents the main users’ features to be used for product design and marketing [35]. Additionally, it is an efficient way to improve users’ experiences with products and services [31]. Moreover, personas provide product designers with powerful representations of target consumers [26].
Furthermore, using personas has other benefits: (1) providing a better understanding of users, (2) providing design requirements at an early stage, (3) requiring design thinking, (4) focusing on users’ goals, requirements and characteristics, (5) facilitating stakeholder communication, and (6) including political and social factors in design decisions [37]. However, according to [21], there are a few problems with personas development, including creating personas that are not based on first-hand datasets [36], which is not the case in this study. Moreover, personas can be unreliable if they do not have a clear relationship with the data, such as if they were designed by a committee [36].
Chatbots have been utilised in educational domains for different purposes [38], such as introducing students to concepts. A study by [39] used chatbots to introduce students to AI and conversation concepts, rather than the creation of chatbots. Using Turi to build the chatbots, the students were able to create several instances of the chatbot Program O. This was done to enhance their understanding of AI concepts, such as call–response conversations. The interactions with the chatbots were written in AI Markup Language (AIML). Each student could construct these instances by modifying AIML statements. Moreover, the students could conduct conservations with their own chatbots or other students’ chatbots. The teachers liked the idea and provided positive feedback [39].
Another study by [40] showed how chatbots could be utilised in education to teach socially intelligent computing principles to undergraduate students studying introductory computer science courses. The students created a project while using the Java programming language that enabled collaboration between the individual chatbots that they created: whenever a question could not be handled by the first chatbot, it searched for an answer from other chatbots, and so on [40].
Chatbots can enable self-guided learning in an educational context. They can provide feedback on a large number of activities for students across a whole semester. This is done using AI techniques and applying natural language processing features and machine learning algorithms [41]. Chatbots can provide students and teachers with progress reports, including student performance, test results, and the easiest and most difficult parts of the course. Chatbots can then send personalised notifications to individual students to suggest specific quizzes and send warnings to teachers about the students who are struggling in their studies. The results of one study showed that 72% of the students thought that chatbots could assist them in engaging more with the course. Almost all of the students (94%) recommended using testing chatbots for other modules at the university [41].
Chatbots have been utilised in distinct scenarios to make people interested in computer science for decades [42]. Worldwide, young students have a lack of engagement in computer science. For example, in Argentina, only 4000 computer science students graduate per year, which is half the amount that is needed by the national industry, while there are 15,000 economics graduates and 10,000 law graduates [43,44]. Therefore, [34] created an innovative way to introduce high school students to computer science while using chatbots and ALICE, which is a well-known education tool. The chatbots taught students basic concepts, such as conditions, variables, and finite state automata, to name a few. The chatbots provided automatic formative assessments to the students while using finite state automata and pattern matching. Formative feedback was immediately generated when errors occurred. The researchers studied the effectiveness of using chatbots on student engagement while using two observational studies: (1) a compulsory in-classroom pilot course across 15 lessons, conducted in three high schools, and (2) an online nationwide contest with at least 10,000 participants. Students’ engagement indicators were measured, such as attendance, enthusiasm, task completion, willingness, and self-reported interest. The study results indicated enhanced student engagement; girls reported more interest than boys, and they were more willing to use chatbots to learn more [42,44]. Regarding the online contest, the percentage of students who completed their tasks with chatbots was five times higher than those who used ALICE.
A study by [45] explored whether a development model of units of learning (UoLs), supported by authoring tools, allowed for better usability of resources for high school teachers. The study used design science research as the main design research method and it used the K-means algorithm. K-means clustering was used to identify user groups. Two groups were identified: participants with strong technology skills and participants with poor technology skills. This was achieved based on quantitative data, such as effort times, task completion, the occurrence of errors in tasks, and aid requests. The study covered three iterations. In the first iteration, data were collected from questionnaires, interviews, and documents. In the second and third iterations, data were collected from questionnaires and non-participant observations. The results of the study show that the usability, reusability, creation, and editing of educational resources by high school teachers can be improved by integrating authoring tools and Learning Management System (LMSs).
3. Materials and Methods
The design science research (DSR) methodology is the principal research methodology used in this study to create and evaluate an innovative artefact that enables UK HEIs to solve one of their key problems [46]: low levels of student engagement. The DSR approach is adapted from [47] to meet the research’s aim and objectives in each iteration. A valid information system (IS) research process is conducted through the building and evaluation of the designed artefact [46].
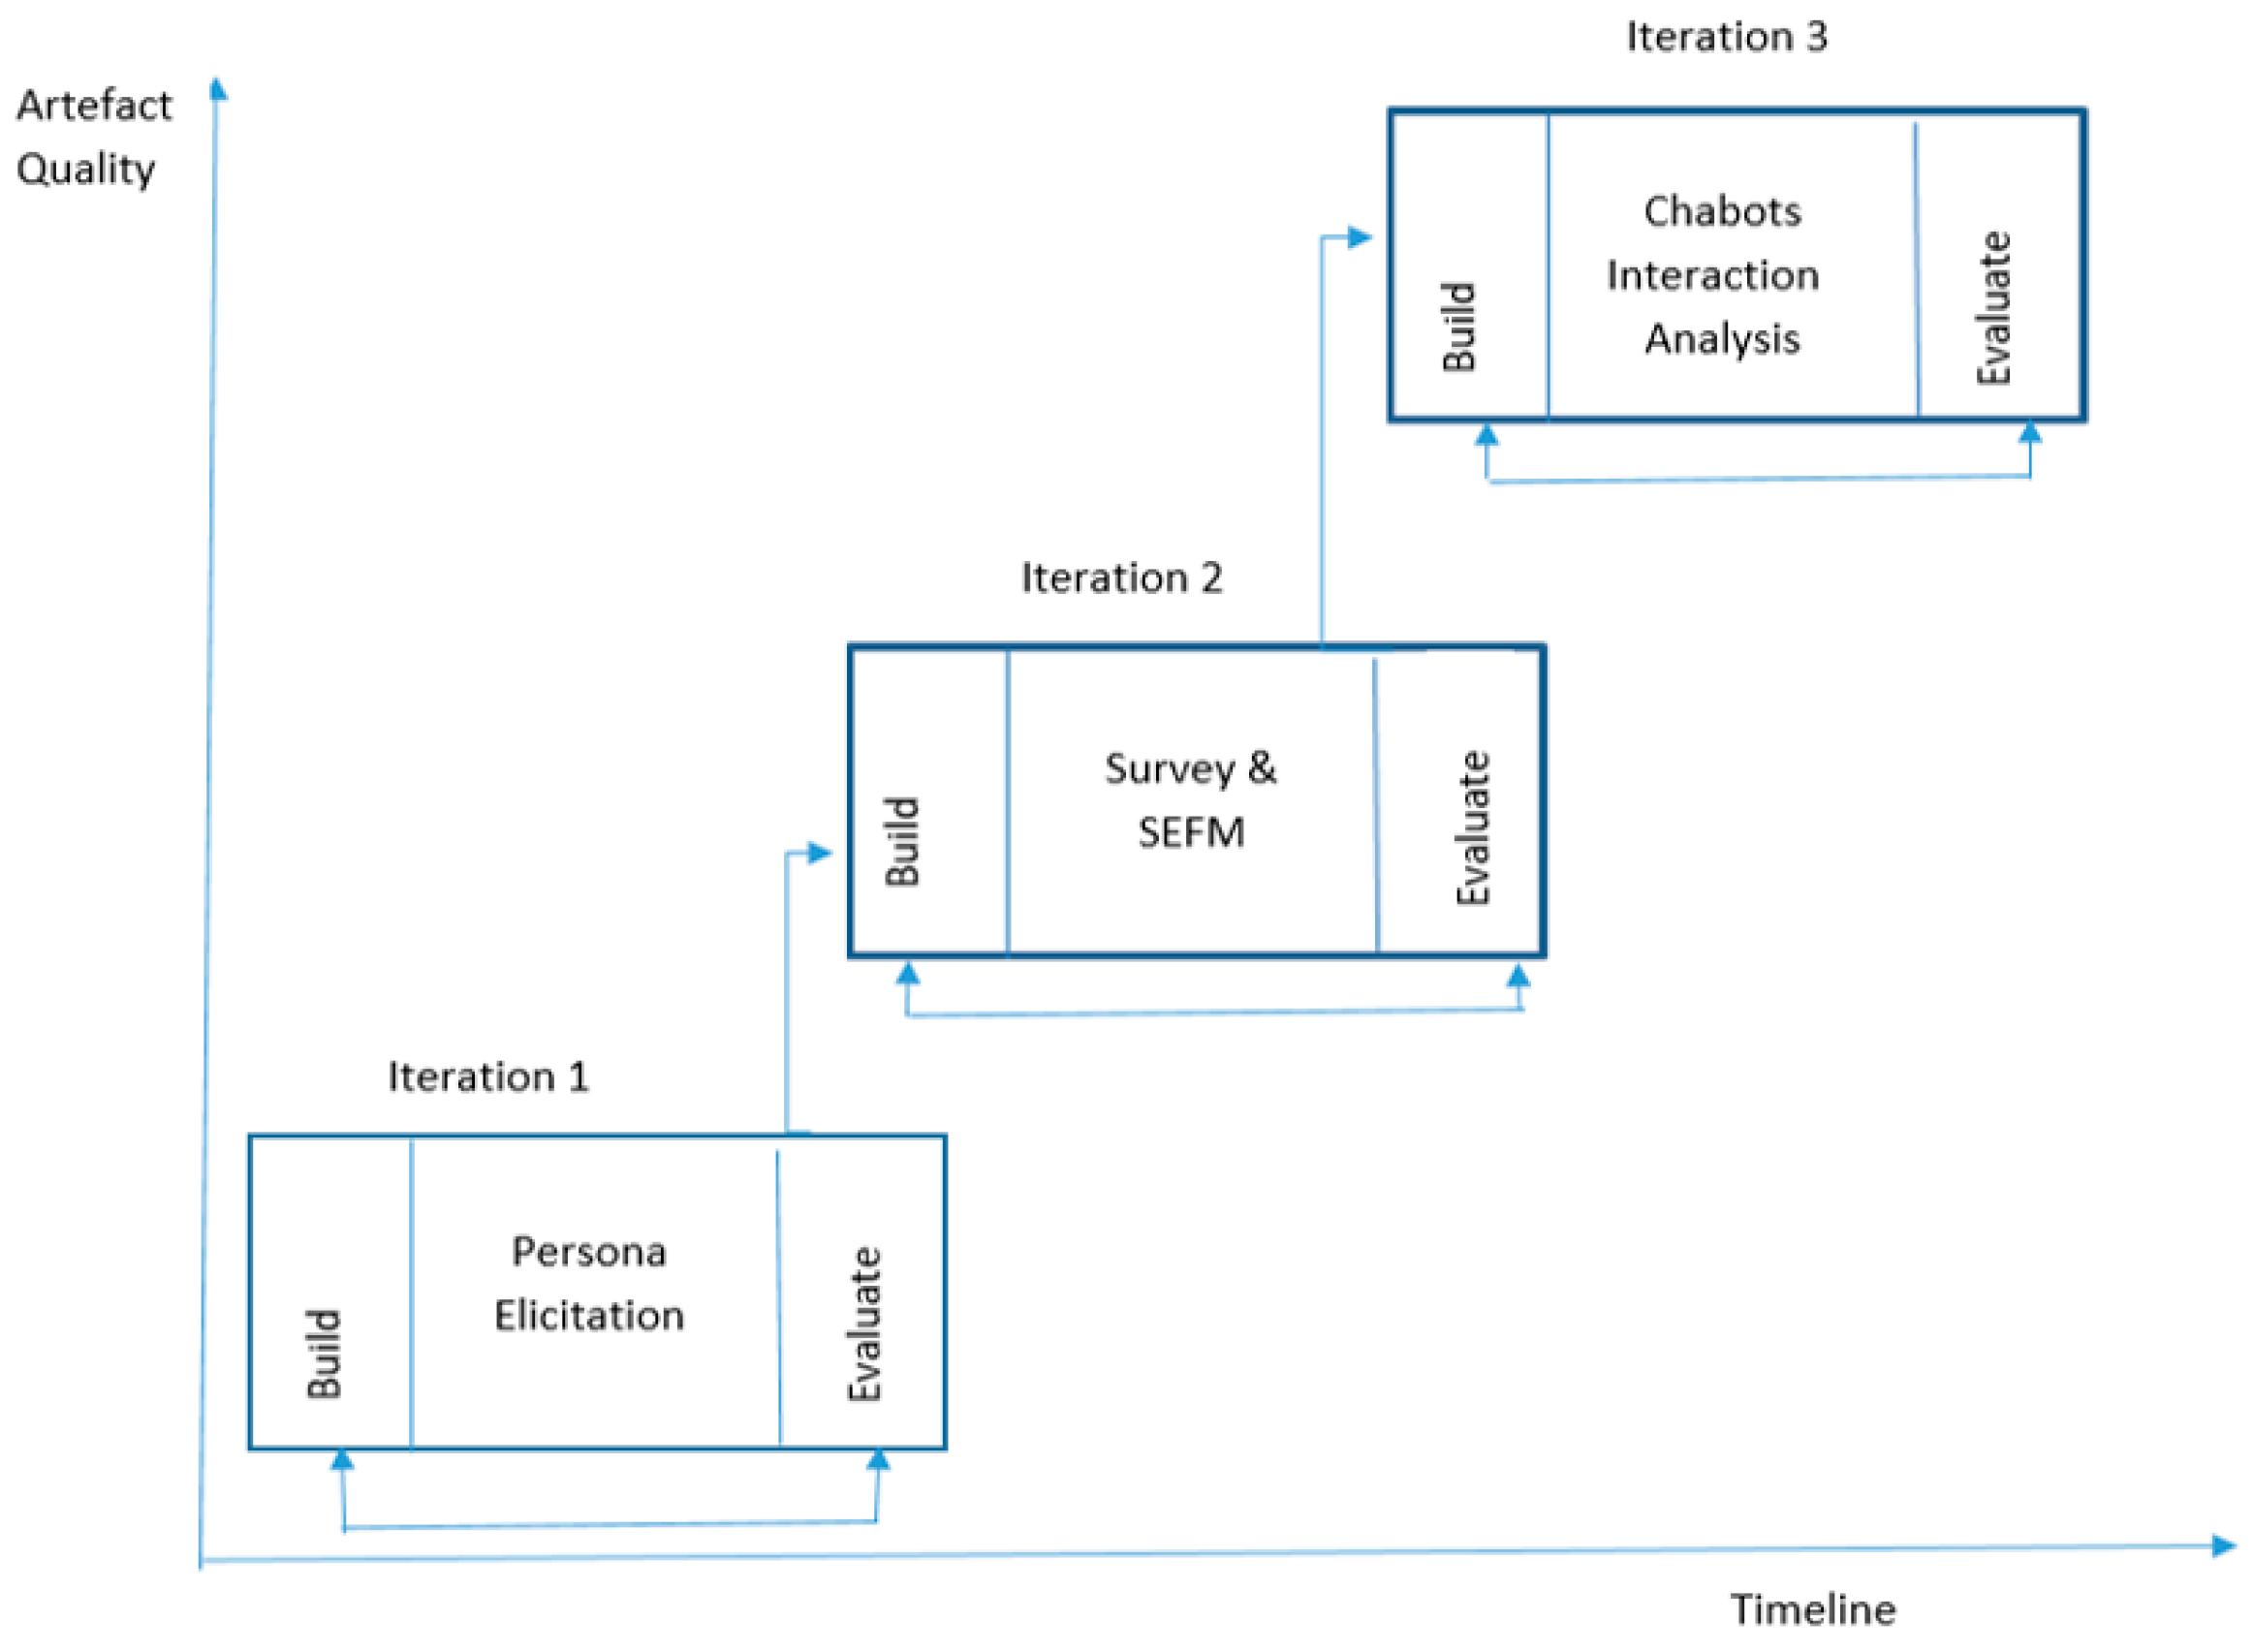
The core idea of this research is to enhance student engagement at HEIs while using a conversational system. This is achieved using three iterations, as shown in Figure 1. The first iteration, personas elicitation, aims to identify student groups at Brunel University London using machine learning, particularly K-means clustering. The results of the data analysis and the literature review form a persona template and students personas. The second iteration involves conducting a survey and developing SEFMs. This is achieved using a questionnaire, which will be designed based on the literature review and persona elements from the first iteration. The third iteration, chatbot interaction analysis, aims to study the effectiveness of using a chatbot in enhancing student engagement. This iteration includes designing and building chatbots that will enhance student engagement.
This paper focuses on the first iteration, personas elicitation, and the second two iterations will be conducted shortly after. Each iteration is performed in five phases: (1) problem awareness, (2) suggestions, (3) development, (4) evaluation, and (5) conclusion [47]. Firstly, awareness of the research problem is developed through a literature review. This involves reviewing and analysing the literature on mobile educational technology, student engagement, and the state of the art of chatbot use in HEIs.
Secondly, the suggestions phase is fundamentally a creative step where a new idea is proposed to address the problem through the design of an appropriate framework. The first iteration covers utilising a machine learning framework to identify student groups on campus and build student personas. The second iteration covers building SEFMs by identifying the factors that affect student engagement. The third iteration uses the knowledge that was identified from the results of the previous two iterations to design and develop a chatbot prototype. In addition, there is a suggestion of establishing an experiment to measure the effectiveness of using this conversational system in enhancing student engagement.
Thirdly, the development phase is carried out through the development of the research artefacts, as represented by constructs, models, methods, and instantiations. In the first iteration, the artefacts are personas models and the DDPDM. In the second iteration, the artefacts are constructed in the form of a survey and SEFMs. In the third iteration, the artefact is a chatbot, which is a form of instantiation.
Fourthly, the evaluation phase focuses on evaluating and assessing the developed artefacts in the previous step in terms of effectiveness, reliability, validity, and usability [48]. The results of the first iteration, the student persona models, are evaluated in the second iteration with different student data. The results of the second iteration, the SEFMs, are evaluated regarding their reliability and validity using structural equation modelling (SEM). The result of the third iteration, the chatbot, is evaluated in terms of its usability using the System Usability Scale (SUS) and its effectiveness in enhancing student engagement while using pre- and post-tests.
Finally, the conclusion phase is about concluding and writing up the design research cycle, starting from understanding the problem in the domain space and ending with summarising the research findings. In addition, it assesses the limitations of the solutions and develops suggestions for future work.
Overall, the research method is DSR, and a certain method is used to achieve the aim of the iteration in each iteration. For example, in the first iteration, K-means clustering is the main research method that assists in identifying student groups at Brunel University London, and the results of the clustering are used to form a persona template and personas for undergraduate students. The first iteration is described in the following section.
3.1. Personas Elicitation
The objective of the first iteration, personas elicitation, is to identify different types of university students by building data-driven personas. The problem awareness phase includes conducting a literature review on student engagement and the current state of mobile educational technologies (e.g., chatbots). The suggestions phase starts with identifying different groups of students in the Computer Science Department at Brunel University London and then proposing a data-driven personas development method that utilises a machine learning framework and applies K-means clustering. Details of the two datasets are provided in Section 3.3.1. A further suggestion was to propose a personas template for university students from the literature and develop it based on the results of the data analysis. The development phase includes building a university student template and personas based on the literature review and an understanding of the users’ backgrounds and skills. The evaluation phase covers evaluating the proposed data-driven personas development method and the generated personas by asking ten experts from a world-renowned research group in the department, namely the Intelligent Data Analysis (IDA) group, regarding the effectiveness of the proposed method and whether the developed persona represents a real undergraduate student in the department.
3.2. K-Means Clustering and Identifying the Number of Clusters (K)
Clustering methods are used in this study to identify the groups of students and extract the students’ attributes to build the personas. Clustering refers to the task of grouping a set of objects so that objects in the same group are similar to each other but different from objects in other groups [31,37]. Clustering is unsupervised learning that does not require any training data before using it [50], unlike classification [51]. Several clustering algorithms have been proposed in the literature, such as K-means clustering [52,53,54]. Hartigan describes this in detail [55]. The K-means clustering method is the most popular and widely used clustering algorithm due to its simplicity [56]. Besides, it is robust, fast, and easy to understand. It has good performance when there is no noisy data or outliers but is unsuitable for categorical data [57]. Therefore, it suits the two datasets in this study.
The core idea of K-means clustering is to define K centroids for K clusters. It is recommended to choose K centroids that are far away from each other to simplify the process of creating the cluster. After that, each data point is assigned to the nearest centroid until no data points are left. These data points and their centroid form a cluster. For each K cluster, a new centroid is recalculated, and then each data point is reassigned to the nearest centroid to form a new K cluster. This step is repeated until no changes are noticed–until the K centroids do not change [56]. The K-means algorithm forms clusters in such a way that each data point has the minimum square error between the point in the cluster (itself) and its cluster mean, as shown in Equation (1). K-means methods aim to obtain the minimum sum of the squared error in all the K clusters, as shown in Equation (2).
Let X be the set of data points X = {x1, x2, x3,…….., xn} and V be the set of centres V = {v1, v2,……., vc}. The algorithmic steps for K-means clustering are as follows [57]:
- Select ‘C’ centroids, cluster centres, randomly.
- Compute the distances between each data point in set X and the cluster centroids. Assign each data point to a cluster that has the minimum distance from the point to the centroid.
- Re-compute the new cluster centre using the formula, as shown in Equation (3):
where ‘ci’ represents the total number of data points in the Ith cluster.
- Recalculate the distance between each data point and the new centroids.
- Repeat steps 3–5 until there is no change in assigning the data points to the centroids [57].
Assuming that X = {x1, x2, x3,…., xn} is the set of data points and V = {v1, v2,…vc} is the set of centres, the similarity or regularity of the data items is measured while using a distance metric. Some of the popular distance metrics to calculate the difference between two points p (x1,y1) and p (x2, y2) are Euclidean distance [58,59], Manhattan distance [57,59], Chebyshev distance [57], and Minkowski distance [57,59], as shown in Equations (47), respectively. In this study, Euclidean distance is used to measure the centre of a new cluster, because it is suitable for continuous data [60]; see Equation (8).
Clustering results vary based on the number of cluster parameters. Thus, the main challenge of using clustering is to identify the right number of clusters before performing the clustering [56]. The developer can query the end user to provide the number to address this issue for the K-means method. However, this is not always feasible, as the end user might not be familiar with the domain knowledge of each dataset. Therefore, some statistical methods have been proposed to estimate the number of clusters, such as the elbow method [56,61], the silhouette method [56], and the gap statistic method [62].
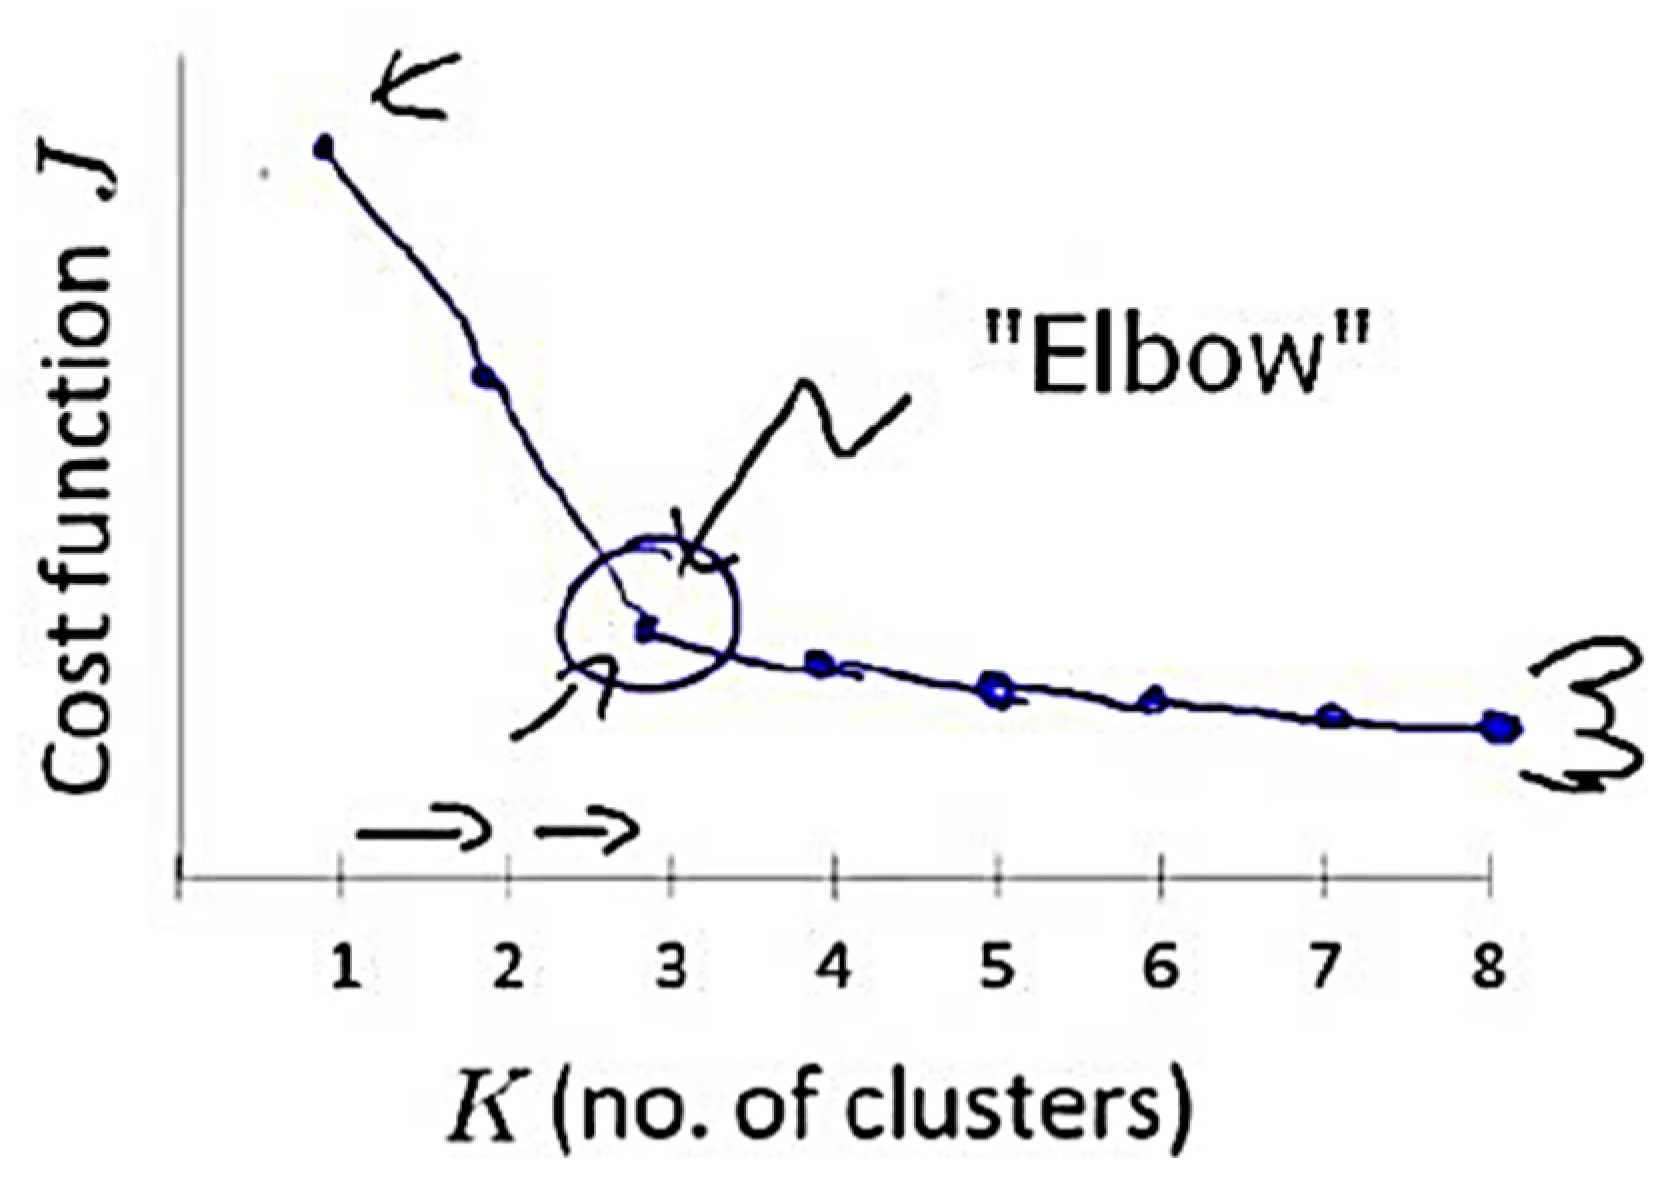
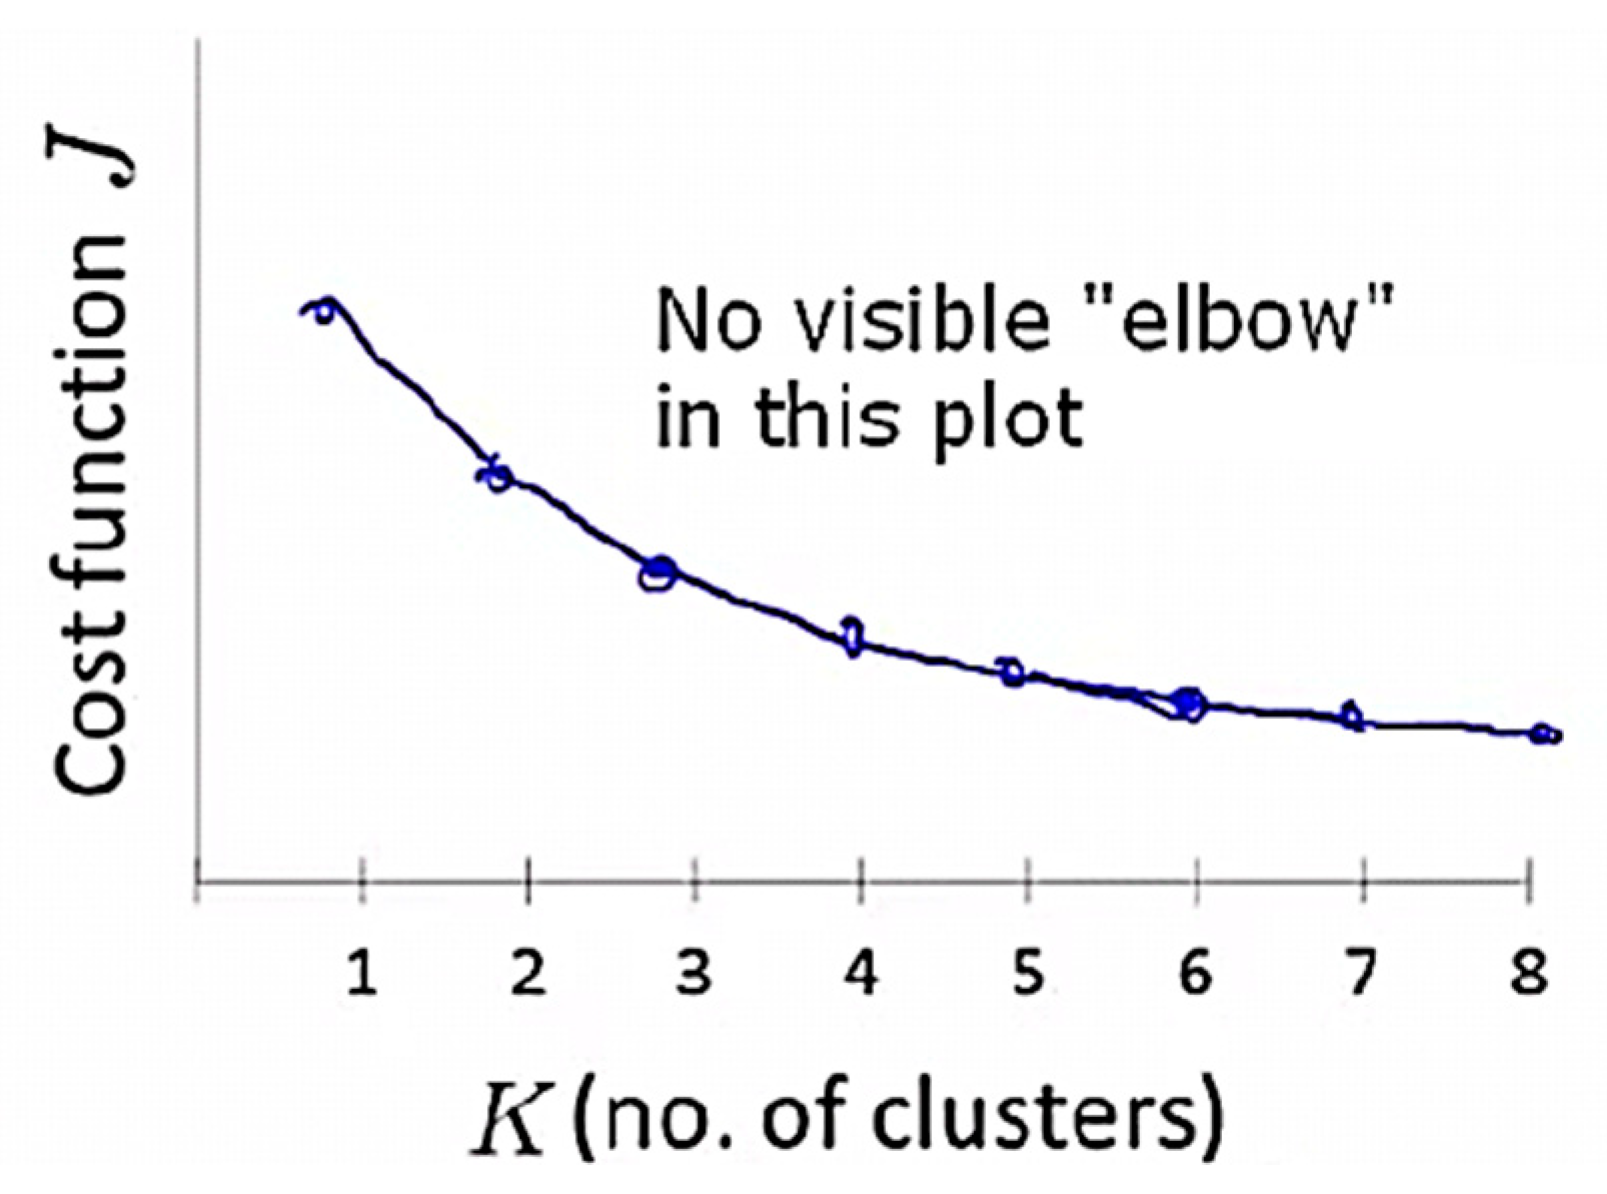
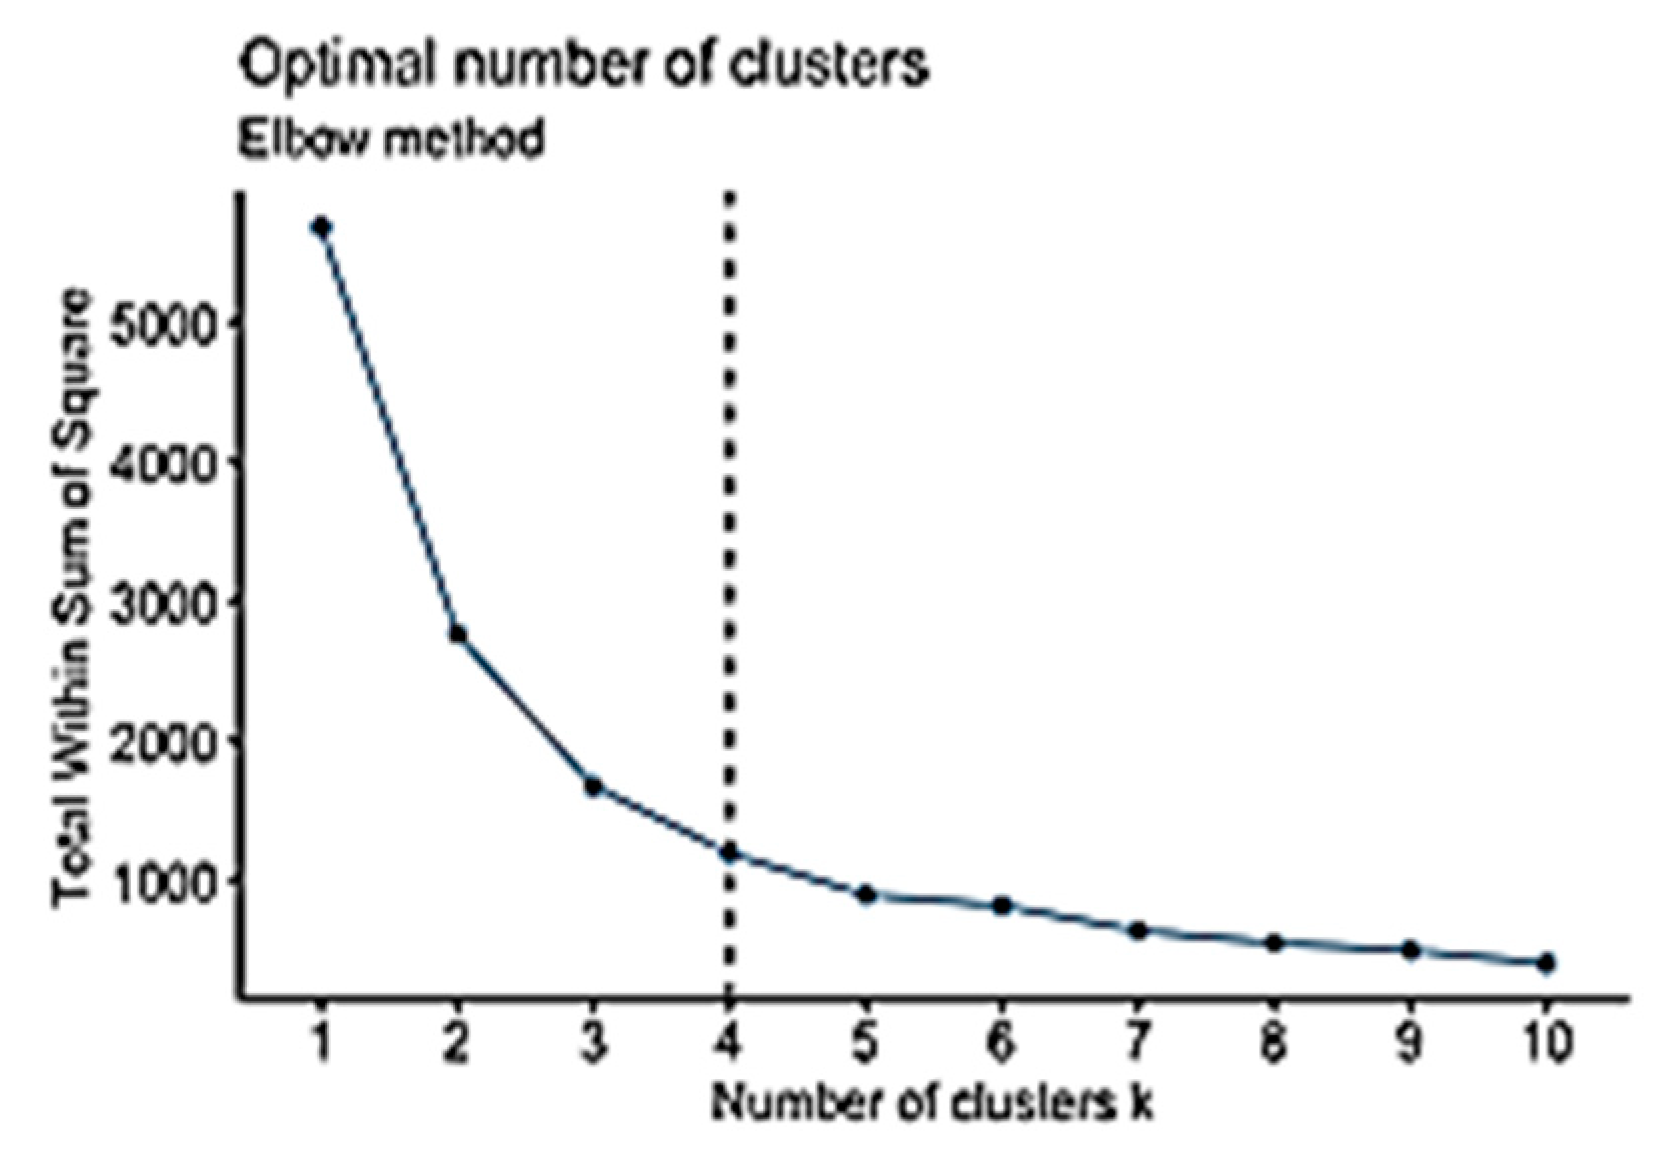
The elbow method is considered to be the oldest method for determining the appropriate number of clusters for a dataset. The elbow method is a visual method that starts with K = 2, increments K by 1 in each iteration, and computes the K clusters and the cost that comes with the training. With each value of K, the cost declines dramatically and eventually reaches a plateau, and this identifies the K value (Figure 2). However, a limitation of the elbow method is that there might be no clear elbow or more than one elbow, as shown in Figure 3 [56,62]. The elbow method is calculated while using the sum of squared errors [61], as shown in Equation (9).
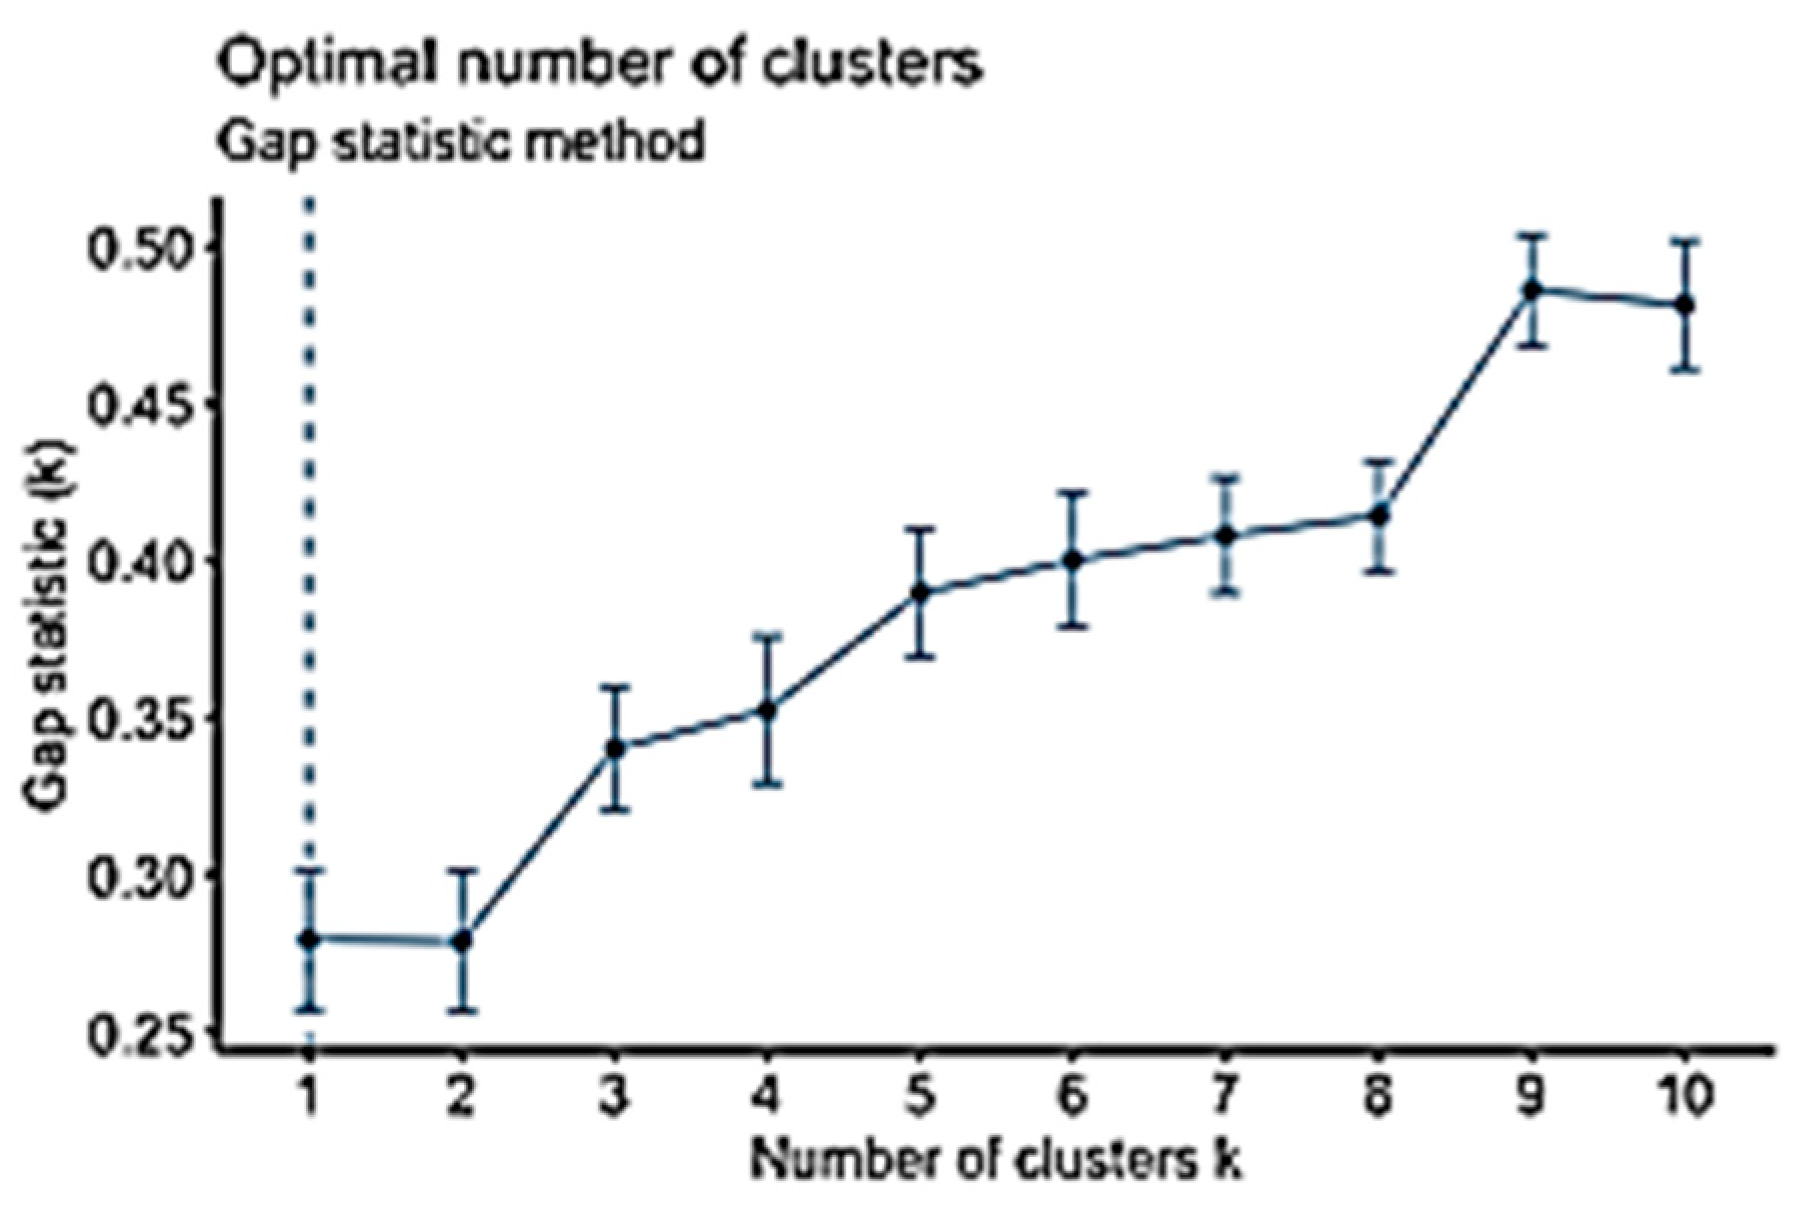
The gap statistic method is another method that is used to identify the most suitable number of clusters; it is designed to work with any clustering method [62]. It compares with as shown in Equation (10). Accordingly, the estimation of the K value is computed using the following equation [62]:
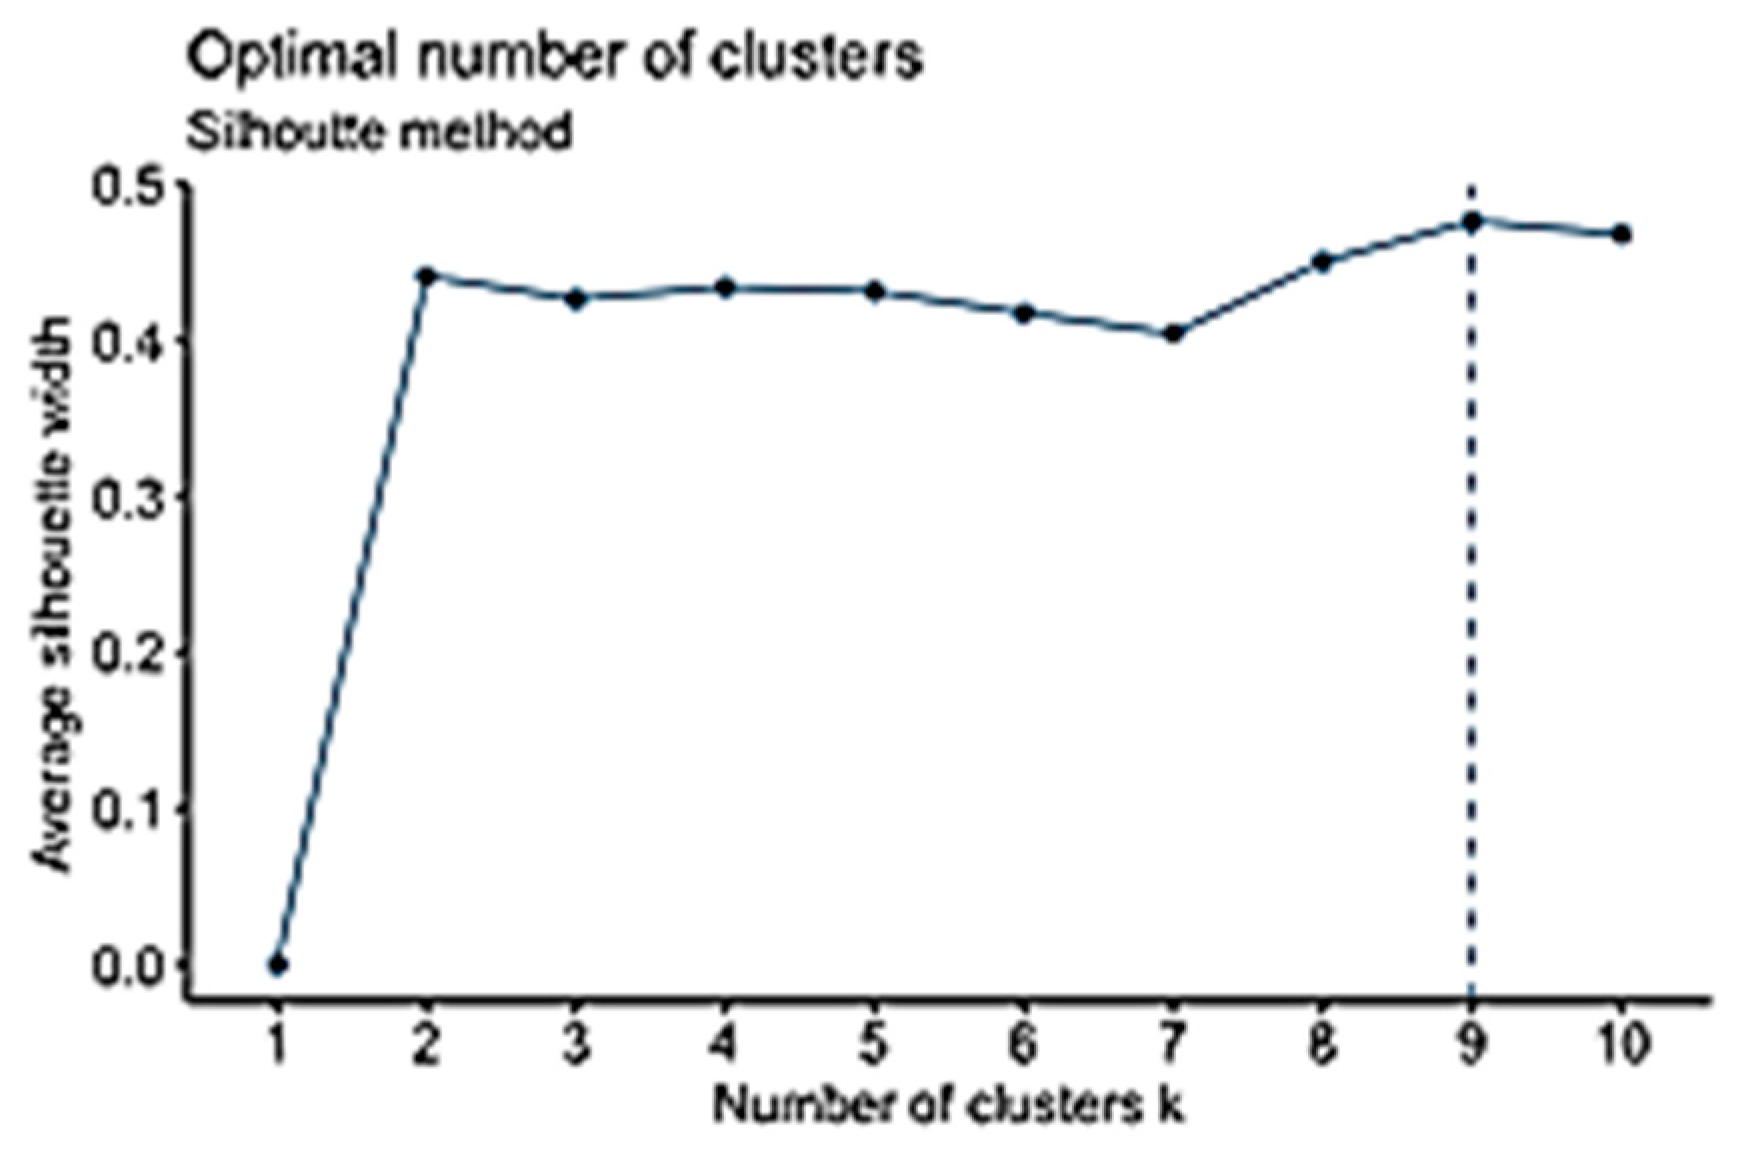
The silhouette method is a new graphical method developed for partitioning technique [63], such as K-Means, to clearly identify separated clusters [64]. Its core idea is based on clusters’ tightness and separation [64]. It compares within-cluster distances to between-cluster distances. The higher the number, the more it fits. One of the strong points of the silhouette method is that the actual partition of the object does not depend on the clustering algorithms that have been used to obtain it, but on the actual partitions on the objects, as shown in Equation (11).
Average silhouette width is used to evaluate the cluster validity and find the optimal value of K [63]. Silhouette Coefficient for K clusters is the average silhouette width of mentioned K-clusters [65]. The silhouette width, which was introduced by Kaufman and Rousseuw [66], is a well-balanced coefficient that has good performance. The silhouette width s(i) presents the difference between the within-cluster tightness and disconnection from the rest. The silhouette width s(i) for the entity i € I is defined in Equation (8). The silhouette width value ranges from −1 to 1, as shown in Equation (12). Set I is well structured when the silhouette width value is close to 1, and it is misleading when the silhouette width value is close to −1. However, when the value is 0, it means that the entity could be assigned to another cluster [56].
3.3. DDPDM
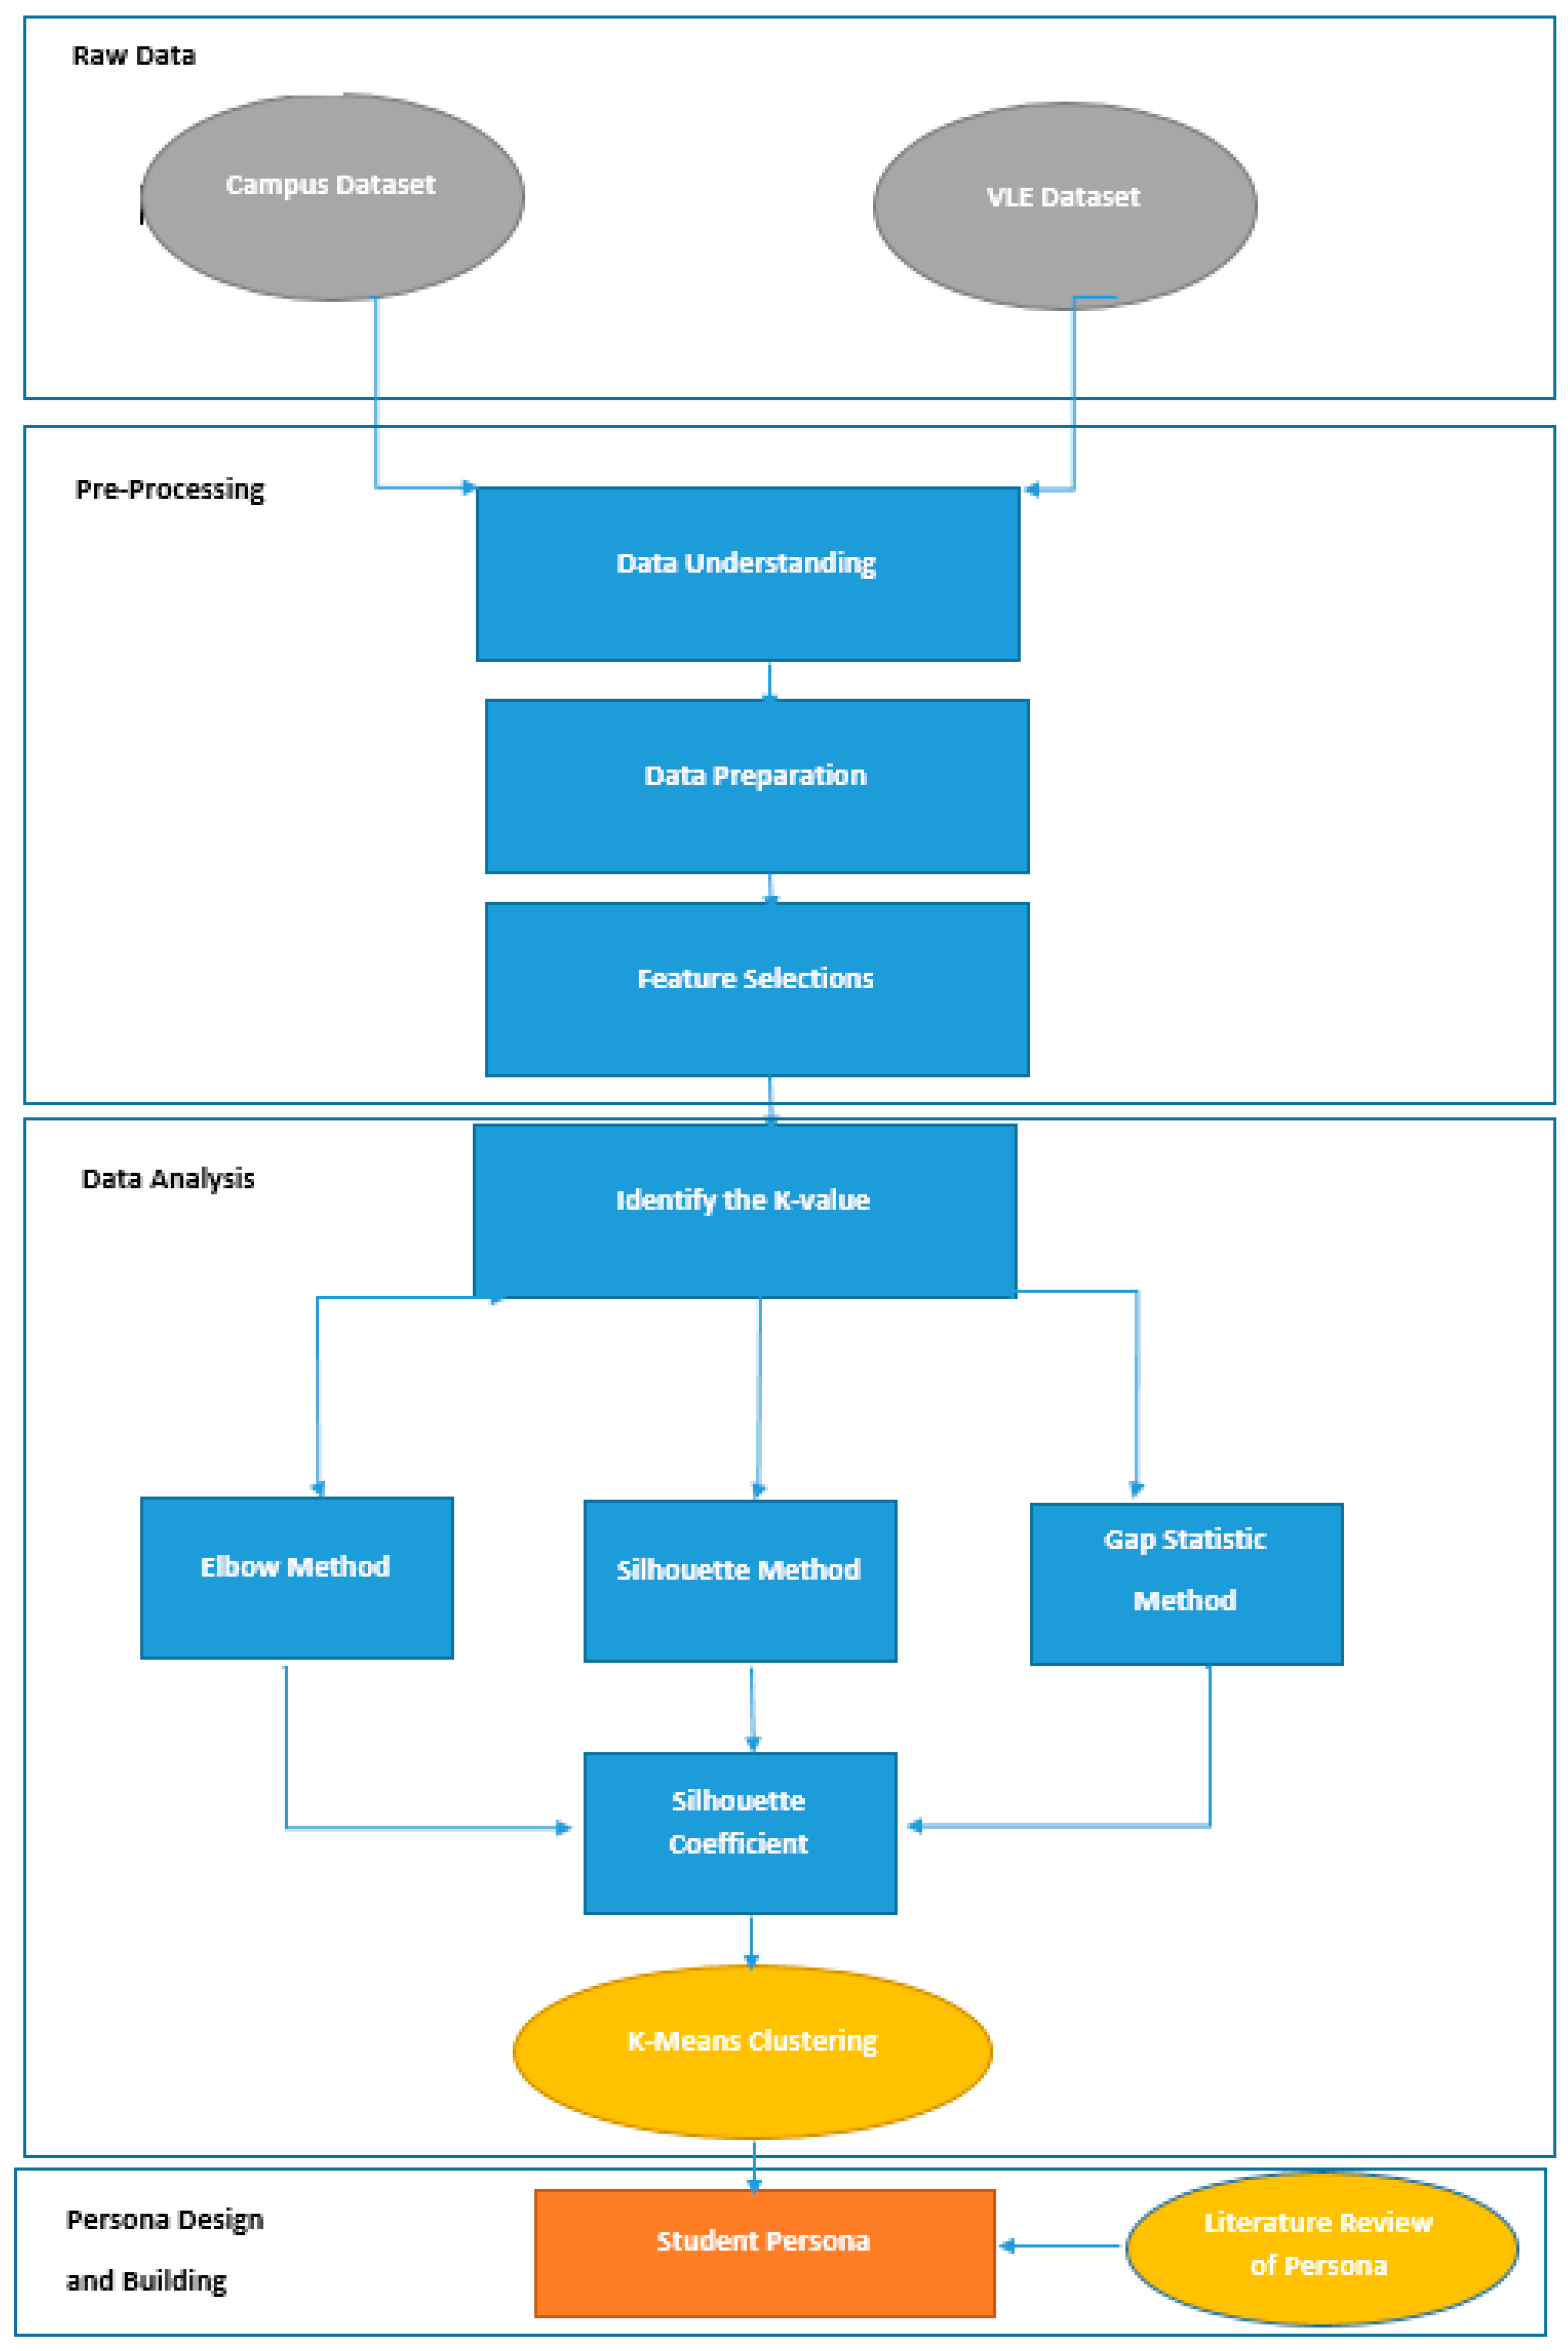
Figure 4 shows the new proposed DDPDM, adapted from the literature on data-driven persona development [21,67] and the cross-industry standard process for data mining (CRISP) methodology [68] a structured approach for data mining projects. The DDPDM contains three main phases: (1) data pre-processing, (2) data analysis, and (3) personas design and building. The data collection involves determining the type of dataset required for the analysis. The proposed method is applicable, cheap, and straightforward when compared to the methods that were used by Cisco and Microsoft [19,55]. The datasets in this study include two types of behavioural engagement: attendance and interaction with a VLE.
3.3.1. Data Description and Pre-Processing
This section covers data understanding, data preparation, and feature selection. It is important to mention that student data are very sensitive data; gathering them required ethical approval, which was difficult and time-consuming to obtain. The data pre-processing started with creating Visual Basic for Applications (VBA) macros. In this study, VBA macros were developed to anonymise student data from three worksheets and combine them into one Microsoft Excel workbook.
Data understanding is about understanding the attributes of the dataset, the data types, and the data values. Additionally, it includes preparing the data, dealing with missing data, and transforming some data types from categorical to continuous.
Data preparation was performed while using the R programming language, which is widely used by statisticians for data analysis [69,70]. The free software environment RStudio was used. It contains many visualisation packages, such as ggplot2, dplyr, magrittr, tidyr, Factoextra, and NbClust [71,72,73,74,75,76,77,78] to name a few.
The feature selection involved only identifying the appropriate attributes to be included in the dataset. The first dataset was for second-year computer science students at Brunel University London in 2014, and it included student engagement (physical engagement) and performance data. Student engagement was represented by attendance and performance, as represented by grade. The second dataset was for second-year computer science students at the same university in 2016 and represented students’ interactions with a VLE (virtual engagement) and performance, as represented by grade. From now, on the first dataset will be referred to as the Campus Dataset and the second dataset will be referred to as the VLE Dataset. Descriptions of the Campus Dataset and the VLE Dataset are shown in Table 1 and Table 2, respectively.
4. Analysis and Results
4.1. Results of the Campus Dataset Analysis
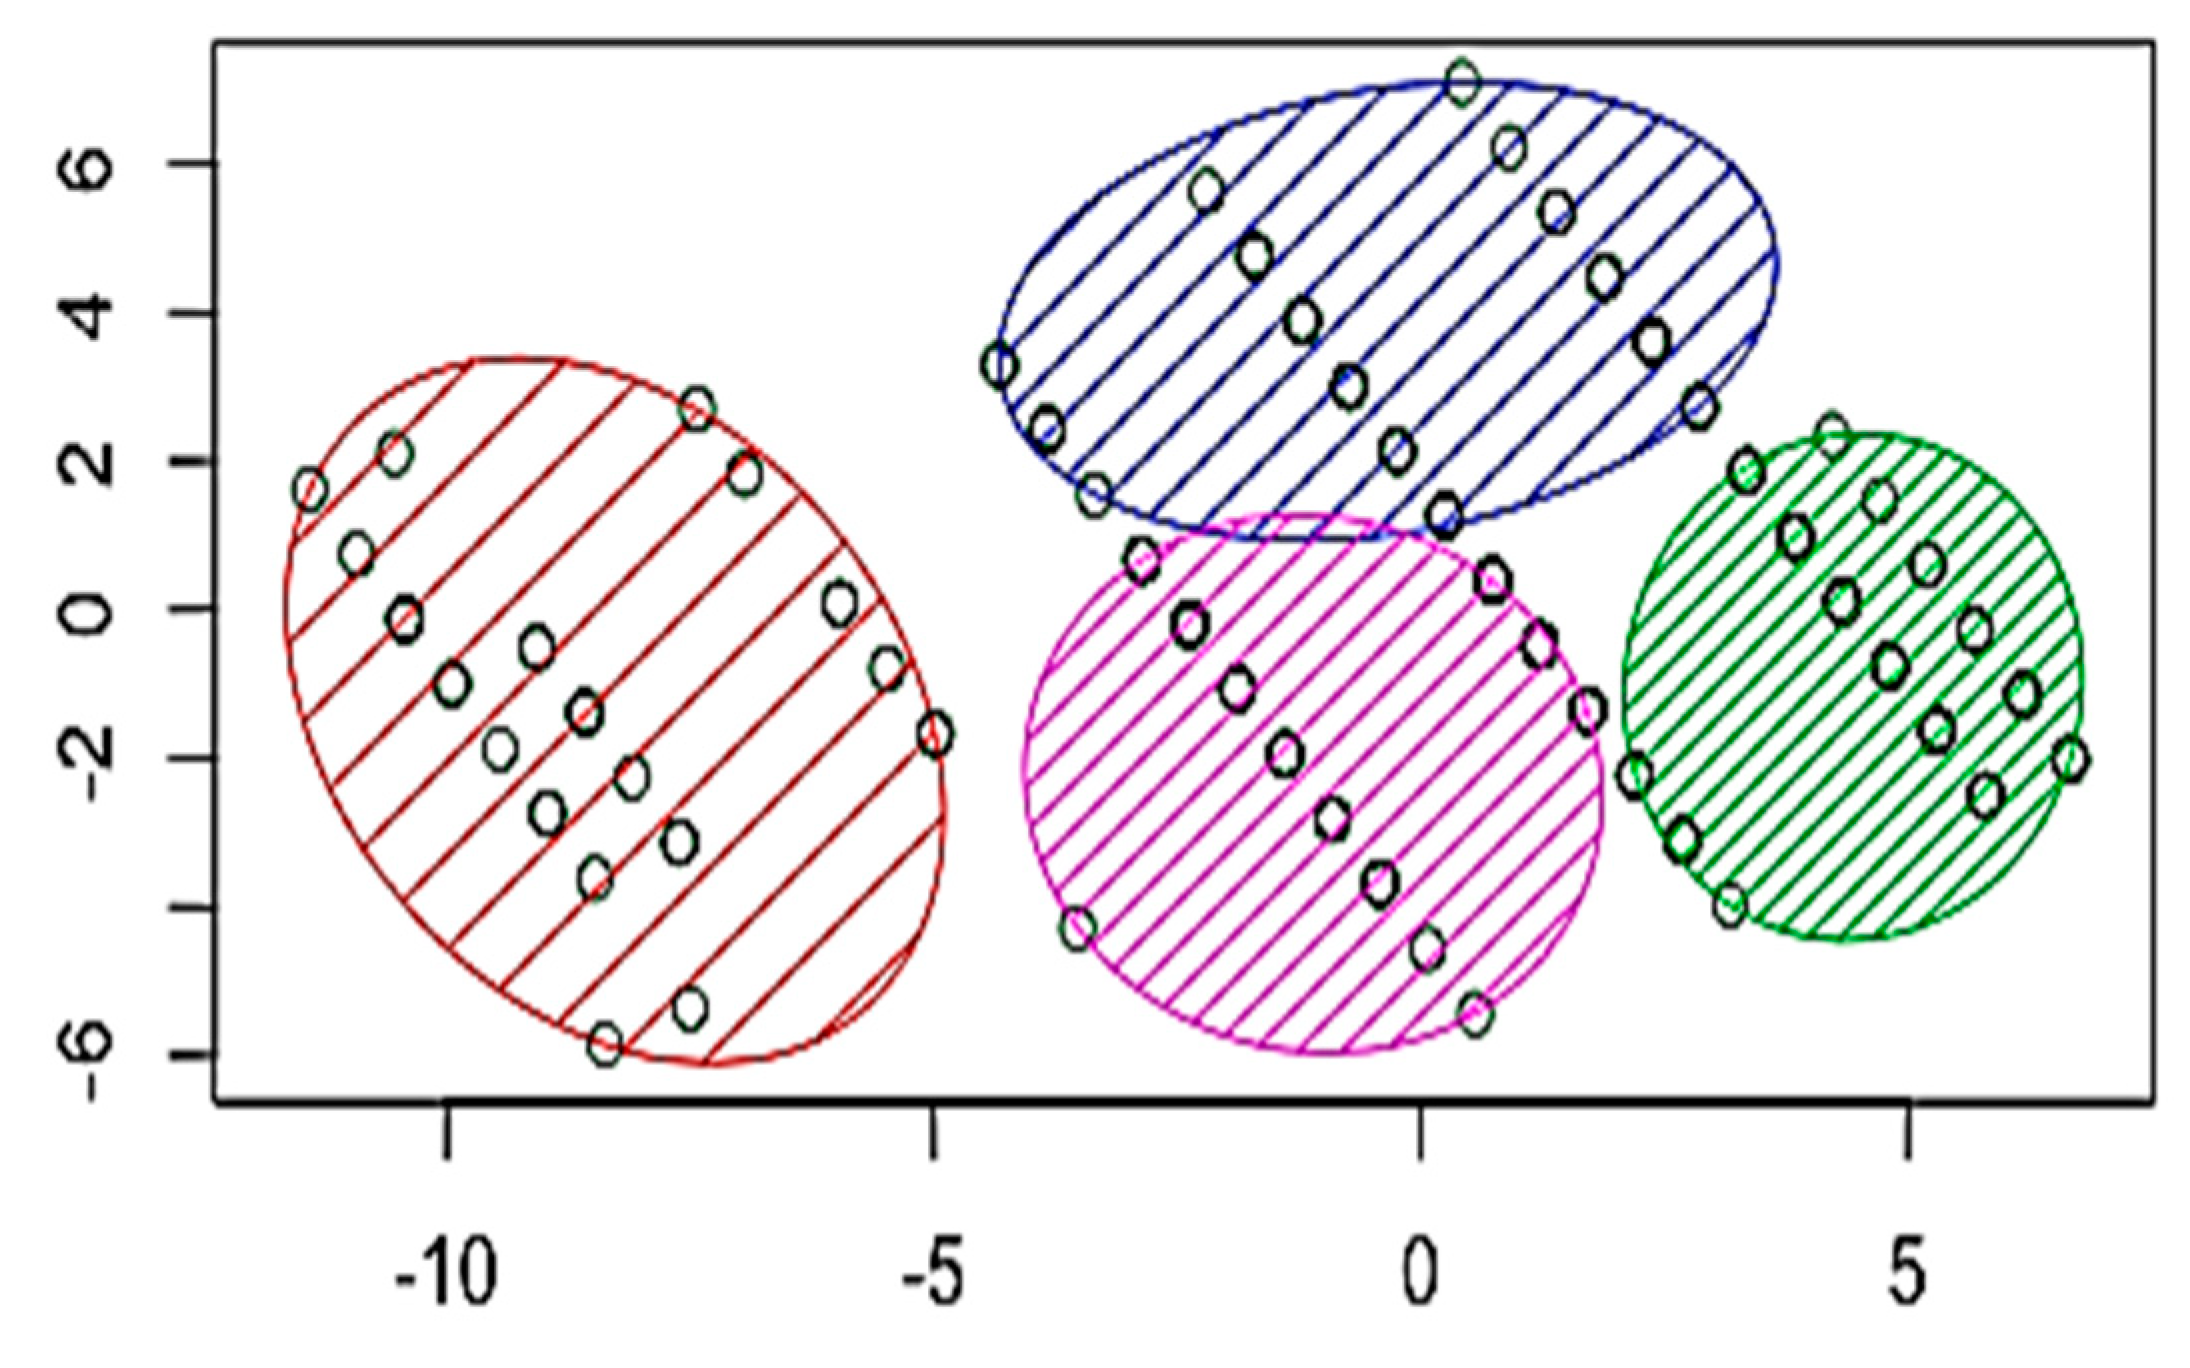
As discussed previously in Section 3.2, three well-known methods can be used to identify the K-values: the elbow, silhouette, and gap statistic methods. The three methods were run to produce three different values: K = 4, 9, and 1 to analyse the Campus Dataset (Figure 5, Figure 6 and Figure 7, respectively). K = 1, the result of the gap statistic method, was excluded because it would make no change to the existing data, and the initial value of the K-means clustering technique starts from K = 2. Accordingly, to identify the optimal values for K, the silhouette coefficient method was used when K = 4 and K = 9, and the results were 0.44 and 0.49, respectively (Figure 8 and Figure 9). There is only a slight difference between the two values. Therefore, K = 4 was chosen as the optimal value for K. Running the K-means clustering when K = 4 produced four clusters, as shown in Figure 10. The two components in this dataset explain 100% of the point variability.
The first data analysis resulted in four student clusters. Figure 11 presents the distribution of the student data in each cluster. There were 15%, 32%, 22%, and 31% of students in Cluster 1, Cluster 2, Cluster 3, and Cluster 4, respectively. Statistical summaries of the first phase of data analysis are shown in Table 3, which shows the results of applying K-means clustering to the Campus Dataset. The two main attributes are attendance, which is an indicator of behavioural engagement, and grade, which represents students’ performance.
Cluster 1 includes students with low grades and low attendance rates. Table 3 shows that the median of student attendance was four out of 12 labs (30%); the median of the grade attained was three out of 17 (17%). The attendance of students in Cluster 1 ranged between 0% and 66%. Similarly, their grades were all less than 50% (F to D). Cluster 1 is referred to as “very low engagement and very low performance” (Table 3). Cluster 2 includes students with high attendance rates and high grades. Table 3 shows that the median of student attendance was 10 out of 12 labs (83%); the median of the grade attained was also high at 15 out of 17 (88%). Their attendance rates ranged between 56% and 100%, and their grades ranged from 12 to 16 (B to A+). Cluster 2 is referred to as “high engagement and high performance” (Table 3).
Cluster 3 includes students with low attendance rates and very good grades. Table 3 shows that the median of student attendance was only four out of 12 labs (30%), and the median of the grade attained was 12 out of 17 (70%). The rates of attendance were all less than 50%, while the grades ranged between 52% and 88% (C to A). Cluster 3 is referred to as “low engagement and high performance” (Table 3). Finally, Cluster 4 includes students with good attendance rates and low grades. Table 3 shows that the median of student attendance was seven out of 12 labs (58%), and the median grade was nine out of 17 (52%). The attendance ranged between five and 12 (40% to 100%), while the grades ranged between 35% and 70%. Cluster 4 is referred to as “better engagement and low performance” (Table 3). Descriptions of the four clusters that resulted from the analysis of the Campus Dataset, along with their rules, are provided in Table 4.
4.2. Results of the VLE Dataset Analysis
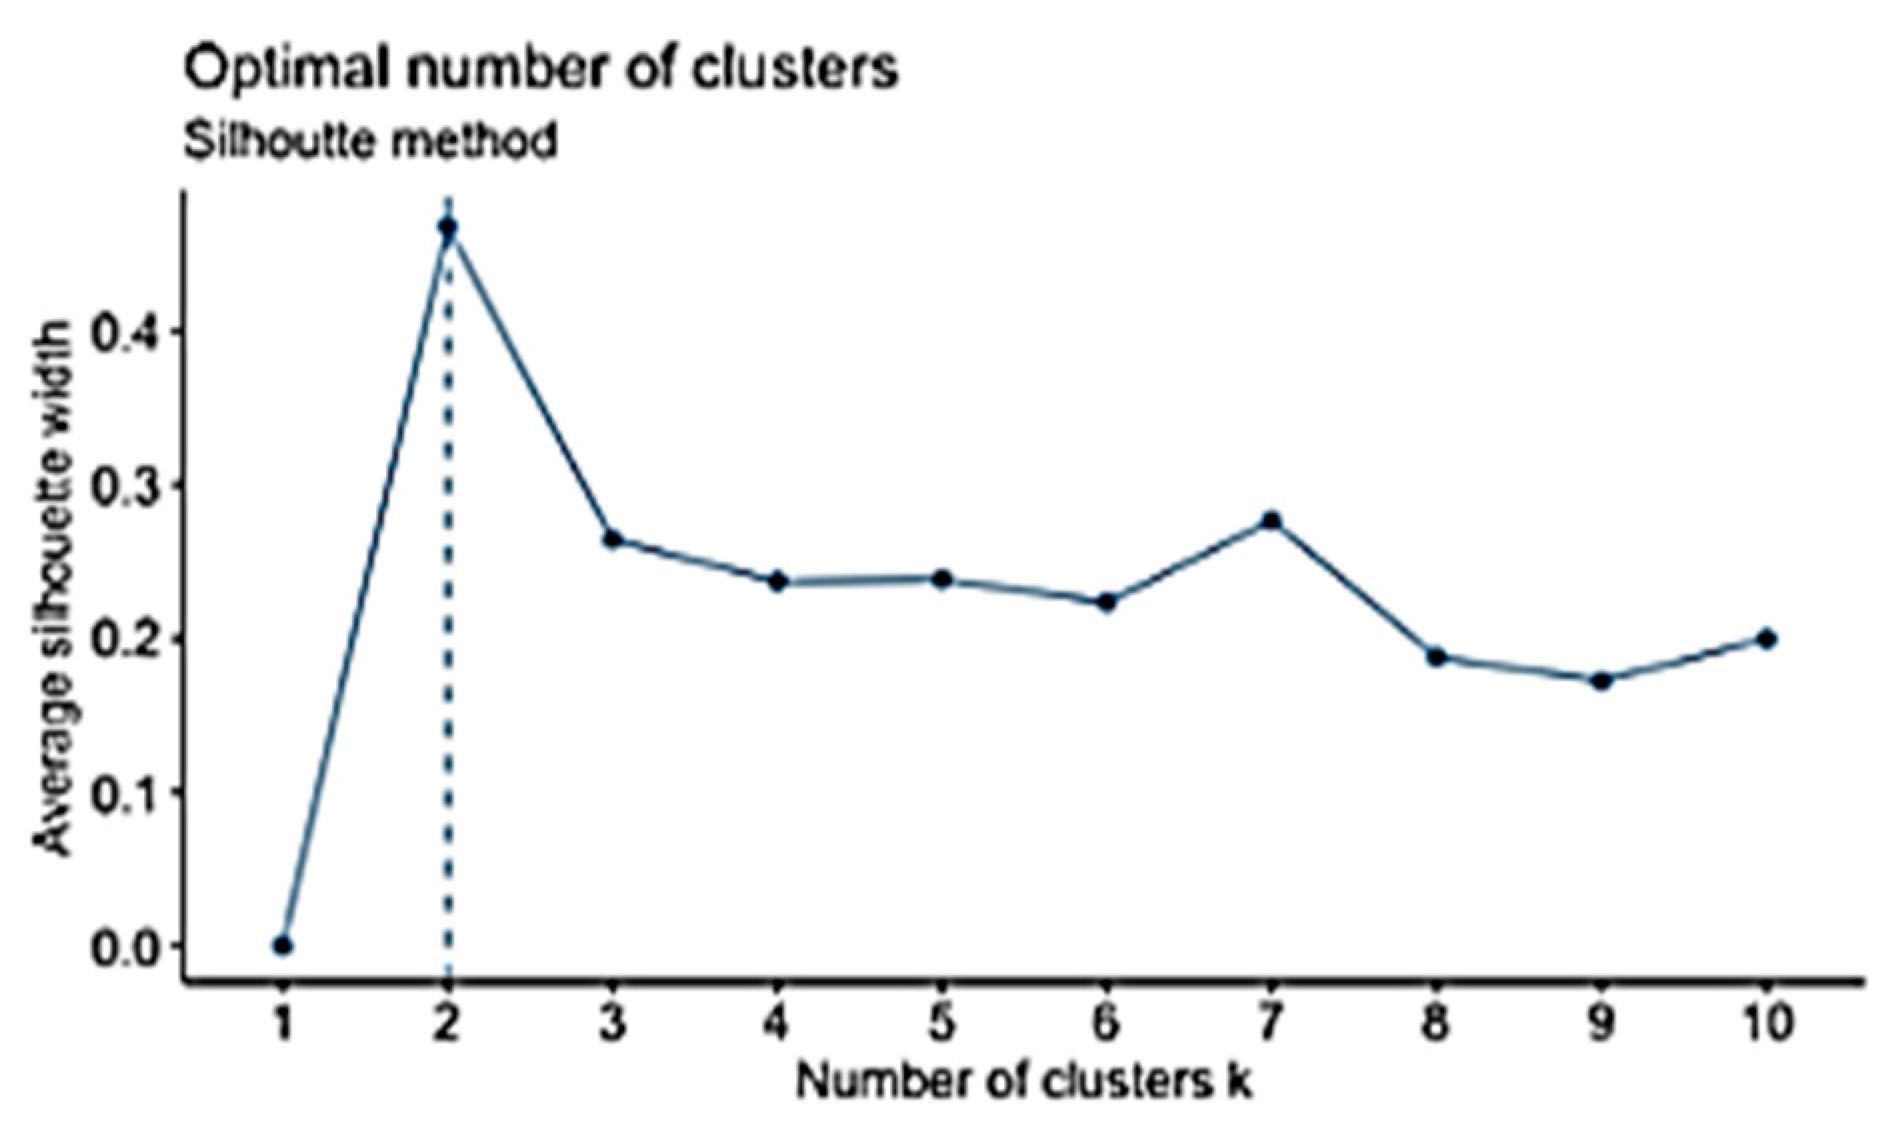
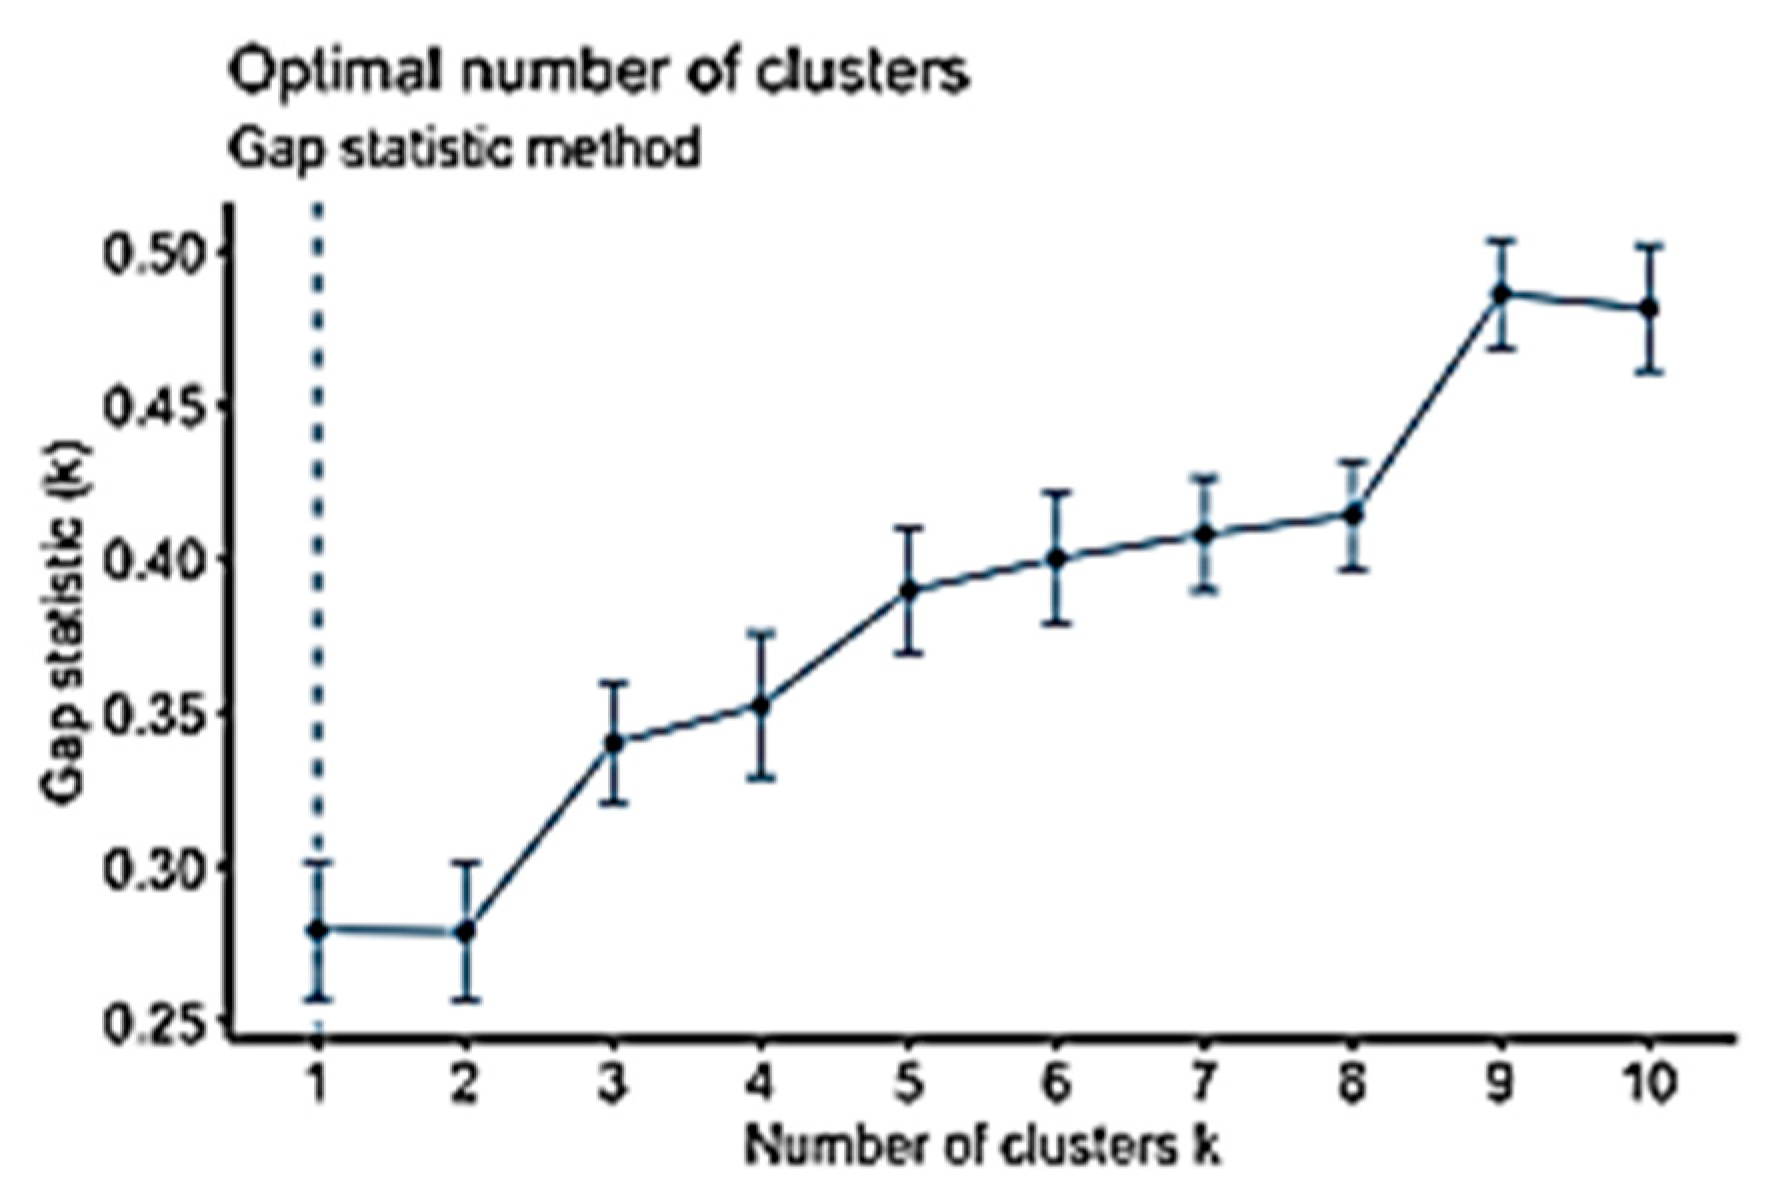
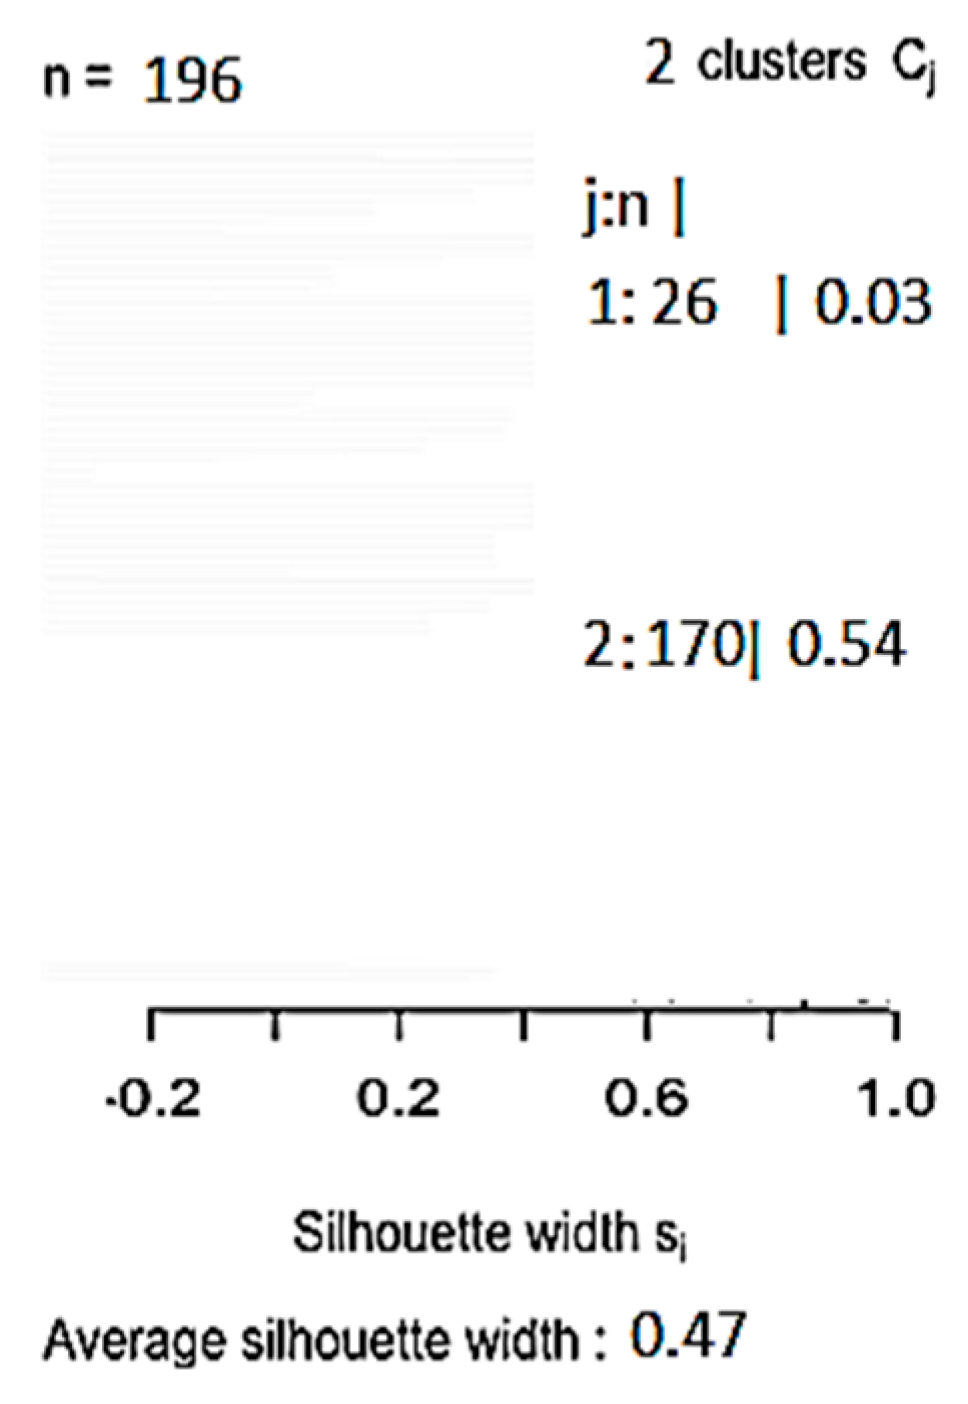
The elbow, silhouette, and gap statistic methods were used to identify the K-values before running the K-means clustering, as discussed in Section 3.2. To analyse the VLE Dataset, the three methods were run to produce three different values: K = 4, 2, and 1, as shown in Figure 12, Figure 13 and Figure 14, respectively. K = 1 was excluded because the initial value of the K-means clustering algorithm started at K = 2. Accordingly, to identify the optimal values for K, the silhouette Coefficient method was used, and it produced two results: 0.47 and 0.34 (Figure 15 and Figure 16, respectively). Therefore, K = 2 was chosen as the optimal value for K. Running the K-means clustering when K = 2 produced two clusters. Interpreting the results of the analysis presents two clusters of students.
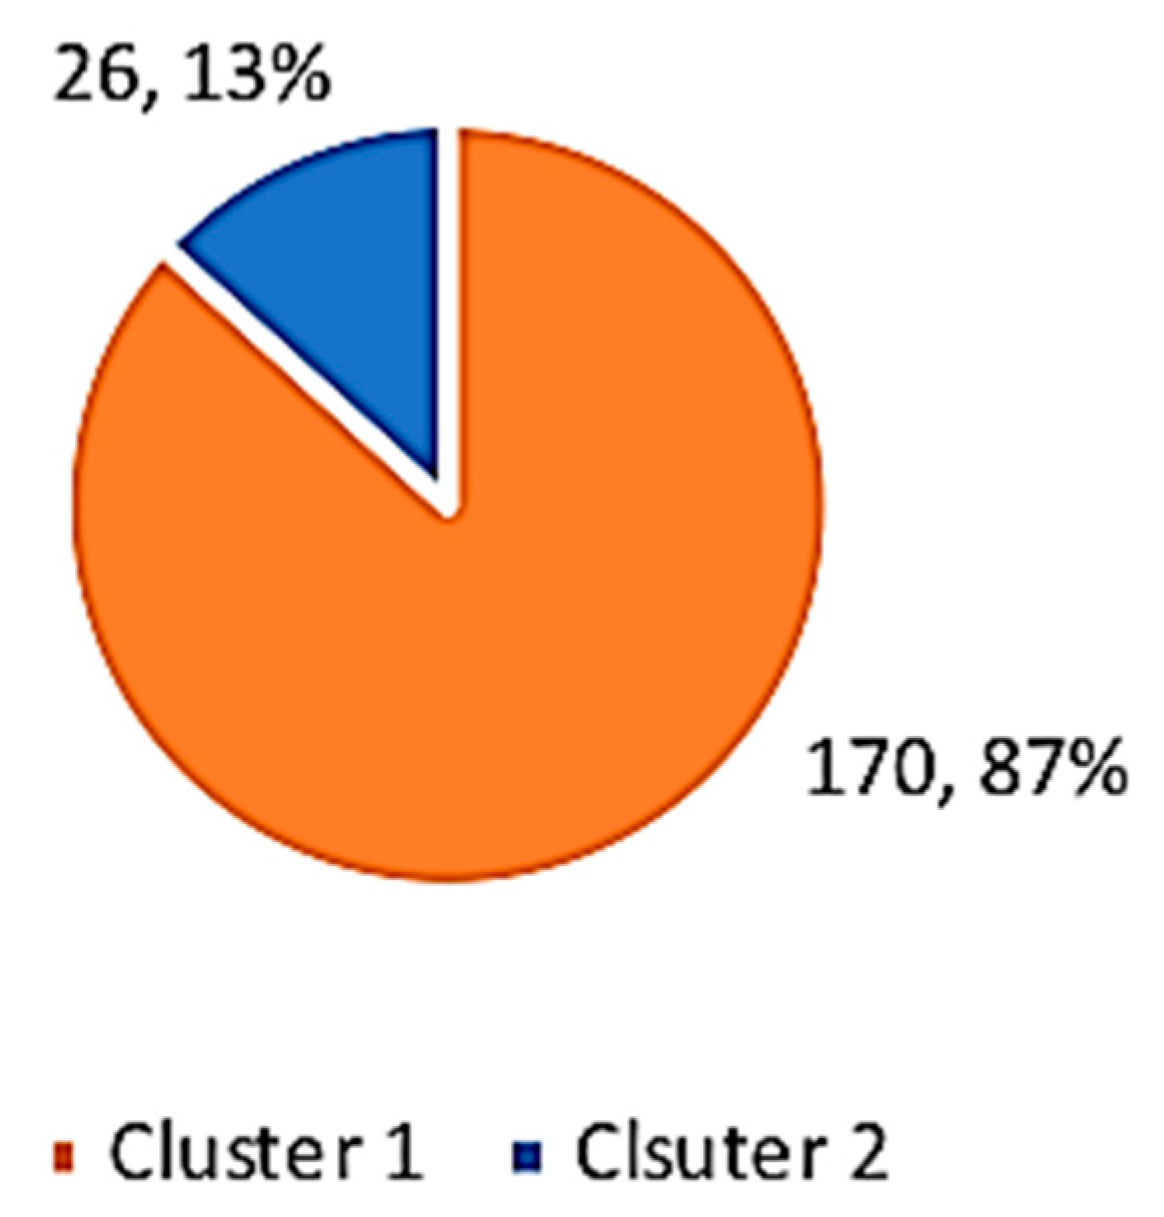
The clustering analysis for the VLE Dataset, which is described in Table 4, produced two clusters. Most students were in Cluster 1 (87%) and a minority were in Cluster 2 (13%) (Figure 17). Cluster 1 is referred to as “less active” students, and Cluster 2 is referred to as “more active” students. Interestingly, most students were less active—they did not spend much time interacting with materials in the VLE. All of the variables in Cluster 1 had mean values less than Cluster 2, except for grade. Students in Cluster 2 spent more hours on course activity (course access), content (content access), collaboration (course user participation), and communication (user form participation), but they had the same median value as the students in Cluster 1. However, the mean grade values for Cluster 1 and Cluster 2 were the same. An interesting finding is that active participation in the VLE, which was found to be an indicator of student engagement [72], did not influence student performance. The two clusters had the same grade results, as represented by the median grade in Table 5. Table 6 shows descriptions of the two clusters that resulted from the second analysis, along with their rules. An interesting finding from the data analysis is that the gap statistic method resulted in K = 1 in both datasets in comparison with other methods, which gave different values (Figure 7 and Figure 14).
4.3. Personas Design and Building
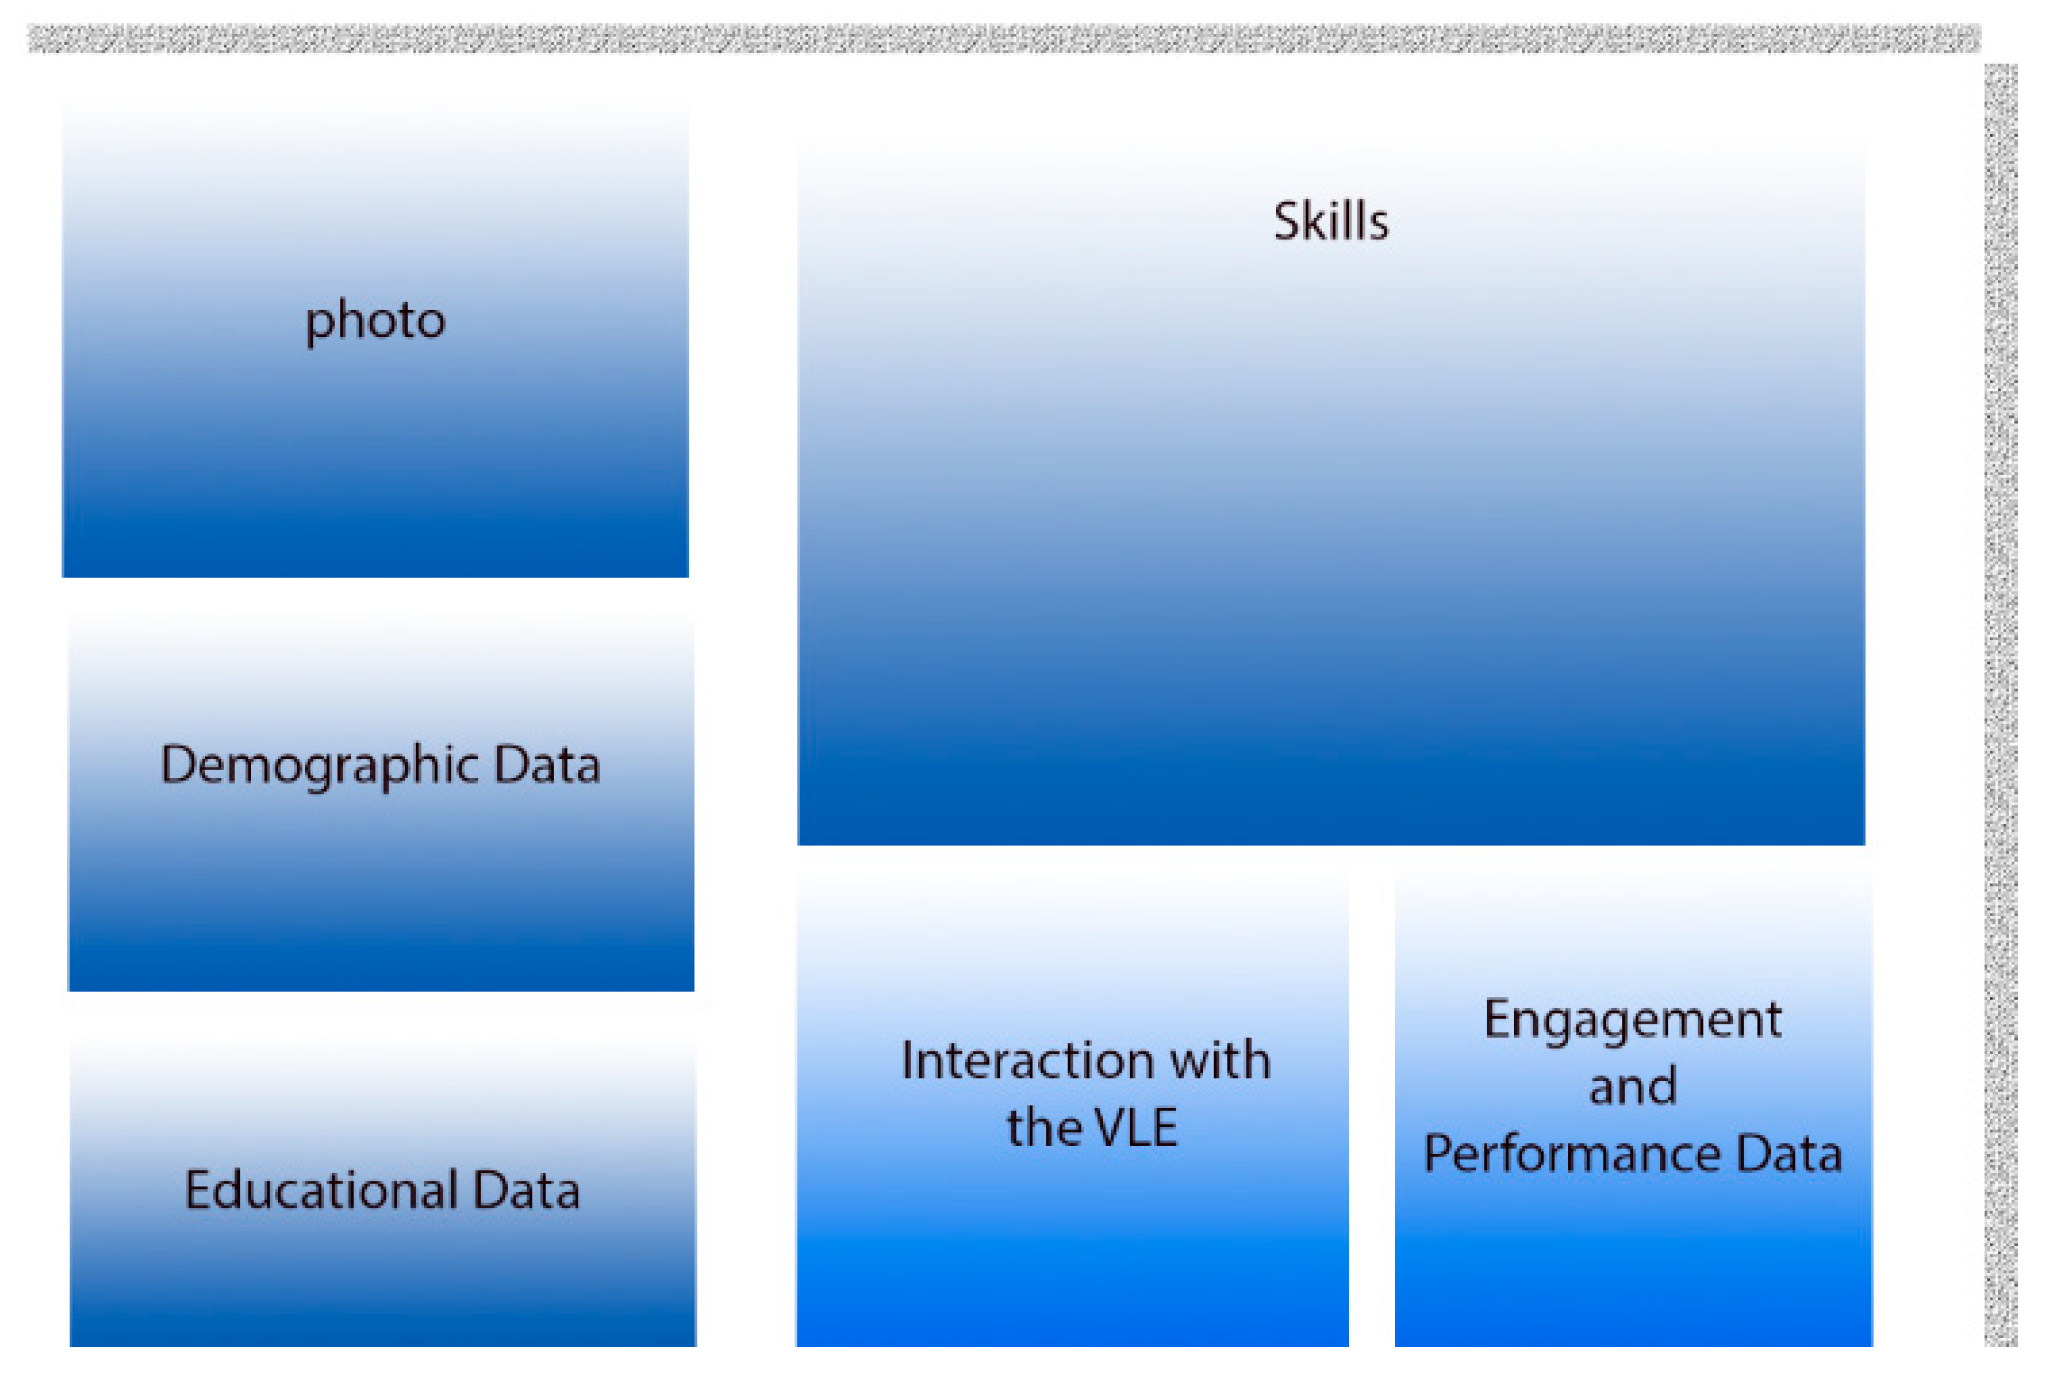
The personas design and building phase is the last phase in the proposed DDPDM (as shown in Figure 4), which focused on the development of the student personas. The persona concept was proposed by [29] as a design process methodology [30]. Personas are not real people but imaginary archetypes of actual users [30]. Persona templates or persona-based designs have been covered in many studies [73,74]. There are different examples of personas, such as company personas [75] and student personas [76,77]. Persona template elements differ based on the reasons behind creating them. Persona templates usually include demographic data [73], such as name [78], age [62,64,68], gender [69], job [78], language [73], place of residence [78], and picture [55,57,61,62]. Furthermore, they can include users’ interests [64,68], activities [79], preferences [78], and attitudes [79]. Moreover, they can cover skills and experience, such as educational level [73] and IT experience. The initial student persona template that was proposed in this study consists of the following categories: demographic data [55,57,61], motivations and interests [57,61], and skills and experience [73]. Further details are outlined below.
Based on the literature review, the proposed university student persona consists of several main components and their elements. They are (1) demographic data, including name, age, gender, and language, (2) educational data, including major, year of study, college name, and university name, and (3) skills.
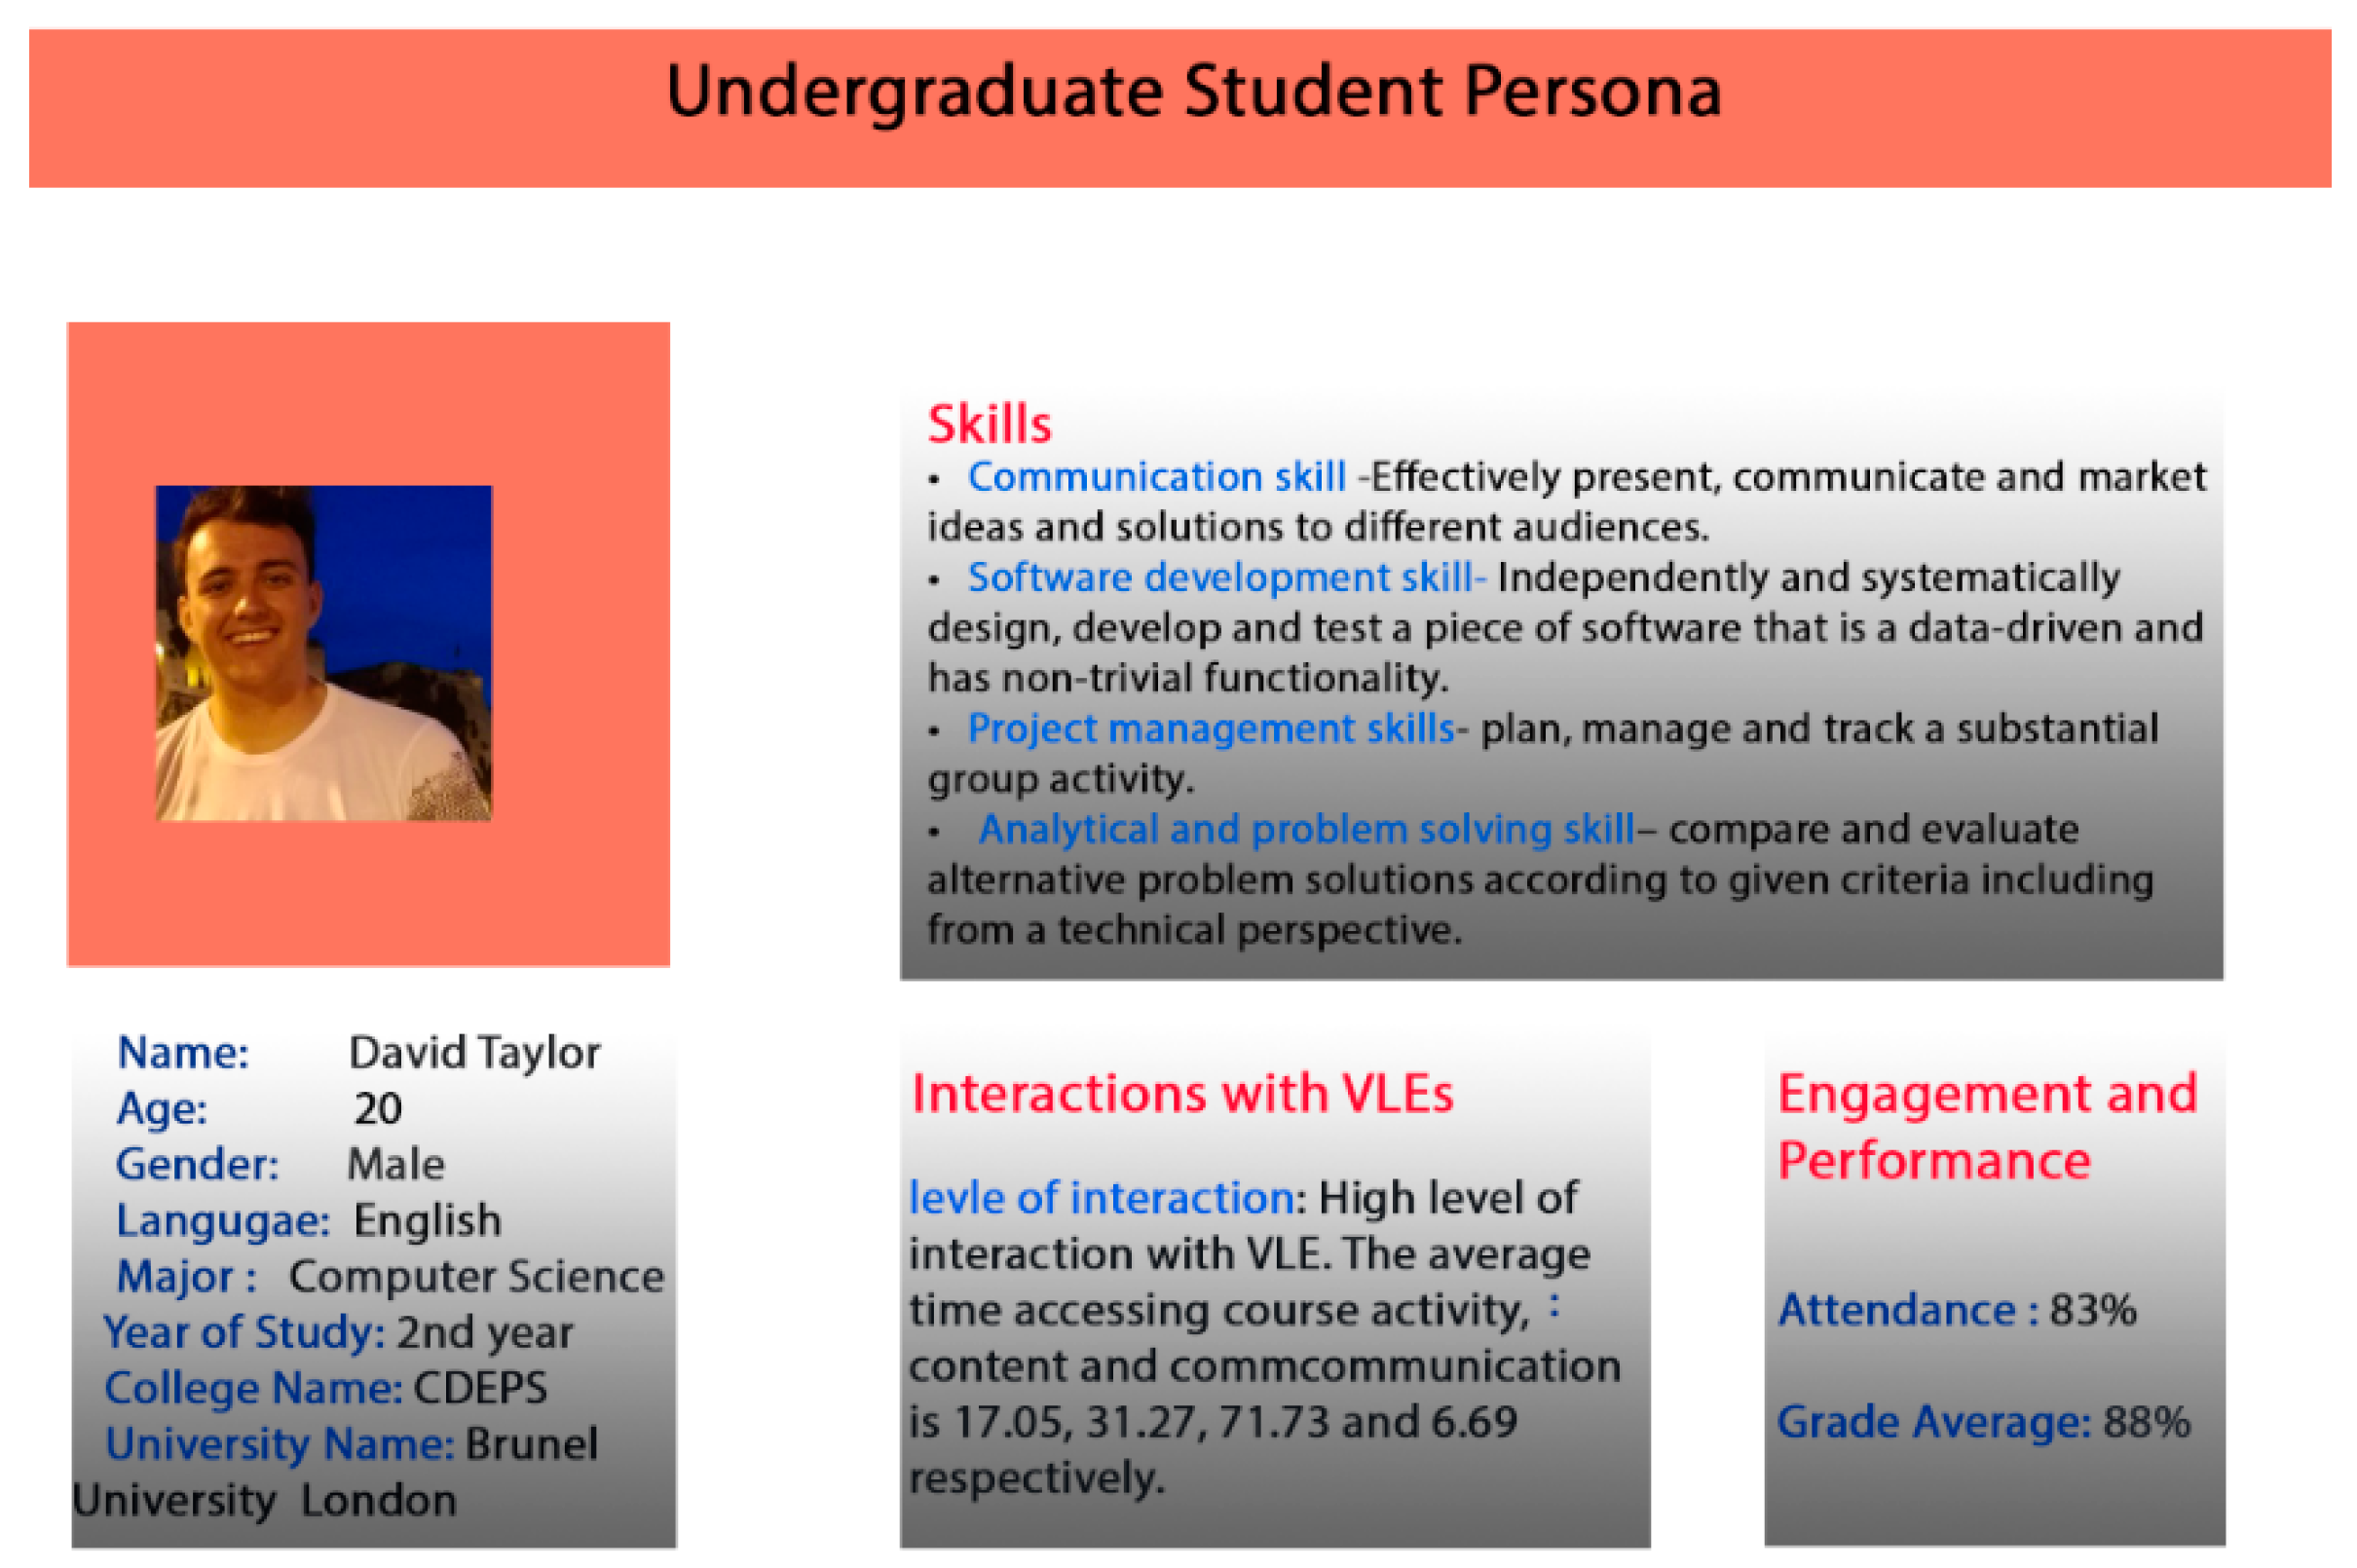
Moreover, the results of the Campus Dataset analysis produced two main attributes that distinguished the groups: attendance, which is an indicator of behavioural engagement and represents the physical engagement, and grade, which represents students’ performance. These two attributes were added to the personas template. Furthermore, the analysis of the VLE Dataset produced another important characteristic: the level of interaction with the VLE (either low or high), represents the Virtual engagement. Skills data are obtained from second-year computer science module outline. This attribute was also added to the personas template. Table 7 shows the list of all the categories in the university student personas template. Personas template for university students and an example university student personas are shown in Figure 18 and Figure 19, respectively.
5. Discussion
As presented in Section 4, the first data analysis produced four personas, based on physical engagement data (attendance) and performance (grade), as shown in Table 3 and Table 4. The second data analysis produced two personas, based on virtual engagement (interactions with VLEs) and performance (grade), as shown in Table 5 and Table 6. Combining the results of the two data analysis processes produced eight personas, as the two datasets were for second-year computer science students at Brunel University and performance was a common attribute in the two datasets, as shown in Table 8.
Based on the discussion above, specific and tangible attributes were selected to build the personas. The attributes that fit the conversational system (chatbots) are highlighted and presented in the following personas example (Figure 19). The next step after identifying the personas template was identifying a typical user and building the personas model for each group to create a persona that represented a real person. Therefore, we needed to calculate the average scores for each cluster. We had already identified the groups and the attributes that distinguished them. We computed the average score for each distinct criterion and chose the record for the student who had the score nearest the average score of the cluster. The user was a typical user, and their data were used to present the persona [22]. The student persona in Figure 19 represents a high virtual and physical engagement and performance student persona. Physical engagement is represented by attendance, while virtual engagement is represented by interactions with VLEs.
Finally, this study set out to validate the personas template; the literature identifies several ways of validating the personas. The method in the study by Nunes, Silva, and Abrantes [77] was chosen due to its realistic way of validating the personas. It involves simply asking experts in the domain about their opinion of the identified persona. In this study, we will ask ten faculty members in the Computer Science Department who teach undergraduate students a few questions. During the discussion, the instructors will confirm whether the attributes that are listed in the proposed personas template are appropriate and whether it is a good representation of the existing computer science students.
The DSR method is conducted in several iterations. The first iteration, personas elicitation, includes designing, building, and evaluating personas by utilising K-means clustering techniques. The outputs of the first iteration are used as inputs in the second iteration, which are persona components, such as age, gender, experience, etc.
The second iteration, a survey and the development of SEFMs, will survey students to identify the factors that affect student engagement, including the persona components. The survey will be designed and built while using the Bristol Online Survey tool and sent to computer science students at Brunel University London by email. SEM will be used to build the SEFMs.
The third iteration, chatbot interaction analysis, will use the inputs from the first two iterations to design, build, and evaluate chatbots that will target several factors of engagement. An experiment will be conducted to measure the effectiveness of using chatbots in enhancing student engagement.
The chatbot development will be done while using Amazon Alexa technology, which contains a client, server, and database. The client will be developed using the JSON programming language; the server side will be developed using the JavaScript programming language. A built-in database, called DynamoDB, will save the interactions between the client and the server. The experiment will be done by installing the Amazon Alexa app on a smartphone or by running the application on an Amazon Alexa Echo device. The experiment will be conducted for second-year computer science students, and pre- and post-tests will be conducted.
6. Conclusions
In conclusion, chatbots are conversational systems that interact with users using text or audio, such as Amazon Alexa, Siri on iPhone, Cortana, and Google Assistant. Chatbots are used in different domains, such as education, health interventions, e-commerce, and entertainment, to name a few. In education, chatbots are used to introduce students to concepts, to enable self-guided learning, and make students interested in certain domains. Using chatbots in education brings many benefits; it supports continuous learning, enhances student motivation, enhances students’ learning and listening skills, and makes learning more enjoyable.
The purpose of this study is to explore how to enhance student engagement in higher education institutions (HEIs) while using a context-based and personas-based conversational system (chatbots). This study uses the DSR method, which was performed in three iterations: personas elicitation, Survey and SEFM, and Chatbots Interaction Analysis. This research paper focuses on the first iteration, personas elicitation, Survey and SEFM, and Chatbots Interaction Analysis. In the first iteration, a DDPDM was proposed to achieve the aim of the first iteration (personas elicitation). Data preparation and data analysis were performed using VBA macros and the R programming language. K-means clustering was the main clustering method that was used in the first iteration. The K-values were identified while using well-known methods: the elbow, silhouette and gap statistic methods. The silhouette coefficient was used to get the optimal value of K. Four popular methods are proposed in the literature to measure the similarity or regularity of the data item: Euclidean distance, Manhattan distance, Chebychev distance, and Minkowski distance. Euclidean distance was chosen because it is a suitable one to the nature of the two datasets.
The first data analysis produced four clusters, namely very low physical engagement and very low performance, high physical engagement and high performance, low physical engagement and high performance, and better physical engagement and low performance. The second data analysis produced two clusters, namely less engaged and more engaged. As the data were collected from second-year computer science students at Brunel University London, and as both datasets had ‘grades’ as a common attribute, the two datasets were combined, which produced eight personas. The undergraduate student persona template was adapted from [49]. Figure 19 presents an example of an undergraduate student persona. Interestingly, the results of the data analysis show that engagement does not always affect student performance. Besides, active participation does not influence student engagement. There might be other factors that affect student engagement. An interesting finding was that the Gap Statistic method that was used to find the k-values produces K = 1 in both datasets, which is a meaningless value, K should be at least equal to 2.
The present iteration makes several noteworthy contributions to the current literature. Initially, it proposed a quantitative DDPDM that mainly uses K-means clustering analysis and three methods to identify the K values: elbow, silhouette, and gap statistic methods. It is an applicable, cheap, and straightforward method when compared to other methods. Moreover, the data analysis produced a university student persona template and eight distinct university student personas. Generally, this paper, alongside the planned future iterations, forms the basis for the development of new forms of pedagogical practices that use VLEs and chatbot technology, either instead of or alongside traditional teaching.
However, there were some limitations to this iteration. Firstly, it used only one variable for measuring the outcome (grades) in the two data analysis processes. In future work, other assessment variables could be assessed, such as the results of individual tests (classroom assessments) [80], assignments/homework [80], and lab test. Another limitation of this iteration was that only attendance and interactions with VLEs were used as indicators of engagement (physical and virtual engagement) in the data analysis. However, researchers could measure other engagement indicators, such as enthusiasm, task completion, willingness and self-reported interest.
Future work will cover the second and third iterations: (1) survey and SEFMs and (2) chatbot interaction analysis. Regarding the second iteration (survey and SEFMs), the objective will be to build SEFMs. The problem awareness step will draw on the results of the first iteration. In the suggestions phase, a literature review will be conducted to identify the factors that affect student engagement. In the development phase, a SEFM will be created and it will only include factors that can be tested while using chatbots. The evaluation phase will consist of the validation of the SEFM while using a semi-structured survey that was sent via email to all computer science students at Brunel University London. The data will be analysed using structural equation modelling to produce the final version of the SEFM, which will be fed into the next iteration.
Furthermore, regarding the third iteration (chatbot interaction analysis), the objective will be to evaluate the effectiveness of using chatbots to enhance student engagement. The problem awareness phase will draw from the results of the SEFM. In the suggestions phase, chatbots will be designed and developed, based on the student personas results and the survey and SEFM results (the first and second iterations, respectively). In the development phase, chatbots will be designed and developed to match the requirements that are proposed in the suggestions phase; the code will be written in JavaScript and will run on Amazon Echo devices (Alexa) and mobile devices. In the evaluation phase, the chatbots will be evaluated in terms of usability and effectiveness in enhancing student engagement while using the System Usability Scale (SUS), evaluated pre-test, and post-test.
The expected future contributions are as follows: (1) the data analysis of the semi-structured survey will be used to produce a SEFM, which will be tested by the chatbots. Students motivations, interest, and experience are examples of the data that will be collected in the second iterations; (2) the chatbot interaction analysis iteration will be the main contribution of this study, developing effective and usable chatbots that will enhance student engagement.
Author Contributions
F.A.A.J.A. drafted the paper and coordinated input from the other authors, and both D.B. and M.A. assisted with drafting and completing all aspects of the paper and contributed to the draft and final submissions.
Funding
This research was funded by the Ministry of Higher Education, Oman and Brunel University London, London, UK.
Acknowledgments
Great thanks to Guy Fitzgerald, Information Systems, Loughborough University, for his generosity in reviewing this paper. Great thanks to Natalie Parnis, Digital Education Advisor in the Digital Education Team in Brunel Educational Excellence Centre at Brunel University London for providing me with documentation that explains the attributes of the VLEs dataset. Great thanks to Gebremariam Assres for reviewing the personas section in this paper.
Conflicts of Interest
The authors declare no conflict of interest.
References
- Axelson, R.D.; Flick, A. Defining Student Engagement. Chang. Mag. High. Learn. 2010, 43, 38–43. [Google Scholar] [CrossRef]
- Bloom, B. Taxonomy of Educational Objectives: the Classification of Educational Goals; D McKay & Co, Inc.: New York, NY, USA, 1965. [Google Scholar]
- Trowler, V. Student engagement literature review. High. Educ. Acad. 2010, 1, 1–15. [Google Scholar]
- Newmann, F. The significance and sources of student engagement. In Student engagement and achievement in American secondary schools; Teachers College Press: New York, NY, USA, 1992; pp. 11–39. ISBN 0807731838. [Google Scholar]
- Martin, J.; Torres, A. What Is Student Engagement And Why Is It Important? 2016. Available online: https://www.nais.org/Articles/Documents/Member/2016%20HSSSE%20Chapter-1.pdf (accessed on 5 May 2019).
- Astin, A.W. Student Involvement: A Development Theory for Higher Education. J. Coll. Stud. Dev. 1984, 25, 297–308. [Google Scholar]
- Parsons, J.; Taylor, L. Improving Student Engagement. Curr. Issues Educ. 2011, 14, 4–33. [Google Scholar]
- Lim, W.N. Improving Student Engagement in Higher Education through Mobile-Based Interactive Teaching Model Using Socrative. In Proceedings of the 2017 IEEE Global Engineering Education Conference (EDUCON), Athens, Greece, 25–28 April 2017; pp. 404–412. [Google Scholar]
- Abu Shawar, B.; Atwell, E. Chatbots: Are they really useful? LDV-Forum Zeitschrift für Comput. Und Sprachtechnologie 2007, 22, 29–49. [Google Scholar]
- Carini, R.M.; Kuh, G.D.; Klein, S.P. Student engagement and student learning: Testing the linkages. Res. High. Educ. 2006, 47, 1–32. [Google Scholar] [CrossRef]
- Abdul-Kader, S.A.; Woods, J. Survey on Chatbot Design Techniques in Speech Conversation Systems. IJACSA) Int. J. Adv. Comput. Sci. Appl. 2015, 6, 72–80. [Google Scholar]
- Weizenbaum, J. ELIZA—A Computer Program For the Study of Natural Language Communication Between Man And Machine. Commun. ACM 1966, 9, 36–45. [Google Scholar] [CrossRef]
- Kerly, A.; Hall, P.; Bull, S. Bringing chatbots into education: Towards natural language negotiation of open learner models. Knowledge-Based Syst. 2007, 20, 177–185. [Google Scholar] [CrossRef]
- Gustavo, L.; Quesada, L.; Guerrero, L.A.; Rica, C.; Jos, S.; Rica, C. Alexa vs. Siri vs. Cortana vs. Google Assistant: A Comparison of Speech-Based Natural User Interfaces Gustavo. In Proceedings of the International Conference on Applied Human Factors and Ergonomics, Los Angeles, CA, USA, 17–21 July 2017; Volume 592. [Google Scholar]
- Al-Zubaide, H.; Issa, A.A. OntBot: Ontology based ChatBot. In Proceedings of the 2011 4th International Symposium on Innovation in Information and Communication Technology, ISIICT’2011, Amman, Jordan, 29 November–1 December 2011; pp. 7–12. [Google Scholar]
- Khanna, A.; Jain, M.; Kumar, T.; Singh, D.; Pandey, B.; Jha, V. Anatomy and Utilities of an Artificial Intelligence Conversational Entity. In Proceedings of the 2015 International Conference on Computational Intelligence and Communication Networks (CICN), Jabalpur, India, 12–14 December 2015; pp. 594–597. [Google Scholar]
- Fryer, L.; Carpenter, R. emerging technologies Bots as language learning tools. Lang. Learn. Technol. 2006, 10, 8–14. [Google Scholar]
- Elmasri, D.; Maeder, A. A Conversational Agent for an Online Mental Health Intervention. In Proceedings of the Brain Informatics and Health, Omaha, NE, USA, 13–16 October 2016; pp. 243–251. [Google Scholar]
- Brandtzaeg, P.B.; Folstad, A. Why People Use Chatbots. Int. Conf. Internet Sci. 2017, 377–392. [Google Scholar] [CrossRef]
- Shaw, A. Using Chatbots to Easily Create Interactive and Intelligent FAQ Webpages. J. Appl. Glob. Res. 2012, 5, 10–15. [Google Scholar]
- McGinn, J.; Kotamraju, N. Data-driven persona development. In Proceedings of the SIGCHI Conference on Human Factors in Computing Systems, Florence, Italy, 5–10 April 2008; pp. 1521–1524. [Google Scholar]
- Tu, N.; Dong, X.; Rau, P.-L.P.; Zhang, T. Using cluster analysis in Persona development. In Proceedings of the 2010 8th International Conference on Supply Chain Management and Information, Hong Kong, China, 6–9 October 2010. [Google Scholar]
- Salminen, J. Persona Perception Scale: Developing and Validating an Instrument for Human-Like Representations of Data. In Proceedings of the Extended Abstracts of the 2018 CHI Conference on Human Factors in Computing Systems, Montréal, QC, Canada, 21–26 April 2018. [Google Scholar]
- Rönkkö, K.; Hellman, M.; Kilander, B. Personas is not applicable: Local remedies interpreted in a wider context. In Proceedings of the Eighth Conference on Participatory Design: Artful Integration: Interweaving Media, Materials and Practices, Toronto, ON, Canada, 27–31 July 2004. [Google Scholar]
- Vredenburg, K.; Mao, J.-Y.; Smith, P.W.; Carey, T. A survey of User-Centered Design Practice. In Proceedings of the SIGCHI Conference on Human Factors in Computing Systems, Minneapolis, MN, USA, 20–25 April 2002; p. 471. [Google Scholar]
- Miaskiewicz, T.; Kozar, K.A. Personas and user-centered design: How can personas benefit product design processes? Des. Stud. 2011, 32, 417–430. [Google Scholar] [CrossRef]
- Gulliksen, J.; Göransson, B.; Boivie, I.; Blomkvist, S.; Persson, J.; Cajander, Å. Key principles for user-centred systems design. Behav. Inf. Technol. 2003, 22, 397–409. [Google Scholar] [CrossRef]
- Dahl, D.W.; Chattopadhyay, A.; Gorn, G.J. The Use of Visual Mental Imagery in New Product Design. J. Mark. Res. 2006, 36, 18. [Google Scholar] [CrossRef]
- Cooper, A. The Inmates are Running the Asylum; Sams Publishing: Carmel, IN, USA, 2004; ISBN 0-672-32614-0. [Google Scholar]
- Friess, E. Personas and decision making in the design process. In Proceedings of the SIGCHI Conference on Human Factors in Computing Systems, Austin, TX, USA, 5–10 May 2012; pp. 1209–1218. [Google Scholar]
- Adlin, T.; Pruitt, J.; Goodwin, K.; Hynes, C.; McGrane, K.; Rosenstein, A.; Muller, M.J. Panel: Putting Personas to Work. In Proceedings of the CHI’06 Extended Abstracts on Human Factors in Computing Systems, Montreal, QC, Canada, 22–27 April 2006; pp. 13–16. [Google Scholar]
- Blooma, J.; Methews, N.; Nelson, L. Proceedings of the 4th International Conference on Information Systems Management and Evaluation; Academic Conferences and Publishing International Limited: Reading, UK, 2013; ISBN 9781909507203. [Google Scholar]
- Blomquist, Å.; Arvola, M. Personas in action: Ethnography in an interaction design team. In Proceedings of the Second Nordic Conference on Human-Computer Interaction, Aarhus, Denmark, 19–23 October 2002; p. 197. [Google Scholar]
- Nielsen, L.; Hansen, K.S.; Stage, J.; Billestrup, J. A template for design personas: Analysis of 47 persona descriptions from Danish industries and organizations. Int. J. Sociotechnology Knowl. Dev. 2015, 7, 45–61. [Google Scholar] [CrossRef]
- Sinha, R. Persona development for information-rich domains. In Proceedings of the CHI’03 Extended Abstracts on Human Factors in Computing Systems, Lauderdale, FL, USA, 05–10 April 2003; pp. 830–831. [Google Scholar]
- Pruitt, J.; Grundin, J. Personas: Practice and Theory. In Proceedings of the 2003 Conference on Designing for User Experiences, San Francisco, CA, USA, 5–7 June 2003; pp. 1–15. [Google Scholar]
- Cabrero, D.G. User-created persona: Namibian rural Otjiherero speakers. In Proceedings of the 33rd Annual International Conference on the Design of Communication, Limerick, Ireland, 16–17 July 2015; p. 28. [Google Scholar]
- Jia, J. CSIEC (Computer Simulator in Educational Communication): An Intelligent Web-Based Teaching System for Foreign Language Learning. In Proceedings of the World Conference on Educational Multimedia, Hypermedia and Telecommunications, Lugano, Switzerland, 21–26 June 2004; pp. 1–8. [Google Scholar]
- Keegan, M.; Boyle, R.D.; Dee, H.M. Turi: Chatbot software for schools in the Turing Centenary Categories and Subject Descriptors. In Proceedings of the 7th Workshop in Primary and Secondary Computing Education, Hamburg, Germany, 8–9 November 2012; pp. 153–154. [Google Scholar]
- Shaw, A. Using chatbots to teach socially intelligent computing principles in introductory computer science courses. In Proceedings of the 2012 Ninth International Conference on Information Technology-New Generations, Las Vegas, NV, USA, 16–18 April 2012; pp. 850–851. [Google Scholar]
- Pereira, J. Leveraging chatbots to improve self-guided learning through conversational quizzes. In Proceedings of the Fourth International Conference on Technological Ecosystems for Enhancing Multiculturality, Salamanca, Spain, 2–4 November 2016; pp. 911–918. [Google Scholar]
- Benotti, L.; Martínez, M.C.; Schapachnik, F. Engaging High School Students Using Chatbots. In Proceedings of the 2014 Conference on Innovation & Technology in Computer Science Education, Uppsala, Sweden, 21–25 June 2014; pp. 63–68. [Google Scholar]
- Departamento de Informacion Universitaria Sıntesis de Informacion Estadısticas Universitarias Argentina 2014–2015. Available online: https://www.google.com.hk/url?sa=t&rct=j&q=&esrc=s&source=web&cd=12&cad=rja&uact=8&ved=2ahUKEwjd5bWsqqzlAhWRdd4KHa6dDWoQFjALegQIAxAB&url=https%3A%2F%2Fwww.slideshare.net%2FEduardoNelsonGerman%2Fsntesis-de-informacin-estadsticas-universitarias-argentina-2014-2015&usg=AOvVaw2nwdseflVnlY66eOkZ_jyT (accessed on 5 May 2019).
- Benotti, L.; Martinez, M.C.; Schapachnik, F. A Tool for Introducing Computer Science with Automatic Formative Assessment. Available online: https://lucianabenotti.weebly.com/uploads/9/7/1/7/9717088/tlt2682084__3_.pdf (accessed on 5 May 2019).
- De Oliveira, F.K.; De Oliveira, M.B.; Gomes, A.S.; Queiros, L.M. RECREIO: Floss as SAAS for sharing of educational resources. In Proceedings of the 12th Iberian Conference on Information Systems and Technologies, Lisbon, Portugal, 14–17 June 2017. [Google Scholar]
- Hevner, A.R.; March, S.T.; Park, J.; Ram, S. Design Science in the Information System Research. MIS Q. Vol. 2004, 28, 725–730. [Google Scholar] [CrossRef]
- Vaishnavi, V.; Kuechler, B. Design Science Research in Information Systems. Assoc. Inf. Syst. 2004, 45. [Google Scholar]
- March, S.S.T.; Smith, G.F.G. Design and natural science research on information technology. Decis. Support Syst. 1995, 15, 251–266. [Google Scholar] [CrossRef]
- Almahri, F.; Bell, D.; Arzoky, M. Augmented education within a physical Space. UK Acad. Inf. Syst. 2019, 1–12. [Google Scholar]
- Kolomvatsos, K.; Anagnostopoulos, C. Reinforcement Learning for Predictive Analytics in Smart Cities. Informatics 2017, 4, 16. [Google Scholar] [CrossRef]
- Foody, G.M.; Mathur, A. The use of small training sets containing mixed pixels for accurate hard image classification: Training on mixed spectral responses for classification by a SVM. Remote Sens. Environ. 2006, 103, 179–189. [Google Scholar] [CrossRef]
- Zhao, Y.; Calvo, R.; Pardo, A.; Gunn, H.; Steinbeck, K. What We Learned from TransitionMate: A: A mobile app designed to support young people with chronic illness. In Proceedings of the Annual Meeting of the Australian Special Interest Group for Computer Human Interaction, Parkville, VIC, Australia, 7–10 December 2015; pp. 162–166. [Google Scholar]
- Wang, J.; Zelenyuk, A.; Imre, D.; Mueller, K. Big Data Management with Incremental K-Means Trees–GPU-Accelerated Construction and Visualization. Informatics 2017, 4, 24. [Google Scholar] [CrossRef]
- Hartigan, J.; Wong, M.A. A K-Means Clustering Algorithm. J. R. Stat. Soc. 2018, 135, 370–384. [Google Scholar]
- Hartigan, J. Clustering Algorithms; Wiley: New York, NY, USA, 1975. [Google Scholar]
- Kodinariya, T.; Makwana, P. Review on determining number of Cluster in K-Means Clustering. Int. J. Adv. Res. Comput. Sci. Manag. Stud. 2013, 1, 90–95. [Google Scholar]
- Singh, A.; Yadav, A.; Rana, A. K-means with Three different Distance Metrics. Int. J. Comput. Appl. 2013, 67, 13–17. [Google Scholar] [CrossRef]
- Perlibakas, V. Distance measures for PCA-based face recognition. Pattern Recognit. Lett. 2004, 25, 711–724. [Google Scholar] [CrossRef]
- Gower, J.C. Properties of educlidean and non-euclidean distance matrices. Linear Algebra Appl. 1985, 97, 81–97. [Google Scholar] [CrossRef]
- Norušis, M.J. Chapter16 Cluster Analysis. In IBM SPSS Statistics 19 Statistical Procedures Companion; Prentice Hall: Upper Saddle River, NJ, USA, 2012; pp. 361–392. ISBN 978-0-321-74842-3. [Google Scholar]
- Syakur, M.A.; Khotimah, B.K.; Rochman, E.M.S.; Satoto, B.D. Integration K-Means Clustering Method and Elbow Method for Identification of the Best Customer Profile Cluster. IOP Conf. Ser. Mater. Sci. Eng. 2018, 336. [Google Scholar] [CrossRef]
- Tibshirani, R.; Walther, G.; Hastie, T. Estimating the number of clusters in a data set via the gap statistic. J. R. Stat. Soc. Ser. B (Statistical Methodol. 2001, 63, 411–423. [Google Scholar] [CrossRef]
- Rousseeuw, P. Silhouettes: A graphical aid to the interpretation and validation of cluster analysis. J. Comput. North-holl. Appl. Math. 1987, 20, 53–65. [Google Scholar] [CrossRef] [Green Version]
- Milligan, G.; Cooper, M. An Examination Of Procedures For Determining The Number Of Clusters In A Data Set. Psychometrika 1985, 50, 159–160. [Google Scholar] [CrossRef]
- Raymond T Ng, J.H. Efficient and Effective Clustering Methods for Spatial Data Mining. In Proceedings of the International Conference on Very Large Data Bases, San Francisco, CA, USA, 12–15 September 1994; pp. 144–155. [Google Scholar]
- Kaufman, L.; Rousseuw, P.J. Finding Groups in Data: An Introduction to Cluster Analysis.; John Wiley & Sons: New York, NY, USA, 1990. [Google Scholar]
- Dobbins, C.; Rawassizadeh, R. Towards Clustering of Mobile and Smartwatch Accelerometer Data for Physical Activity Recognition. Informatics 2018, 5, 29. [Google Scholar] [CrossRef]
- Wirth, R.; Hipp, J. CRISP-DM: Towards a Standard Process Model for Data Mining. In Proceedings of the 4th International Conference on the Practical Applications of Knowledge Discovery and Data Mining, Crowne Plaza, UK, 11–13 April 2000; pp. 29–39. [Google Scholar]
- Nieters, J.; Ivaturi, S.; Ahmed, I. Making Personas Memorable. In Proceedings of the CHI’07 Extended Abstracts on Human Factors in Computing Systems, San Jose, CA, USA, 28 April–May 3 2007; pp. 1817–1823. [Google Scholar]
- Ihaka, R.; Gentleman, R. R: A Language for Data Analysis and Graphics. Comput. Graph. Stat. 2015, 5, 299–314. [Google Scholar]
- Kassambara, A. Determining The Optimal Number Of Clusters: 3 Must Know Methods. Available online: https://www.datanovia.com/en/lessons/determining-the-optimal-number-of-clusters-3-must-know-methods/ (accessed on 14 October 2019).
- Dale, C.; Lane, A. A Wolf in Sheep’s Clothing? An Analysis of Student Engagement with Virtual Learning Environments. J. Hosp. Leis. Sport Tour. Educ. 2007, 6. [Google Scholar] [CrossRef]
- Roussou, M.; Vayanou, M.; Katifori, A.; Rennick-Egglestone, S.; Pujol, L. A Life of Their Own: Museum Visitor Personas Penetrating the Design Lifecycle of a Mobile Experience. In Proceedings of the ACM SIGCHI Conference on Human Factors in Computing Systems, Paris, France, 27 April–2 May 2013; pp. 547–552. [Google Scholar]
- Cahill, J.; McLoughlin, S.; Wetherall, S. The Design of New Technology Supporting Wellbeing, Independence and Social Participation, for Older Adults Domiciled in Residential Homes and/or Assisted Living Communities. Technologies 2018, 6, 18. [Google Scholar] [CrossRef]
- Ali, F.; Stewart, R.; Boks, C.; Bey, N. Exploring “company personas” for informing design for sustainability implementation in companies. Sustainability 2019, 11, 463. [Google Scholar] [CrossRef]
- Nishiuchi, N.; Shiga, A. A Method for Creating Persona Using Bayesian Network Analysis. Innov. Supply Chain Manag. 2015, 9, 69–74. [Google Scholar] [CrossRef]
- Nunes, F.; Silva, P.A.; Abrantes, F. Human-computer interaction and the older adult. In Proceedings of the 3rd International Conference on Pervasive Technologies Related to Assistive Environments, Samos, Greece, 23–25 June 2010. [Google Scholar]
- Hill, C.; Haag, M.; Oleson, A.; Mendez, C.; Marsden, N.; Sarma, A.; Burnett, M. Gender-Inclusiveness Personas vs. Stereotyping: Can We Have it Both Ways? In Proceedings of the 2017 CHI Conference on Human Factors in Computing Systems, Denver, CO, USA, 6–11 May 2017; pp. 6658–6671. [Google Scholar]
- Guo, H.; Razikin, K.B. Anthropological User Research: A Data-Driven Approach to Personas Development. In Proceedings of the Annual Meeting of the Australian Special Interest Group for Computer Human Interaction, Parkville, VIC, Australia, 7–10 December 2015; pp. 417–421. [Google Scholar]
- Bridgeman, B.; Cline, F.; Hessinger, J. Applied Measurement in Education Effect of Extra Time on Verbal and Quantitative GRE Scores. Appl. Meas. Educ. 2010, 25–37. [Google Scholar] [CrossRef]
Figure 1.
Research iterations [49].
Figure 1.
Research iterations [49].

Figure 2.
Identification of elbow point [56].
Figure 2.
Identification of elbow point [56].

Figure 3.
Ambiguity in identifying elbow point [56].
Figure 3.
Ambiguity in identifying elbow point [56].

Figure 4.
Proposed data-driven persona development method (DDPDM), adapted from Dobbins and R. Rawassizadeh [67].
Figure 4.
Proposed data-driven persona development method (DDPDM), adapted from Dobbins and R. Rawassizadeh [67].

Figure 5.
Elbow method.

Figure 6.
Silhouette method.

Figure 7.
Gap statistic method.

Figure 8.
Average silhouette width when K = 4.

Figure 9.
Average silhouette width when K = 9.

Figure 10.
Four clusters of students (first phase of data analysis) [49].
Figure 10.
Four clusters of students (first phase of data analysis) [49].

Figure 11.
The four clusters from the first phase of data analysis [49].
Figure 11.
The four clusters from the first phase of data analysis [49].

Figure 12.
Elbow method.

Figure 13.
Silhouette method.

Figure 14.
Gap statistic method.

Figure 15.
Average silhouette width when K = 4.

Figure 16.
Average silhouette width when K = 2.

Figure 17.
The two clusters from the second phase of data analysis [49].
Figure 17.
The two clusters from the second phase of data analysis [49].

Figure 18.
Personas template for university students adapted from [49].
Figure 18.
Personas template for university students adapted from [49].

Figure 19.
An example of a university student persona.


Table 1.
Attribute descriptions for the Campus Dataset [49].
Table 1.
Attribute descriptions for the Campus Dataset [49].
| Attribute | Description |
|---|---|
| Attendance | Represents the total lab attendance by each student out of 12 labs |
| Grade | Represents the final grade in that module, ranging from 1 to 17, where 1 represents F, and 17 represents A |
Table 2.
Attribute descriptions for the VLE Dataset [49].
Table 2.
Attribute descriptions for the VLE Dataset [49].
| Attribute | Description |
|---|---|
| Course activity | The total amount of course activity in hours the user completed |
| Content | The total amount of time in hours that the user spent accessing content for the course (files, links and videos) |
| Collaboration | The total amount of time in hours that the user spent on collaborative activities |
| Communication | The total amount of time in hours that the user spent engaging in discussion boards/forums |
| Grade | The final student grade in the specific module |
Table 3.
Statistical summary of the first phase of data analysis [49].
Table 3.
Statistical summary of the first phase of data analysis [49].
| Mean | Median | Min | Max | ||
|---|---|---|---|---|---|
| Cluster 1 | Attendance | 4.00 | 4.00 | 0.00 | 8.00 |
| Grade | 3.36 | 3.00 | 1.00 | 6.00 | |
| Cluster 2 | Attendance | 9.97 | 10.00 | 7.00 | 12.00 |
| Grade | 14.80 | 15.00 | 12.00 | 16.00 | |
| Cluster 3 | Attendance | 3.92 | 4.00 | 1.00 | 6.00 |
| Grade | 12.48 | 12.00 | 9.00 | 15.00 | |
| Cluster 4 | Attendance | 7.56 | 7.00 | 5.00 | 12.00 |
| Grade | 10.19 | 9.00 | 6.00 | 12.00 |
Table 4.
The four clusters’ descriptions and rules [49].
Table 4.
The four clusters’ descriptions and rules [49].
| Cluster Number | Cluster Title | Description | Rule |
|---|---|---|---|
| 1 | Very low engagement and very low performance | A positive correlation between student engagement and performance | Attendance around 30%; grade around 17% |
| 2 | High engagement and high performance | Attendance around 83%; grade around 88% | |
| 3 | Low engagement and high performance | A negative correlation between student engagement and performance | Attendance around 30%; grade around 70% |
| 4 | Better engagement and low performance | Attendance around 58%; grade around 52% |
Table 5.
Statistical summary of the second phase of data analysis [49].
Table 5.
Statistical summary of the second phase of data analysis [49].
| Mean | Median | Min | Max | ||
|---|---|---|---|---|---|
| Cluster 1 | Course Activity | 6.11 | 4.96 | 0.39 | 25.62 |
| Content | 10.88 | 10.00 | 1.00 | 31.00 | |
| Collaboration | 16.04 | 13.00 | 1.00 | 55.00 | |
| Communication | 1.43 | 1.00 | 0.00 | 9.00 | |
| Grade | 10.97 | 12.00 | 1.00 | 16.00 | |
| Cluster 2 | Course Activity | 17.05 | 13.32 | 6.25 | 34.55 |
| Content | 31.27 | 32.00 | 8.00 | 53.00 | |
| Collaboration | 71.73 | 42.50 | 13.00 | 682.00 | |
| Communication | 6.69 | 6.00 | 0.00 | 24.00 | |
| Grade | 10.96 | 11.50 | 3.00 | 16.00 |
Table 6.
The two clusters’ descriptions and rules [49].
Table 6.
The two clusters’ descriptions and rules [49].
| Cluster Number | Cluster Title | Description | Rules |
|---|---|---|---|
| 1 | Less active or less engaged | The means of all the variables were two or three times lower than those for Cluster 2, except the grade variable | The means were 6.11, 10.88, 16.04, 1.43 and 10.97 for course activity, content, collaboration, communication and grade, respectively |
| 2 | More active or more engaged | The means of all the variables were two or three times higher than those for Cluster 1, except the grade variable | The means were 17.05, 31.27, 71.73, 6.69 and 10.96 for course activity, content, communication and grade, respectively |
Table 7.
Components of the student personas template adapted from [49].
Table 7.
Components of the student personas template adapted from [49].
| Components of Student Persona Template | |
|---|---|
| Demographic data | Educational data |
| Interaction with the VLEs (virtual engagement) | Engagement (physical engagement) and performance |
| Skills | |
Table 8.
Combining the results of the two data analysis processes produced eight personas.
| Results of the First Data Analysis | Results of the Second Data Analysis | Results of Combining the Results of the Two Data Analysis Processes | Persona Name |
|---|---|---|---|
| Very low physical engagement and very low performance | High virtual engagement |
| • Very low physical engagement and performance and high virtual engagement |
| Low virtual engagement |
| • Very low physical engagement and performance and low virtual engagement | |
| High physical engagement and high performance | High virtual engagement |
| • High virtual and physical engagement and performance |
| Low virtual engagement |
| • Low virtual engagement and high physical engagement and performance | |
| Low physical engagement and high performance | High virtual engagement |
| • High virtual engagement and performance and low physical engagement |
| Low virtual engagement |
| • Low physical and virtual engagement and high performance | |
| Better physical engagement and low performance | High virtual engagement |
| • High virtual engagement, better physical engagement and low performance |
| Low virtual engagement |
| • Low virtual engagement and performance and better physical engagement |
© 2019 by the authors. Licensee MDPI, Basel, Switzerland. This article is an open access article distributed under the terms and conditions of the Creative Commons Attribution (CC BY) license (http://creativecommons.org/licenses/by/4.0/).
Share and Cite
MDPI and ACS Style
Ali Amer Jid Almahri, F.; Bell, D.; Arzoky, M. Personas Design for Conversational Systems in Education. Informatics 2019, 6, 46. https://0-doi-org.brum.beds.ac.uk/10.3390/informatics6040046
AMA Style
Ali Amer Jid Almahri F, Bell D, Arzoky M. Personas Design for Conversational Systems in Education. Informatics. 2019; 6(4):46. https://0-doi-org.brum.beds.ac.uk/10.3390/informatics6040046
Chicago/Turabian StyleAli Amer Jid Almahri, Fatima, David Bell, and Mahir Arzoky. 2019. "Personas Design for Conversational Systems in Education" Informatics 6, no. 4: 46. https://0-doi-org.brum.beds.ac.uk/10.3390/informatics6040046
Note that from the first issue of 2016, this journal uses article numbers instead of page numbers. See further details here.