Multi-Class Imbalance in Text Classification: A Feature Engineering Approach to Detect Cyberbullying in Twitter


1
School of Computer Science and Statistics, Trinity College Dublin, D02 PN40 Dublin, Ireland
2
ADAPT Centre, D02 PN40 Dublin, Ireland
*
Author to whom correspondence should be addressed.
Informatics 2020, 7(4), 52; https://0-doi-org.brum.beds.ac.uk/10.3390/informatics7040052
Submission received: 30 September 2020
/
Revised: 12 November 2020
/
Accepted: 13 November 2020
/
Published: 15 November 2020
Abstract
:Twitter enables millions of active users to send and read concise messages on the internet every day. Yet some people use Twitter to propagate violent and threatening messages resulting in cyberbullying. Previous research has focused on whether cyberbullying behavior exists or not in a tweet (binary classification). In this research, we developed a model for detecting the severity of cyberbullying in a tweet. The developed model is a feature-based model that uses features from the content of a tweet, to develop a machine learning classifier for classifying the tweets as non-cyberbullied, and low, medium, or high-level cyberbullied tweets. In this study, we introduced pointwise semantic orientation as a new input feature along with utilizing predicted features (gender, age, and personality type) and Twitter API features. Results from experiments with our proposed framework in a multi-class setting are promising both with respect to Kappa (84%), classifier accuracy (93%), and F-measure (92%) metric. Overall, 40% of the classifiers increased performance in comparison with baseline approaches. Our analysis shows that features with the highest odd ratio: for detecting low-level severity include: age group between 19–22 years and users with <1 year of Twitter account activation; for medium-level severity: neuroticism, age group between 23–29 years, and being a Twitter user between one to two years; and for high-level severity: neuroticism and extraversion, and the number of times tweet has been favorited by other users. We believe that this research using a multi-class classification approach provides a step forward in identifying severity at different levels (low, medium, high) when the content of a tweet is classified as cyberbullied. Lastly, the current study only focused on the Twitter platform; other social network platforms can be investigated using the same approach to detect cyberbullying severity patterns.
1. Introduction
Cyberbullying is a conscious and persistent act of violence that aims to threaten or harm individuals, deliberately and repeatedly using communication and information technologies. According to statistical data (http://www.bullyingstatistics.org/category/bullying-statistics), more than half of adolescents have been involved in or have witnessed cyberbullying, whilst 10% to 20% witness it every day. The emergence and increased use of the internet, especially Twitter and Facebook, have exacerbated this situation [1]. Only a few years ago, when internet use was still in its infancy, cyberbullying was not considered seriously. However, as its prevalence and impact exceed epidemic thresholds, this activity can no longer be overlooked [2]. Studies have revealed that the knock-on effects of cyberbullying can be potentially destructive including learning disabilities, psychological distress and loneliness, worsened physical confrontations, and suicide [3,4,5]. To mitigate against such harmful effects of cyberbullying, different preventive and intervention approaches have been proposed including machine learning-based automated cyberbullying detection [6]. Cyberbullying detection is made practicable by looking into the content available on social media. A machine learning approach can be applied to implement binary or multiclass classifications. A binary classifier classifies the content as bullying and non-bullying. A multi-class classifier classifies the data in multiple categories [7,8,9]. Nevertheless, several factors are involved in developing a successful machine learning method to detect cyberbullying behavior. The most significant of these factors are the features used. It is acknowledged as a challenging task to select the best features with a strong discriminative power between cyberbullying and non-cyberbullying tweets [10]. However, cyberbullying takes various forms, such as circulating filthy rumors based on racism, gender, disability, religion, sexuality, humiliating a person, social exclusion, stalking, threatening someone online, and displaying personal information about an individual that was shared in confidence [11].
The study presented in this article is the first, we believe, to incorporate the level of cyberbullying severity using multi-class classification into an automatic cyberbullying detection model. Based on the literature and empirical evidence, we hypothesize that the incorporation of multi-class classification results in a more effective cyberbullying detection model, in contrast to a binary classification. Furthermore, our study distinguishes itself from [12,13] by using multi-class classification with highly skewed class imbalance distribution in the dataset, as well as by providing a systematic framework for identifying cyberbullying severity levels.
In order to perform our multi-class classifier study, we categorized the annotated cyberbullied tweets into four levels; low, medium, high, and non-cyberbullying. Based on the classification, sexual and appearance-related tweets were classified as high-level cyberbullying severity; political and racial tweets as medium level; intelligence tweets as low-level cyberbullying severity, and non-cyberbullying tweets.
Significance of Research
Deleterious online harassment or cyberbullying behaviors have become a severe issue that damages the life of people on a large scale. The anti-harassment policy and standards supplied by social platforms and the power to flag and block or report the bully are useful steps towards a safer online community, but they are not enough. Popular social media platforms such as Twitter, Facebook, and Instagram or others receive an enormous number of such flagged text content every day. However, scrutinizing the immense volume of reported content is very time-consuming and not practical and effective. To address this, it would be significantly helpful to design automated, data-driven methods for evaluating and detecting such harmful behaviors in Online Social Networks (OSN). Successful cyberbullying detection would enable early identification of damaging and threatening scenarios and control such incidents as they are happening.
Cyberbullying in OSNs produce deep effects on victims, mostly in cases where sensitive topics are involved. These topics are perceived as less and more severe based on victims’ experience in social and psychological disciplines. In this study, we are proposing the identification of the severity level of these sensitive topics in OSN and an effective method to detect the severity of cyberbullying based on these topics. Allocating the severity level of sensitive topics by stakeholders will allow the type, prevalence, and severity of cyberbullying to be analyzed. We envisage stakeholders here to include: parents, caretakers, educational institutions, and organizations, such as crime-prevention foundations, policymakers, psychiatric associations, social chamber organizations, and enforcement bodies.
In this study, we strive to enhance automated cyberbullying detection, which is the main step towards automated systems for analyzing contemporary social online behaviors that can negatively impact mental health.
The article is structured as follows: Section 2 discusses background details on cyberbullying, followed by an explanation of the different features used in the study. Section 3 presents the research methodology, including the data collection, detection mechanisms, and evaluations, followed by the results and discussion in Section 4. Conclusions are presented in Section 5. Finally, the article ends by outlining the contributions and limitations of the study in Section 6.
2. Background—Features Engineering and Machine Learning
Facebook, Twitter, YouTube, Instagram, and Ask.fm are ranked the top five networks where the highest number of users’ experience cyberbullying. Different social media platforms concentrate on specific data types. For instance, Twitter allows a user post comments known as tweets; photos are posted on Instagram; whereas Facebook offers users the ability to post text, images, and videos [14]. Twitter enables millions of active users to send and read concise informative messages on a website every day. However, some people use Twitter to propagate violent and threatening messages. In addition, cyberbullying is steadily increasing, partly due to the accelerated growth rate of online communications platforms, especially among young people. As a consequence, Twitter has been characterized as a highly utilized platform for cyberbullying [15]. However, the development of efficient and effective methods for detection of online phenomena on Twitter is particularly difficult due to: (i) informal language and short text of a tweet; (ii) provision of fairly limited context in each tweet (iii) prevalence of bots or spam accounts.
Despite these difficulties, in our current research, we aim to utilize useful features in tweets to improve the performance of automatic cyberbullying detection. Twitter features such as tweet counts, user mentions, and the number of friends-followers have been considered to improve cyberbullying detection [16,17,18]. Various studies have frequently used text-based methods and employed contextual, sentiment, and user-based features [12,19]. In addition, some researchers have reported improved cyberbullying detection using content features, user time, the persistence of activities, and person profiles [6,16,20]. Based on the findings of these studies, our approach integrates some of these features as the baseline model for detecting cyberbullying severity on Twitter.
2.1. Feature Engineering
As outlined above, amongst the most common approaches for improving cyberbullying detection is feature engineering. We define the selected features as follows: network-based, activity, content, user, personality, and our manually created master feature, namely, Pointwise Mutual Information-Semantic Orientation (PMI-SO). As far as we know, no previous research has incorporated the semantic orientation of each word in tweets as an input feature. The proposed features are discussed in more detail in the following sub-sections.
2.1.1. Network-Based Features
Given the immense popularity of social media, including its role as a primary source of data for cyberbullying detection studies, it is no wonder that network data such as the number of friends, and followers, uploads, likes, and so on are increasingly being used as features in detection systems [21]. Moreover, these features have been proven to be efficient in identifying cyberbullying behaviors in Online Social Networks—OSN [16,17,22]. According to [17], network-based attributes are the most important features to identify aggressive or cyberbullying behaviors.
2.1.2. Activity Features
Features in this category include the number of tweets a user has posted, the age of a user’s account (i.e., number of days since it is created), favored tweets, URLs, hashtags, and mentioned users (i.e., @_username) [17]. Galán-García et al. (2014) have proposed features based on tweeted text, posting time, language, and location of a user to improve the identification of the user. The authors state that these features help to identify and categorize the users as they have certain behaviors which can be extrapolated evaluating these features [23]. For our study, we grouped tweet time into four groups; midnight, morning, afternoon, and night.
2.1.3. User Features
Limited cyberbullying research has used either social or an individual user’s features. There are two main reasons for this. Firstly, there is little information available to researchers about the gender, age, social class, race, geographical location, etc. of a user. Secondly, many websites do not provide open access to the users’ profile data in order to secure user information (e.g., age and gender) from public exploitation. For example, to prevent the data of their users from being misused for entertainment purposes [24]. However, advancements in natural language processing (NLP) technologies have allowed researchers to predict a user’s age and gender in several text styles by reviewing the difference in language characteristics automatically [25]. Hosseini and Tammimy (2016) also predicted age and gender in social networks using text analysis and NLP on a user’s messages [26]. Many researchers have concentrated on parts of speech in text content, showing that females typically use more singular pronouns and verbs while males use articles and nouns frequently. Dadvar et al., (2012) determined that the overall accuracy of the cyberbullying detection model was improved using gender-based information as a feature [20]. A survey involving multiple scholars in the field of cyberbullying have proposed to include gender as a feature to develop effective machine learning models [27]. A few studies have examined the relation between gender and cyberbullying behaviors and found that females are less likely to be involved in cyberbullying behaviors than males [28,29], but others however have found contrary results [30,31,32]. With respect to predicting age using NLP, it has been found that adults use more plural pronouns and future tense verbs in comparison to young people [33,34]. Though cyberbullying victims do not all belong to a particular age range, Slonje and Smith (2008) has observed that the highest cyberbullying behavior is among teenagers, and in contrast, the chances of cyberbullying behavior decrease as age increases [35].
In order to generate predicted gender features, we used an open vocabulary provided by [34] for 100 most common words used by male/female. We also used labeled dataset to predict whether a user was a male or a female based on the name reported in their username or tweet [36]. Similarly, the predicted age feature was generated by using 100 most common words used in social media that were positively or negatively correlated with each age level [34], specifically, age group 1: 13–18 years; age group 2: 19–22 years; age group 3: 23–29 years; and age group 4: 30 and above.
2.1.4. Content-Based Features
Since cyberbullying texts are frequently offensive and disrespectful in nature, it is not shocking that profanity is the most widely used content-based feature in the text as a predictor of cyberbullying [21]. Huang et al., (2014) found that the detection of cyberbullying can be significantly improved in OSN by integrating the content features together with social network features such as network, activity, and user features [1].
2.1.5. Personality Features
Social networking sites remain a valuable source of textual data as people express their thoughts, moods, and views creating a rich and insightful set of personal data that represents many real-life elements, including personality. Thus, the proliferation of these sites over the last decade makes the text a prime candidate for identifying the personality of a user [37]. Personality is a typical collection of behaviors which distinguishes one person from another. The use of social media content for personality interpretation has been reported by [38]. Studies have shown that a user’s personality can be projected automatically from their communication style [6]. Moreover, researchers have identified connections between the Big Five personality characteristics and cyberbullying [39]. The Big Five personality traits include extraversion (talkative, assertive, social, active), neuroticism (emotionally unstable, anxious, psychopathic, insecure), agreeableness (good-natured, friendly, forgiving, tolerant), conscientiousness (careful, diligent, organized,) and openness to experience (imaginative, curious, artistic, creative) [39,40]. Research using the Big Five traits found a negative association of agreeableness and conscientiousness with cyberbullying while, a positive correlation of extraversion and neuroticism [40,41]. Various studies have examined social network data, involving Facebook posts, tweets, and text messages, to find an association between the Big Five and other characteristics with language [6,42,43,44].
To predict the personality type of the user in our dataset, we used 100 most common words used in social media provided by [34], which are positively or negatively correlated with each of the personality types (agreeableness, conscientiousness, extraversion, openness, and neuroticism).
2.1.6. Master Feature (PMI-SO)
We applied the document-level classification and measured the semantic orientation of each word in the corpus. Phrases were extracted using the parts of speech (POS) tags. Once phrases have been extracted from the dataset, their semantic orientation in terms of either cyberbullying or non-cyberbullying was then determined. This feature generation process is further discussed in Section 3.4.1.
2.1.7. Features Summary
In summary, the list of complete features used to build classifiers in our research is network features (i.e., number of following, followers, friends), activity features (i.e., the tweet time, user since a number of times tweet favored), content features (profane words), user features (i.e., POS, age, gender), personality types (i.e., extraversion, neuroticism), and pointwise semantic orientation of each word and phrases (PMI-SO).
2.2. Machine Learning
Machine learning is described as a computer’s ability to teach itself how to make a decision based on data and experiences available. Machine learning techniques help identify language practices of users and hence can generate a model to detect cyberbullying behavior [45,46]. Machine learning-based automated cyberbullying detection comprises two parts: Representation Learning of Web Messages and Classification. First of all, each web message is processed into a fixed-length vector representation and the classifier is then trained on a testing corpus. The trained classifier will detect the presence of cyberbullying material in each new message [47].
Choosing the best classifier is the most important step of a text classification architecture. We cannot efficiently determine the most effective model for a text classification implementation without a full conceptual comprehension of each algorithm. In our approach, the features (given in Section 2.1.7) obtained from tweets were used to build a model to detect cyberbullying behaviors and its severity on Twitter messages. In order to select the best classifier, we tested several machine learning algorithms namely: Naïve Bayes (NB), Support Vector Machine (SVM), Decision Tree (DT), Random Forest (RF), and K-Nearest Neighbors (KNN).
3. Material and Methods
This section briefly discusses the methodology that we followed for detecting the severity of cyberbullying. All steps of our methodology are presented in Figure 1 and discussed in subsequent sub-sections.
3.1. Data Input Step
3.1.1. Data Accessibility, Collection, and Annotation
The Twitter platform allows researchers to extract public tweets. Every tweet is extracted through Twitter’s application program interface (API) and contains comprehensive information [48], including user ID, username, short biography, account creation date, tweet text (containing information about emotions, thoughts, behaviors, and other personally salient information) [49], tweet creation time, tweet’s unique ID, tweet language, the total number of tweets of a user, number of favorites, number of followers, number of mentions, number of following, number of retweets, latitude, and longitude (geo-location), and information about the application that sent a tweet (e.g., iOS, Android). Using this information unique features have been developed from Twitter data to classify various applications [47,50,51,52,53,54,55]. We utilize some of this information to develop the machine learning model to detect cyberbullying severity levels: low, medium, high, or none.
We applied geo-tagged filtering in our data collection process [16,48] to minimize potential bias in sampling size in our dataset [48,56,57], and chose the USA (https://0-www-statista-com.brum.beds.ac.uk/statistics/242606/number-of-active-twitter-users-in-selected-countries/) as the country, based on the highest number of active users. More precisely we selected the state of Texas in the USA. Our dataset contained approximately 2.2 million tweets based on a lexicon provided by [58] related to the five topics: sexuality, racism, physical-appearance, intelligence, and politics. Tweets were collected between November 2019 and December 2019 according to Twitter’s privacy policies (https://developer.twitter.com/en/developer-terms/agreement-and-policy.html).
3.1.2. Manual Data Annotation
The principle purpose of an efficient cyberbullying detection system in an OSN is to stop or at least reduce harassment and bullying incidents [59]. These detection systems can be used as tools to help and facilitate the monitoring of such online environments. Cyberbullying detection can be used to support and advise the victim, as well as monitoring and tracking the bully [60].
We randomly selected 14,495 tweets from our collected data (2.2 million tweets) for the manual labeling process, similar to the approach applied in [16,61]. The participants (labelers) of the study labeled these tweets according to the following labels: low, medium, high, or non-cyberbullying.
Tweets were labeled by three postgraduate students with research background in multi-disciplinary fields. To begin, participants in the study were trained in twitter content and indications of the presence of cyberbullying behavior in tweets. For example, the participants were trained on the abbreviations, slang words, and acronyms commonly used in social networks. The participants were then instructed to label whether a tweet contained cyberbullying behavior or not. If a tweet contained cyberbullying behavior, then participants were asked to label how severe that cyberbullying was, based on their opinion (low, medium, high).
Moreover, we adopted a voting scheme [16] to determine whether or not a tweet involved cyberbullying and if so its severity level. A tweet was considered as cyberbullying if at least two of the assigned labelers considered the tweet as cyberbullying. Similarly, a voting scheme approach was applied to determine whether agreement on the severity level could be achieved. The tweet was discarded if there were no agreements among labelers.
After the manual annotation, the final dataset contained 11,904 tweets classified in the following way: low (404), medium (590), high (443), and non-cyberbullying (10,467).
3.2. Pre-Processing Step
Tweets were converted to lower case to avoid any sparsity issue, reduced repeated letters, standardized URLs, and @usermention to remove noise in the tweets. In the Bag of Words approach, tokenization was applied with a Twitter-specific tokenizer based on the CMU TweetNLP library [62] and only words with a minimum frequency of 10 were kept.
3.3. Feature Extraction Step
All tweets were represented in a Bag-of-Words (BoW), Word to vector (Word2Vec), and in our manually engineered vector-based text representation. We applied POS tagging with a Twitter-specific tagger based on the CMU TweetNLP library [62] for word sense disambiguation. The POS tagger assigns a part-of-speech tag to each word of the given text in the form of tuples (word, tag), for instance, noun, verb, adjectives, etc.
3.4. Feature Generation Step
3.4.1. Pointwise Mutual Information
We applied the document-level classification and measured the semantic orientation of each word in the corpus. In document-level classification, phrases were extracted using the POS tags. Once phrases have been extracted from the dataset, then their semantic orientation in terms of either cyberbullying or non-cyberbullying was determined. In order to achieve this goal, the concept of pointwise mutual information (PMI) [63] was used to calculate the semantic orientation for each word in a corpus of tweets. The PMI between two words, word1 and word2, is defined as follows:
This technique has already been applied in classification tasks to improve the classifier performance in: sentiment analysis [64,65,66], opinion mining [67], text detection [68,69,70], image detection, object detection [71,72], and bioinformatics [73].
In our study, the score was calculated by subtracting the PMI of the target word with a cyberbullying class from the PMI of the target word with a non-cyberbullying class. This method was well suited for the domain-specific lexicon generation with a PMI score [63]. Based on this, we created our domain-specific lexicon with PMI-SO for each word and phrase by using Turney’s technique.
Turney’s method provides a representative lexicon-based technique consisting of three steps. First, phrases are extracted from the dataset. Second, sentiment polarity is estimated by using PMI-SO of each extracted phrase, which measures statistical dependency between two terms. Lastly, the polarity of all phrases in the dataset is averaged out as its sentiment polarity. Turney’s PMI technique does not depend on hard-coded semantic rules, so users may readily apply the technique into different contexts [74].
3.5. Feature Engineering
Feature engineering is the process of generating or deriving features from raw data or corpus. The creation of additional features inferring from existing features is known as feature engineering [75]. It is not the number of features, but the quality of the features that are fed into a machine learning algorithm that directly affects the outcome of the model prediction [76].
One of the most common approaches to improve cyberbullying detection is to perform feature engineering, and the most common features that improve the quality of cyberbullying detection classifier performance are: textual, social, user, sentiment, word embeddings features [24].
We take an approach where sexual and appearance-related tweets are classified as high-level cyberbullying severity; political and racial tweets as medium level; intelligence tweets as low-level cyberbullying severity, and non-cyberbullying tweets [77]. This approach is inspired by the research of the Pew Research Centre (https://www.pewresearch.org/) that reported sexual harassment as the most severe category of cyberbullying, and intelligence category cyberbullying context (e.g., name-calling or embarrassment) as less severe. Intelligence is considered less severe because it is a layer of annoyance so common that those who see or experience it say they often ignore it [78].
3.6. Class Imbalance Distribution
Many practical classification problems are imbalanced. Class imbalance refers to a scenario where the number of instances from one or more class(es) is considerably greater than that of another class [79]. In such cases, standard classifiers tend to be overwhelmed by the large classes and ignore the small ones. It usually produces a biased classifier that has higher predictive accuracy over majority classes, but poorer predictive accuracy over minority class as most machine learning algorithms work best when there are an approximately equal number of instances in each class.
To address this issue, previous research has categorized key solutions into three different approaches [80,81]. In the first, data level approaches, the goal is to resample the data space by rebalancing the class distribution. One way of solving the imbalanced class in this approach is to modify the class distributions in the training data by oversampling the minority class or under-sampling the majority class. This method is known as SMOTE (Synthetic Minority Over-sampling Technique) [82]. In the second, algorithm level approaches, solutions attempt to adapt existing classifier learning algorithms to improve learning with respect to the limited class. In the third, cost-sensitive learning approaches, data-level and algorithmic approaches are combined by imposing a higher cost on misclassification of examples from the minority class.
Our dataset turned had an imbalanced multi-class distribution (as shown in Figure 2), that is, cyberbullying tweets with high severity class distribution were 4%, medium 5%, low 3%, and non-cyberbullying class distribution having 88%. Accordingly, in our study, we decided to employ the SMOTE technique by oversampling the minority classes (low, medium, high) by 300% combined with the weighted cost to misclassification for minority classes.
3.7. Feature Analysis
The objective of feature selection is threefold: improving the performance of the data mining model, providing a faster more cost-effective learning process, and providing a better understanding of the underlying process that generates the data. Many applications are characterized by various dimensional data, where not all the features are important. Therefore, three feature selection techniques were used in the algorithm training process, namely: Chi-square, Information gain, and Pearson correlation. Various features were selected in combination with different algorithm settings to determine the most significant features that would improve the performance of the classifier.
3.8. Machine Learning Algorithms
Choosing the best classifier is the most significant phase of the text classification pipeline. We cannot efficiently determine the most effective model for a text classification implementation without a full conceptual comprehension of each algorithm.
The features (outlined in Section 2.1.7.) obtained from the tweets have been used to build a model to detect cyberbullying severity. In order to select the best classifier, we tested several machine learning algorithms namely: NB, SVM with RBF kernel, DT, RF, and KNN.
We exclude in this article experiments with results that showed poor performance. The rationale for focusing on the best results is to enable easier cross-comparison among each layer of features that add value to the classifier performance. All experiments were performed under a 10-fold cross-validation scheme to assess the validity and robustness of the models.
3.9. Performance Evaluation
Since our dataset contains imbalanced data for each multiclass and our classification tasks are sensitive for all classes, we selected Kappa statistics as our main performance evaluator along with weighted F-Measure and Accuracy.
Kappa statistic was originally introduced in the field of psychology as a measure of agreement between two judges by J. A. Cohen [83], and later it has been used in the literature as a performance measure in classification [84,85]. The Kappa statistic is used to measure the agreement between predicted and observed categorizations of a dataset while correcting for an agreement that occurs by chance. It is essentially just a normalized version of the percentage of correct classifications (classification accuracy), where normalization is performed with respect to the performance of a random classifier. It shows, at a glance, how much a classifier improves on a random one. Kappa is always equal to or less than 1. Values closer to 1 indicate that a classifier is effective, and values closer to 0 indicate the classifier is ineffective. There is no standardized way to interpret its values, but [86] provides a way to characterize kappa value as: value < 0.00 is poor performance, a value between 0.00 and 0.20 is slight performance, a value between 0.21 and 0.40 is fair performance, a value between 0.41 and 0.60 is moderate performance, a value between 0.61 and 0.80 is substantial performance, a value between 0.81 and 1.00 is an almost perfect performance.
4. Results and Discussion
The classifiers for the model were implemented using WEKA [87] version 3.8 and AffectiveTweet package [88].
4.1. Results Achieved with Bag of Words (BoW) (Baseline 1)
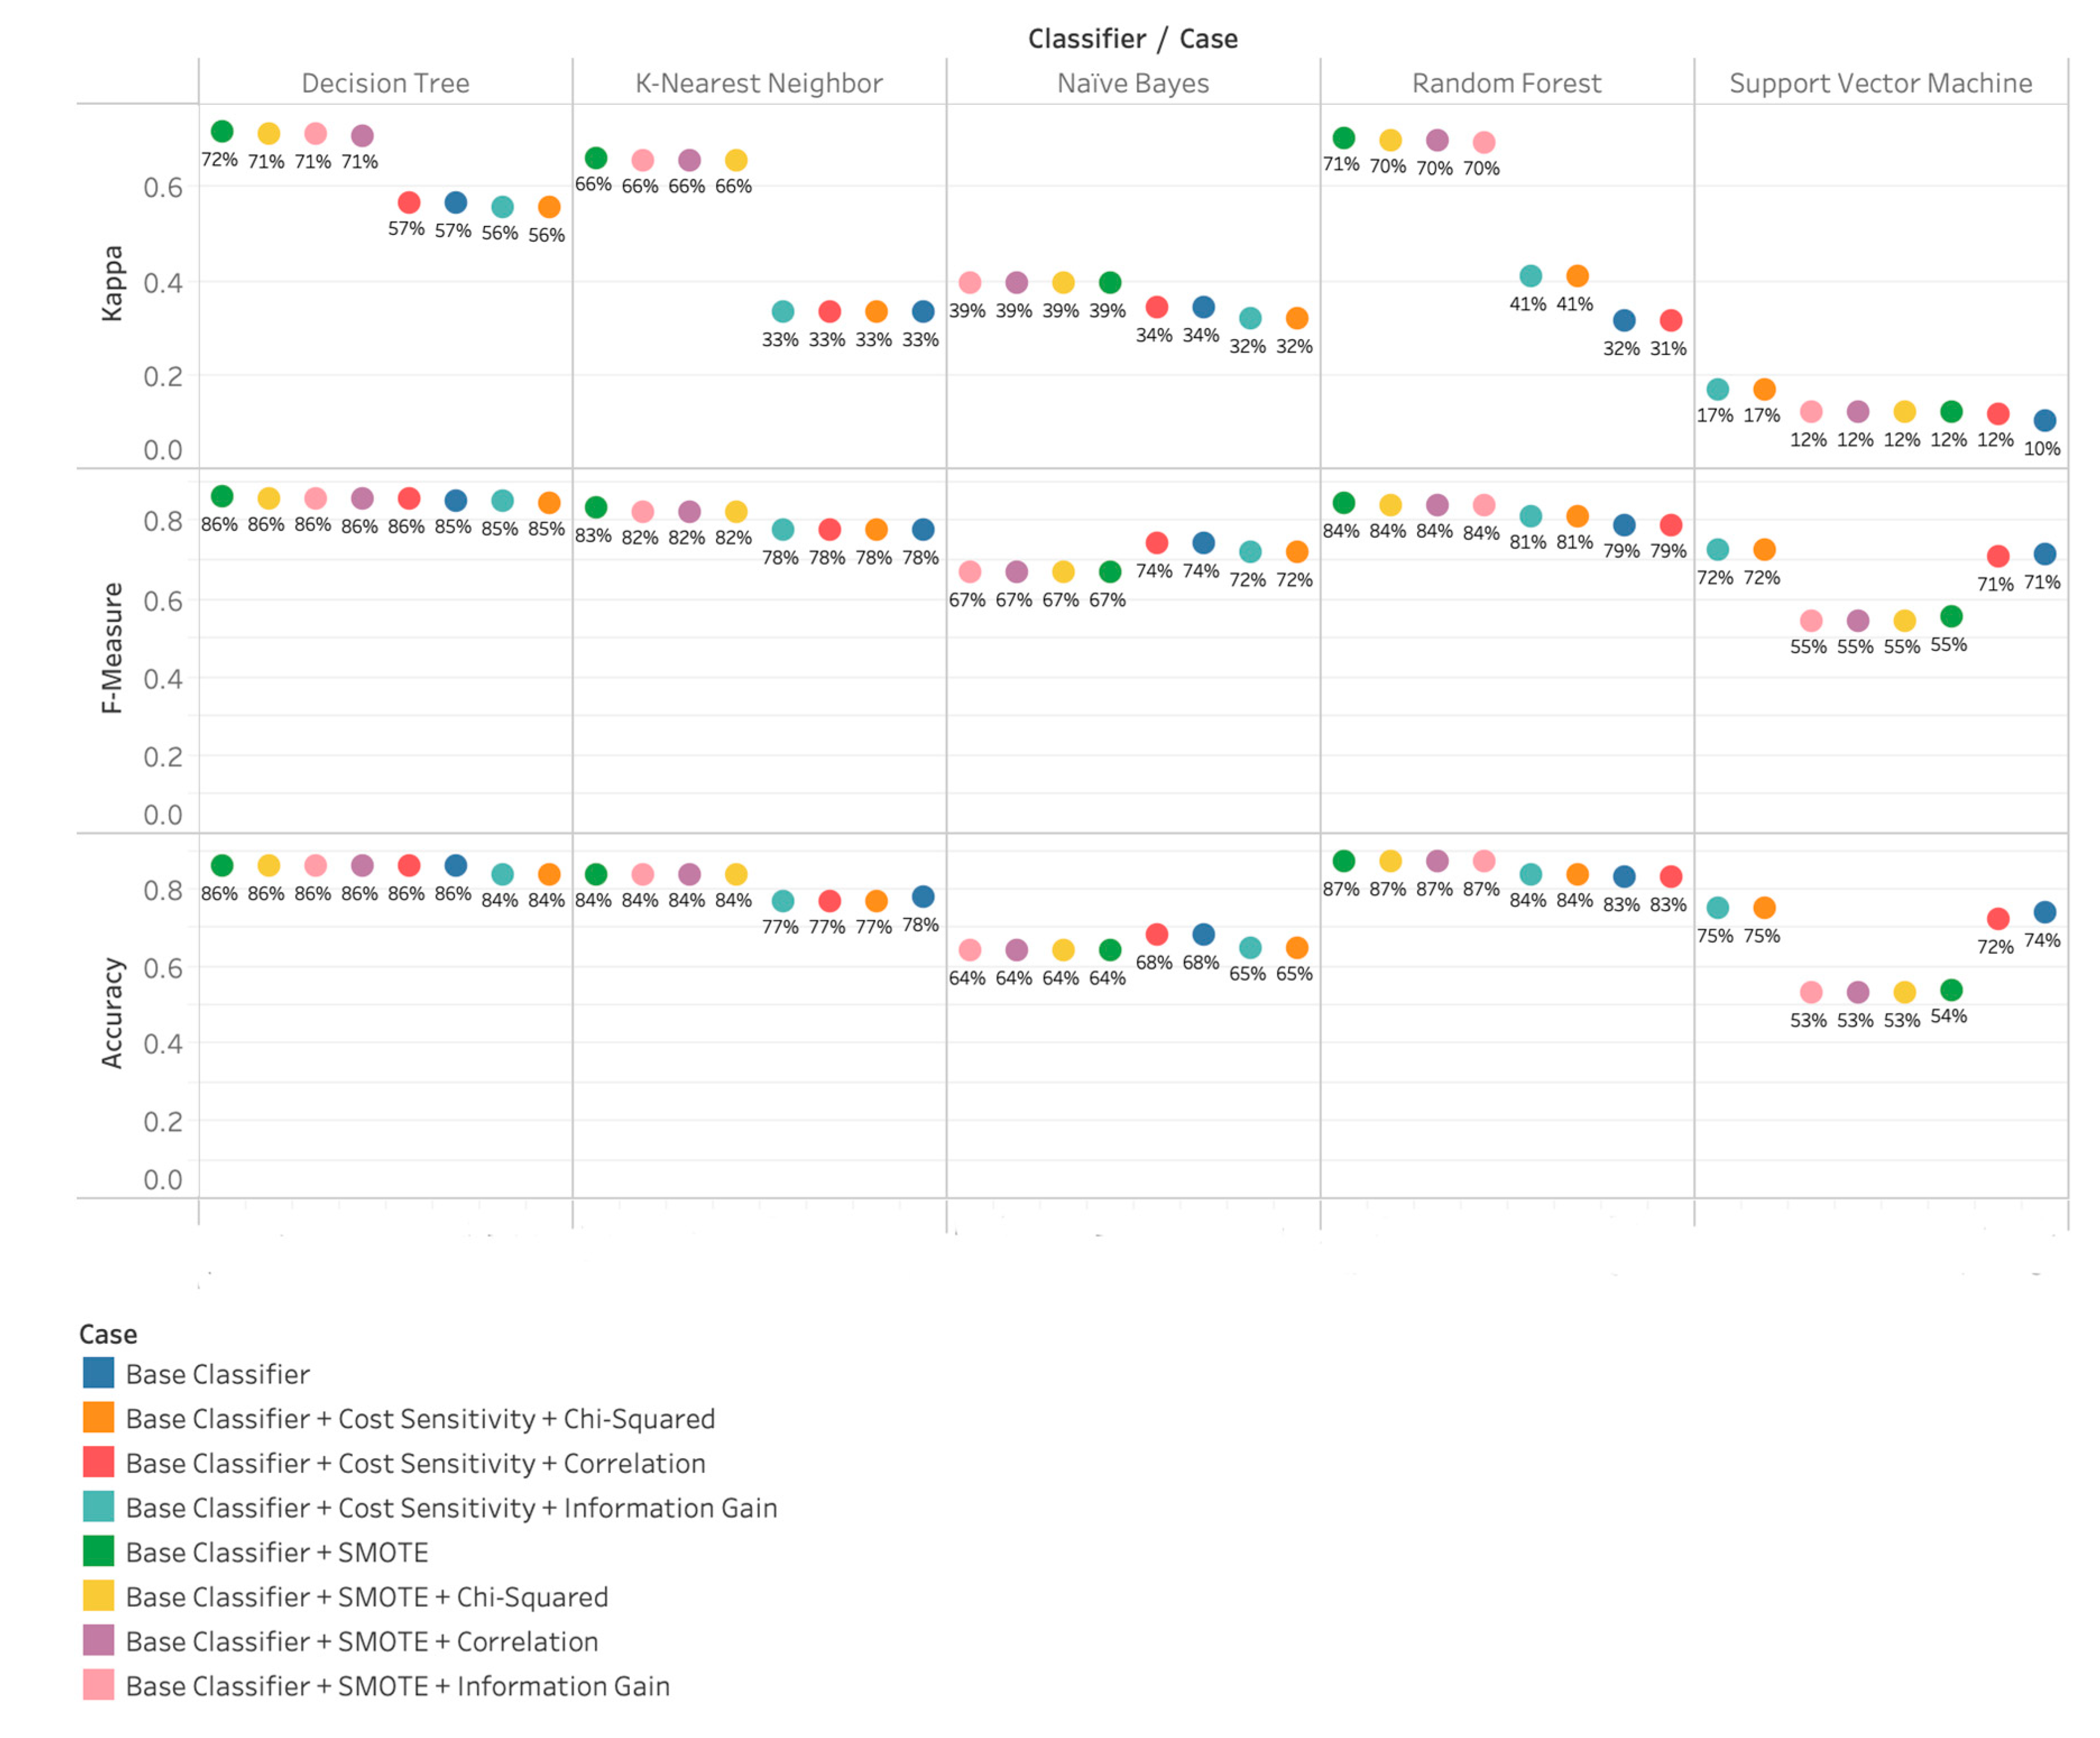
All tweets were represented with Bag of Words (BoW). In this approach, the text is represented by a set of words, and each word is treated as an independent feature. As seen in Figure 3, Kappa statistics for all five classifiers range between 10% and 72%.
It can be seen that the Tree classifiers DT, and RF, performed significantly higher than function classifier SVM, probabilistic classifier NB, and lazy learning instance-based classifier KNN. Among all experiment case scenarios, Base Classifier + SMOTE, including SMOTE + Chi-Square, Correlation, and Information Gain achieved better performance in terms of Kappa, F-Measure, and Accuracy except SVM. Cost Sensitivity along with feature selection techniques (Chi-Square, Correlation, and Information Gain) did not seem to add much value to the classifier performance except in the case of SVM. The best classifier for this approach is DT with SMOTE only.
4.2. Results Achieved with Word to Vector (Baseline 2)
In Word2Vec approach, all tweets are represented as feature vectors that represent words in that corpus. In this approach, the text is represented by feature vectors. Word2Vec is a two-layer neural net that processes text by vectorizing words. Its input is a text corpus, and its output is a set of vectors: feature vectors that represent words in that corpus. As seen in Figure 4, Kappa statistics for all five classifiers range between 5% and 71%. RF performed significantly higher than all others. Among all experiment case scenarios, Base Classifier + SMOTE, including SMOTE + Chi-Square, Correlation, and Information Gain achieved better performance in terms of Kappa, F-Measure, and Accuracy as opposed to Cost Sensitivity except SVM. Cost sensitivity along with feature selection techniques (Chi-Square, Correlation, and Information Gain) did not seem to add much value to the classifier performance in this approach except SVM. The best classifier for this approach is RF with SMOTE.
4.3. Results Achieved with our Proposed Method (PMI-SO)
In our proposed approach outlined in Section 3, all tweets are represented as vectors with a PMI-SO score. In this approach, semantic orientation for each word is calculated in a corpus of tweets. In addition, along with Twitter features (Content, Network, and Activity), we also incorporated PMI-SO, the user (age and gender), and personality features (agreeableness, conscientiousness, extraversion, neuroticism, and openness) as input features. As seen in Figure 5, Kappa statistics for all five classifiers range between 10% and 83%. Similar to the BoW approach: DT, RF, performed significantly higher than SVM, NB, and KNN. Mirroring BoW and word to vector approaches, the base classifier performance increases by 20%+ when applying with SMOTE only. In our experiments, the classifier performance did not significantly improve by applying PMI and predicted features individually. However, a classifier’s performance increased by approximately another 20% when we applied PMI + Predicted features together. We achieved the optimal level of classifier performance when we applied SMOTE + weight-adjusted Cost Sensitivity. The best classifier in our approach is RF with parameters set as Base Classifier + SMOTE + Cost Adjusted + Predicted Features + PMI.
4.4. Results Summary
Our findings (Figure 5) are in line with previous empirical evidence that has shown the personality feature to be linked with cyberbullying behavior [16,40,41,89]. Direct comparison is not possible with cyberbullying studies due to several reasons: the nature of availability of twitter dataset, scope of the study, and analysis mechanism. To test the significance of our proposed approach, however, we tested the same dataset against two well-known text representation approaches, namely, BoW and Word2Vec.
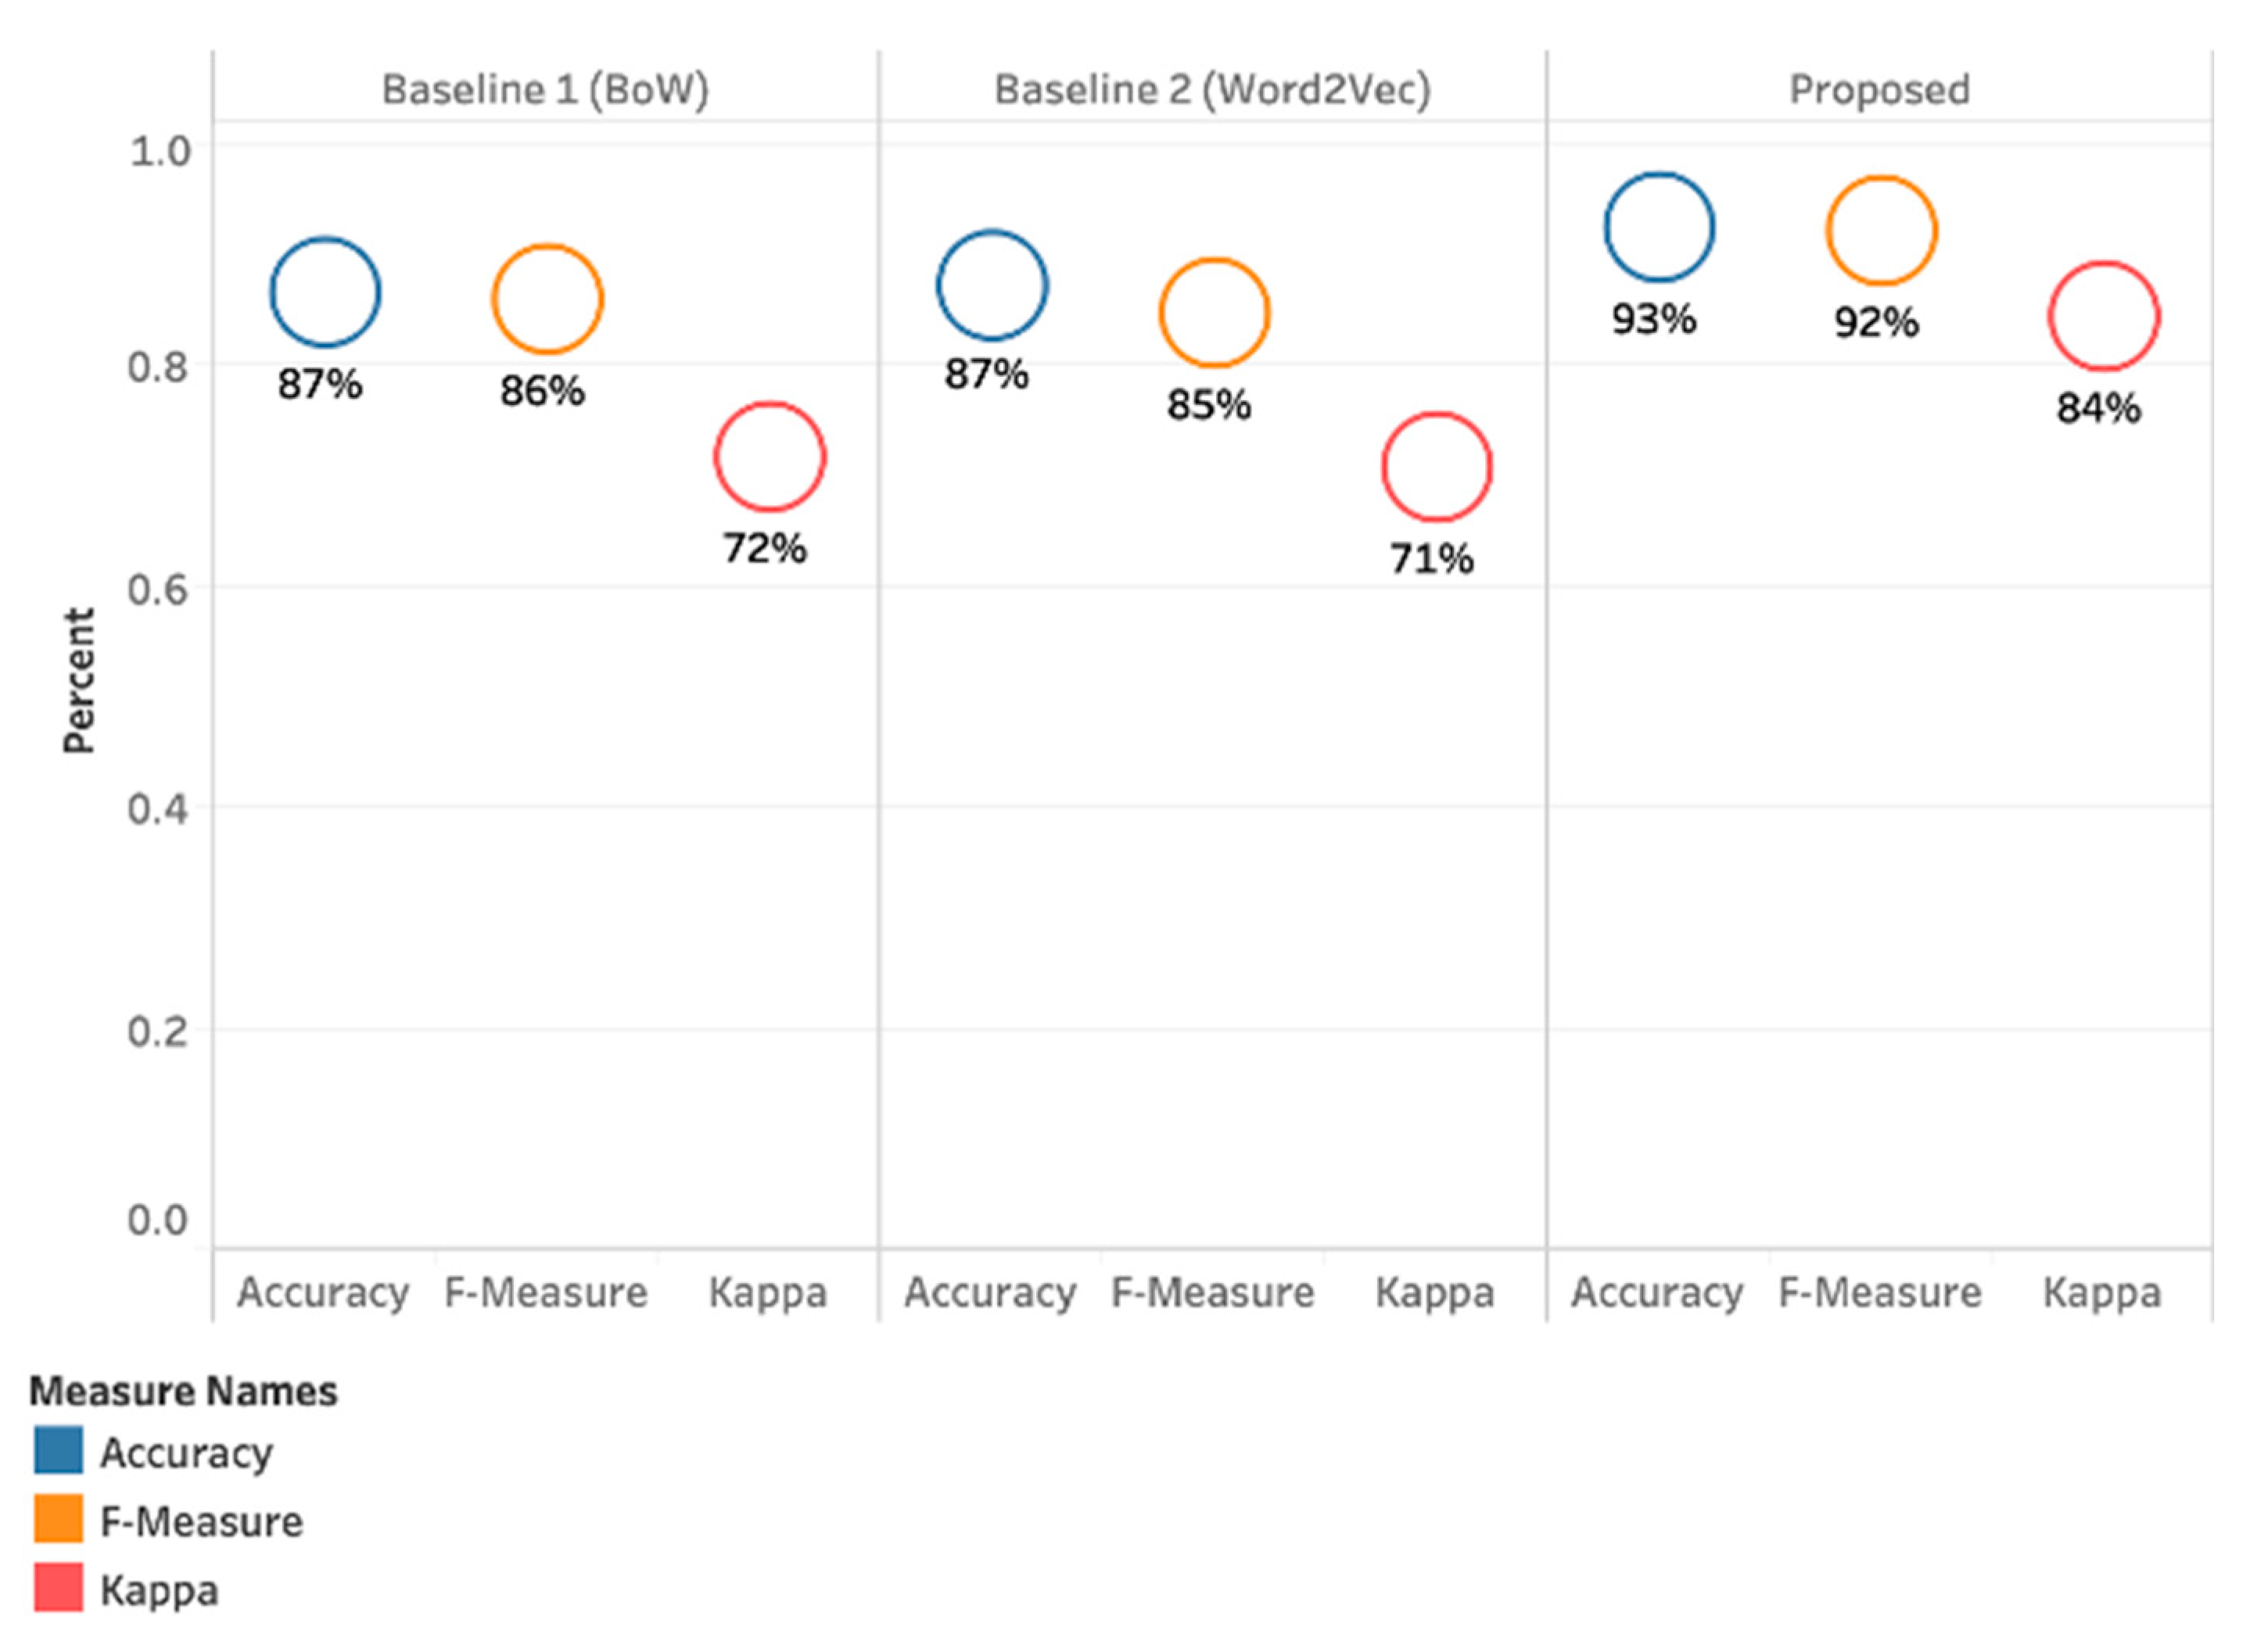
BoW approach specifically was selected due to its popularity in cyberbullying detection studies [16,19,20,47,90,91,92,93,94]. We ran an extensive set of experiments to measure the performance of five classifiers using two baseline approaches under different settings. Figure 6 provides a comparison of different approaches used in this study to detect cyberbullying severity. RF achieved the highest Kappa of 84%, F-Measure 92%, and Accuracy 93% when parameter sets to Base Classifier + SMOTE + Cost Adjusted + Predicted Features + PMI. The best classifier in BoW approach is DT with SMOTE (Figure 2) and the RF with SMOTE in Word2Vec approach (Figure 3). SVM showed the poorest performance in all approaches and experiments. This may not be surprising, as previous research has reported that the SVM algorithm performs poorly when the extreme class imbalance is known [95].
4.5. In-Depth Analysis of Results
Looking at the best performing model (Base Classifier + SMOTE + Cost Adjusted + Predicted Features + PMI), we wanted to further investigate which specific features contribute to the cyberbullying severity detection. More specifically, when cyberbullying behavior is detected then:
- (a)
- What type of personality traits falls under different severity levels (Low, Medium, or High)?
- (b)
- What is their gender?
- (c)
- What age group do they belong to?
- (d)
- Since when the user has been using Twitter?
- (e)
- What time do they tweet post?
- (f)
- What makes their tweet cyberbullied?
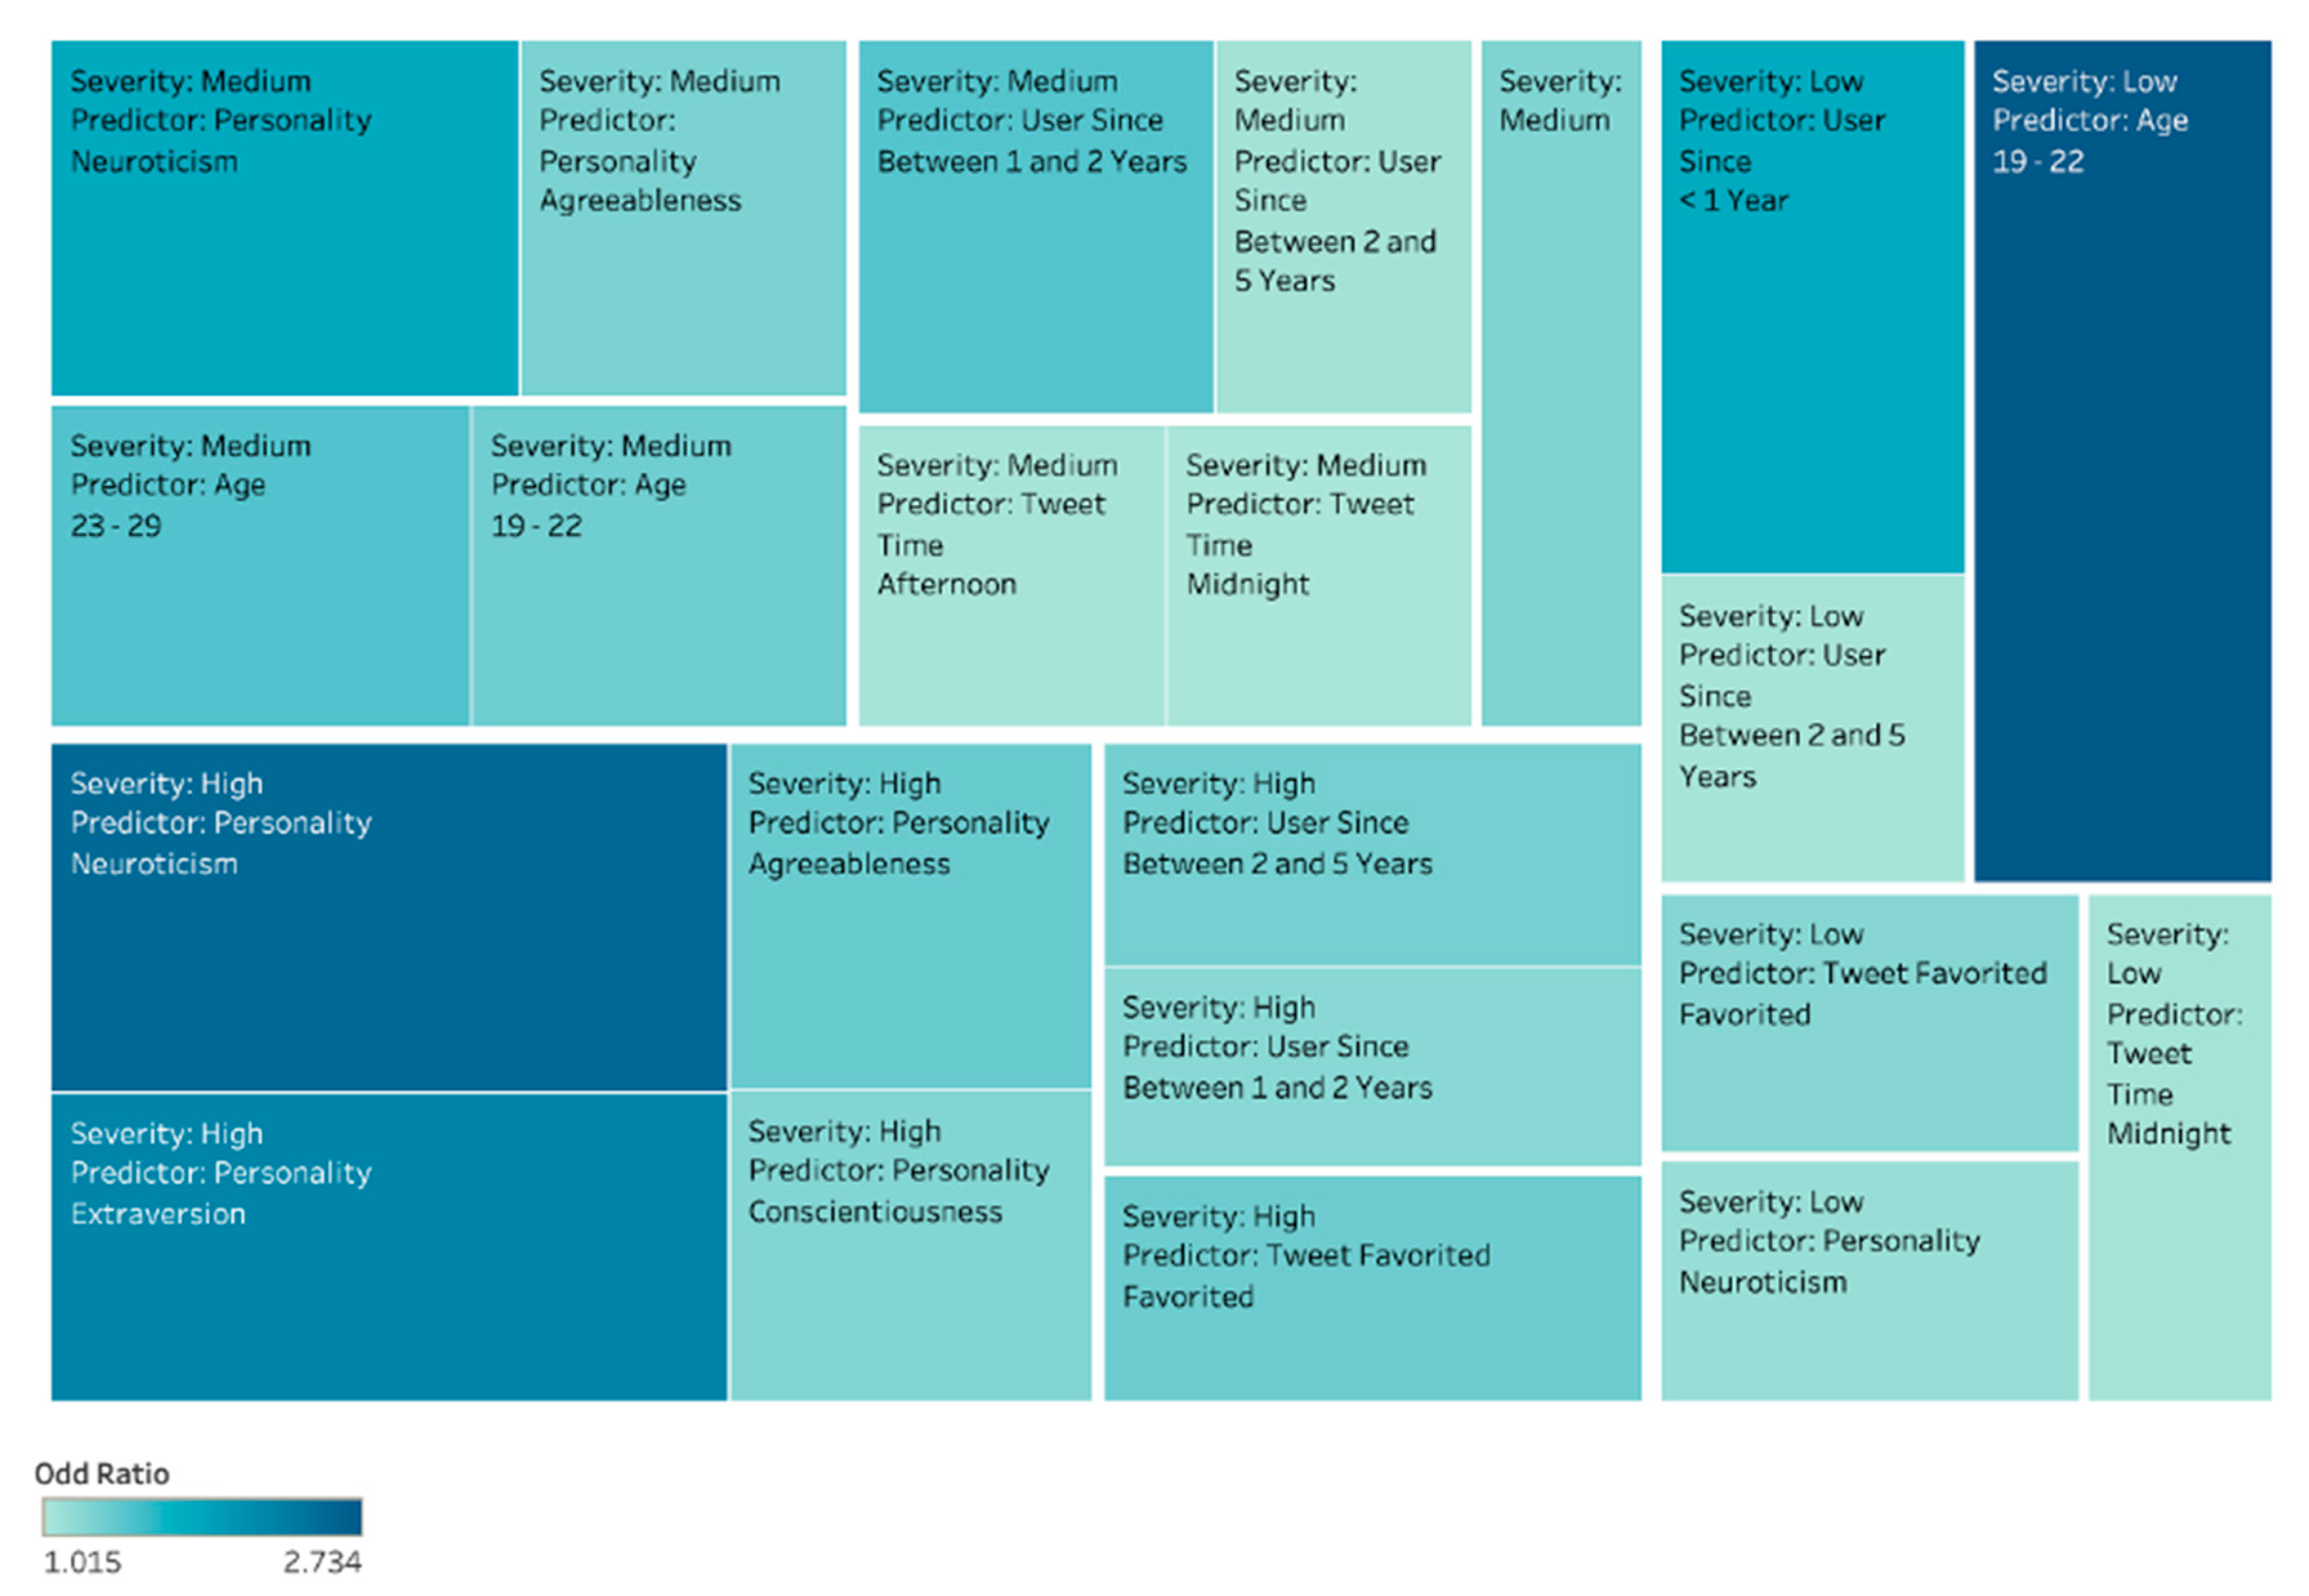
In order to identify these features, we ran multinomial logistic regression to extract the odd ratio of all features (Content, Network, Activity, Personality, and User) that we applied in our model (Figure 9). It is tree map plot, where both the size of the rectangles and their color are determined by the odds ratio of each feature—the greater the odds ratio for each feature, the darker and larger its box.
4.5.1. Low-Level Cyberbullying Severity
Under this category of severity level, cyberbullying tweets are related to intelligence. In our study, the likelihood of users to be categorized for low level of cyberbullying severity are users with neuroticism behavior, age group between 19–22 years, tweet time mostly at midnight, their Twitter account is relatively new (<1 year). Features with the highest odds ratio (Figure 9) for detecting low-level severity include: age group between 19–22 years and users since <1 year of account.
4.5.2. Medium Cyberbullying Severity
In this category, cyberbullying tweets are about politics and racism. Unlike low severity category, medium severity people have the personality trait of agreeableness, age group between 23–29 years, tweet time mostly in afternoon and midnight, their Twitter account since the date is between one to two years. In this group, the rate of perpetrator’s tweet being favored by other users is a bit higher compared to low-level severity users. The highest odd ratio (Figure 9) for detecting medium severity level predictors are; neuroticism, age group between 23–29 years, and Twitter user between one to two years.
4.5.3. High Cyberbullying Severity
Sexual and appearance-related tweets are categorized under a high level of cyberbullying severity. The probability of users to be categorized with a high level of cyberbullying severity are (Figure 9); neuroticism and extraversion, their Twitter account age is between two to five years. In this group, perpetrator tweet is favored by other users is higher than low and medium-level cyberbullied severity users. Predictors with the highest odds ratio (Figure 9) for detecting high cyberbullying severity levels are; neuroticism and extraversion, and the number of times tweet has been favored. The relation of neuroticism and extraversion to cyberbullying perpetration was also reported by [41,96].
Although gender is a good feature to know about the user (and is correlated with other features such as network, activity, and user to detect cyberbullying tweet), our finding suggests otherwise. In any of the cyberbullying severity categories (Figure 9), gender does not play an important role when identifying the level of severity in the cyberbullying content.
In current study, predicted features such as predicting gender and user’s age were derived from vocabulary, which have proven to show some improvement in overall classifiers’ accuracy. We believe the content of aforementioned used vocabulary be further studied and extended for updated words and phrases. The algorithmic biasness due to this vocabulary could possibly create systematic and repeatable errors that could eventually create unfair outcomes, such as privileging one arbitrary group of users over others [97,98]. Overall, the findings indicate that multiple features can be used to enhance cyberbullying detection, and choosing specific features is a crucial part in the process of cyberbullying detection. Most of previous cyberbullying related studies [2,6,16], focused on feature selection rather than how text is represented at a pre-processing stage. Our study has shed some light on the text representation at the pre-processing stage before important features are fed into the desired machine learning model for training. Figure 6 depicts the breakdown of the classifiers’ performance for the proposed vector-based model, indicating the proposed approach performed best in detecting cyberbullying severity in online social networks (accuracy of 93%) compared to baseline approaches.
Top twitter features selected by correlation analysis are: tweet favored, user statuses, retweeted, the tweet time, user since, followers, and user favorites. This suggests that network, user, and activity features play an important role in detecting cyberbullying severity. The importance of these features in the detection of cyberbullying behavior was also suggested by [2,6,16].
5. Contribution and Limitations
The first contribution of this research is by undertaking a comprehensive literature review on cyberbullying severity detection, whereby we highlighted the limitations of the existing techniques related to cyberbullying detection and its severity level. In the process, a great deal of understanding has been gained on defining cyberbullying severity. There are very few published results about defining cyberbullying severity in online social networks, as it is a subjective issue for each person. Nevertheless, some research attempts have been made to address the cyberbullying severity issue, and it is still open for further investigation. In our study, findings from different disciplines informed the identification of different levels of severity and then introduced related factors that were converted into features to build an effective multi-class classifier.
The second, more substantial, the contribution of the research is the development of an effective method for detecting the severity of cyberbullying tweets. Previous research has focused on whether cyberbullying behavior exists or not in a tweet (Binary Classification). We believe that our research provides a step forward in identifying severity at different levels (low, medium, high) when the content of the tweet is classified as cyberbullied using multi-class classification. The determination of what words are associated with what severity level is customizable and lexicon-based, leading to an agile approach. Moreover, our research has made an innovative contribution, we believe, in the area of feature engineering by introducing PMI-SO as a new text pre-processing approach and input feature alongside the aforementioned features for detecting cyberbullying and its severity.
Despite the success demonstrated, the study is not without its limitations. The dataset extracted through Twitter was content-specific (sexual, racial, appearance, intelligence, and political related). We believe, content-specific lexicon could be further improved upon for each type of content. Cyberbullying severity level that we have defined in this study is based on motivation from the literature, but no doubt other categorization frameworks could be proposed. Furthermore, the present study only focused on the Twitter platform; other social network platforms need to be investigated to see whether the approach to cyberbullying severity detection can be applied.
Finally, the present study provides a limitation to train artificial neural network models due to highly skewed positive classes (less than 500 instances for each class). It would be interesting to see experimental results from a large dataset produced from neural network models.
6. Conclusions
The use of the internet and social media has significant benefits for society, but the excessive usage of the internet and social media has major detrimental effects too. This includes unwanted sexual exposure, cybercrime, and cyberbullying. Cyberbullying is a conscious and persistent act of violence that aims to threaten or harm individuals, deliberately and repeatedly using communication and information technologies. This situation has been worsened by the increased use of the Internet, especially on Twitter and Facebook. Studies have shown that knock-on effects of cyberbullying can potentially be harmful including learning disabilities, psychological distress, and depression, escalating physical confrontations, and suicide.
In our research we have developed a model for detecting cyberbullying severity on Twitter. The developed model is a feature-based model that uses features from contents of tweets to develop a machine learning classifier for classifying the tweets as non-cyberbullied, and low, medium, or high-level severity of cyberbullying.
We ran comprehensive experiments to test the efficiency of five well-known classifiers, namely, NB, SVM, KNN, DT, and RF. All five classifiers were tested on BoW, Word2Vec, using a proposed manually engineering technique to see the significance of classifiers’ performance when text data is imbalanced. Feature selection techniques, namely, chi-square, information gain, and correlation were used in different combinations of features to determine the effectiveness of each feature and classifier performance. Predicted features, namely, personality type, gender, and age features were applied along with features provided by Twitter API. We then introduced the PMI technique to create a semantic orientation of each word and phrase for the entire dataset to create a new input feature. By using PMI as an input feature along with predicted and Twitter features, the performance of the classifiers significantly improved Twitter. SMOTE was applied along with weight adjusting (cost-sensitivity) approaches to handle the imbalanced class distribution in our manually labeled data set. Base classifier performance increased by 20%+ when applying with SMOTE only. Further 20% classifiers’ performance increased when applied PMI + predicted features together. RF achieved the highest Kappa of 84%, F-Measure 92%, and Accuracy 93% when parameters set to Base Classifier + SMOTE + Cost Adjusted + Predicted Features + PMI. Finally, we performed multinomial logistic regression to identify highly significant predictors for cyberbullying severity.
Author Contributions
Conceptualization, methodology, software, validation, formal analysis and writing—original draft preparation, B.A.T.; writing—review, editing, supervision, funding acquisition, D.O. All authors have read and agreed to the published version of the manuscript.
Funding
This research was conducted partially with the support of the ADAPT SFI Research Centre at Trinity College Dublin. The ADAPT SFI Centre for Digital Media Technology is funded by Science Foundation Ireland through the SFI Research Centres Programme and is co-funded under the European Regional Development Fund (ERDF) through Grant # 13/RC/2106.
Conflicts of Interest
The authors declare no conflict of interest. The funders had no role in the design of the study; in the collection, analyses, or interpretation of data; in the writing of the manuscript, or in the decision to publish the results.
References
- Huang, Q.; Singh, V.K.; Atrey, P.K. Cyber Bullying Detection Using Social and Textual Analysis. In Proceedings of the 3rd International Workshop on Socially-Aware Multimedia, Orlando, FL, USA, 7 November 2014; ACM: New York, NY, USA, 2014; pp. 3–6. [Google Scholar]
- Chatzakou, D.; Vakali, A.; Kafetsios, K. Detecting variation of emotions in online activities. Expert Syst. Appl. 2017, 89, 318–332. [Google Scholar] [CrossRef]
- Hoff, D.L.; Mitchell, S.N. Cyberbullying: Causes, effects, and remedies. J. Educ. Adm. 2009, 47, 652–665. [Google Scholar] [CrossRef]
- Patchin, J.W.; Hinduja, S. Cyberbullying and self-esteem. J. Sch. Health 2010, 80, 614–621, quiz 622–624. [Google Scholar] [CrossRef] [PubMed]
- Yao, M.; Chelmis, C.; Zois, D.-S. Cyberbullying detection on instagram with optimal online feature selection. In Proceedings of the 2018 IEEE/ACM International Conference on Advances in Social Networks Analysis and Mining, Barcelona, Spain, 28–31 August 2018; IEEE Press: Barcelona, Spain, 2018; pp. 401–408. [Google Scholar]
- Balakrishnan, V.; Khan, S.; Fernandez, T.; Arabnia, H.R. Cyberbullying detection on twitter using Big Five and Dark Triad features. Personal. Individ. Differ. 2019, 141, 252–257. [Google Scholar] [CrossRef]
- Galán-García, P.; de la Puerta, J.G.; Gómez, C.L.; Santos, I.; Bringas, P.G. Supervised machine learning for the detection of troll profiles in twitter social network: Application to a real case of cyberbullying. Log. J. Igpl. 2016, 24, 42–53. [Google Scholar] [CrossRef] [Green Version]
- Haidar, B.; Chamoun, M.; Serhrouchni, A. A Multilingual System for Cyberbullying Detection: Arabic Content Detection using Machine Learning. Adv. Sci. Technol. Eng. Syst. J. 2017, 2, 275–284. [Google Scholar] [CrossRef] [Green Version]
- Vyawahare, M.; Chatterjee, M. Taxonomy of Cyberbullying Detection and Prediction Techniques in Online Social Networks. In Data Communication and Networks; Jain, L.C., Tsihrintzis, G.A., Balas, V.E., Sharma, D.K., Eds.; Springer: Singapore, 2020; pp. 21–37. [Google Scholar]
- Domingos, P. A few useful things to know about machine learning. Commun. ACM 2012, 55, 78. [Google Scholar] [CrossRef] [Green Version]
- Myers, C.-A.; Cowie, H. Cyberbullying across the Lifespan of Education: Issues and Interventions from School to University. Int. J. Environ. Res. Public Health 2019, 16, 1217. [Google Scholar] [CrossRef] [Green Version]
- Modeling Detect. Textual Cyberbullying. Available online: https://web.media.mit.edu/~lieber/Publications/Cyberbullying-Barcelona.pdf (accessed on 15 November 2020).
- Isa, S.M.; Ashianti, L. Cyberbullying classification using text mining. In Proceedings of the 2017 1st International Conference on Informatics and Computational Sciences (ICICoS), Semarang City, Indonesia, 15–16 November 2017; 2017; pp. 241–246. [Google Scholar]
- Hosseinmardi, H.; Mattson, S.A.; Rafiq, R.I.; Han, R.; Lv, Q.; Mishra, S. Detection of cyberbullying incidents on the instagram social network. arXiv preprint 2015, arXiv:1503.03909. [Google Scholar]
- Sterner, G.; Felmlee, D. The social networks of cyberbullying on Twitter. Int. J. Technoethics 2017, 8, 1–15. [Google Scholar] [CrossRef]
- Al-garadi, M.A.; Varathan, K.D.; Ravana, S.D. Cybercrime detection in online communications: The experimental case of cyberbullying detection in the Twitter network. Comput. Hum. Behav. 2016, 63, 433–443. [Google Scholar] [CrossRef]
- Chatzakou, D.; Kourtellis, N.; Blackburn, J.; De Cristofaro, E.; Stringhini, G.; Vakali, A. Mean Birds: Detecting Aggression and Bullying on Twitter. In Proceedings of the Proceedings of the 2017 ACM on Web Science Conference, Troy, NY, USA., 25–28 June 2017; Association for Computing Machinery: Troy, NY, USA, 2017; pp. 13–22. [Google Scholar]
- Saravanaraj, A.; Sheeba, J.I.; Devaneyan, S.P. Automatic detection of cyberbullying from twitter. Int. J. Comput. Sci. Inf. Technol. 2016, 26–31. [Google Scholar] [CrossRef]
- Dadvar, M.; Trieschnigg, D.; Ordelman, R.; de Jong, F. Improving Cyberbullying Detection with User Context. In Advances in Information Retrieval; Serdyukov, P., Braslavski, P., Kuznetsov, S.O., Kamps, J., Rüger, S., Agichtein, E., Segalovich, I., Yilmaz, E., Eds.; Springer: Berlin/Heidelberg, Germany, 2013; pp. 693–696. [Google Scholar]
- Dadvar, M.; de Jong, F.M.G.; Ordelman, R.J.F.; Trieschnigg, R.B. Improved cyberbullying detection using gender information. In Proceedings of the Twelfth Dutch-Belgian Information Retrieval Workshop (DIR 2012), Ghent, Belgium, 24 February 2012; Ghent University: Ghent, Belgium, 2012; pp. 23–25. [Google Scholar]
- Salawu, S.; He, Y.; Lumsden, J. Approaches to Automated Detection of Cyberbullying: A Survey. IEEE Trans. Affect. Comput. 2018, 1-1. [Google Scholar] [CrossRef] [Green Version]
- Navarro, J.N.; Jasinski, J.L. Going Cyber: Using Routine Activities Theory to Predict Cyberbullying Experiences. Sociol. Spectr. 2012, 32, 81–94. [Google Scholar] [CrossRef]
- Galán-García, P.; de la Puerta, J.G.; Gómez, C.L.; Santos, I.; Bringas, P.G. Supervised Machine Learning for the Detection of Troll Profiles in Twitter Social Network: Application to a Real Case of Cyberbullying. In Proceedings of the International Joint Conference SOCO’13-CISIS’13-ICEUTE’13, Salamanca, Spain, 11–13 September 2013; Herrero, Á., Baruque, B., Klett, F., Abraham, A., Snášel, V., de Carvalho, A.C.P.L.F., Bringas, P.G., Zelinka, I., Quintián, H., Corchado, E., Eds.; Springer International Publishing: Berlin/Heidelberg, Germany, 2014; pp. 419–428. [Google Scholar]
- Rosa, H.; Pereira, N.; Ribeiro, R.; Ferreira, P.C.; Carvalho, J.P.; Oliveira, S.; Coheur, L.; Paulino, P.; Veiga Simão, A.M.; Trancoso, I. Automatic cyberbullying detection: A systematic review. Comput. Hum. Behav. 2019, 93, 333–345. [Google Scholar] [CrossRef]
- Peersman, C.; Daelemans, W.; Van Vaerenbergh, L. Predicting Age and Gender in Online Social Networks. In Proceedings of the 3rd International Workshop on Search and Mining User-Generated Contents, Glasgow, UK, 28 October 2011; ACM: New York, NY, USA, 2011; pp. 37–44. [Google Scholar]
- Hosseini, M.; Tammimy, Z. Recognizing users gender in social media using linguistic features. Comput. Hum. Behav. 2016, 56, 192–197. [Google Scholar] [CrossRef]
- Van Royen, K.; Poels, K.; Daelemans, W.; Vandebosch, H. Automatic monitoring of cyberbullying on social networking sites: From technological feasibility to desirability. Telemat. Inform. 2015, 32, 89–97. [Google Scholar] [CrossRef]
- O’Connor, S. A Study of Gender and Age Differences Concerning the Cyberbullying Experiences of Adolescents in Ireland; Dublin Business School: Dublin, Ireland, 2009. [Google Scholar]
- Zsila, Á.; Urbán, R.; Griffiths, M.D.; Demetrovics, Z. Gender Differences in the Association Between Cyberbullying Victimization and Perpetration: The Role of Anger Rumination and Traditional Bullying Experiences. Int. J. Ment. Health Addict. 2019, 17, 1252–1267. [Google Scholar] [CrossRef] [Green Version]
- Dilmaç, B. Psychological needs as a predictor of cyber bullying: A preliminary report on college students. Kuram Uygul. Egit. Bilimleri 2009, 9, 1307–1325. [Google Scholar]
- Sourander, A.; Klomek, A.B.; Ikonen, M.; Lindroos, J.; Luntamo, T.; Koskelainen, M.; Ristkari, T.; Helenius, H. Psychosocial Risk Factors Associated with Cyberbullying Among Adolescents: A Population-Based Study. Arch. Gen. Psychiatry 2010, 67, 720–728. [Google Scholar] [CrossRef] [Green Version]
- Kowalski, R.M.; Giumetti, G.W.; Schroeder, A.N.; Reese, H.H. Chapter 14 Cyber Bullying Among College Students: Evidence from Multiple Domains of College Life. Available online: https://www.emerald.com/insight/content/doi/10.1108/S2044-9968(2012)0000005016/full/html (accessed on 4 September 2019).
- Chung, C.; Pennebaker, J. The Psychological Functions of Function Words. In Social Communication; Frontiers of social psychology; Psychology Press: New York, NY, USA, 2007; pp. 343–359. [Google Scholar]
- Schwartz, H.A.; Eichstaedt, J.C.; Kern, M.L.; Dziurzynski, L.; Ramones, S.M.; Agrawal, M.; Shah, A.; Kosinski, M.; Stillwell, D.; Seligman, M.E.P.; et al. Personality, Gender, and Age in the Language of Social Media: The Open-Vocabulary Approach. PLoS ONE 2013, 8, e73791. [Google Scholar] [CrossRef] [PubMed]
- Slonje, R.; Smith, P.K. Cyberbullying: Another main type of bullying? Scand. J. Psychol. 2008, 49, 147–154. [Google Scholar] [CrossRef] [PubMed]
- Liu, W.; Ruths, D. What’s in a Name? Using First Names as Features for Gender Inference in Twitter. In Proceedings of the Analyzing Microtext: Papers from the 2013 AAAI Spring Symposium, Stanford, CA, USA, 25 March 2013; pp. 10–16. [Google Scholar]
- Carducci, G.; Rizzo, G.; Monti, D.; Palumbo, E.; Morisio, M. TwitPersonality: Computing Personality Traits from Tweets Using Word Embeddings and Supervised Learning. Information 2018, 9, 127. [Google Scholar] [CrossRef] [Green Version]
- Mahmud, J.; Zhou, M.X.; Megiddo, N.; Nichols, J.; Drews, C. Recommending targeted strangers from whom to solicit information on social media. In Proceedings of the 2013 international conference on Intelligent User Interfaces-IUI ’13, Santa Monica, CA, USA, 19–22 March 2013; ACM Press: Santa Monica, CA, USA, 2013; p. 37. [Google Scholar]
- Resett, S.; Gamez-Guadix, M. Traditional bullying and cyberbullying: Differences in emotional problems, and personality. Are cyberbullies more Machiavellians? J. Adolesc. 2017, 61, 113–116. [Google Scholar] [CrossRef]
- van Geel, M.; Goemans, A.; Toprak, F.; Vedder, P. Which personality traits are related to traditional bullying and cyberbullying? A study with the Big Five, Dark Triad and sadism. Personal. Individ. Differ. 2017, 106, 231–235. [Google Scholar] [CrossRef] [Green Version]
- Festl, R.; Quandt, T. Social Relations and Cyberbullying: The Influence of Individual and Structural Attributes on Victimization and Perpetration via the Internet. Hum Commun. Res. 2013, 39, 101–126. [Google Scholar] [CrossRef]
- Holtgraves, T. Text messaging, personality, and the social context. J. Res. Personal. 2011, 45, 92–99. [Google Scholar] [CrossRef]
- Kern, M.L.; Eichstaedt, J.C.; Schwartz, H.A.; Dziurzynski, L.; Ungar, L.H.; Stillwell, D.J.; Kosinski, M.; Ramones, S.M.; Seligman, M.E.P. The Online Social Self: An Open Vocabulary Approach to Personality. Assessment 2013. [Google Scholar] [CrossRef] [Green Version]
- Sumner, C.; Byers, A.; Boochever, R.; Park, G.J. Predicting Dark Triad Personality Traits from Twitter Usage and a Linguistic Analysis of Tweets. In Proceedings of the 2012 11th International Conference on Machine Learning and Applications, Boca Raton, FL, USA, 12–15 December 2012; pp. 386–393. [Google Scholar]
- Haidar, B.; Chamoun, M.; Yamout, F. Cyberbullying Detection: A Survey on Multilingual Techniques. In Proceedings of the 2016 European Modelling Symposium (EMS), Pisa, Italy, 28–30 November 2016; pp. 165–171. [Google Scholar]
- Reynolds, K.; Kontostathis, A.; Edwards, L. Using Machine Learning to Detect Cyberbullying. In Proceedings of the 2011 10th International Conference on Machine Learning and Applications and Workshops, Honolulu, HI, USA, 18–21 December 2011; Volume 2, pp. 241–244. [Google Scholar]
- Zhao, R.; Zhou, A.; Mao, K. Automatic Detection of Cyberbullying on Social Networks Based on Bullying Features. In Proceedings of the 17th International Conference on Distributed Computing and Networking, Singapore, 4–7 January 2016; ACM: New York, NY, USA, 2016; Volume 43, pp. 1–6. [Google Scholar]
- Morstatter, F.; Pfeffer, J.; Liu, H.; Carley, K.M. Is the Sample Good Enough? Comparing Data from Twitter’s Streaming API with Twitter’s Firehose. arXiv 2013, arXiv:1306.5204. [Google Scholar]
- Kwak, H.; Lee, C.; Park, H.; Moon, S. What is Twitter, a social network or a news media? In Proceedings of the 19th international Conference on World Wide Web-WWW ’10, Raleigh, NC, USA, 26–30 April 2010; ACM Press: Raleigh, NC, USA, 2010; p. 591. [Google Scholar]
- Bollen, J.; Mao, H.; Zeng, X.-J. Twitter mood predicts the stock market. J. Comput. Sci. 2011, 2, 1–8. [Google Scholar] [CrossRef] [Green Version]
- Eichstaedt, J.C.; Schwartz, H.A.; Kern, M.L.; Park, G.; Labarthe, D.R.; Merchant, R.M.; Jha, S.; Agrawal, M.; Dziurzynski, L.A.; Sap, M.; et al. Psychological Language on Twitter Predicts County-Level Heart Disease Mortality. Psychol. Sci. 2015, 26, 159–169. [Google Scholar] [CrossRef] [PubMed] [Green Version]
- Imran, M.; Mitra, P.; Castillo, C. Twitter as a Lifeline: Human-annotated Twitter Corpora for NLP of Crisis-related Messages. arXiv preprint 2016, arXiv:1605.05894. [Google Scholar]
- Java, A.; Song, X.; Finin, T.; Tseng, B. Why we twitter: Understanding microblogging usage and communities. In Proceedings of the 9th WebKDD and 1st SNA-KDD 2007 Workshop on Web Mining and Social Network Analysis-WebKDD/SNA-KDD ’07, San Jose, CA, USA, 2007, 12–15 August; ACM Press: San Jose, CA, USA, 2007; pp. 56–65. [Google Scholar]
- Preoţiuc-Pietro, D.; Eichstaedt, J.; Park, G.; Sap, M.; Smith, L.; Tobolsky, V.; Schwartz, H.A.; Ungar, L. The role of personality, age, and gender in tweeting about mental illness. In Proceedings of the 2nd Workshop on Computational Linguistics and Clinical Psychology: From Linguistic Signal to Clinical Reality, Denver, CO, USA, 5 June 2015; Association for Computational Linguistics: Denver, CO, USA, 2015; pp. 21–30. [Google Scholar]
- Sakaki, T.; Okazaki, M.; Matsuo, Y. Earthquake Shakes Twitter Users: Real-time Event Detection by Social Sensors. In Proceedings of the WWW2010, Raleigh, NC, USA, 26–30 April 2010; p. 10. [Google Scholar]
- Cheng, T.; Wicks, T. Event Detection using Twitter: A Spatio-Temporal Approach. PLoS ONE 2014, 9, e97807. [Google Scholar] [CrossRef] [PubMed]
- González-Bailón, S.; Wang, N.; Rivero, A.; Borge-Holthoefer, J.; Moreno, Y. Assessing the bias in samples of large online networks. Soc. Netw. 2014, 38, 16–27. [Google Scholar] [CrossRef]
- Rezvan, M.; Shekarpour, S.; Balasuriya, L.; Thirunarayan, K.; Shalin, V.L.; Sheth, A. A Quality Type-aware Annotated Corpus and Lexicon for Harassment Research. In Proceedings of the 10th ACM Conference on Web Science, Amsterdam, The Netherlands, 27–30 May 2018; ACM: New York, NY, USA, 2018; pp. 33–36. [Google Scholar]
- Einarsen, S.; Hoel, H.; Cooper, C. Bullying and Emotional Abuse in the Workplace: International Perspectives in Research and Practice; CRC Press: Boca Raton, FL, USA, 2002. [Google Scholar]
- Dadvar, M.; de Jong, F. Cyberbullying detection: A step toward a safer internet yard. In Proceedings of the 21st International Conference Companion on World Wide Web-WWW ’12 Companion, Lyon, France, 16–20 April 2012; ACM Press: Lyon, France, 2012; p. 121. [Google Scholar]
- Balakrishnan, V.; Khan, S.; Arabnia, H.R. Improving cyberbullying detection using Twitter users’ psychological features and machine learning. Comput. Secur. 2020, 90, 101710. [Google Scholar] [CrossRef]
- Gimpel, K.; Schneider, N.; O’Connor, B.; Das, D.; Mills, D.; Eisenstein, J.; Heilman, M.; Yogatama, D.; Flanigan, J.; Smith, N.A. Part-of-Speech Tagging for Twitter: Annotation, Features, and Experiments. In Proceedings of the 49th Annual Meeting of the Association for Computational Linguistics: Human Language Technologies, Portland, OR, USA, 19–24 June 2011; Association for Computational Linguistics: Portland, OR, USA, 2011; pp. 42–47. [Google Scholar]
- Turney, P. Thumbs Up or Thumbs Down? Semantic Orientation Applied to Unsupervised Classification of Reviews. In Proceedings of the 40th Annual Meeting of the Association for Computational Linguistics, Philadelphia, PA, USA, 7–12 July 2002; Association for Computational Linguistics: Philadelphia, PA, USA, 2002; pp. 417–424. [Google Scholar]
- Bagheri, A.; Nadi, S. Sentiment Miner: A Novel Unsupervised Framework for Aspect Detection from Customer Reviews. Int. J. Comput. Linguist. Res. 2018, 9, 120. [Google Scholar] [CrossRef]
- Su, Q.; Xiang, K.; Wang, H.; Sun, B.; Yu, S. Using Pointwise Mutual Information to Identify Implicit Features in Customer Reviews. In Proceedings of the Computer Processing of Oriental Languages. Beyond the Orient: The Research Challenges Ahead, Singapore, 17–19 December 2006; Matsumoto, Y., Sproat, R.W., Wong, K.-F., Zhang, M., Eds.; Springer: Berlin/Heidelberg, Germany, 2006; pp. 22–30. [Google Scholar]
- Yasmina, D.; Hajar, M.; Hassan, A.M. Using YouTube Comments for Text-based Emotion Recognition. Procedia Comput. Sci. 2016, 83, 292–299. [Google Scholar] [CrossRef] [Green Version]
- Cai, K.; Spangler, S.; Chen, Y.; Zhang, L. Leveraging sentiment analysis for topic detection. Web Intell. Agent Syst. Int. J. 2010, 8, 291–302. [Google Scholar] [CrossRef]
- Cheng, S.-M.; Yu, C.-H.; Chen, H.-H. Chinese Word Ordering Errors Detection and Correction for Non-Native Chinese Language Learners. In Proceedings of the COLING 2014, the 25th International Conference on Computational Linguistics: Technical Papers, Dublin, Ireland, 25–29 August 2014; Dublin City University and Association for Computational Linguistics: Dublin, Ireland, 2014; pp. 279–289. [Google Scholar]
- Giachanou, A.; Ghanem, B. Bot and Gender Detection using Textual and Stylistic Information. In Proceedings of the CLEF 2019, Lugano, Switzerland, 9–12 September 2019. [Google Scholar]
- Pantel, P. Alias Detection in Malicious Environments. In Proceedings of the AAAI Fall Symposium on Capturing and Using Patterns for Evidence Detection, Arlington, VA, USA, 13–15 October 2006; pp. 14–20. [Google Scholar]
- Grzeszick, R.; Sudholt, S.; Fink, G.A. Weakly Supervised Object Detection with Pointwise Mutual Information. arXiv 2018, arXiv:1801.08747. [Google Scholar]
- Isola, P.; Zoran, D.; Krishnan, D.; Adelson, E.H. Crisp Boundary Detection Using Pointwise Mutual Information. In Computer Vision–ECCV 2014; Fleet, D., Pajdla, T., Schiele, B., Tuytelaars, T., Eds.; Lecture Notes in Computer Science; Springer International Publishing: Cham, Switzerland, 2014; Volume 8691, pp. 799–814. ISBN 978-3-319-10577-2. [Google Scholar]
- Meckbach, C.; Tacke, R.; Hua, X.; Waack, S.; Wingender, E.; Gültas, M. PC-TraFF: Identification of potentially collaborating transcription factors using pointwise mutual information. BMC Bioinform. 2015, 16, 400. [Google Scholar] [CrossRef] [Green Version]
- Garrett, M.; Kuiper, P.; Hood, K.; Turner, D. Leveraging Mutual Information to Generate Domain Specific Lexicons. In Proceedings of the International Conference on Social Computing, Behavioral-Cultural Modeling, & Prediction and Behavior Representation in Modeling and Simulation, Washington DC, USA, 18–21 October 2018; pp. 1–7. [Google Scholar]
- Pattnaik, P.K.; Rautaray, S.S.; Das, H.; Nayak, J. Progress in Computing, Analytics and Networking: Proceedings of ICCAN 2017; Springer: Berlin/Heidelberg, Germany, 2018; ISBN 978-981-10-7871-2. [Google Scholar]
- Mehta, R. Big Data Analytics with Java; Packt Publishing Ltd: Birmingham, UK, 2017; ISBN 978-1-78728-219-3. [Google Scholar]
- Talpur, B.A.; O’Sullivan, D. Cyberbullying severity detection: A machine learning approach. PLoS ONE 2020, 15, e0240924. [Google Scholar] [CrossRef] [PubMed]
- Duggan, M. Online Harassment. Pew Research Center Internet Science Technology. 2014. Available online: https://www.pewresearch.org/internet/2014/10/22/online-harassment/ (accessed on 15 November 2020).
- Moreo, A.; Esuli, A.; Sebastiani, F. Distributional Random Oversampling for Imbalanced Text Classification. In Proceedings of the 39th International ACM SIGIR conference on Research and Development in Information Retrieval-SIGIR ’16, Pisa, Italy, 17–21 July 2016; ACM Press: Pisa, Italy, 2016; pp. 805–808. [Google Scholar]
- He, H.; Garcia, E.A. Learning from Imbalanced Data. IEEE Trans. Knowl. Data Eng. 2009, 21, 1263–1284. [Google Scholar] [CrossRef]
- Sun, Y.; Wong, A.K.C.; Kamel, M.S. Classification of imbalanced data: A review. Int. J. Patt. Recogn. Artif. Intell. 2009, 23, 687–719. [Google Scholar] [CrossRef]
- Chawla, N.V.; Bowyer, K.W.; Hall, L.O.; Kegelmeyer, W.P. SMOTE: Synthetic Minority Over-sampling Technique. JAIR 2002, 16, 321–357. [Google Scholar] [CrossRef]
- Cohen, J. A Coefficient of Agreement for Nominal Scales. Educ. Psychol. Meas. 1960, 20, 37–46. [Google Scholar] [CrossRef]
- Ian, H.W.; Eibe, F.; Mark, A. Hall Data Mining: Practical Machine Learning Tools and Techniques; Elsevier: Amsterdam, The Netherlands, 2011; ISBN 978-0-12-374856-0. [Google Scholar]
- Vieira, S.M.; Kaymak, U.; Sousa, J.M.C. Cohen’s kappa coefficient as a performance measure for feature selection. In Proceedings of the International Conference on Fuzzy Systems, Barcelona, Spain, 18–23 July 2010; IEEE: Barcelona, Spain, 2010; pp. 1–8. [Google Scholar]
- Landis, J.R.; Koch, G.G. The measurement of observer agreement for categorical data. Biometrics 1977, 33, 159–174. [Google Scholar] [CrossRef] [Green Version]
- Hall, M.; Frank, E.; Holmes, G.; Pfahringer, B.; Reutemann, P.; Witten, I.H. The WEKA Data Mining Software: An Update. Sigkdd. Explor. Newsl. 2009, 11, 10–18. [Google Scholar] [CrossRef]
- Bravo-Marquez, F.; Frank, E.; Pfahringer, B.; Mohammad, S.M. AffectiveTweets: A Weka package for analyzing affect in tweets. J. Mach. Learn. Res. 2019, 20, 1–6. [Google Scholar]
- Alonso, C.; Romero, E. Aggressors and Victims in Bullying and Cyberbullying: A Study of Personality Profiles using the Five-Factor Model. Span J. Psychol. 2017, 20, E76. [Google Scholar] [CrossRef]
- Chavan, V.S.; Shylaja, S.S. Machine learning approach for detection of cyber-aggressive comments by peers on social media network. In Proceedings of the 2015 International Conference on Advances in Computing, Communications and Informatics (ICACCI), Kochi, India, 10–13 August 2015; pp. 2354–2358. [Google Scholar]
- Dinakar, K.; Jones, B.; Havasi, C.; Lieberman, H.; Picard, R. Common Sense Reasoning for Detection, Prevention, and Mitigation of Cyberbullying. ACM Trans. Interact. Intell. Syst. 2012, 2. [Google Scholar] [CrossRef] [Green Version]
- Mangaonkar, A.; Hayrapetian, A.; Raje, R. Collaborative detection of cyberbullying behavior in Twitter data. In Proceedings of the 2015 IEEE International Conference on Electro/Information Technology (EIT), Dekalb, IL, USA, 21–23 May 2015; pp. 611–616. [Google Scholar]
- Nahar, V.; Li, X.; Pang, C.; Zhang, Y. Cyberbullying Detection Based on Text-Stream Classification. In Proceedings of the Conferences in Research and Practice in Information Technology Series, Australian Computer Society, Canberra, Australia, 13–15 November 2013; Volume 146, pp. 49–58. [Google Scholar]
- Sugandhi, R.; Pande, A.; Agrawal, A.; Bhagat, H. Automatic Monitoring and Prevention of Cyberbullying. J. Netw. Comput. Appl. 2016, 144, 17–19. [Google Scholar] [CrossRef]
- Japkowicz, N.; Stephen, S. The class imbalance problem: A systematic study1. IDA 2002, 6, 429–449. [Google Scholar] [CrossRef]
- Mitsopoulou, E.; Giovazolias, T. Personality traits, empathy and bullying behavior: A meta-analytic approach. Aggress. Violent Behav. 2015, 21, 61–72. [Google Scholar] [CrossRef]
- Sun, T.; Gaut, A.; Tang, S.; Huang, Y.; ElSherief, M.; Zhao, J.; Mirza, D.; Belding, E.; Chang, K.-W.; Wang, W.Y. Mitigating Gender Bias in Natural Language Processing: Literature Review. arXiv 2019, arXiv:1906.08976. [Google Scholar]
- Zhao, J.; Wang, T.; Yatskar, M.; Ordonez, V.; Chang, K.-W. Men Also Like Shopping: Reducing Gender Bias Amplification using Corpus-level Constraints. arXiv 2017, arXiv:1707.09457. [Google Scholar]
Figure 1.
Overview of the methodology followed.
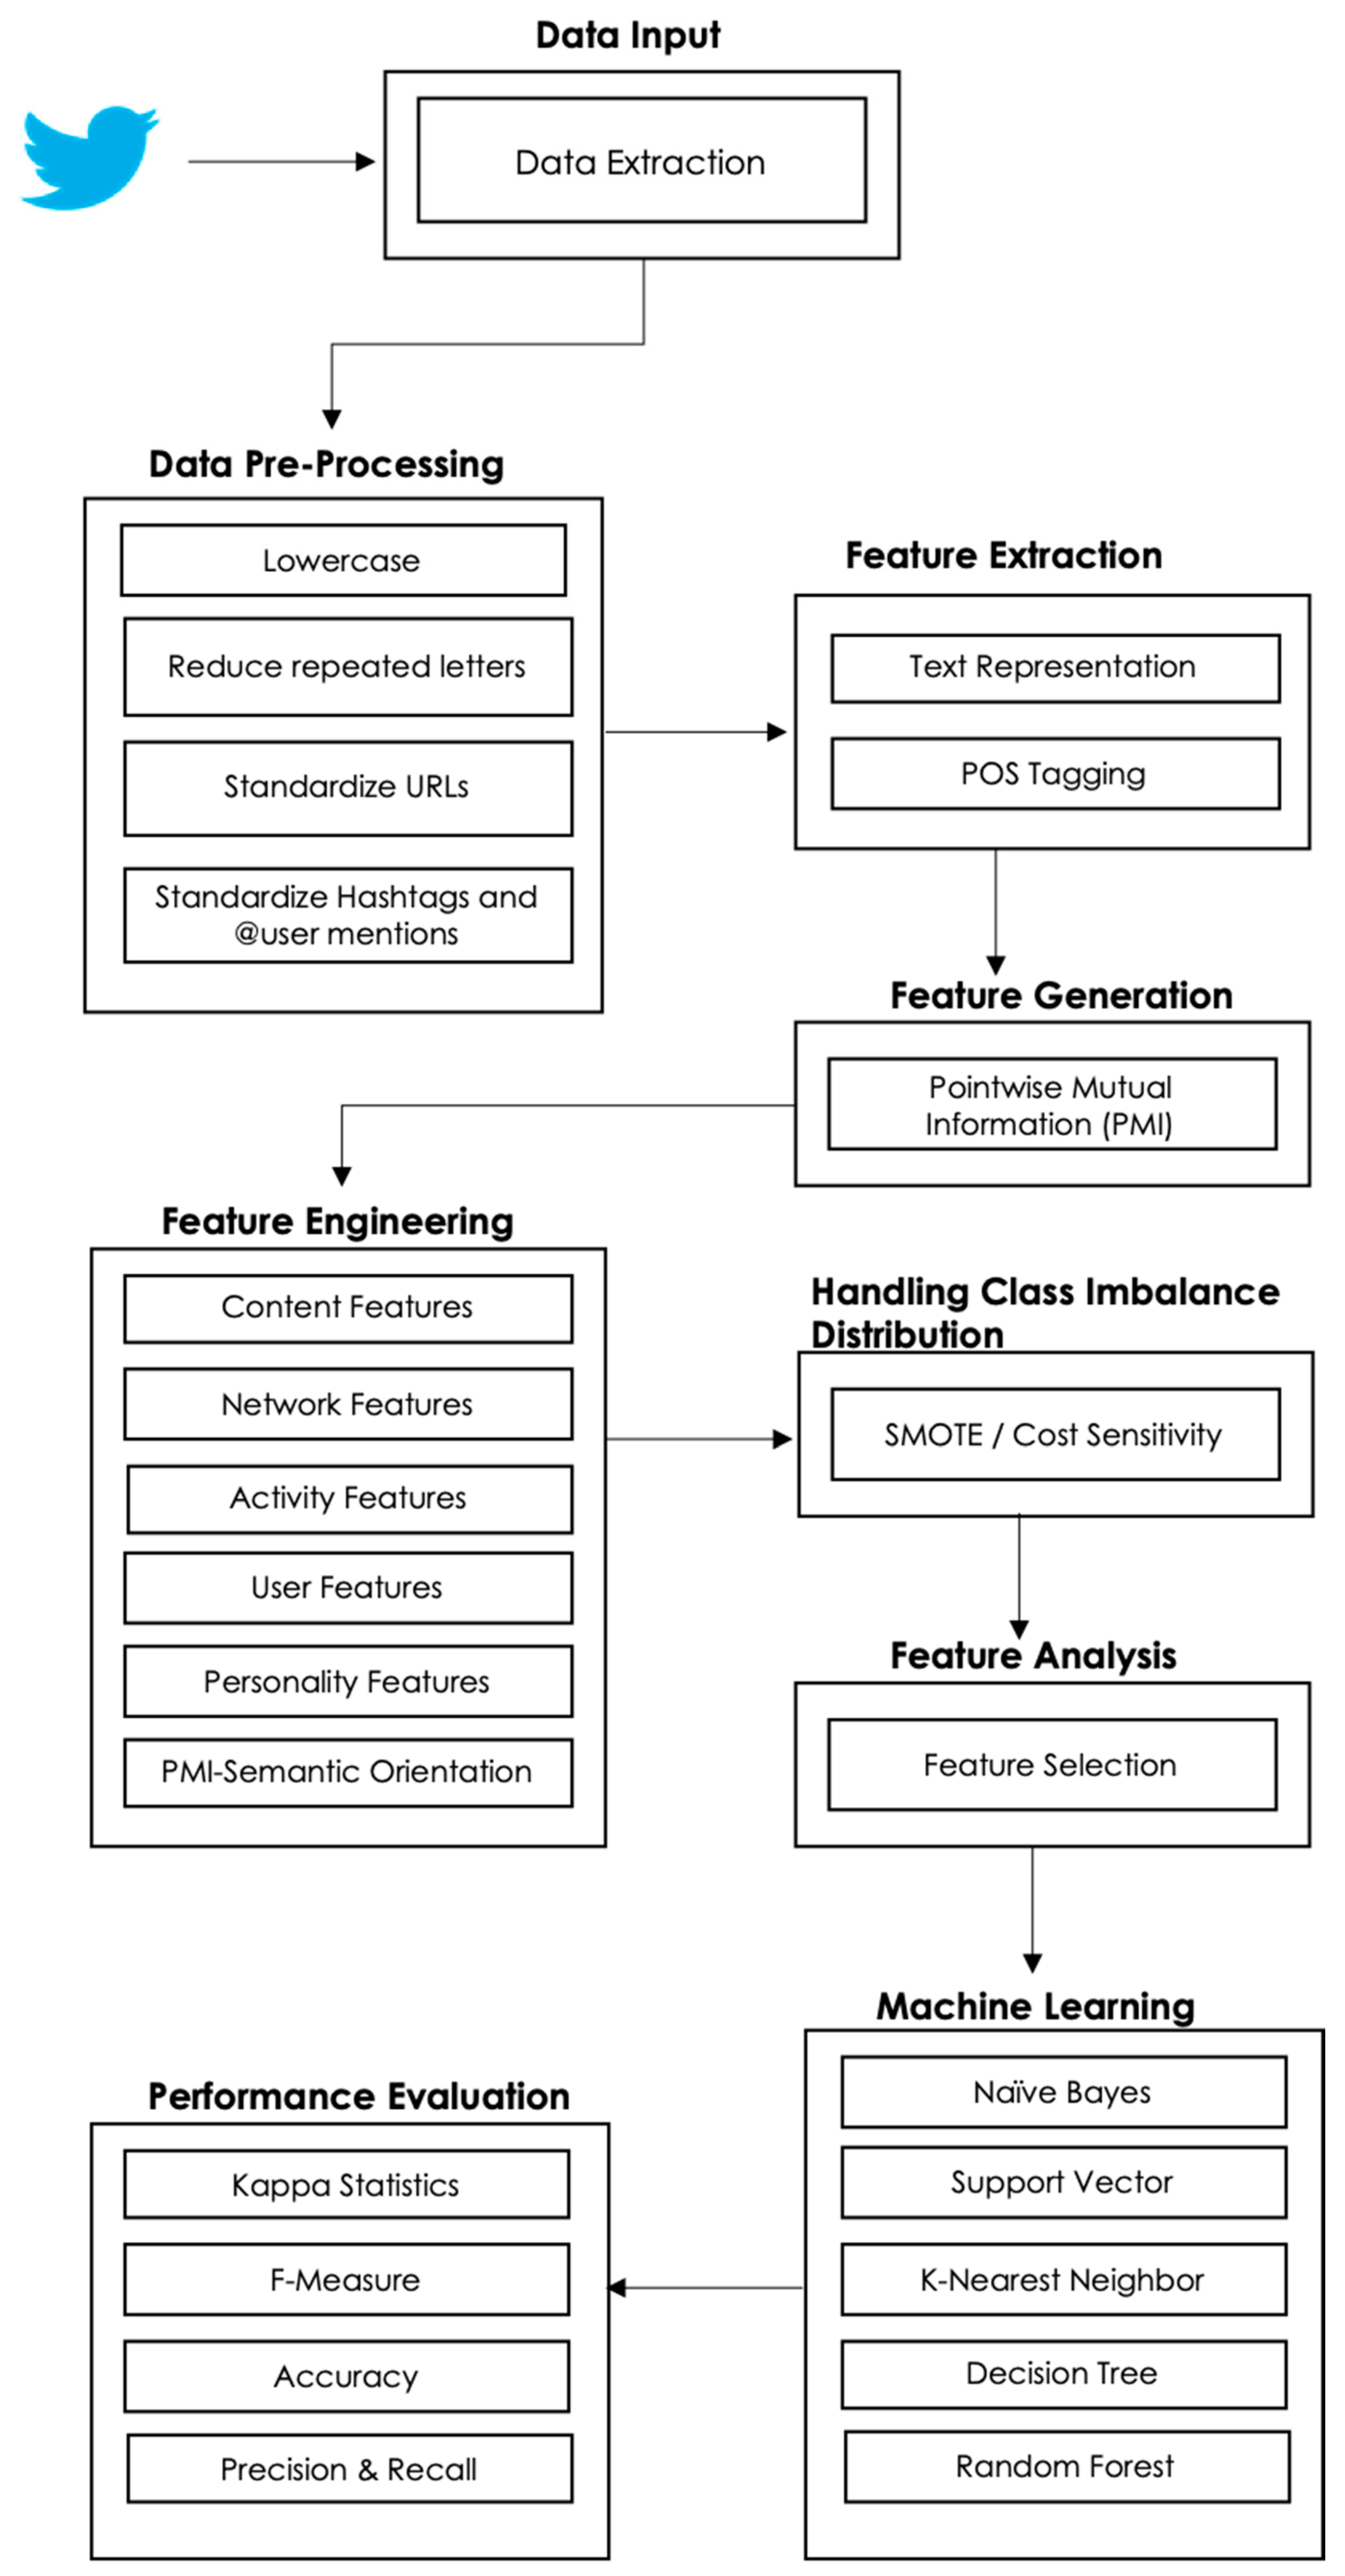
Figure 2.
Annotated Dataset Distribution of Classes.
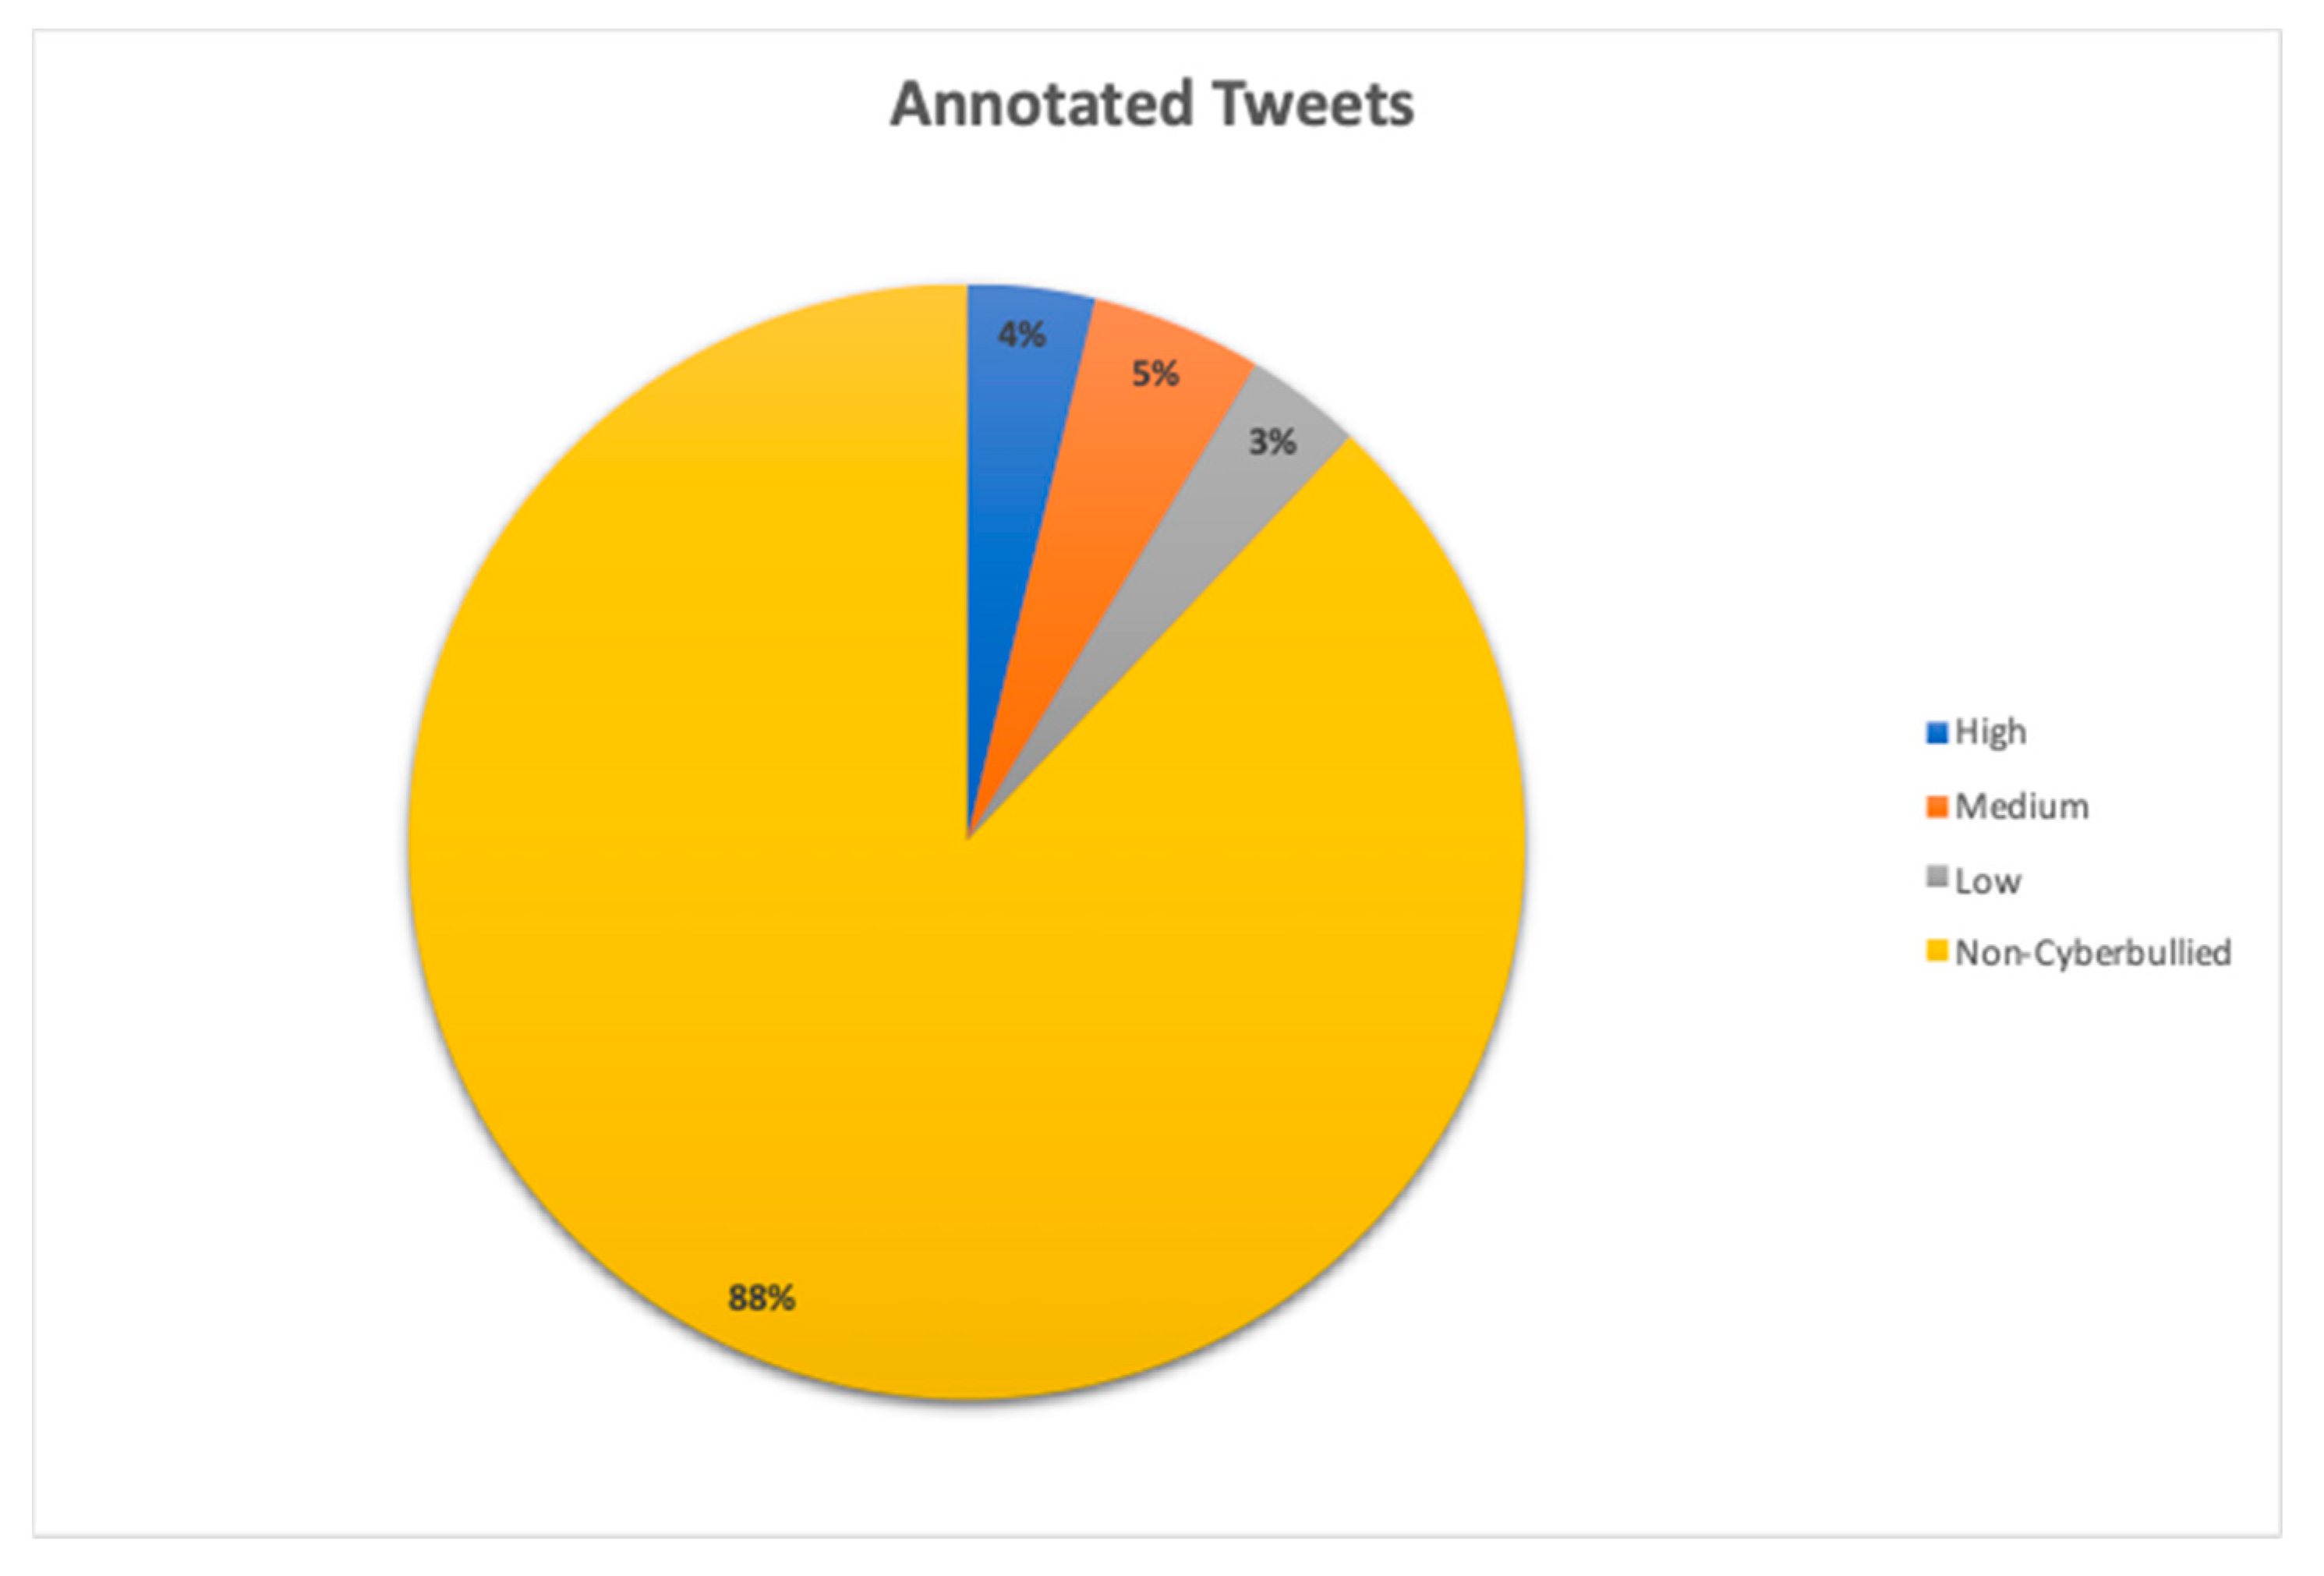
Figure 3.
Results achieved with Bag of Words (baseline 1).

Figure 4.
Results achieved with Word to Vector (baseline 2).

Figure 5.
Results achieved with the proposed method.
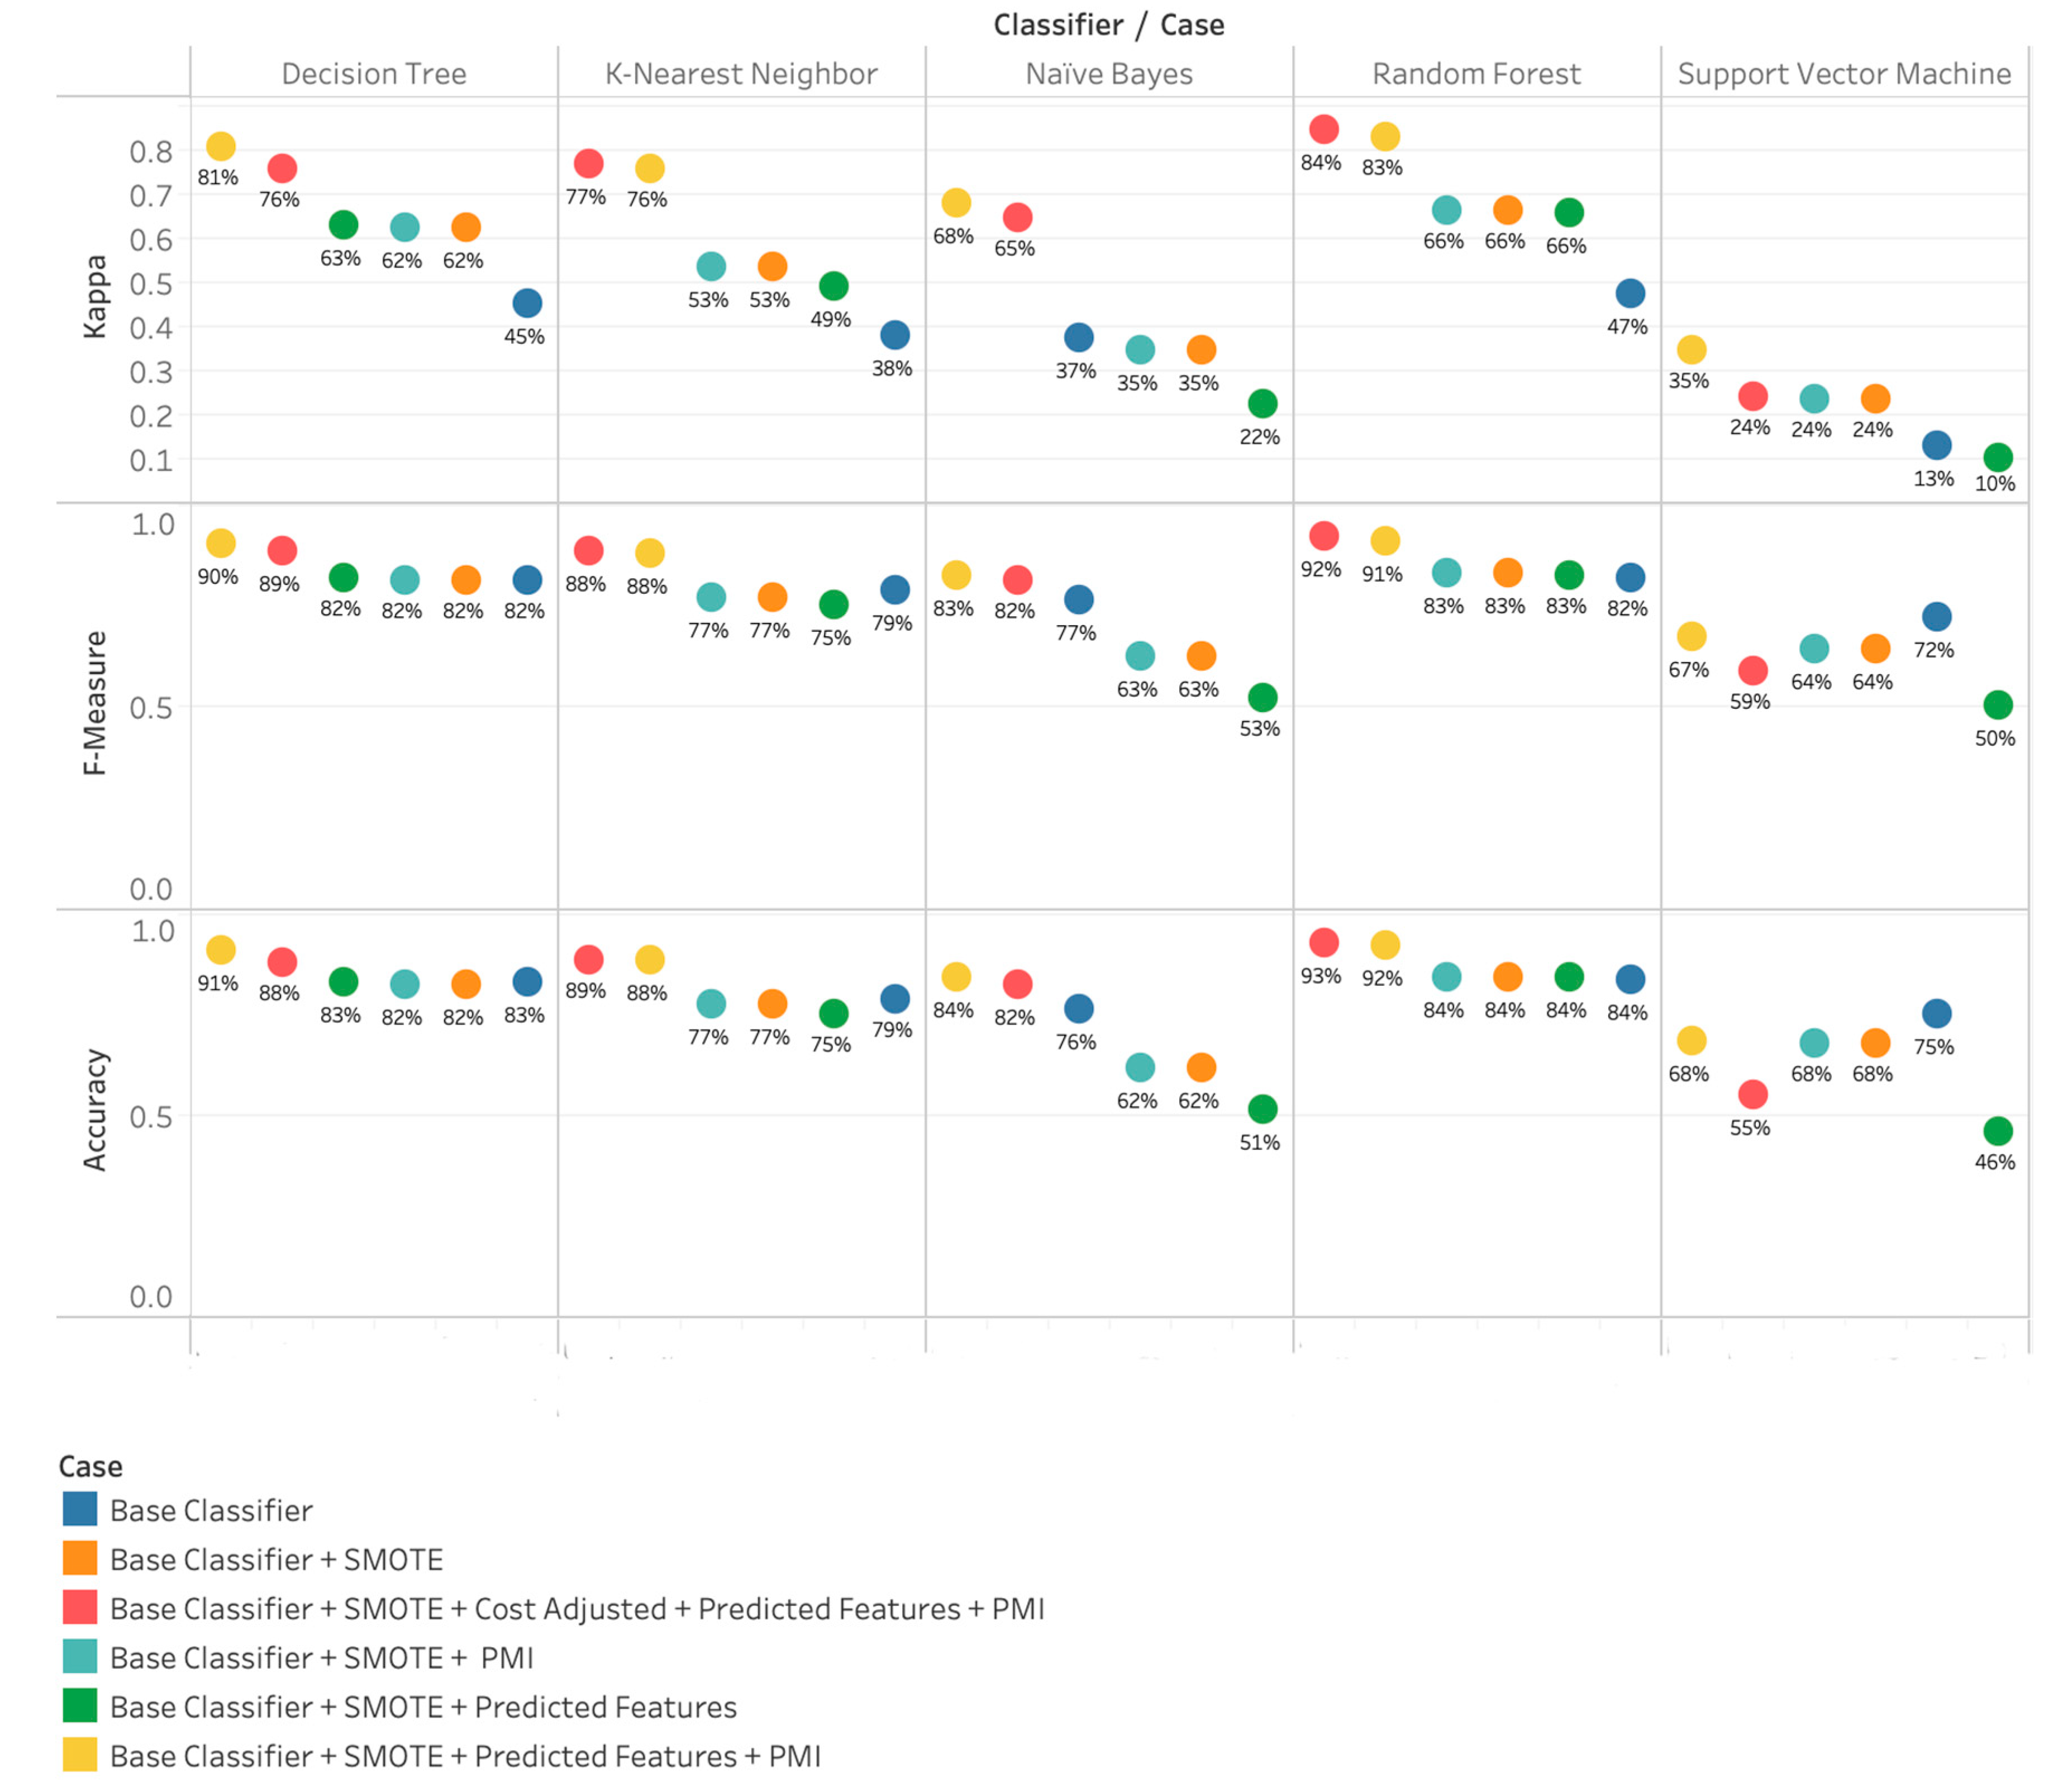
Figure 6.
Comparison of baseline approach with the proposed approach.

Figure 7.
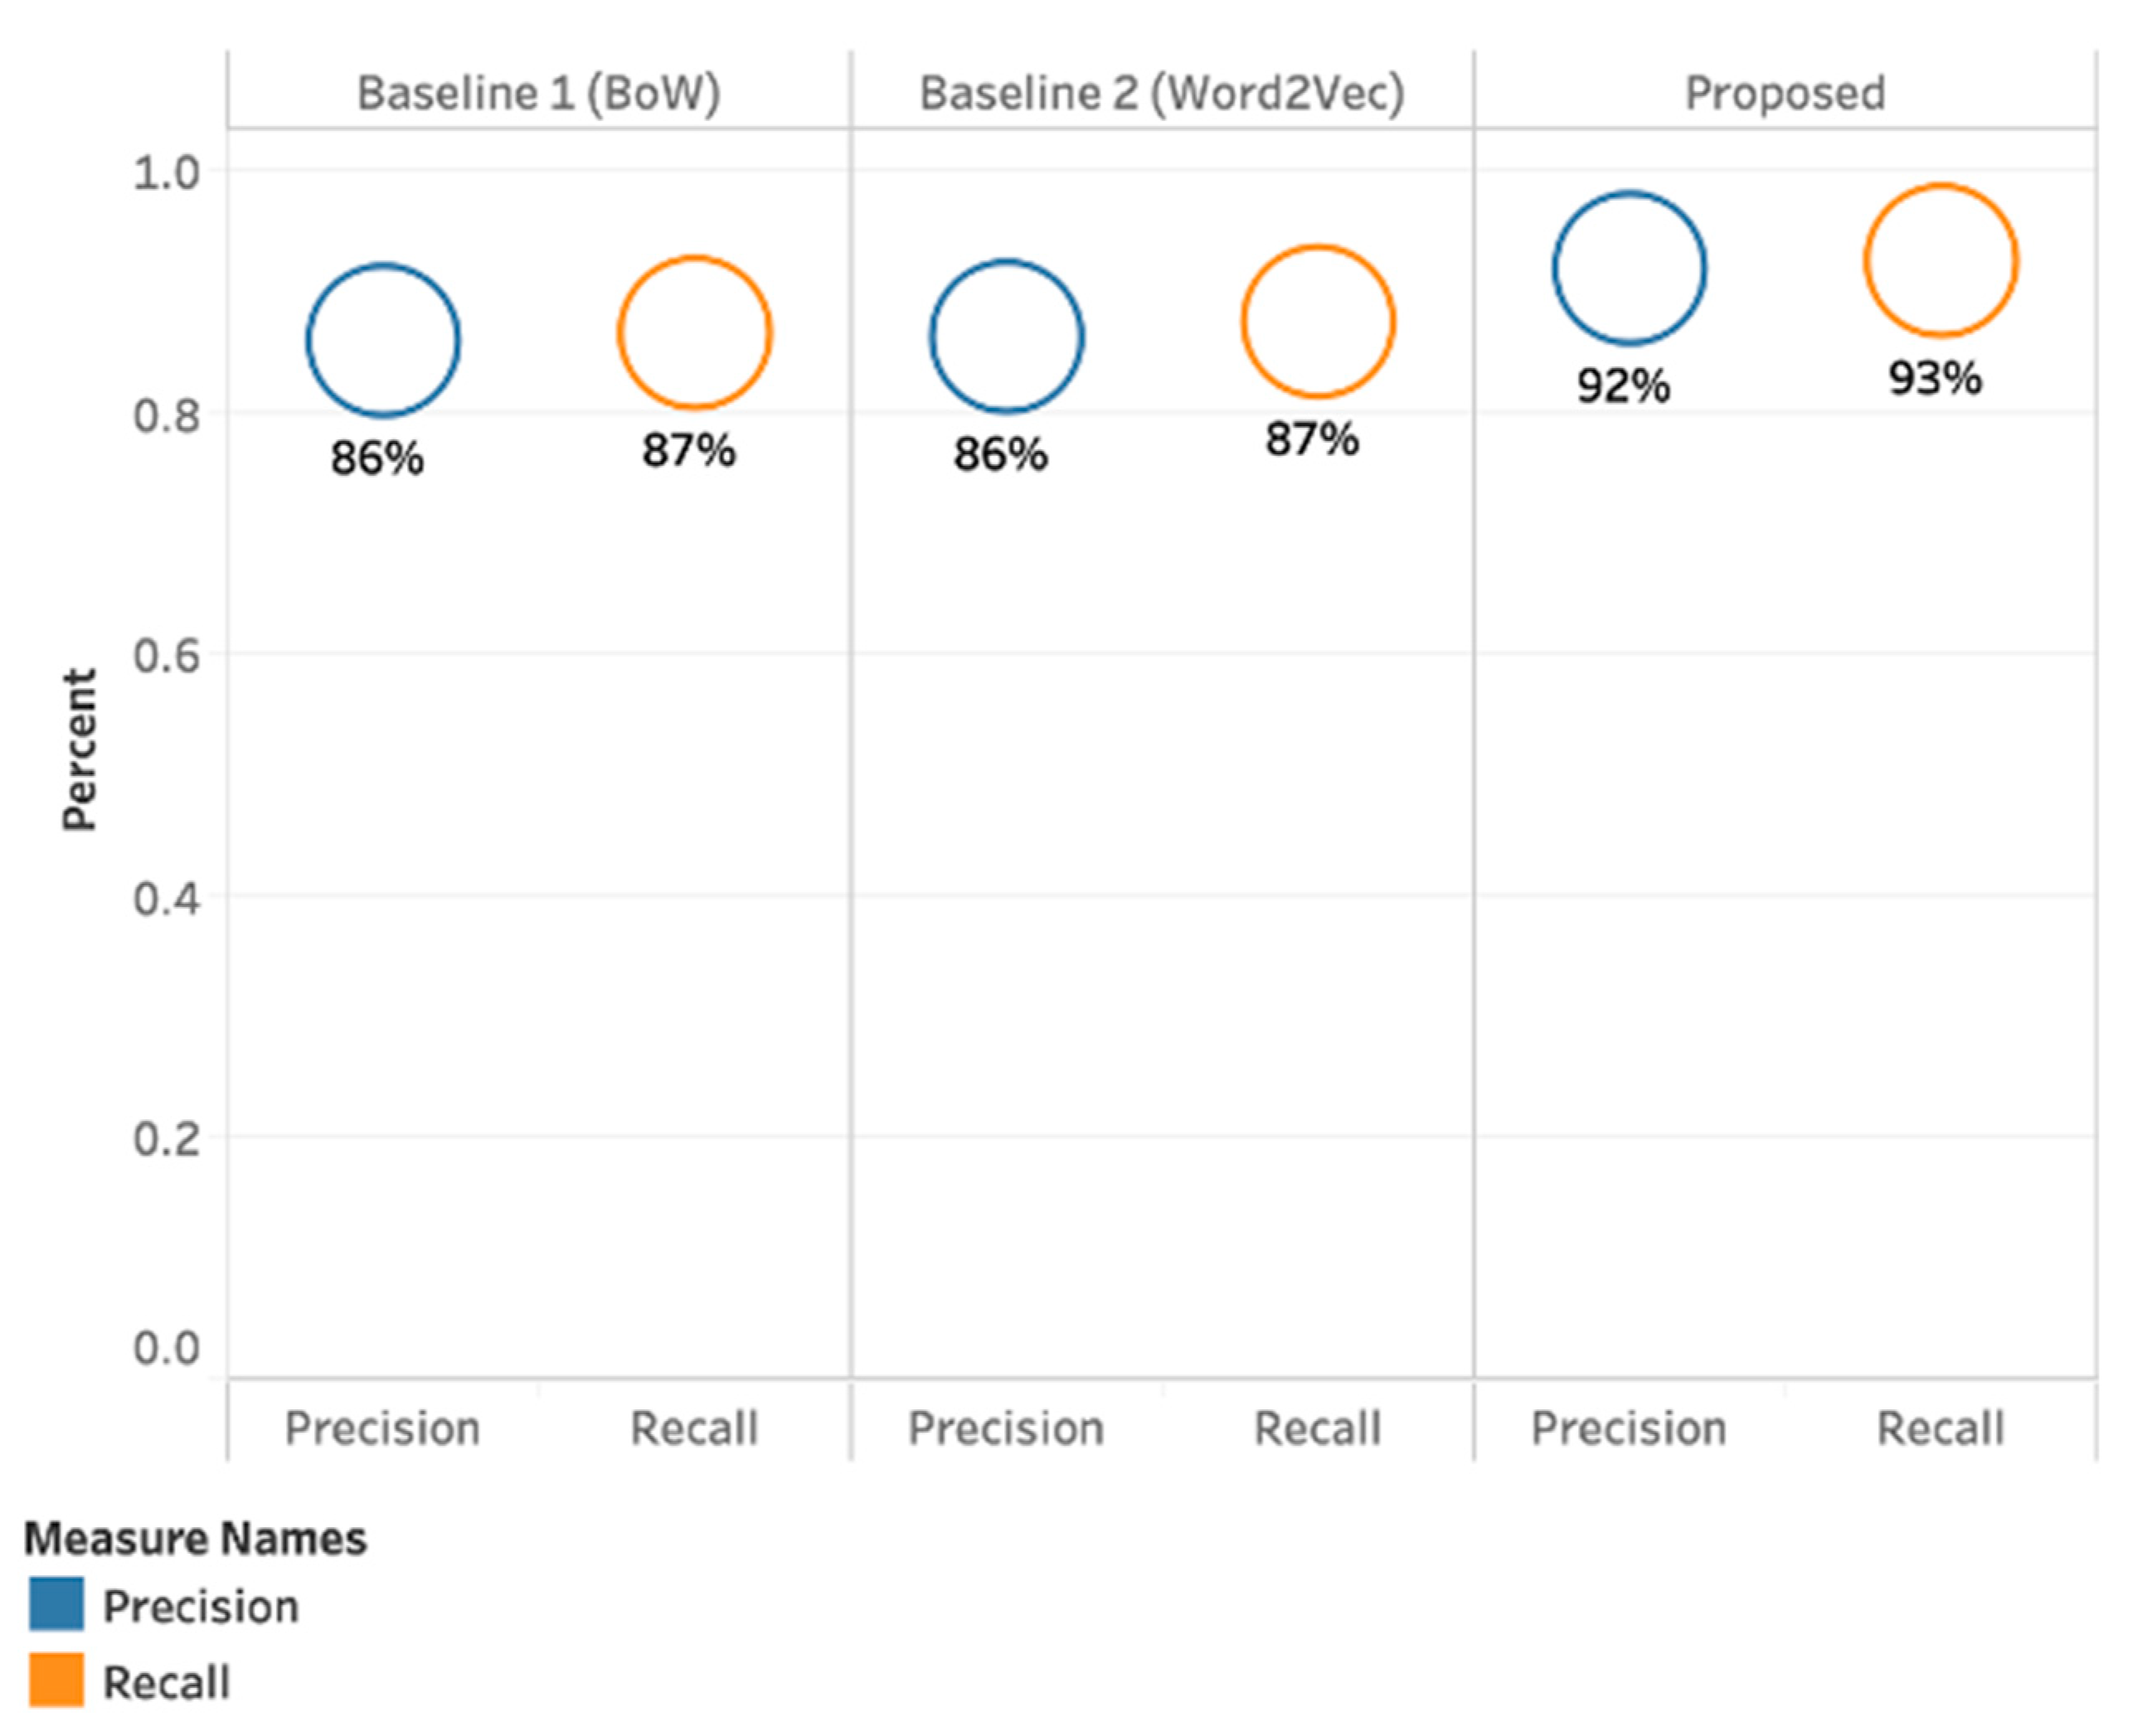
Precision and Recall for baseline and the proposed approach.

Figure 8.
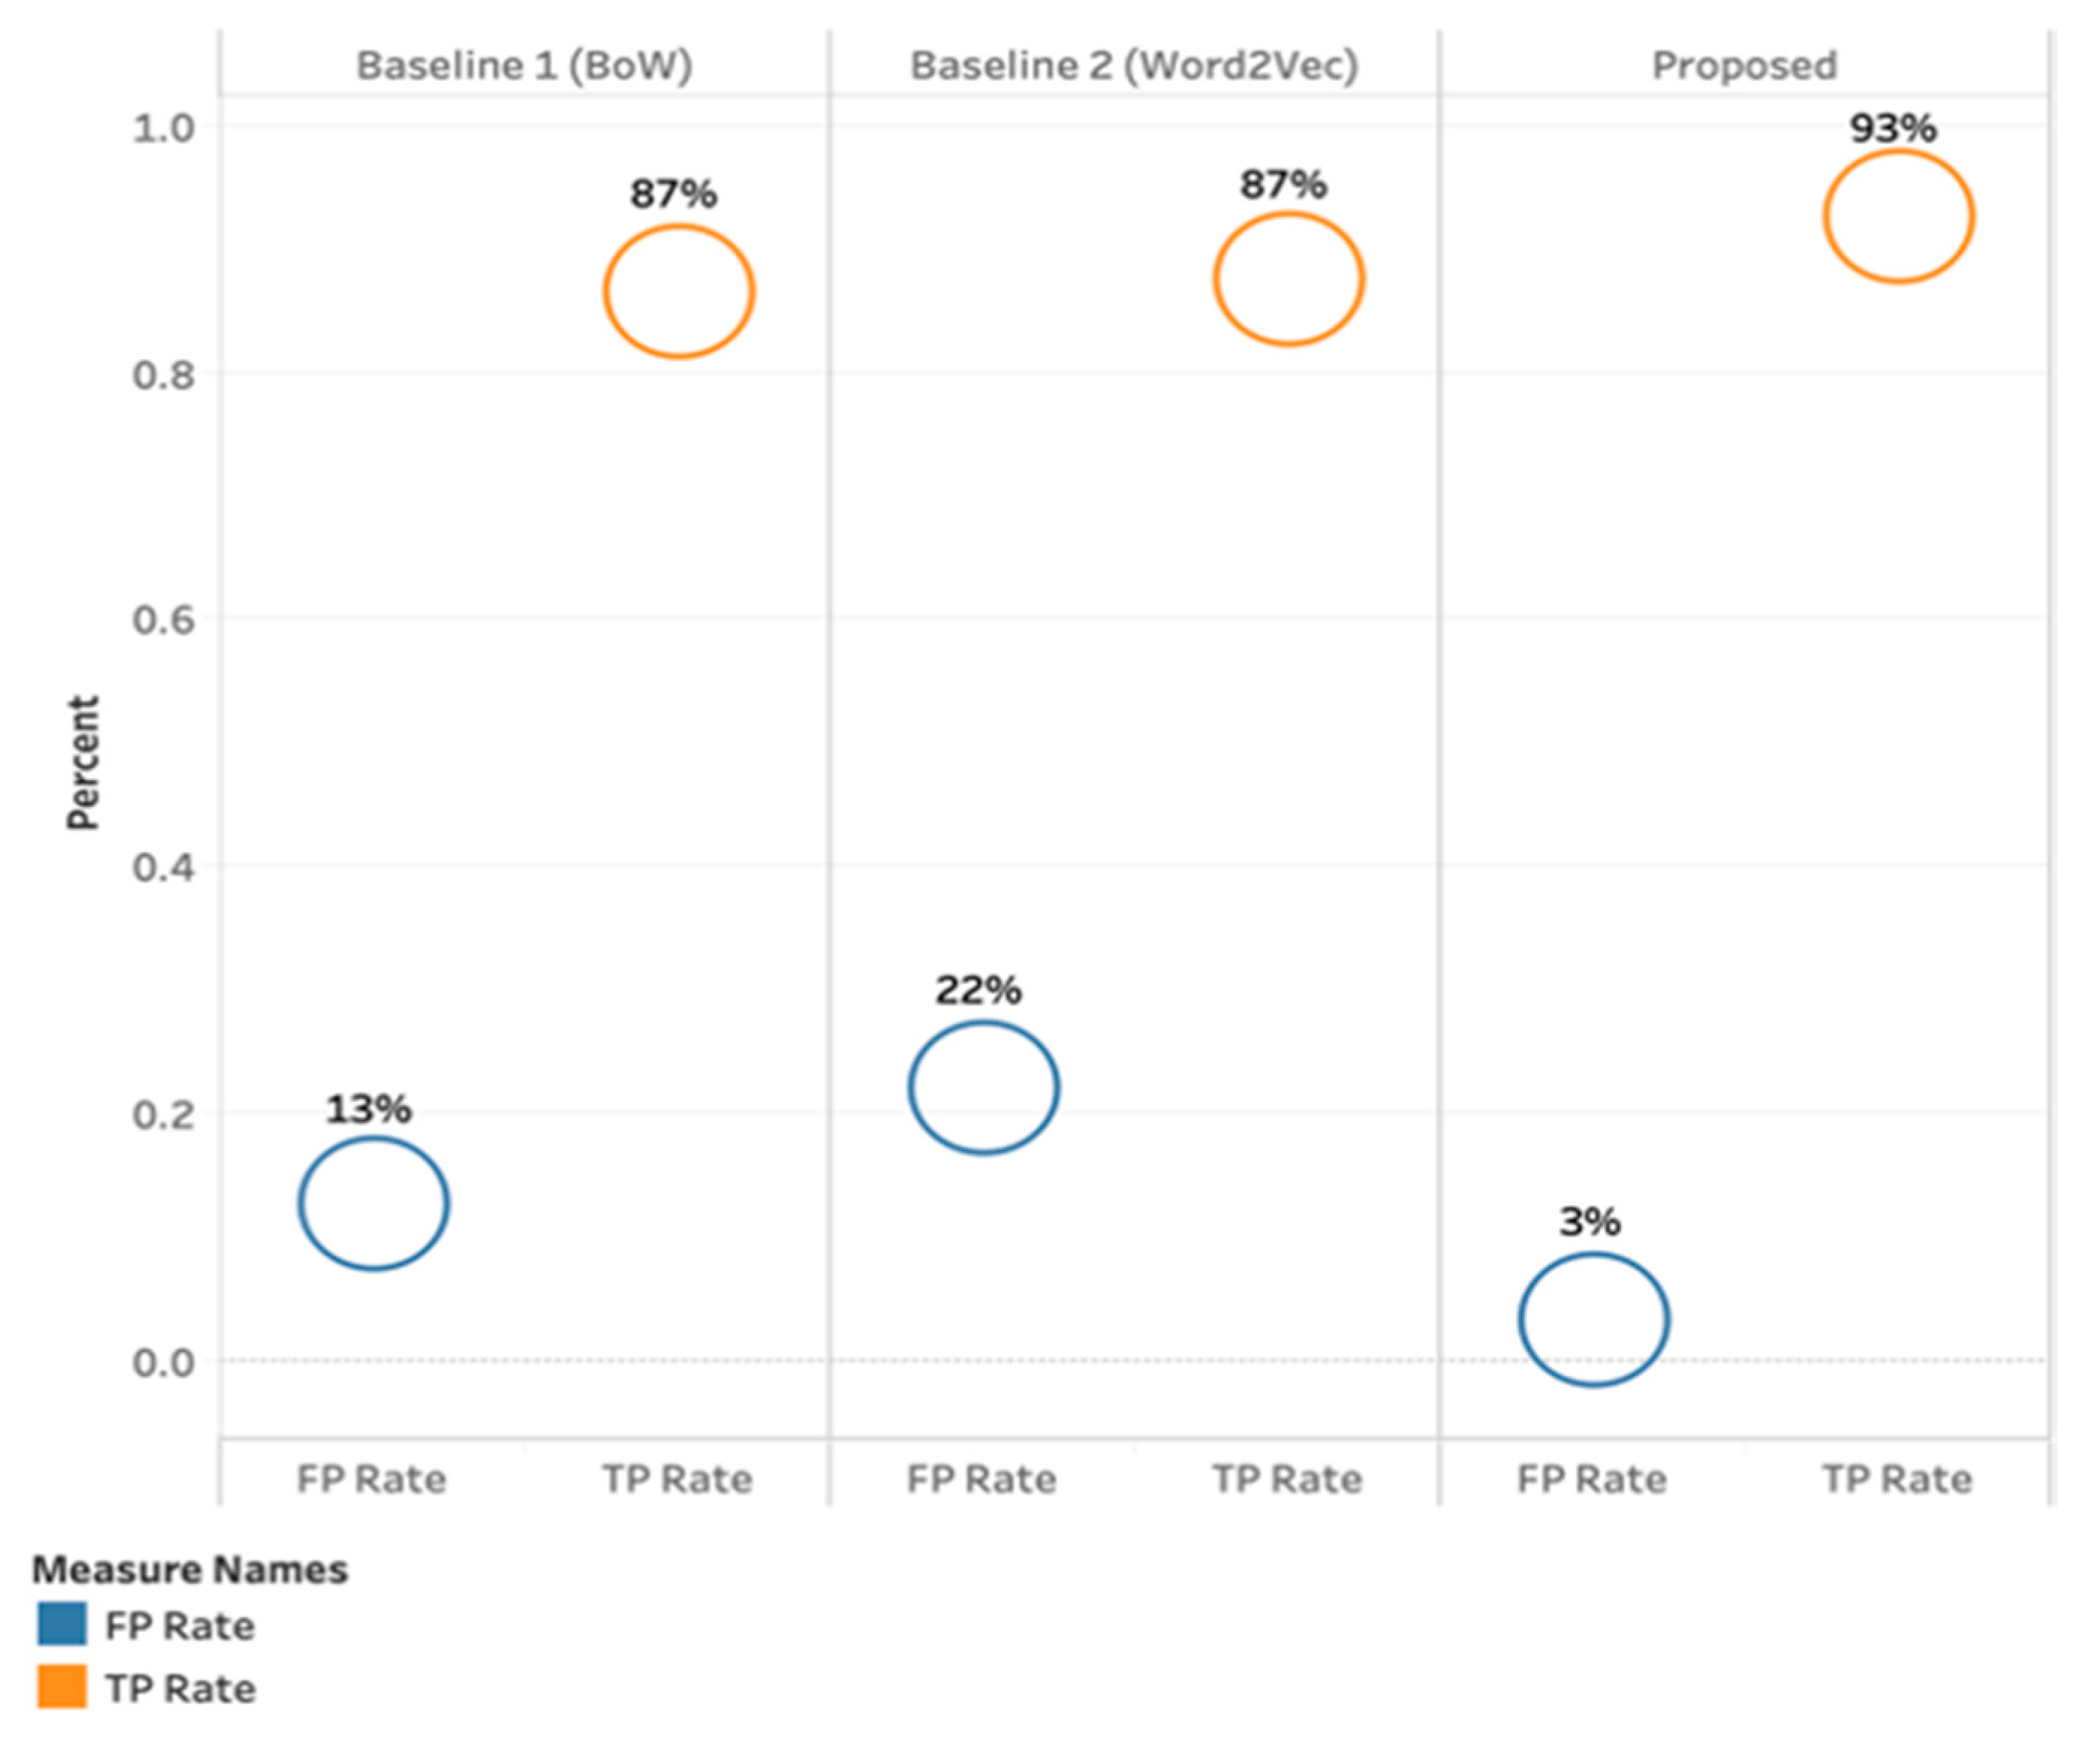
True and False positive rate for baseline and the proposed approach.

Figure 9.
Multinomial Logistic Regression—Odds Ratio.
Publisher’s Note: MDPI stays neutral with regard to jurisdictional claims in published maps and institutional affiliations. |
© 2020 by the authors. Licensee MDPI, Basel, Switzerland. This article is an open access article distributed under the terms and conditions of the Creative Commons Attribution (CC BY) license (http://creativecommons.org/licenses/by/4.0/).
Share and Cite
MDPI and ACS Style
Talpur, B.A.; O’Sullivan, D. Multi-Class Imbalance in Text Classification: A Feature Engineering Approach to Detect Cyberbullying in Twitter. Informatics 2020, 7, 52. https://0-doi-org.brum.beds.ac.uk/10.3390/informatics7040052
AMA Style
Talpur BA, O’Sullivan D. Multi-Class Imbalance in Text Classification: A Feature Engineering Approach to Detect Cyberbullying in Twitter. Informatics. 2020; 7(4):52. https://0-doi-org.brum.beds.ac.uk/10.3390/informatics7040052
Chicago/Turabian StyleTalpur, Bandeh Ali, and Declan O’Sullivan. 2020. "Multi-Class Imbalance in Text Classification: A Feature Engineering Approach to Detect Cyberbullying in Twitter" Informatics 7, no. 4: 52. https://0-doi-org.brum.beds.ac.uk/10.3390/informatics7040052
Note that from the first issue of 2016, this journal uses article numbers instead of page numbers. See further details here.