Article

Voltage-Based Hybrid Algorithm Using Parameter Variations and Stockwell Transform for Islanding Detection in Utility Grids

1
Power System Planning Division, Rajasthan Rajya Vidyut Prasaran Nigam Ltd., Vidyut Bhawan, Japur 302005, India
2
Department of Electrical Engineering, Vedant College of Engineering & Technology, Bundi 323021, India
3
Department of Electrical and Computer Engineering, Hawssa University, Hawassa-5, Ethiopia
4
Department of Electrical Engineering, Faculty of Engineering and Architecture, J.N.V. University, Jodhpur 342011, India
*
Author to whom correspondence should be addressed.
Submission received: 17 February 2021 / Revised: 21 March 2021 / Accepted: 22 March 2021 / Published: 25 March 2021
(This article belongs to the Special Issue Digitalisation, Green Deal and Sustainability)

Abstract

:
This paper has introduced an algorithm for the identification of islanding events in the remotely located distribution grid with renewable energy (RE) sources using the voltage signals. Voltage signal is processed using Stockwell transform (ST) to compute the median-based islanding recognition factor (MIRF). The rate of change in the root mean square (RMS) voltage is computed by differentiating the RMS voltage with respect to time to compute the voltage rate of change in islanding recognition factor (VRCIRF). The proposed voltage-based islanding recognition factor (IRFV) is computed by multiplying the MIRF and VRCIRF element to element. The islanding event is discriminated from the faulty and operational events using the simple decision rules using the peak magnitude of IRFV by comparing peak magnitude of IRFV with pre-set threshold values. The proposed islanding detection method (IDM) effectively identified the islanding events in the presence of solar energy, wind energy and simultaneous presence of both wind and solar energy at a fast rate in a time period of less than 0.05 cycles compared to the voltage change rate (ROCOV) and frequency change rate (ROCOF) IDM that detects the islanding event in a time period of 0.25 to 0.5 cycles. This IDM provides a minimum non-detection zone (NDZ). This IDM efficiently discriminated the islanding events from the faulty and switching events. The proposed study is performed on an IEEE-13 bus test system interfaced with renewable energy (RE) generators in a MATLAB/Simulink environment. The performance of the proposed IDM is better compared to methods based on the use of ROCOV, ROCOF and discrete wavelet transform (DWT).

1. Introduction

Renewable energy (RE) provides clean energy to the consumers and reduces transmission losses when integrated to the grid in large quantum near-load centers. The structure of the conventional power network has been modified, and the power network is smarter and more efficient. In addition, problems arise because of grid convergence that urgently needs to be solved. Unintentional islanding is an important problem that can lead to poor quality of power (PQ), frequency instability and a risk to the personal safety of the consumer. Hence, it becomes essential for detecting this scenario accurately and reliably to isolate islanded network immediately [1]. According to the IEEE Std. 1547, the islanding event should be identified within 2 s after it has an incident on the network. The methods of islanding detection (IDMs) are graded into passive IDM, active IDM and hybrid IDM [2]. For identification of the islanding, passive IDMs use under/over voltage, under/over frequency, voltage phase jump, voltage harmonics and current harmonics. The drawback of passive methods is a large non-detection zone (NDZ). Injection of small disturbances at the point of typical coupling (PCC) and identification of changes in device parameters are used in active methods [3]. In [4], authors described a signal processing supported phaselet algorithm for recognition of an islanding event. Considering a data window that is not limited to an integer multiplication of a half-cycle, phaselets were used to compute phasors. These phaselets are useful for measurement of the island and non-island scenario characteristics. This has the benefit that the islanding detection role is performed without injecting a power network interference or high frequency signal. This method is, therefore, more precise and accurate. There is no reduction in the quality of power. In [5], authors included a comprehensive review literature to compile the research activities already done by the researchers in the field of islanding detection. Different reported techniques have been reviewed, and their non-detection zone (NDZ) and speed of detection have been compared and analyzed in detail. Further, analysis of the various anti-islanding standards has also been considered. Hence, authors included good volume of information and clear vision to researchers for determining the islanding method that best suits the particular application. Recognition of islanding events using a Stockwell transform (ST)-based approach is reported in [6]. Islanding recognition using ST and the Hilbert-transform-based method is reported in [7,8]. In [9], the authors proposed a passive IDM using a hybridization of modified slantlet transform (MSLT) and machine learning for islanding detection in the presence of multiple distributed generation (DG) plants. MSLT is used to compute features for the identification, and machine leaning is used to classify the islanding events from other disturbance events. This method has the merits of reduced impact of noise senility, easy section of signal, fast training using a minimum dataset and low detection time. A method for identification of islanding events for a grid-connected solar photovoltaic (PV) system using slantlet transform, and differentiating these events from fault and switching events using ridgelet probabilistic neural network (EPNN) is investigated in [10]. This approach is insensitive to external grid disturbances and effectively detects islanding with good accuracy. In [11], authors investigated an islanding recognition scheme that can be applied to microgrids. This is based on the use of variational mode decomposition supported singular entropy. It is effective in detecting islanding events in a time period of a half cycle. Further, power electronics-based devices are employed recently for improving the performance of grids. In [12], authors designed a control scheme based on grasshopper optimization algorithm, which is less complex in nature to control the voltage of a dynamic voltage restorer (DVR) and the improvement in quality of power in utility grids. A distributed flexible alternating current (AC) transmission system (FACTS) stabilization scheme to effectively utilize the distributed generation using wind power plants is introduced by the authors in [13]. It provides high-speed controllability and maintains capability to correct power factor and also provides voltage support. The main contributions of the paper are as follows:
  • An islanding detection method (IDM) based on the use of voltage signals is proposed in this paper.
  • Features extracted from the voltage signal using the ST and rate of change in RMS voltage are used to define a voltage-based islanding recognition factor (IRFV).
  • Islanding events are discriminated from the faulty and operational events using simple decision rules based on the peak magnitude of IRFV.
  • Proposed IDM is effective to detect islanding events with minimum NDZ.
  • Proposed IDM is more effective compared to the method based on the rate of change in voltage and a discrete wavelet transform (DWT)-based method.
This manuscript is structured in eight sections. The first section introduces the proposed research work, an exhaustive review of existing methods used for islanding recognition and research contribution of this manuscript. The test system of a remotely located distribution grid, wind power plant and solar PV plant are described in Section 2. The proposed voltage-based algorithm used for the identification of islanding events and mathematical formulation are summarized in Section 3. The results of the simulation to identify islanding, operational and fault events are discussed in Section 4. The results for the identification of NDZ are discussed in Section 5. The results to classify the islanding events, fault events and operational events in different categories using the decision rules supported by peak magnitude of the voltage-based IRF are illustrated in Section 6, and Section 7 includes the study to compare the performance of the proposed algorithm with the algorithms reported in literature. Finally, research conclusions and possible future work are discussed in Section 8.

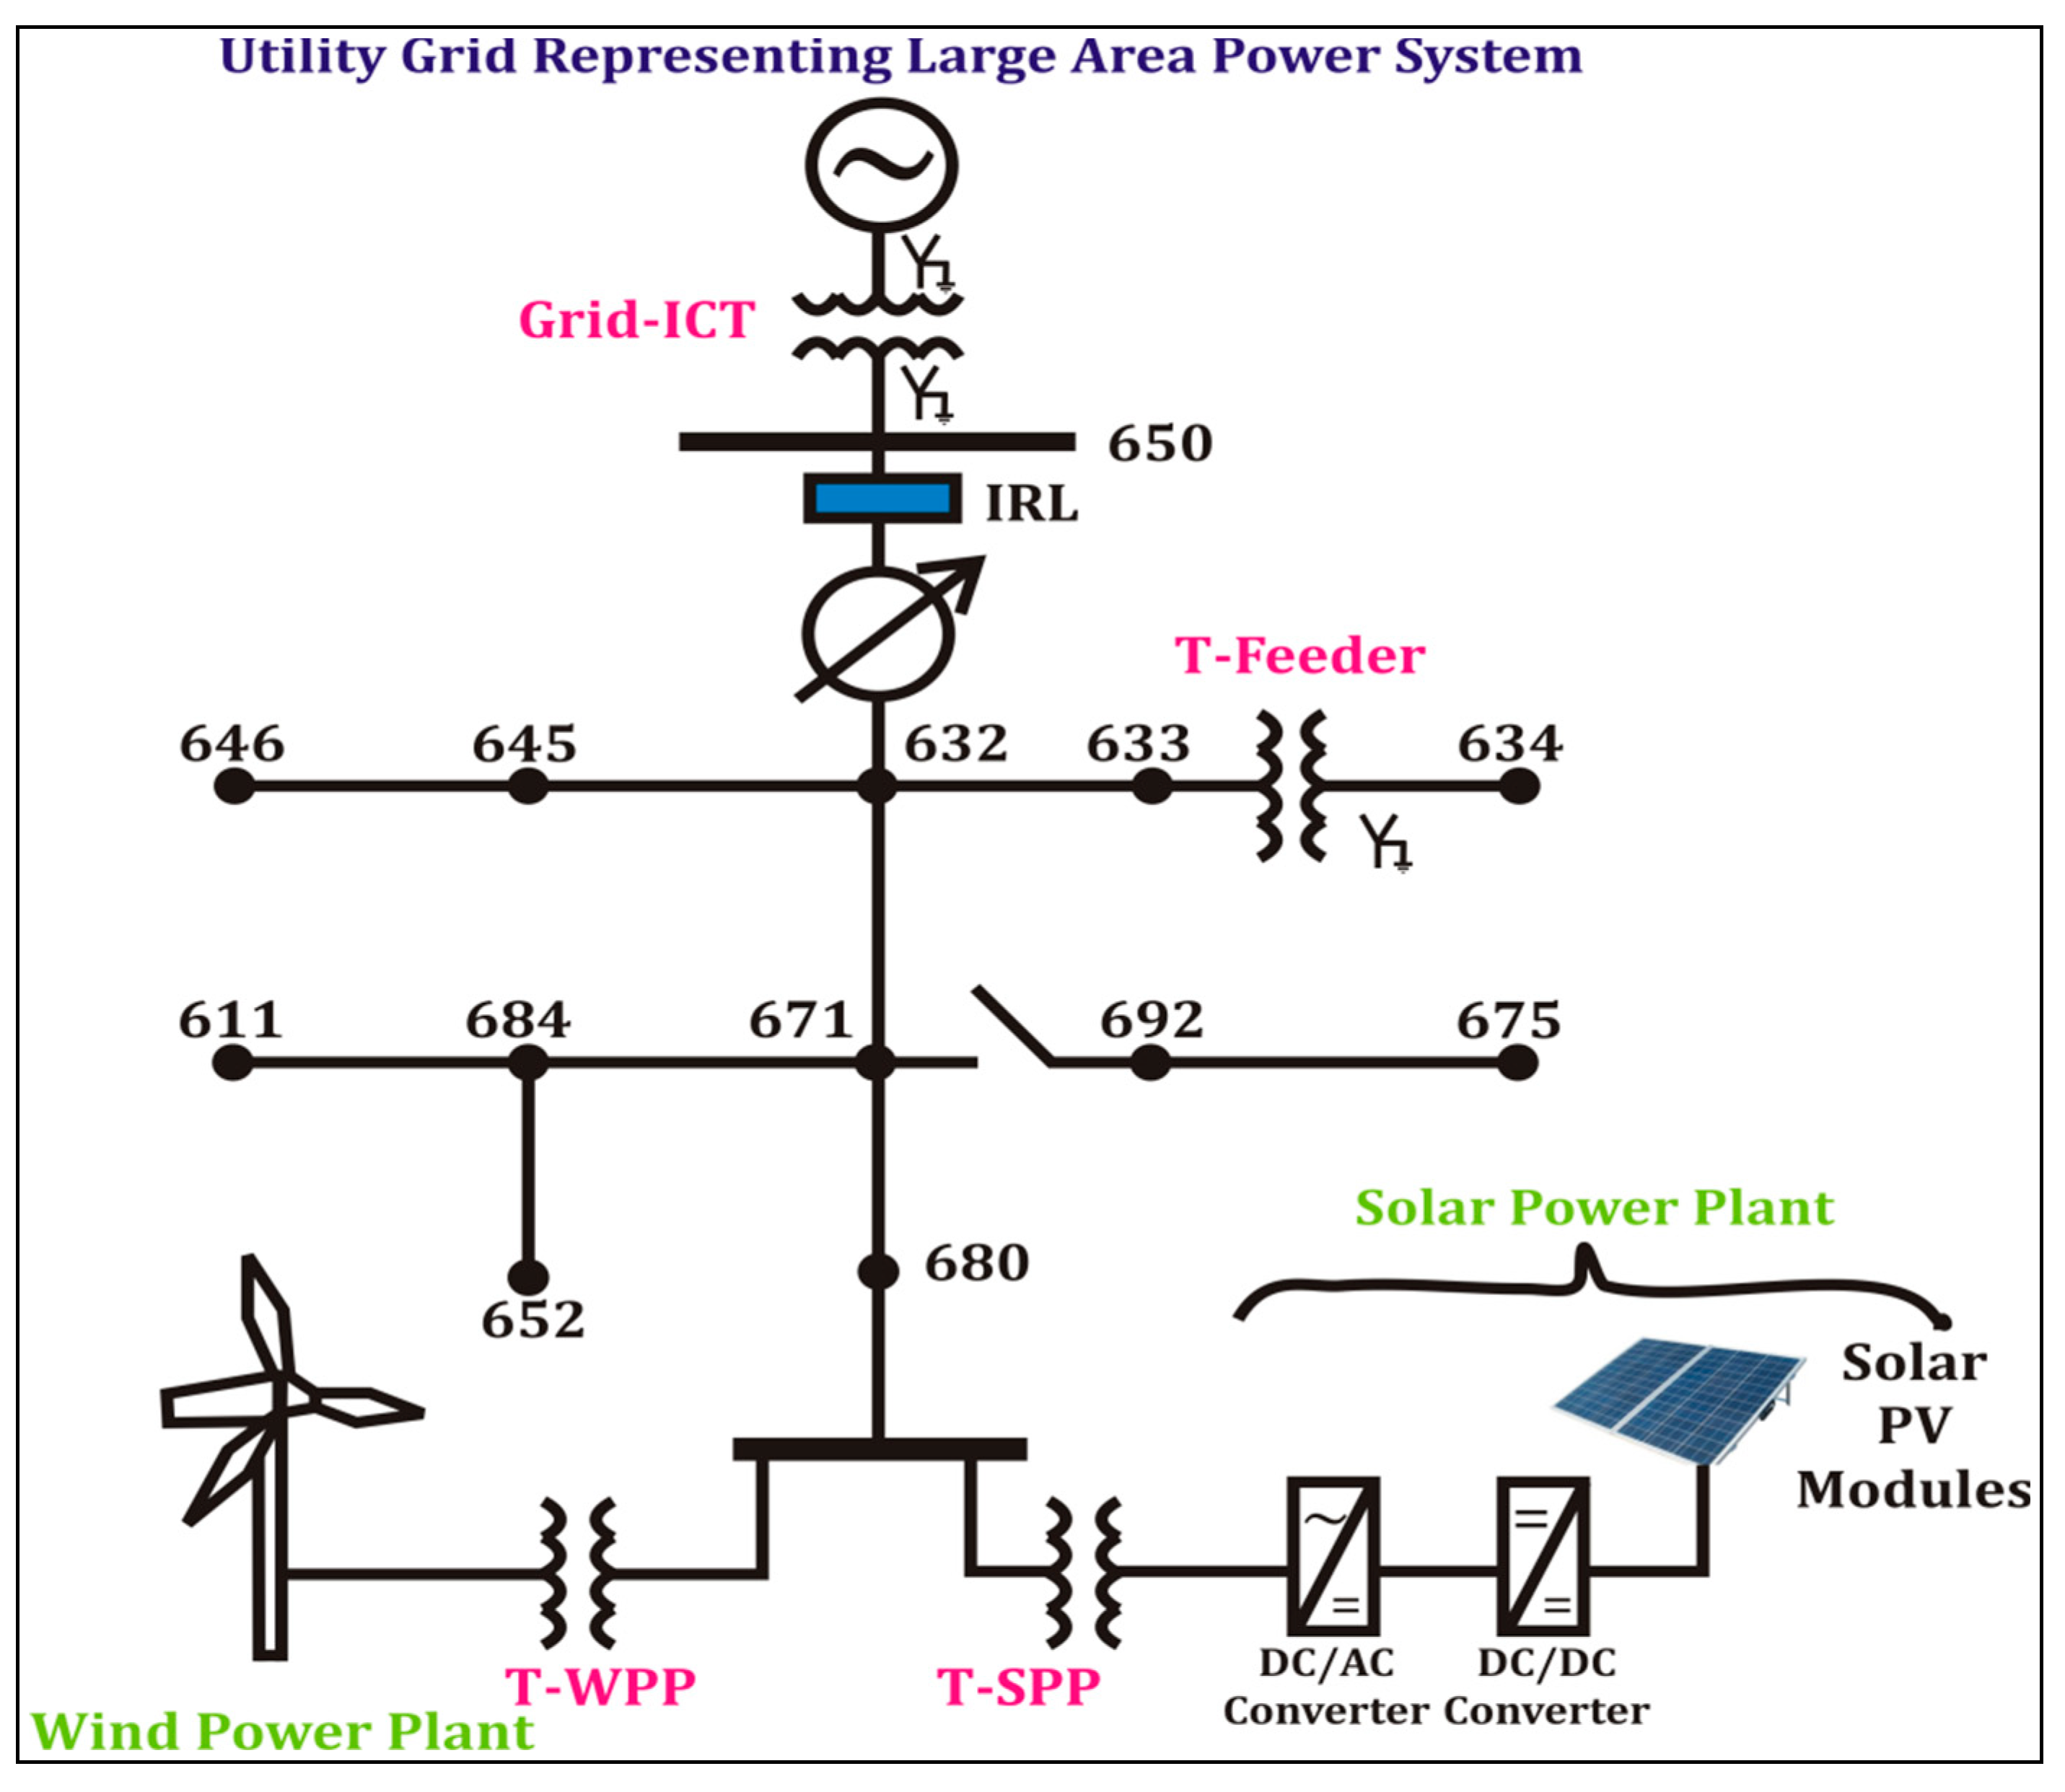
2. Test Grid of IEEE-13 Nodes

Various operational, islanding and defective events to evaluate the performance of the proposed algorithm are simulated on an IEEE-13 node test system interfaced to wind and solar power plants realized as a remotely located distribution grid. This test grid is designed by the IEEE to operate at 60 Hz, 5 MVA and feeders/loads at two voltage levels of 4.16 and 0.48 kV. In the designed remotely located grid network, all the loads considered are balanced in nature. This is assumed because even if there is a single-phase load, then the same will be supplied from different phases so that a balanced load will be experienced at the sending end of the feeder. The load quantum used for various nodes of the test remotely located grid are tabulated in Table 1. Details of the capacitors used in the power network are also provided in Table 1. All loads considered are constant active and reactive powers in nature and connected in star configuration. Further, a wind power plant (WPP) of capacity 1.5 MW and a solar power plant (SPP) of capacity 1 MW are integrated on the bus 680 of the test remotely located grid, as detailed in Figure 1. Thus, for the purpose of grid integration of renewable energy generators, node 680 of the remotely located distribution test grid will be considered as the point of common coupling (PCC). WPP is based on the doubly fed induction generator (DFIG) and integrated to the test grid using a transformer, which is assigned the symbol T-WPP. Further, a photovoltaic (PV)-based solar power plant (SPP) of capacity 1 MW is also integrated on node 680 of the remotely located distribution grid through a transformer, which is assigned the symbol T-SPP. To sustain the nodes 633 and 634 at different voltage levels of 4.16 and 0.48 kV in the respective order, a transformer designated by the T-feeder is positioned between nodes 633 and 634. The test distribution grid is connected to the large area power system network using a transformer, which is assigned the name Grid interconnecting transformer (Grid-ICT). Table 2 includes descriptions of the voltage ratings, MVA ratings, winding inductance and winding resistance. Lengths of the line segments used in this analysis are the same as those recorded in [14,15] as in the original test method. A circuit breaker is placed between the nodes 671 and 692. The wind power plant is designed using the data reported in [16]. Further, the solar power plant is designed by the use of the data reported in [17]. A voltage regulator connected between the nodes 650 and 632 has not been used in this study. Islanding relay for which the algorithm is designed is placed at node 650, which is considered as the islanding relay location (IRL) node, which is considered for the measurement of voltage and current.

2.1. Solar PV System

The solar PV plant of capacity 1 MW was designed by connecting 10 units in parallel, each of which are rated at a capacity of 100 kW. Every 100 kW was designed using an array having 66 parallel strings, where each string has five series connected modules. Each module consists of 96 solar cells. A single diode model was used for every solar cell design. The current supplied by a PV array consisting of Np parallel and Ns series integrated solar cells is given by the below mentioned relation:
I = N p I sc N p I 0 { exp [ q ( V + I ( N s N p ) R s N s AkT ] 1 }
here, Iph: photo-current of PV cell, I0: saturation current of PV cell, A: curve fitting factor of a solar cell, Rsh: shunt resistance of PV cell, Rs: series resistance of PV cell, q: electron charge (1.602 × 10⁻¹⁹ C), k: Boltzmann constant (1.38 × 10⁻²³ J/K), Vmp: voltage corresponding to maximum power point tracking (MPPT), Imp: current corresponding to MPPT. The following parameters are used to design solar PV system at standard test conditions (STC) for each module: Voc = 64.2 V; Isc= 5.96 A; Vmp = 54.7 V; Imp = 5.58 A; Rs = 0.037998 Ω; Rsh = 993.51 Ω; I0 = 1.1753 × 10⁻⁸ A; diode quality factor (Qd) = 1.3; Iph = 5.9602 A [18,19].

2.2. Wind Power Plant

A wind power plant (WPP) of capacity 1.5 MW was designed using a wind turbine coupled with the doubly fed induction generator (DFIG). A WPP generates power equal to 1.5 MW at a voltage of 575 V and 60 Hz frequency. A wind turbine is operated at a wind speed of 11 m/s. Typical data of DFIG are as follows: H (inertia constant) = 0.685 s, Rs = 0.023 pu, Ls = 0.18 pu, Rr = 0.016 pu, Lr = 0.016 pu, Lm = 2.9 pu. A proportional integral (PI) controller is employed for control of the converter used to integrate DFIG to the test grid. The grid side and rotor side convertors are operated at pulse width modulation (PWM) carrier frequencies of 2700 and 1620 Hz in respective order. The maximum pitch angle is considered equal to 27°, and the maximum rate of change in pitch angle is considered equal to 10°/s. The pitch controller gain is considered equal to 150. Gains of reactive power and voltage regulator are considered equal to 0.05 and 20 in respective order [20,21].

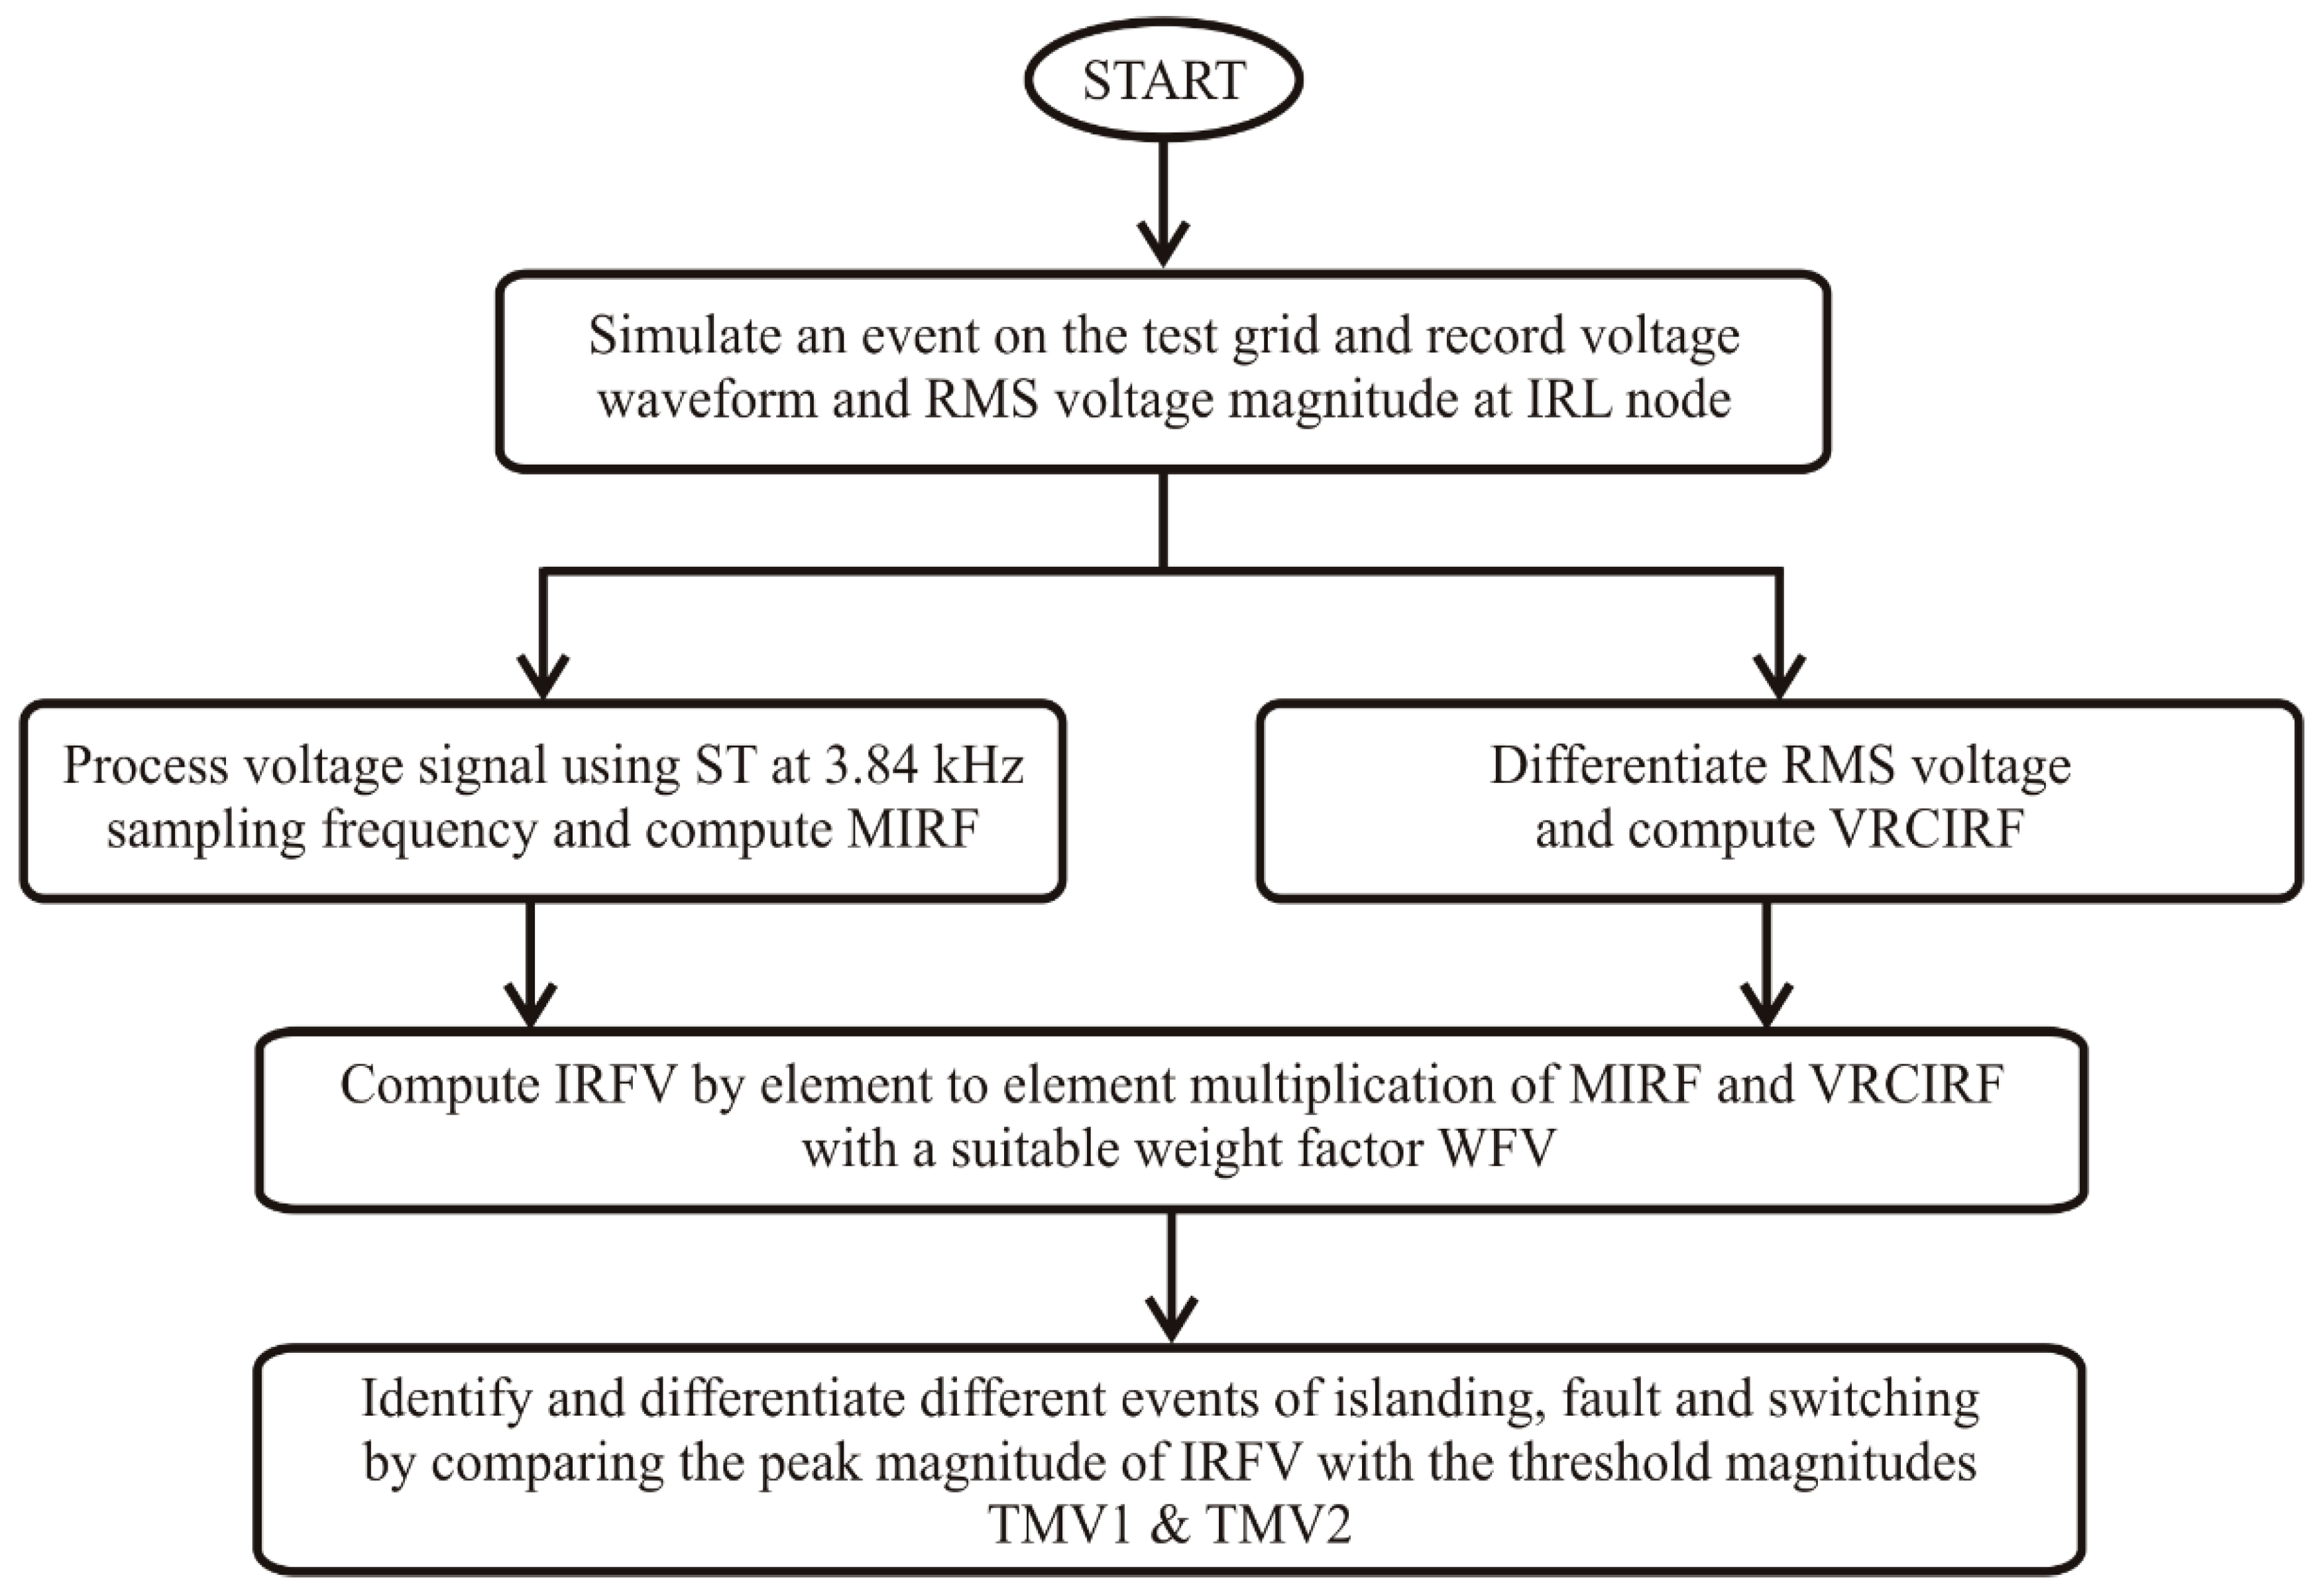
3. Proposed Voltage-Based Algorithm for Identification of Islanding Events

The algorithm for proposed IDM using the voltage signals is illustrated in the flow chart in Figure 2. Processing of the voltage waveform and RMS voltage is performed using parallel steps. All the steps used in the algorithm are detailed below:
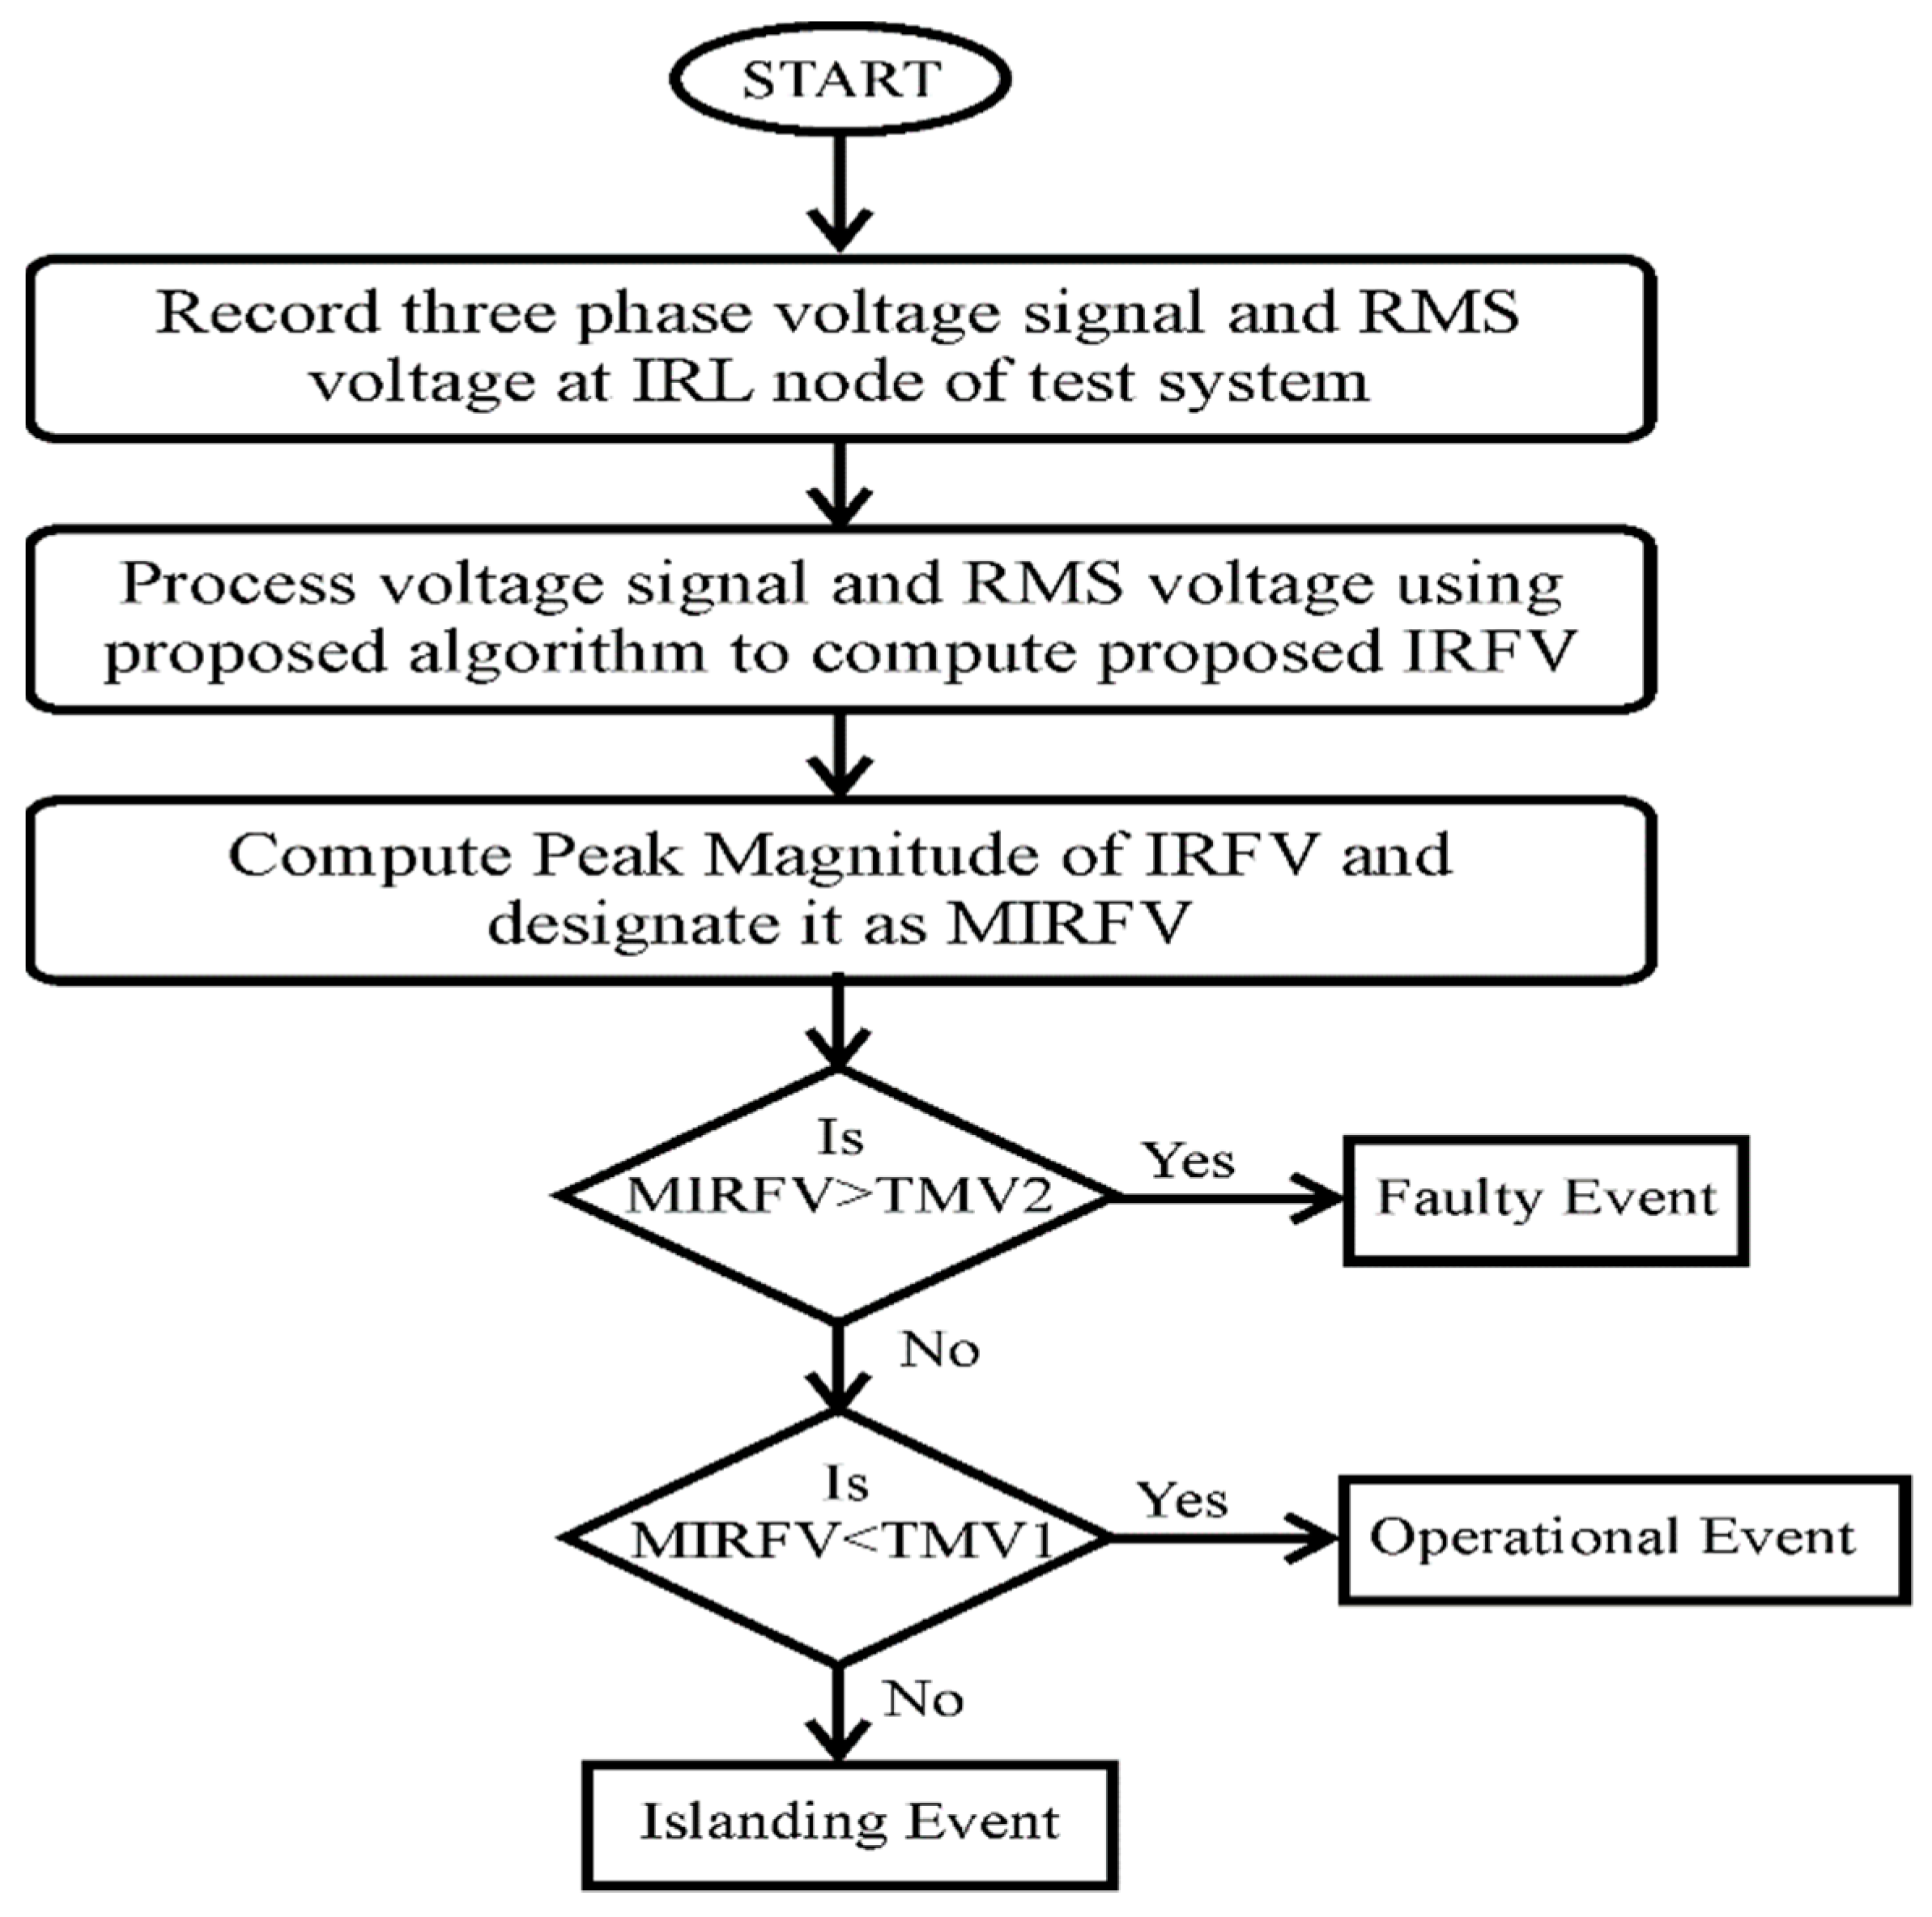
  • Record the voltage waveform and root mean square (RMS) values of the voltage (VR) at IRL node.
  • Decompose the voltage signal using Stockwell transform at a sampling frequency of 3.84 kHz and designate the output matrix as SV. Equation (7) described in Section 3.1 is used to compute SV. Detailed mathematical formulation of Stockwell transform are reported in [22,23,24].
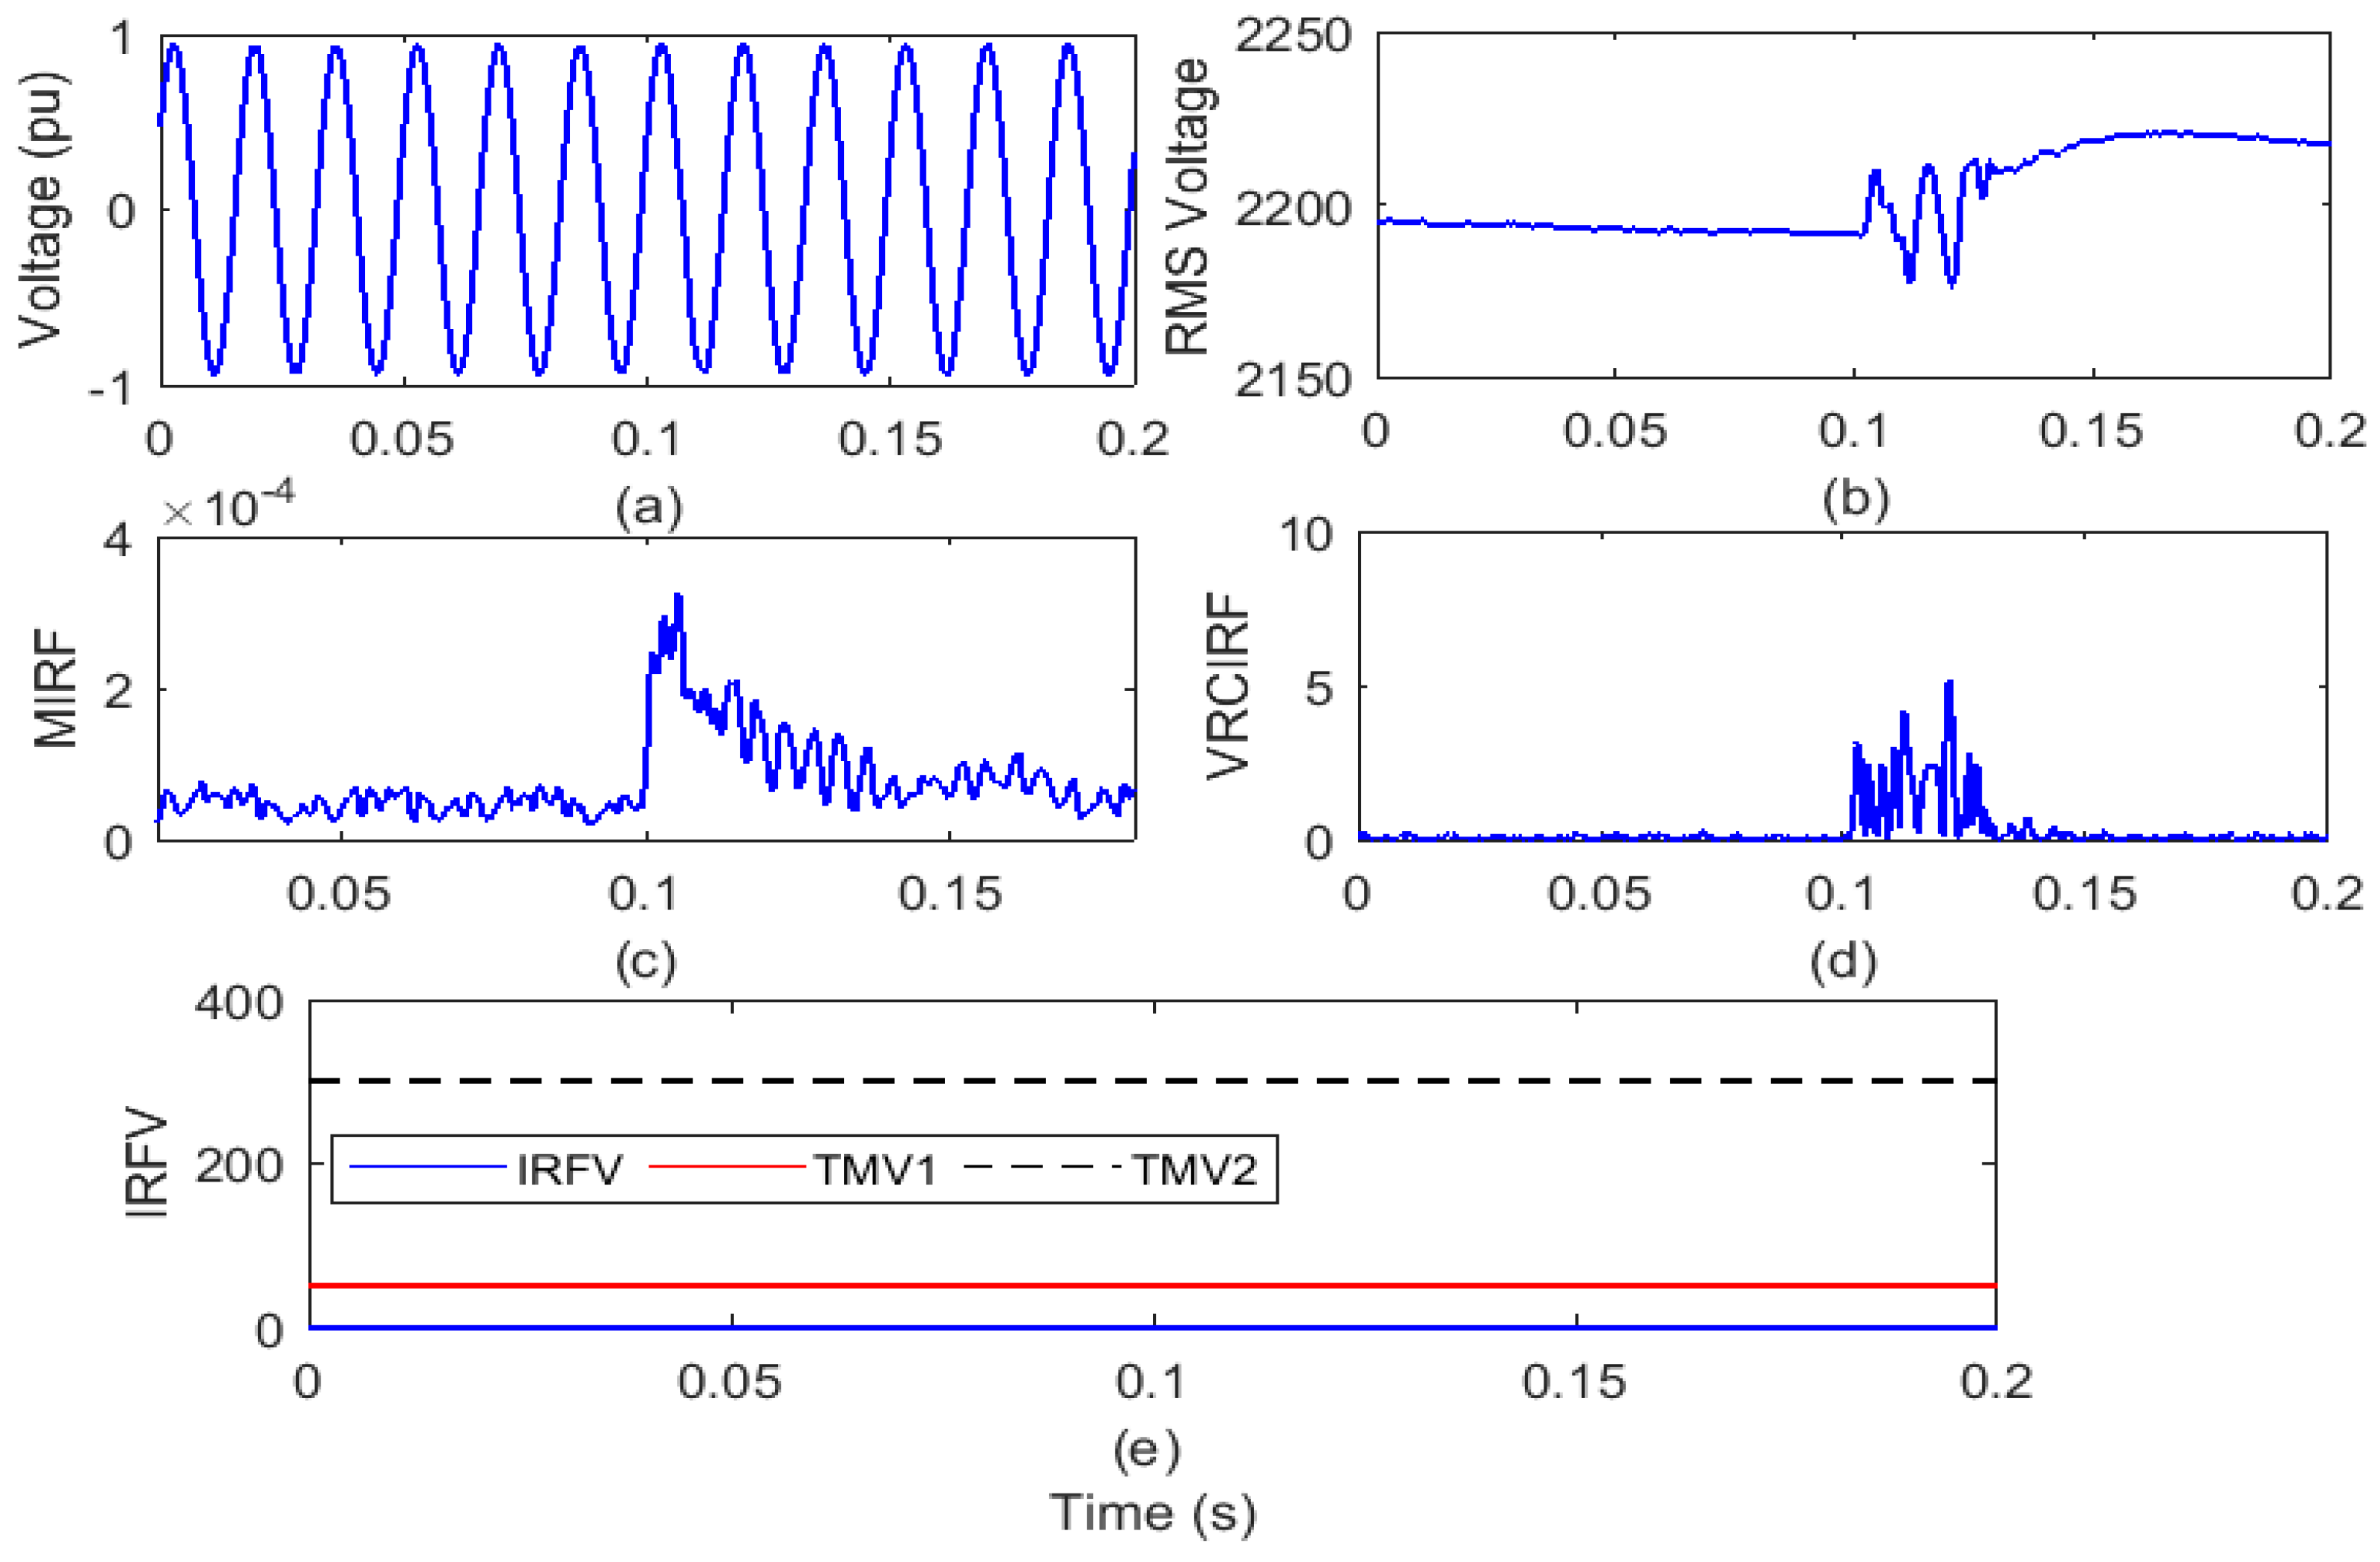
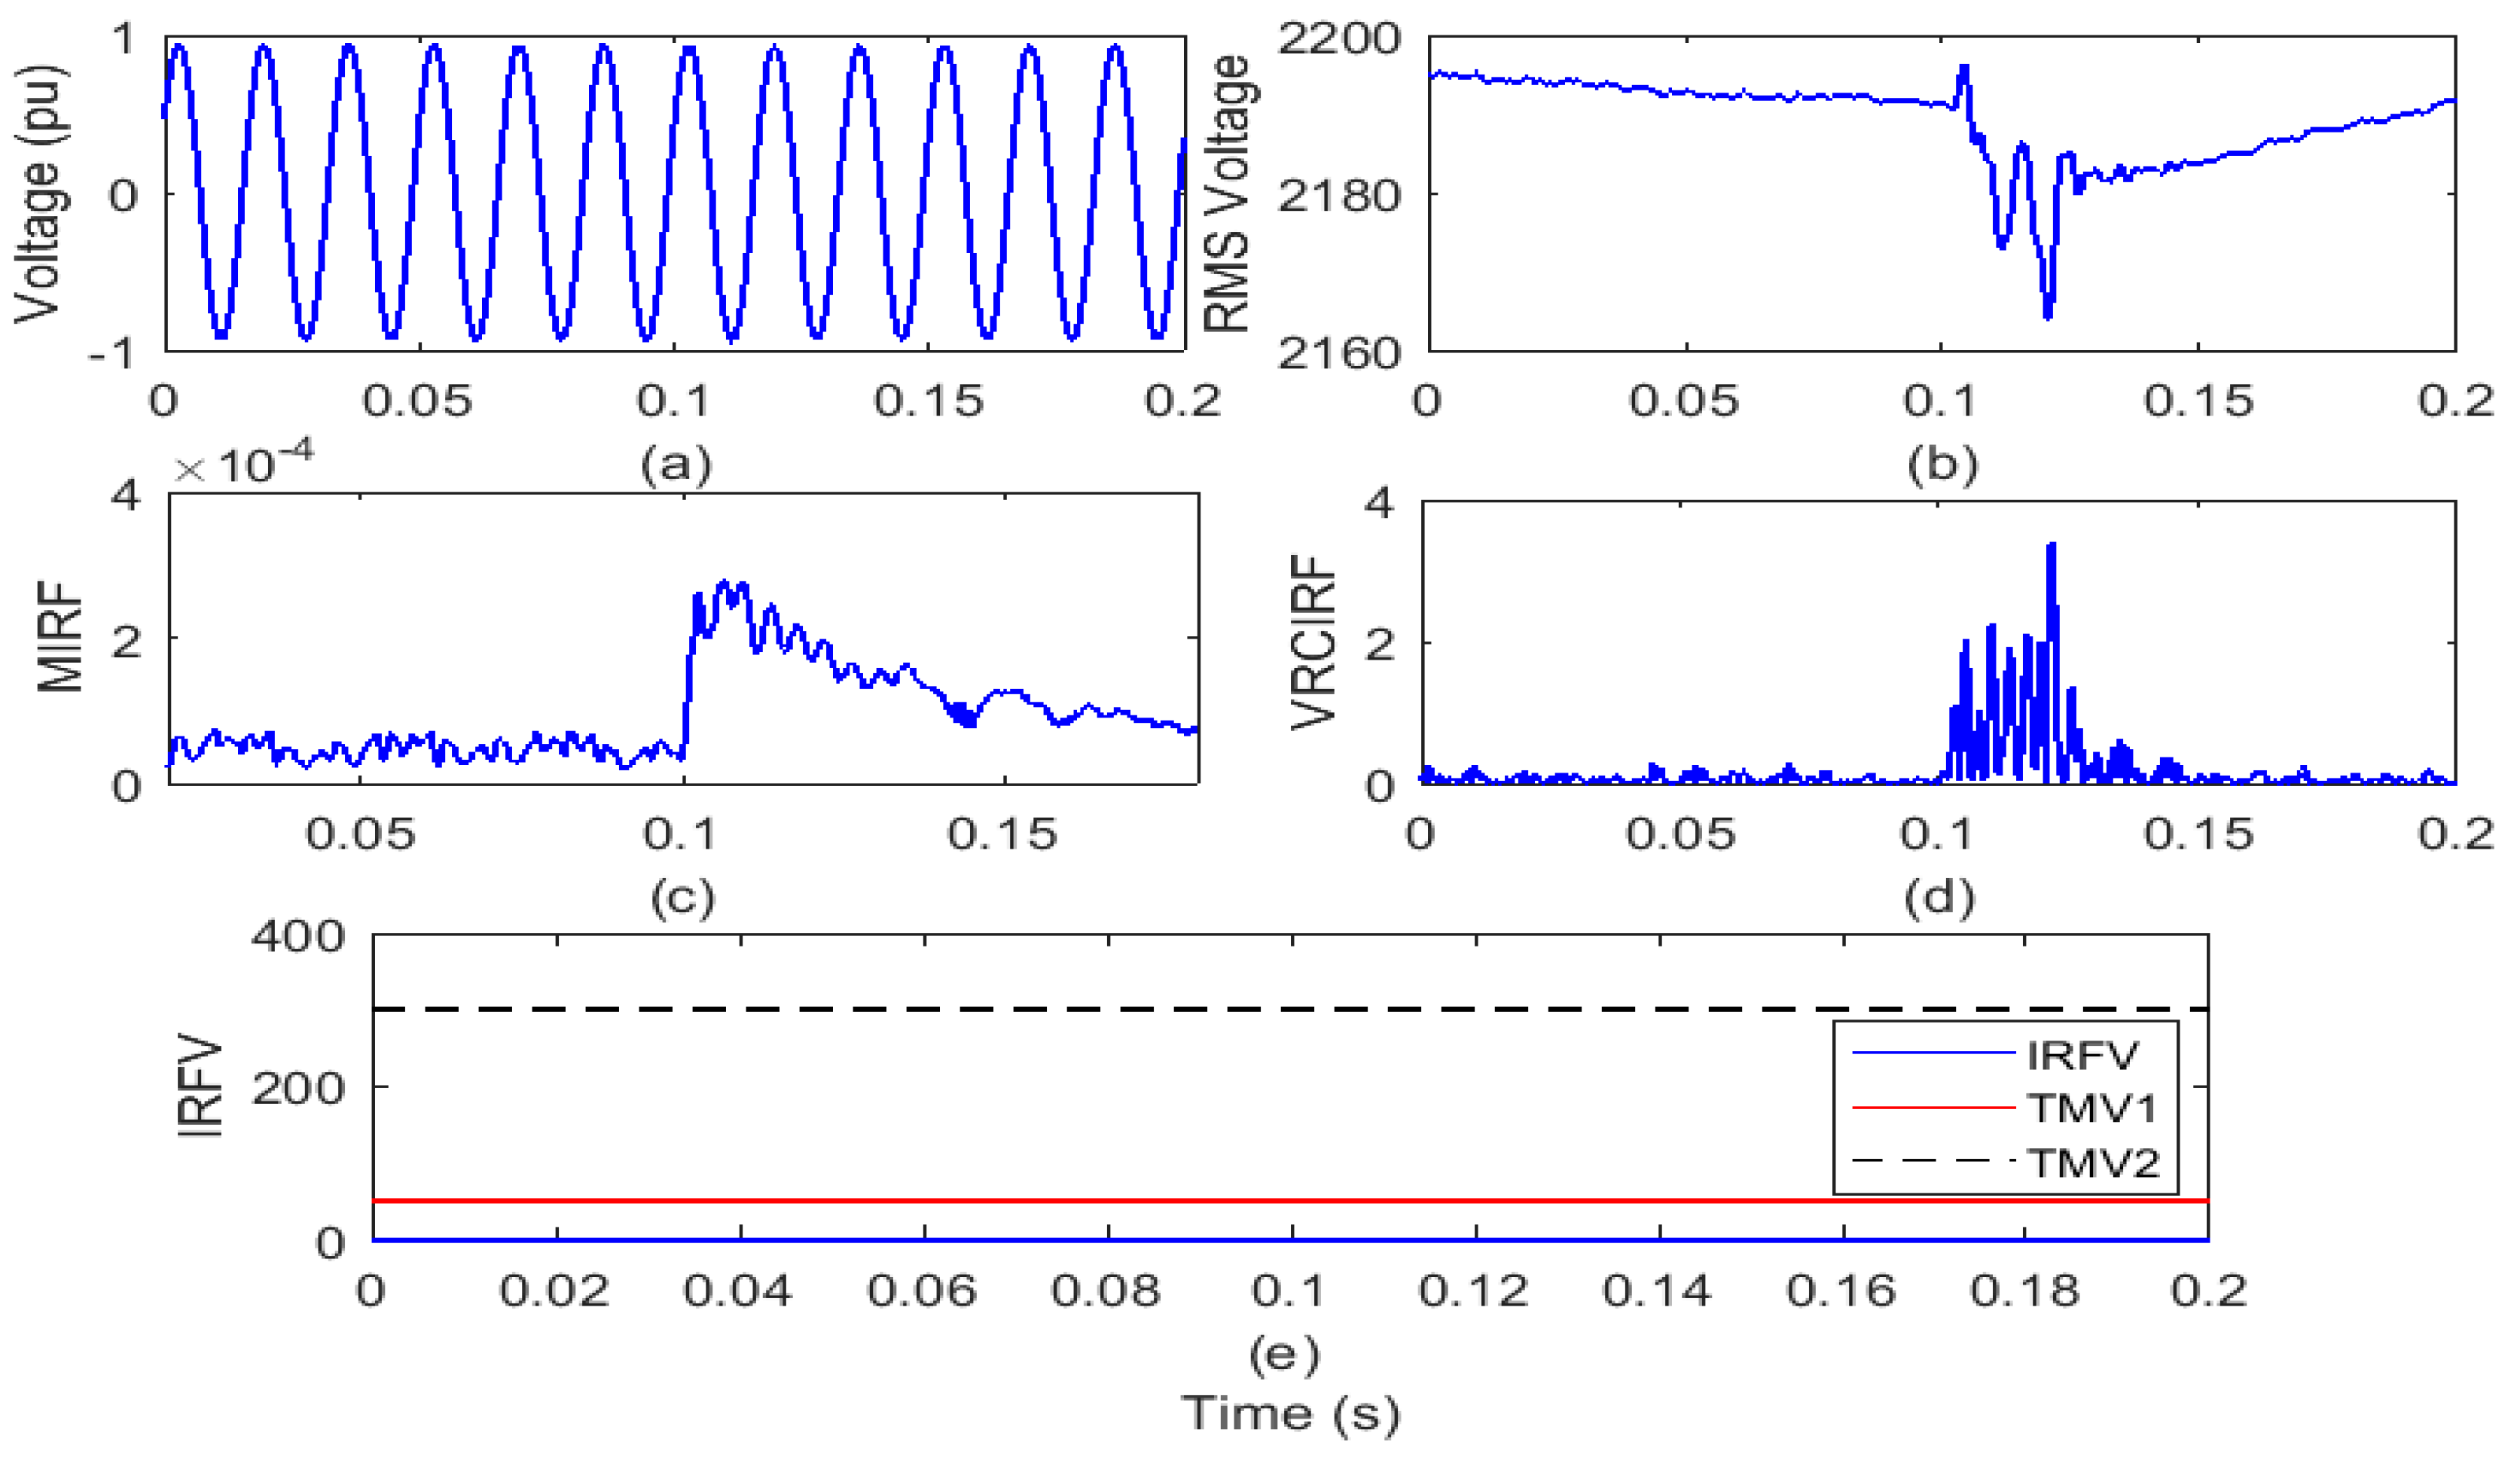
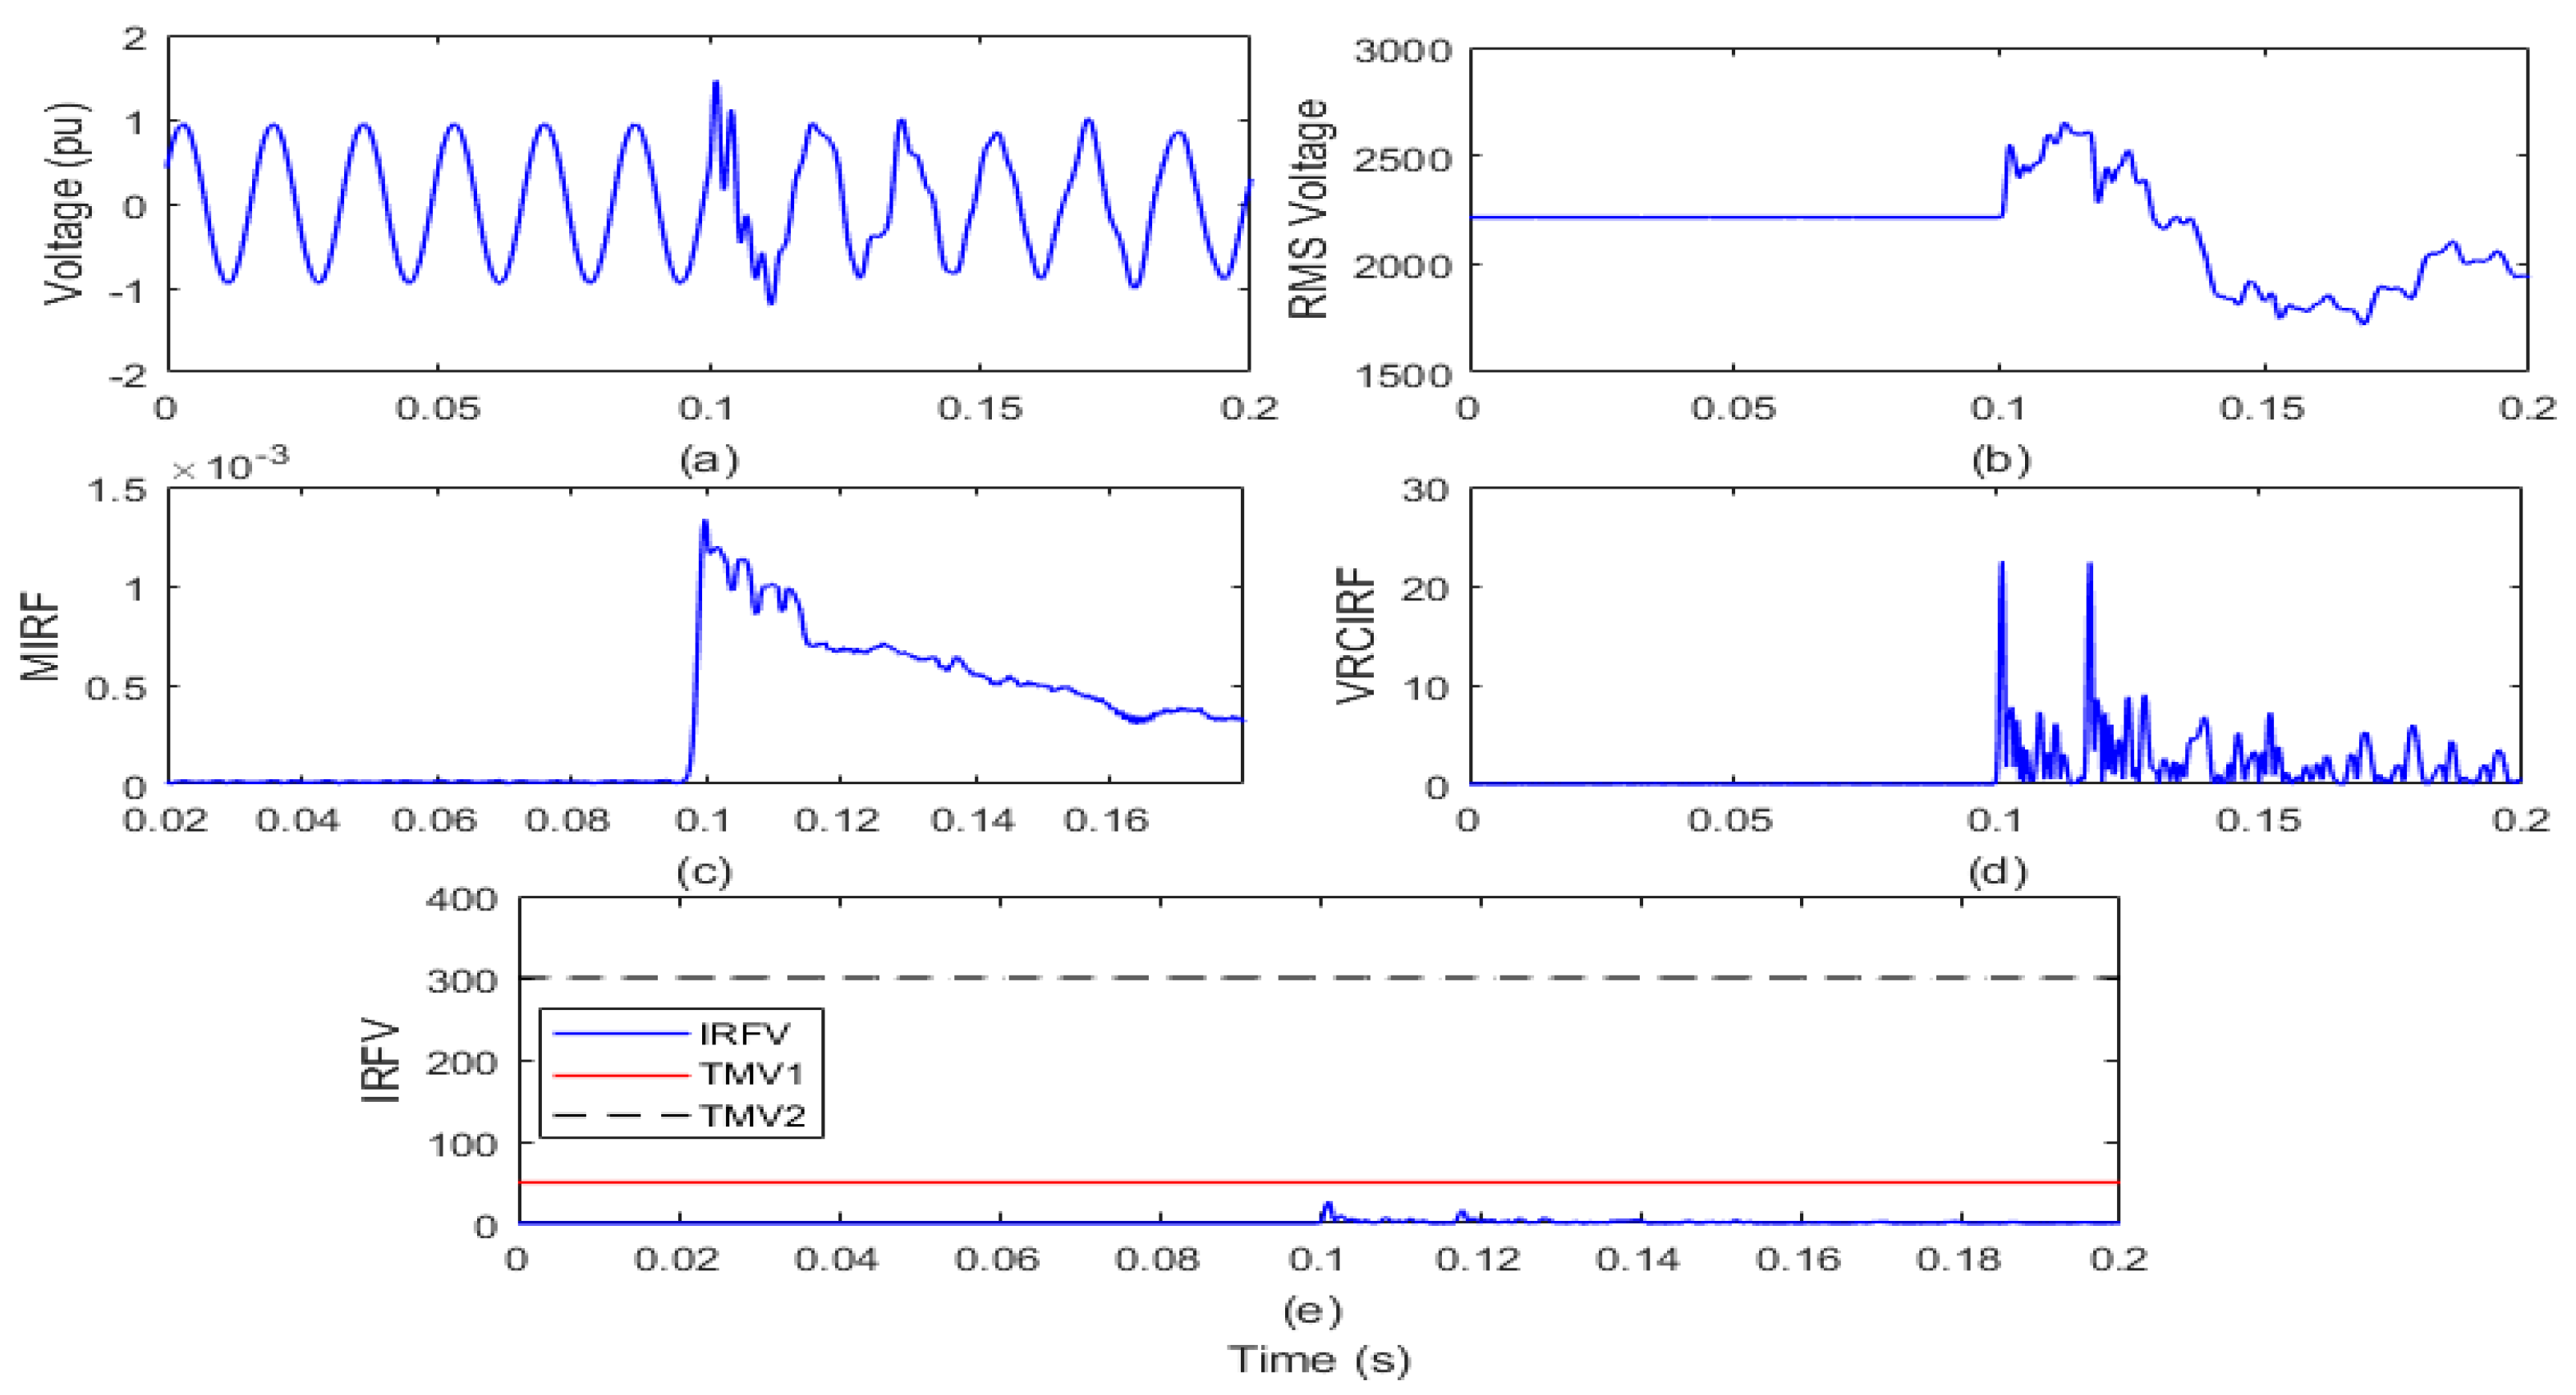
  • Compute the median of the columns of the matrix SV and assigned symbol median-based islanding recognition factor (MIRF), which is defined in the Equation (2).
    MIRF = m e d i a n ( S V )
  • Compute the rate of change in RMS voltage (ROCOV) and assign the symbol voltage rate of change in islanding recognition factor (VRCIRF). This is achieved by differentiating the voltage signal with respect to time. VRCIRF is defined in the Equation (3).
    VRCIRF = d ( V R ) d t
  • Compute the voltage-based islanding recognition factor (IRFV) by multiplying the MIRF and VRCIRF element to element, as detailed below. Here, WFV is the voltage-based weight factor. WFV is considered equal to the 1000 for this study.
    IRFV = MIRF × VRCIRF × WFV
  • Set the threshold magnitudes TMV1 and TMV2 equal to 50 and 300, respectively, for the IRFV. If peak magnitude of IRFV is less than TMV1, then the event is an operational event. For peak magnitudes of IRFV between the TMV1 and TMV2, the event is islanding. However, if the peak magnitude of IRFV is greater than the TMV2 then the event is faulty in nature.

3.1. Stockwell Transform

Stockwell transform (ST) is expressed as an expanded format of the continuous WT (CWT). This included details relating to the spectrum and amplitude of phases. It is necessary to adjust the mother wavelet process for the extraction of information stored in the CWT phase for successful application. Discrete ST is quickly measured by the use of high fast Fourier transform efficiency as well as convolution theorem. The ST results are determined in the form of a complex matrix known as the S-matrix. For each column, each row in this matrix is related to a definite frequency and to a definite time. S-matrix components have complex amplitude values. Multiplying S-matrix absolute magnitudes calculates the ST-amplitude (STA) matrix. A high time resolution is, thus, maintained at a high frequency and a low time resolution at a low frequency. The ST is recognized as a multi-resolution window width that changes inversely relative to time-changing frequency and power data. Thus, a high time resolution at a high frequency and a low time resolution at a low frequency are preserved. There are several distinct ways of achieving the transformation of the ST. It introduces the relationship between the transformation of STFT and ST and the type of derivation of the transformation of ST from the CWT step correction [25,26]. The short-time Fourier transform of the h(t) signal is defined by the relationship below.
S T F T ( τ ,   f ) = + h ( t ) g ( τ t ) e j 2 π f t d t
where τ and f are used to represent the spectral localization time and Fourier frequency in respective order, and g(t) is used to denote a window function. The ST is derived from the above equation when the window function g(t) is replaced by the Gaussian function, as described below.
g ( t ) = | f | 2 π e f 2 t 2 2
Therefore, ST is defined as
S V ( τ ,   f ) = + h ( t ) | f | 2 π e f 2 ( τ t ) 2 2 e j 2 π f t d t
The ST is a special case of STFT with a Gaussian window function. If the ST window is wider in the time domain, the ST can provide greater frequency resolution for the lower frequency. Even if the window is narrower, greater time resolution will be given by the higher frequency. A matrix known as the S-matrix (SV) is the output of ST. The SV collects information pertaining to the signal frequency and amplitude.

3.2. Decision Tree Rules

Decision trees rules are organized in the form of a classification tree, which is utilized for predicting responses to data. For predicting a response, decisions in the form of a tree initiating from a root (starting) node to a leaf node are followed. The final leaf node gives the response. Decision trees used for classification generate responses that are nominal in nature such as “true” or “false”. It is established that a set of rules that are used for implementation in a dataset of features are computed by the use of mathematical approaches including DWT and ST [17].

4. Results and Discussion

The results for the recognition of islanding events using the voltage-based islanding recognition factor (IRFV) are discussed in this section. This section also details the simulation outcomes to distinguish operational events from islanding events. In addition, the results of the simulation to separate the defective events from the islanding events are also detailed in this section.

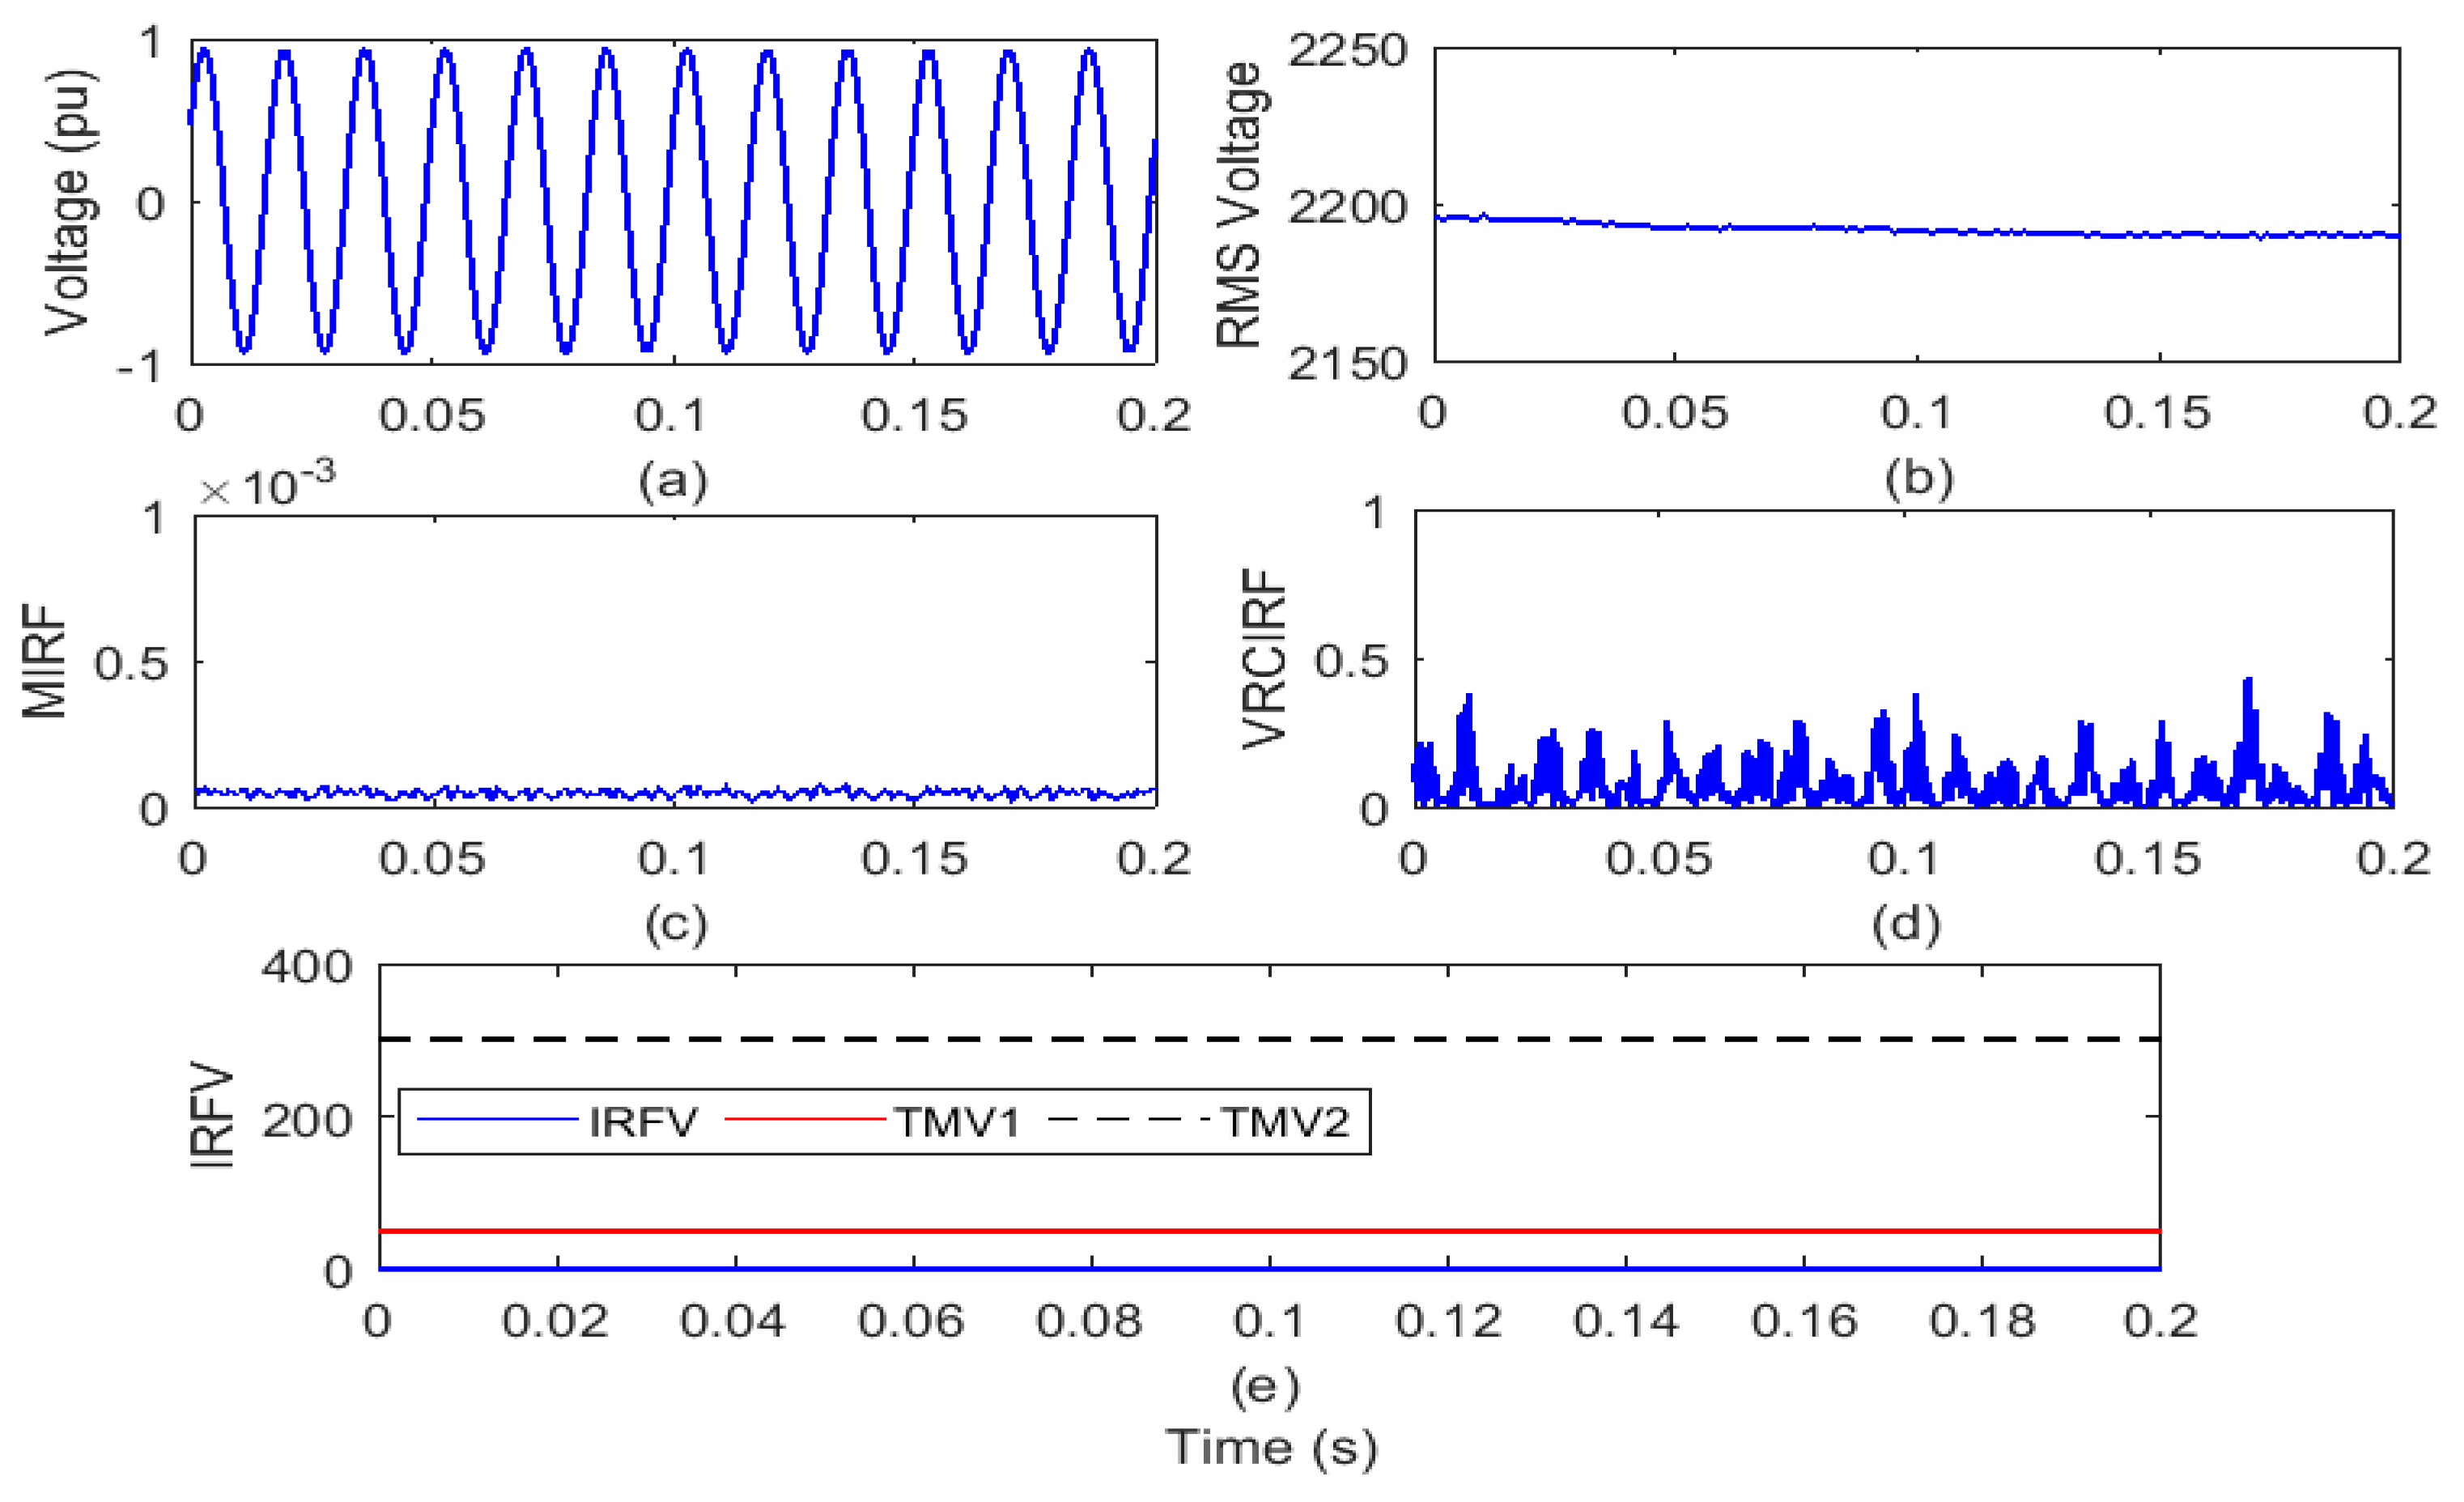
4.1. Healthy Condition without Any Disturbance

For a time of 0.2 s, the test grid of the remotely located distribution system interfaced with wind and solar power generators will run. On the islanding relay (IRL) node, the voltage waveform and RMS value of the voltage (VR) is reported and shown in Figure 3a,b, respectively. The voltage signal is processed to compute the MIRF index using Stockwell transform and is defined in Figure 3c. In addition, by differentiating the VR, the VRCIRF index is determined and represented in Figure 3d. In addition, the proposed voltage-based IRFV index for identification of the islanding events is computed with an acceptable WFV weight factor by element-to-element multiplication of MIRF and VRCIRF, as illustrated in Figure 3e.
After the study of the voltage waveform from Figure 3a, it is found that there is no disturbance associated with the voltage signal. Furthermore, it can also be seen from Figure 3b that over the entire time period, the amplitude of the RMS voltage is always constant. It is, however, compiled from Figure 3c that over the entire time period, the MIRF index magnitude is constant. An index of VRCIRF included in Figure 3d shows that there are slight ripples of magnitude across the entire time span, but the pattern is the same, suggesting that the voltage signal is not correlated with any particular disturbance. The magnitude of the IRFV index included in Figure 3e is constant and below the threshold TMV1. Hence, it is concluded that there is no event incident on the test system. Therefore, plots included in the Figure 3c–e will be considered as reference plots for recognition of the islanding events, operational events and faulty events.

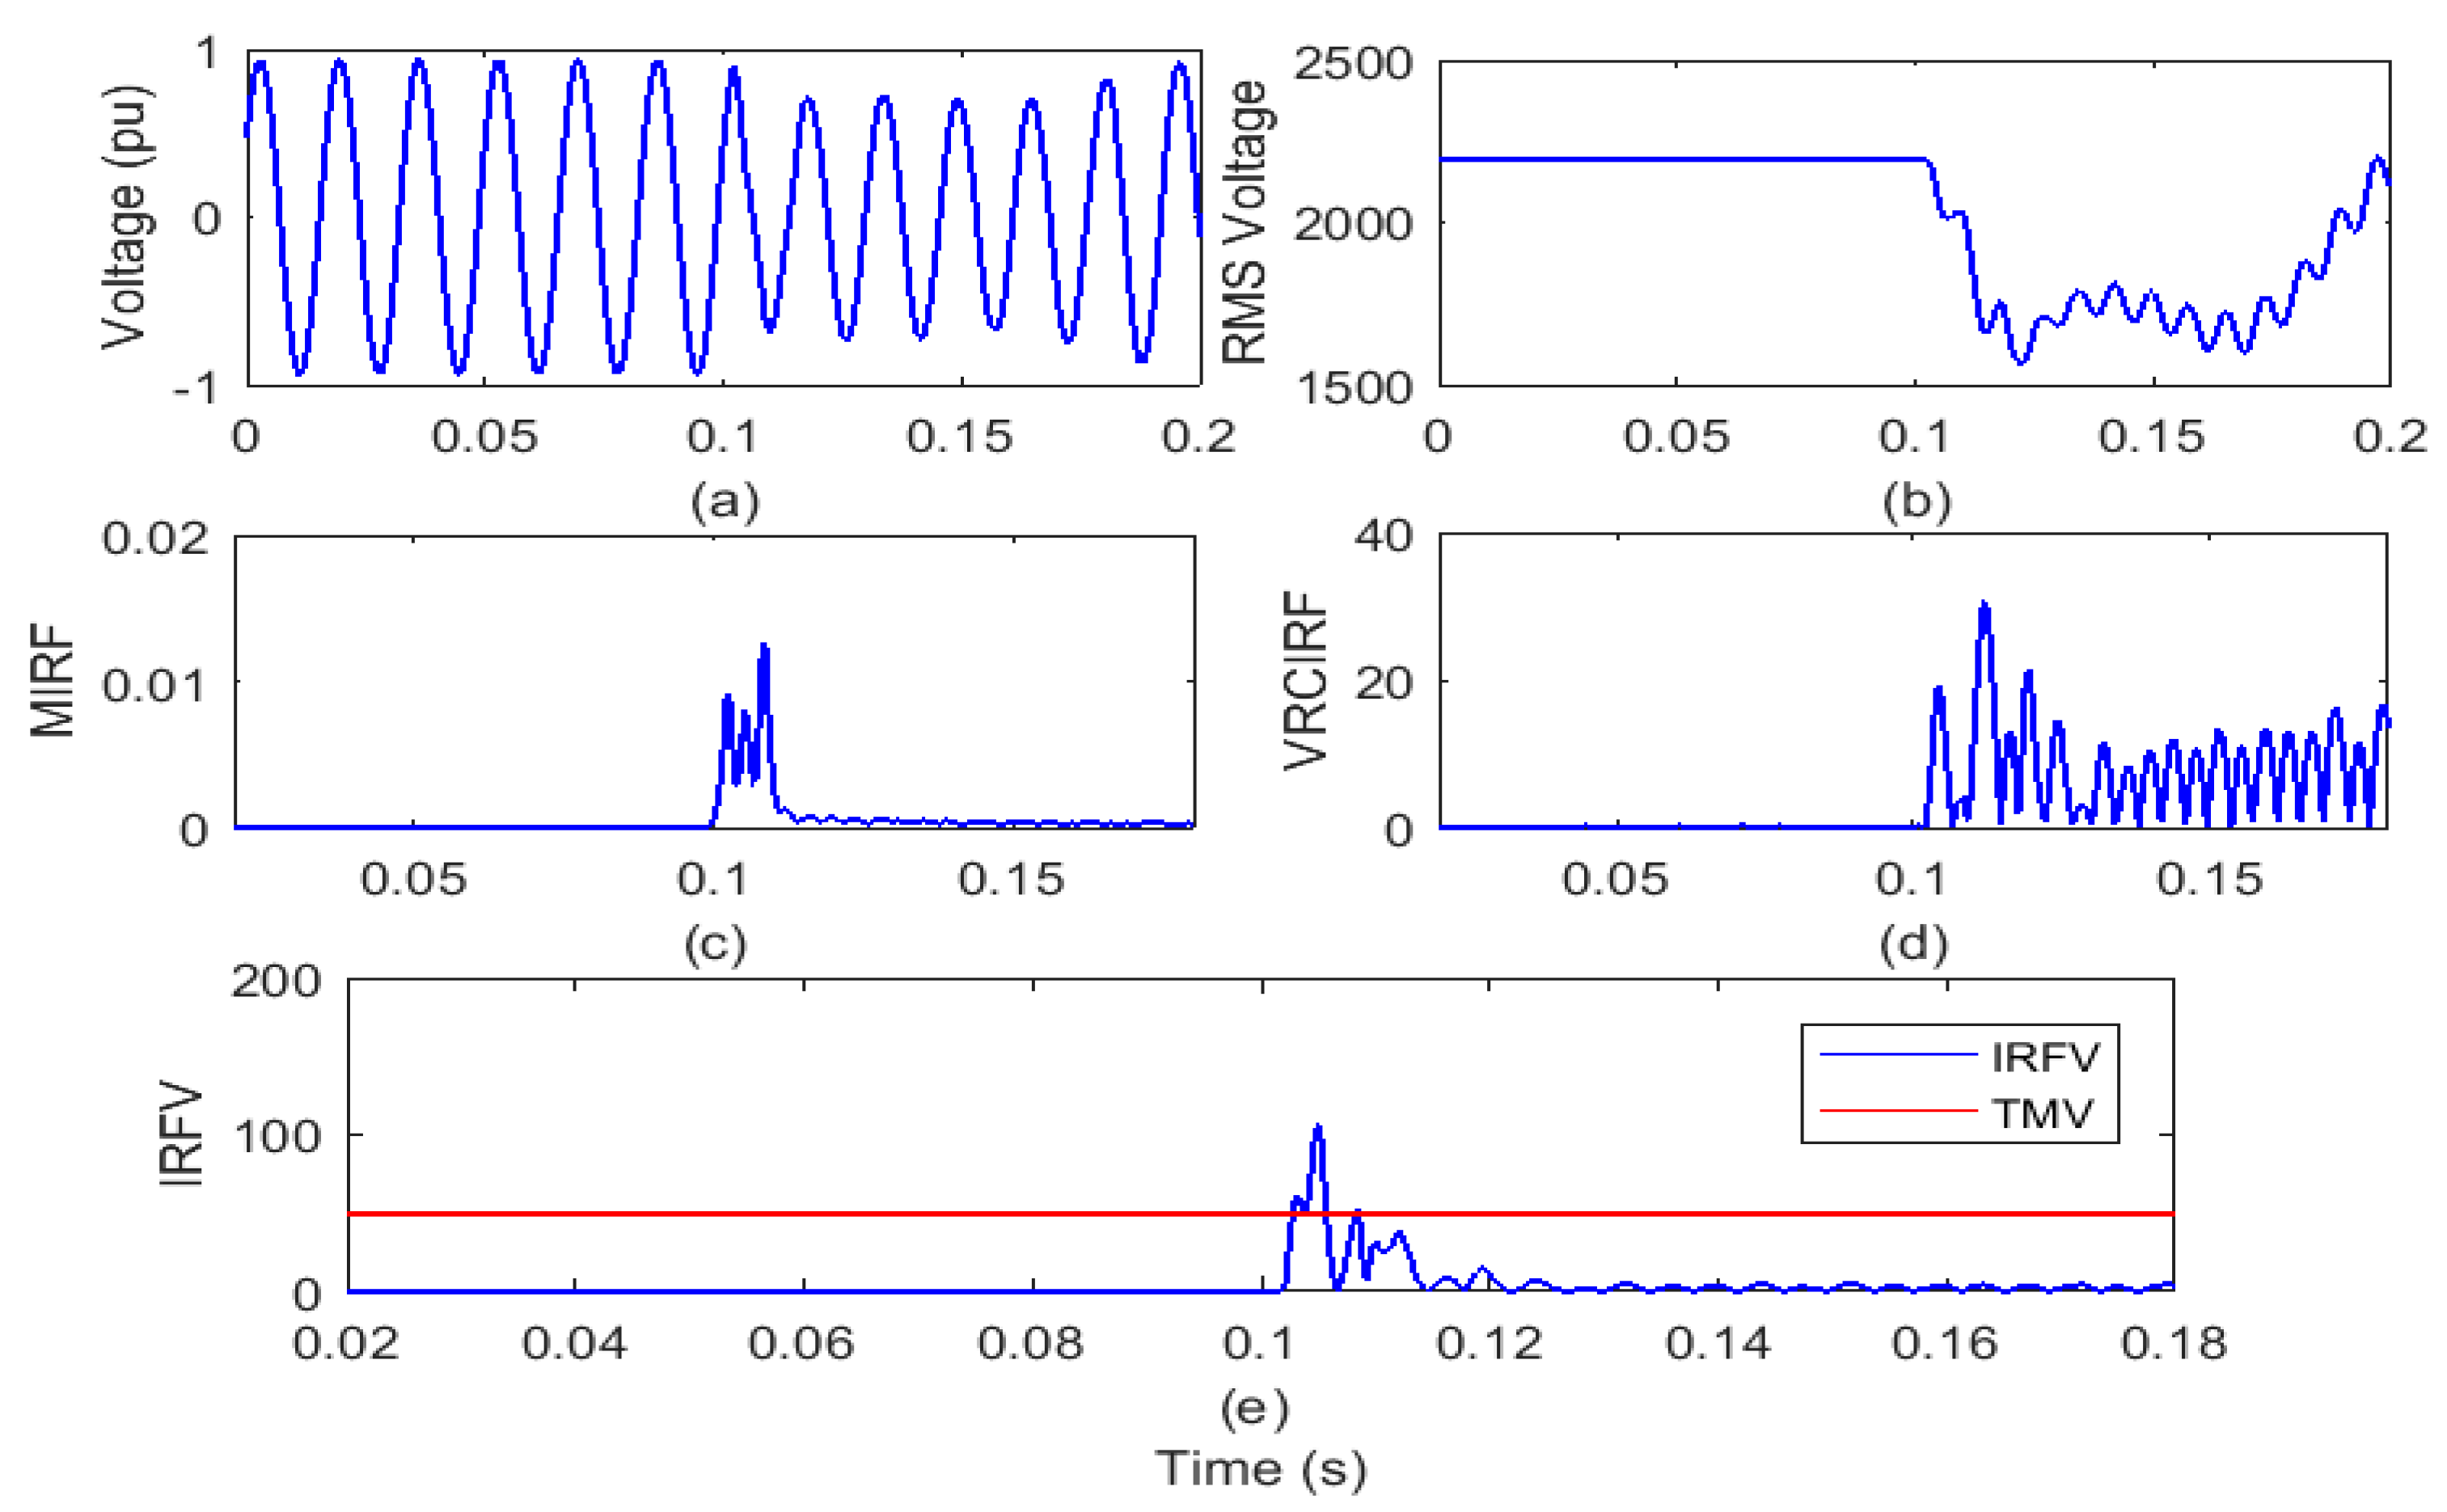
4.2. Recognition of Islanding Events

This section details findings of the identification of the activities of islanding in the presence of wind power generation, solar power generation and the presence of both wind and solar power generation.

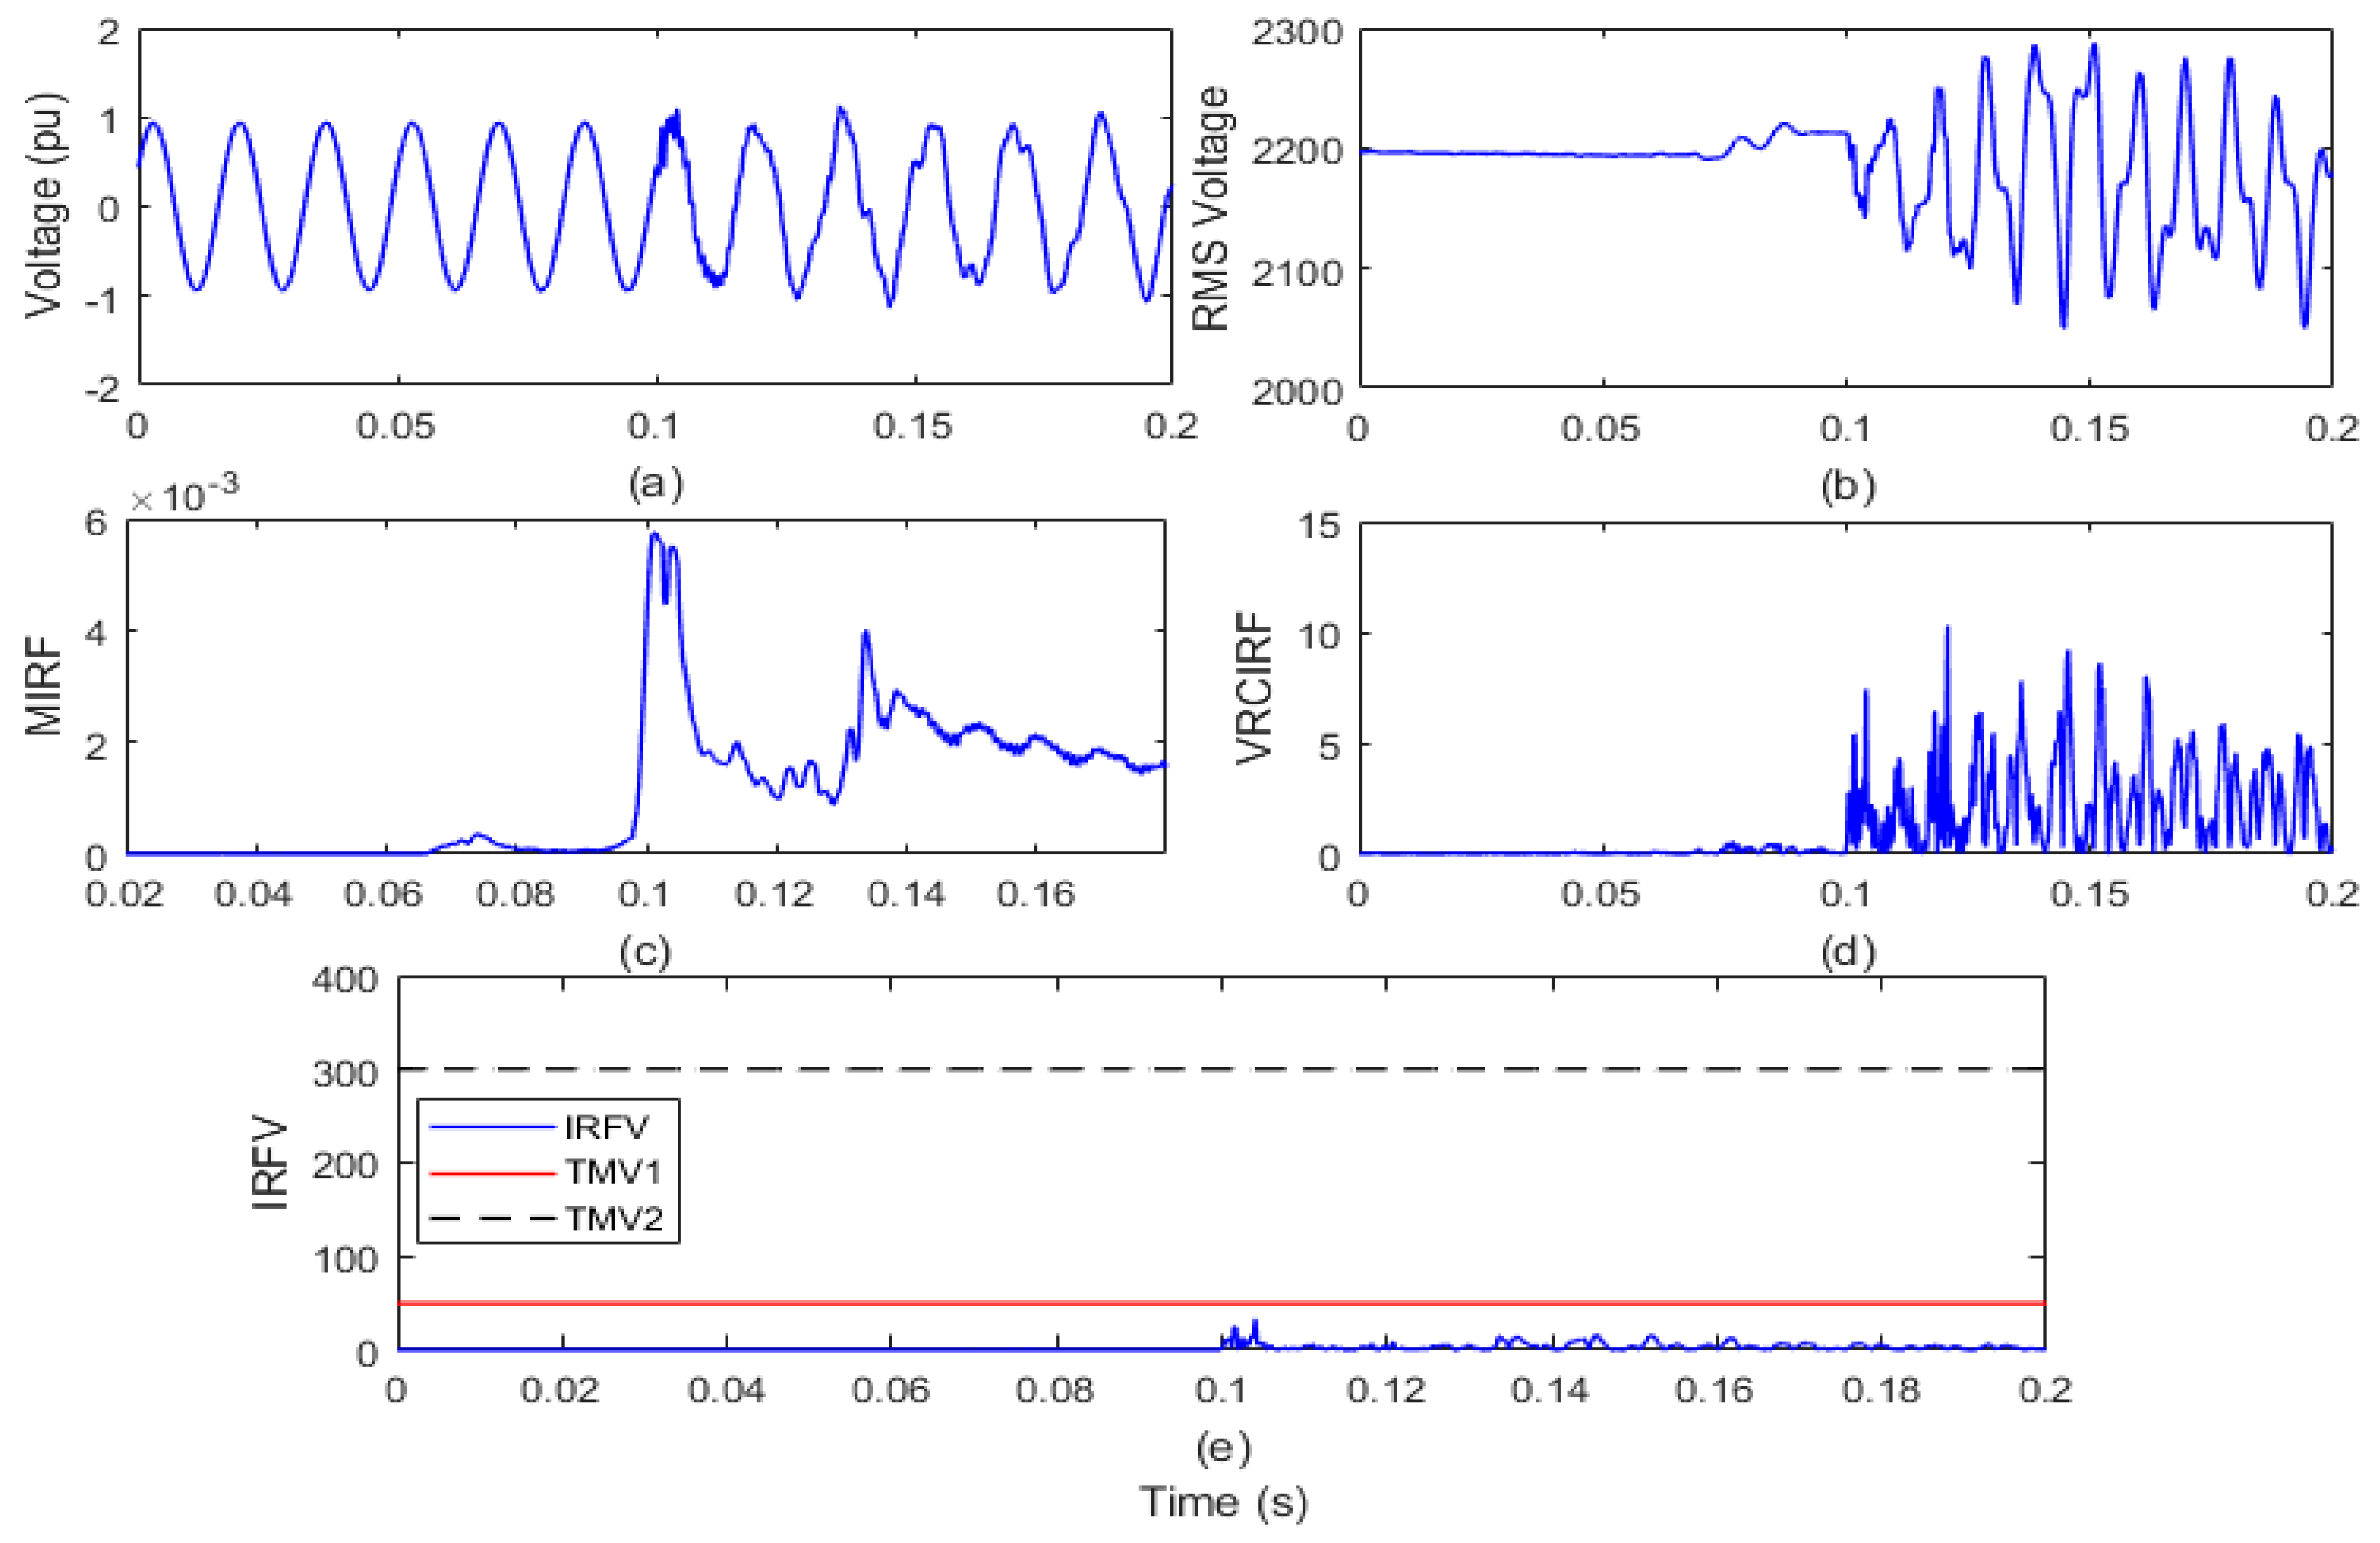
4.2.1. Islanding with Wind and Solar Energy Production

The test grid of the remotely located distribution system interfaced with wind and solar generators would run for a period of 0.2 s. By opening the circuit breaker (CB) near node 650 of the test grid at 6th cycle, the islanding event is simulated. The voltage waveform and root mean square value of the voltage (VR) is recorded on the islanding relay (IRL) node and shown in Figure 4a,b, respectively. The voltage signal is processed using the Stockwell transform to compute the MIRF index and is described in Figure 4c. Moreover, by differentiating the VR, the index of the VRCIRF is calculated and depicted in Figure 4d. In addition, the proposed voltage-based IRFV index for the identification of islanding events is computed with an acceptable WFV weight factor by element-to-element multiplication of MIRF and VRCIRF, as illustrated in Figure 4e.
After the voltage waveform analysis from Figure 4a, it is observed that after the occurrence of the islanding incident, the voltage magnitude is decreased. In addition, it is also visible from Figure 4b that the magnitude of the RMS voltage decreased from 2180 V to a minimum of 1605 V. In addition, the RMS voltage is often correlated with disturbances. In addition, it is compiled from Figure 4c that the magnitude of the MIRF index shall be zero prior to the occurrence of the islanding event and shall become finite at the time of occurrence of the event. After the incidence of the event, the magnitude again decreases and becomes near to zero. An index of VRCIRF included in Figure 4d indicates that the magnitude is close to zero in the presence of both wind and solar power generation prior to the occurrence of the islanding phenomenon. After the incidence of the islanding event, the magnitude increases and becomes high, and continuous high magnitude ripples are observed. The magnitude of the IRFV index included in Figure 4e is zero before the incidence of the islanding event and becomes high at the time of the incidence of islanding. At the moment when the islanding event is incident, the magnitude of the IRFV index becomes greater than the threshold TMV1 but remains below the threshold TMV2. Hence, it is concluded that islanding in the presence of both wind and solar power generation is recognized effectively and also discriminated from both the faulty events and operational events.

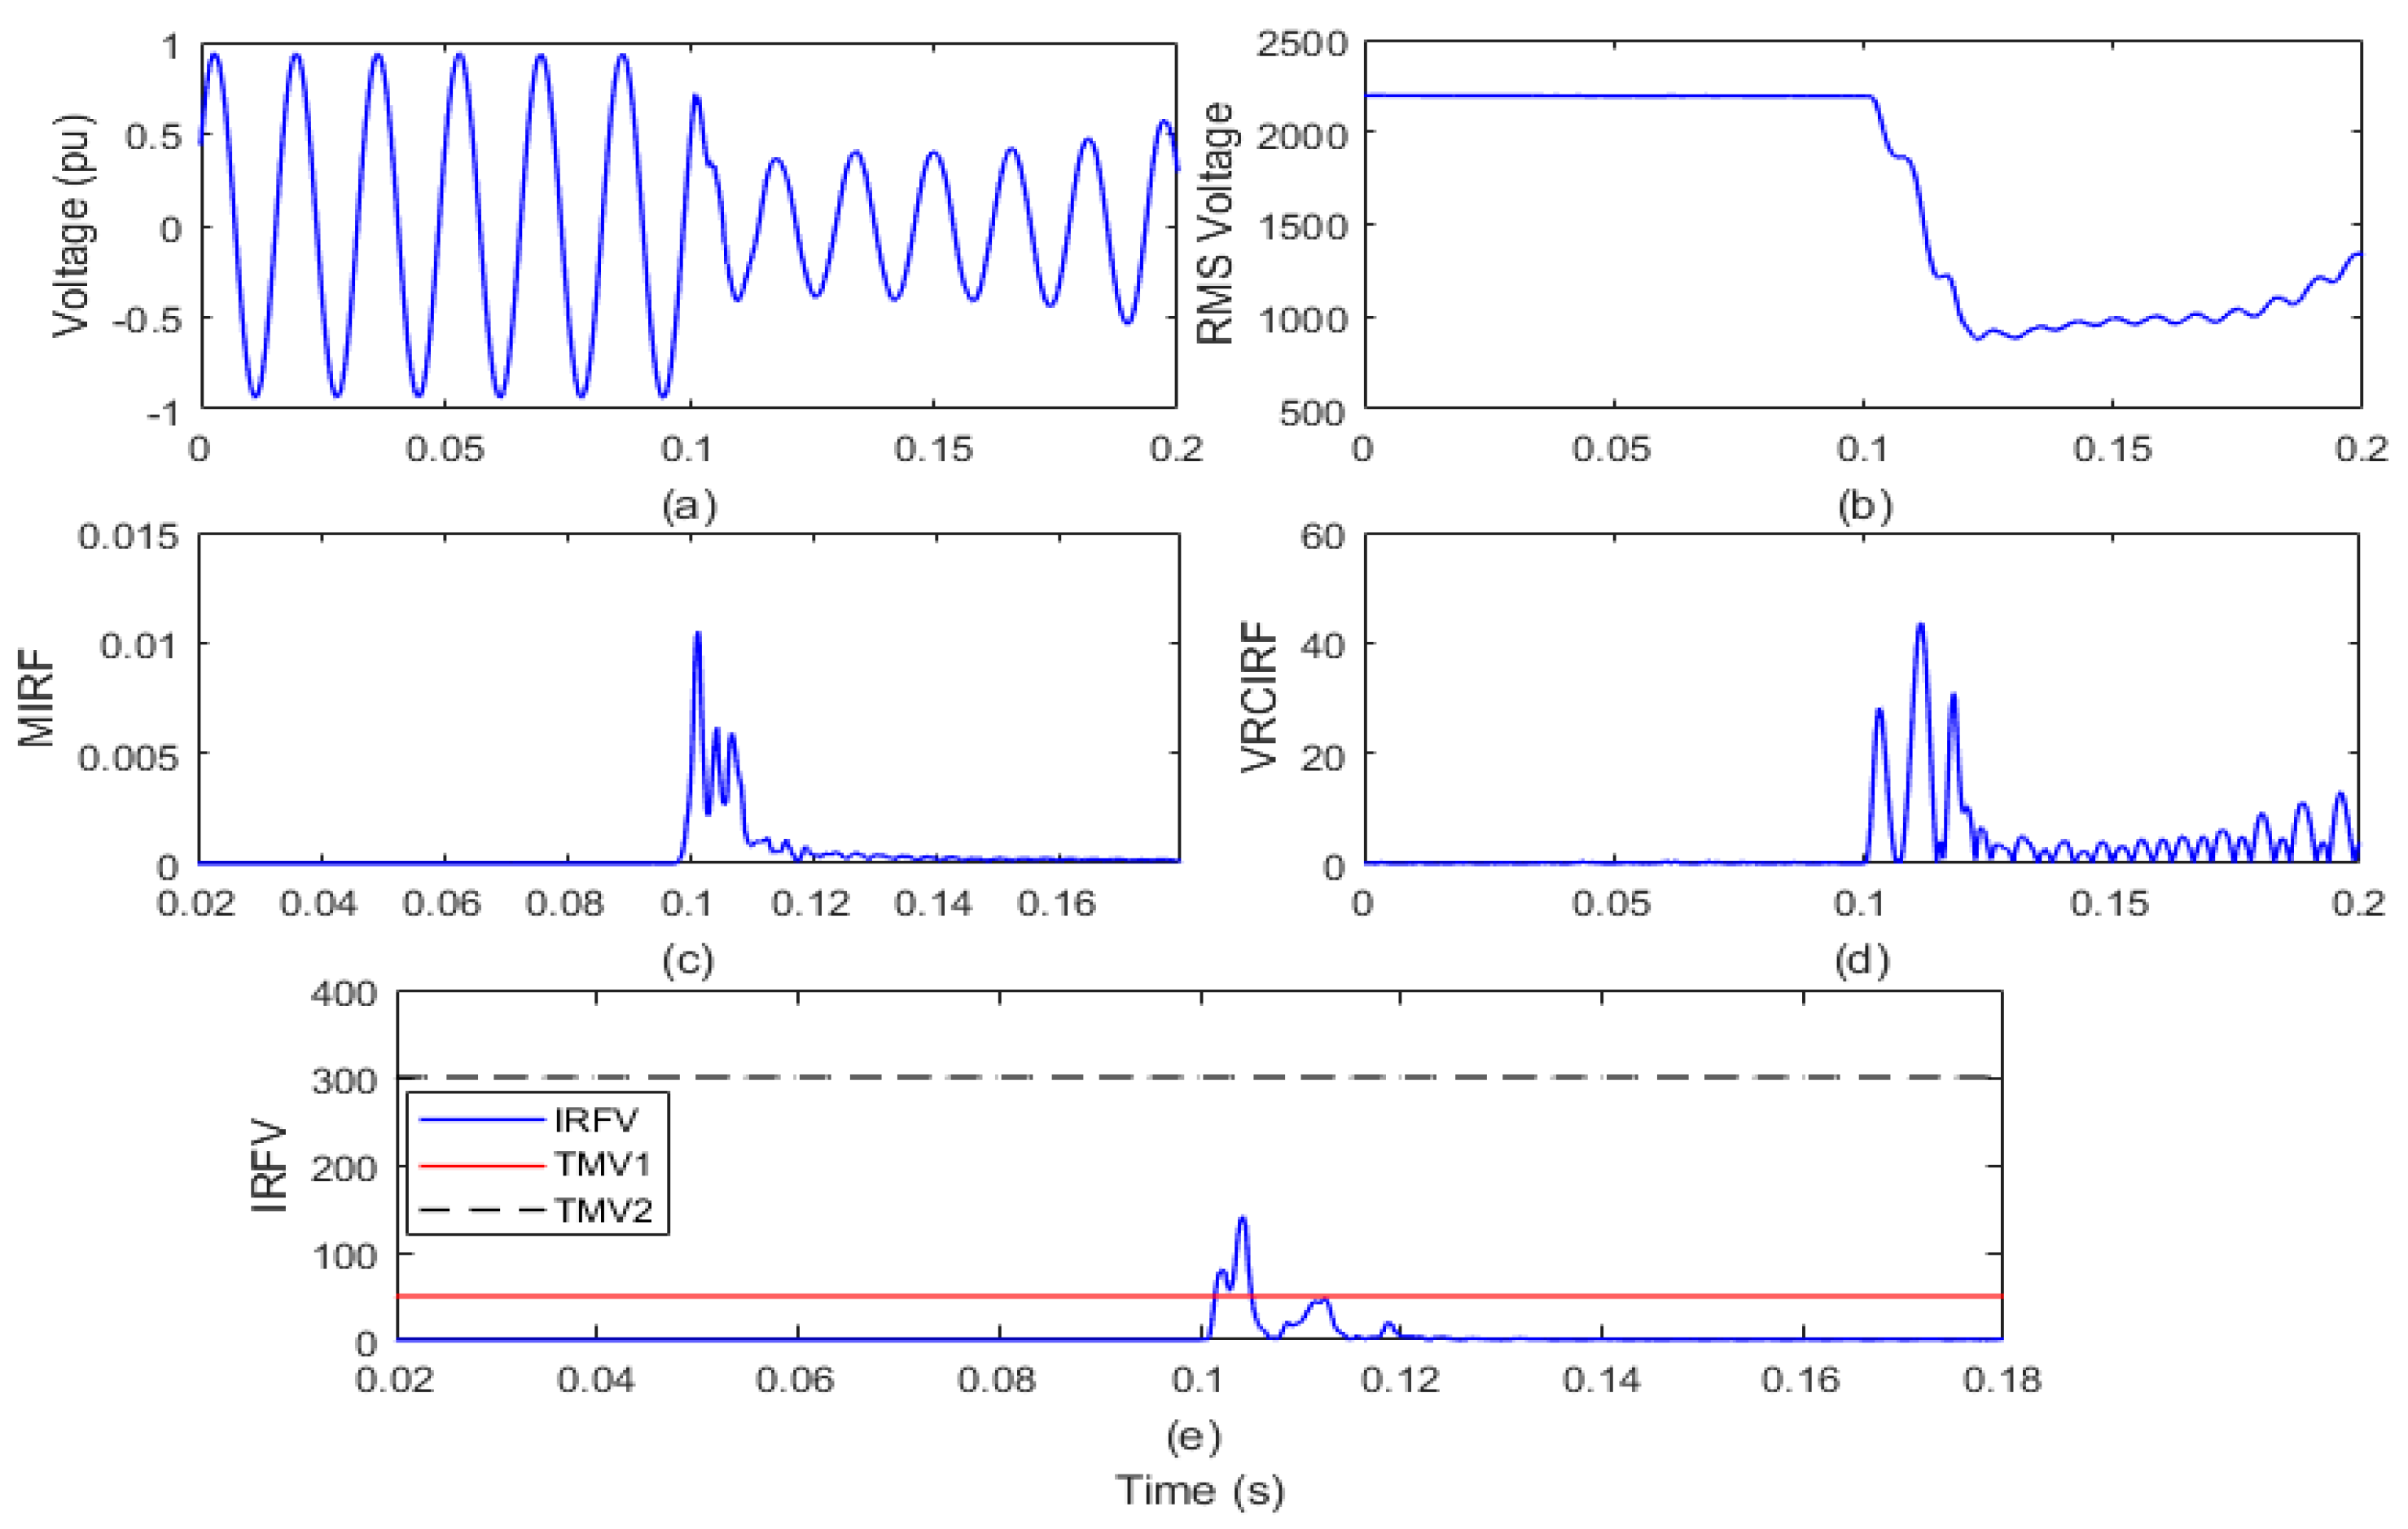
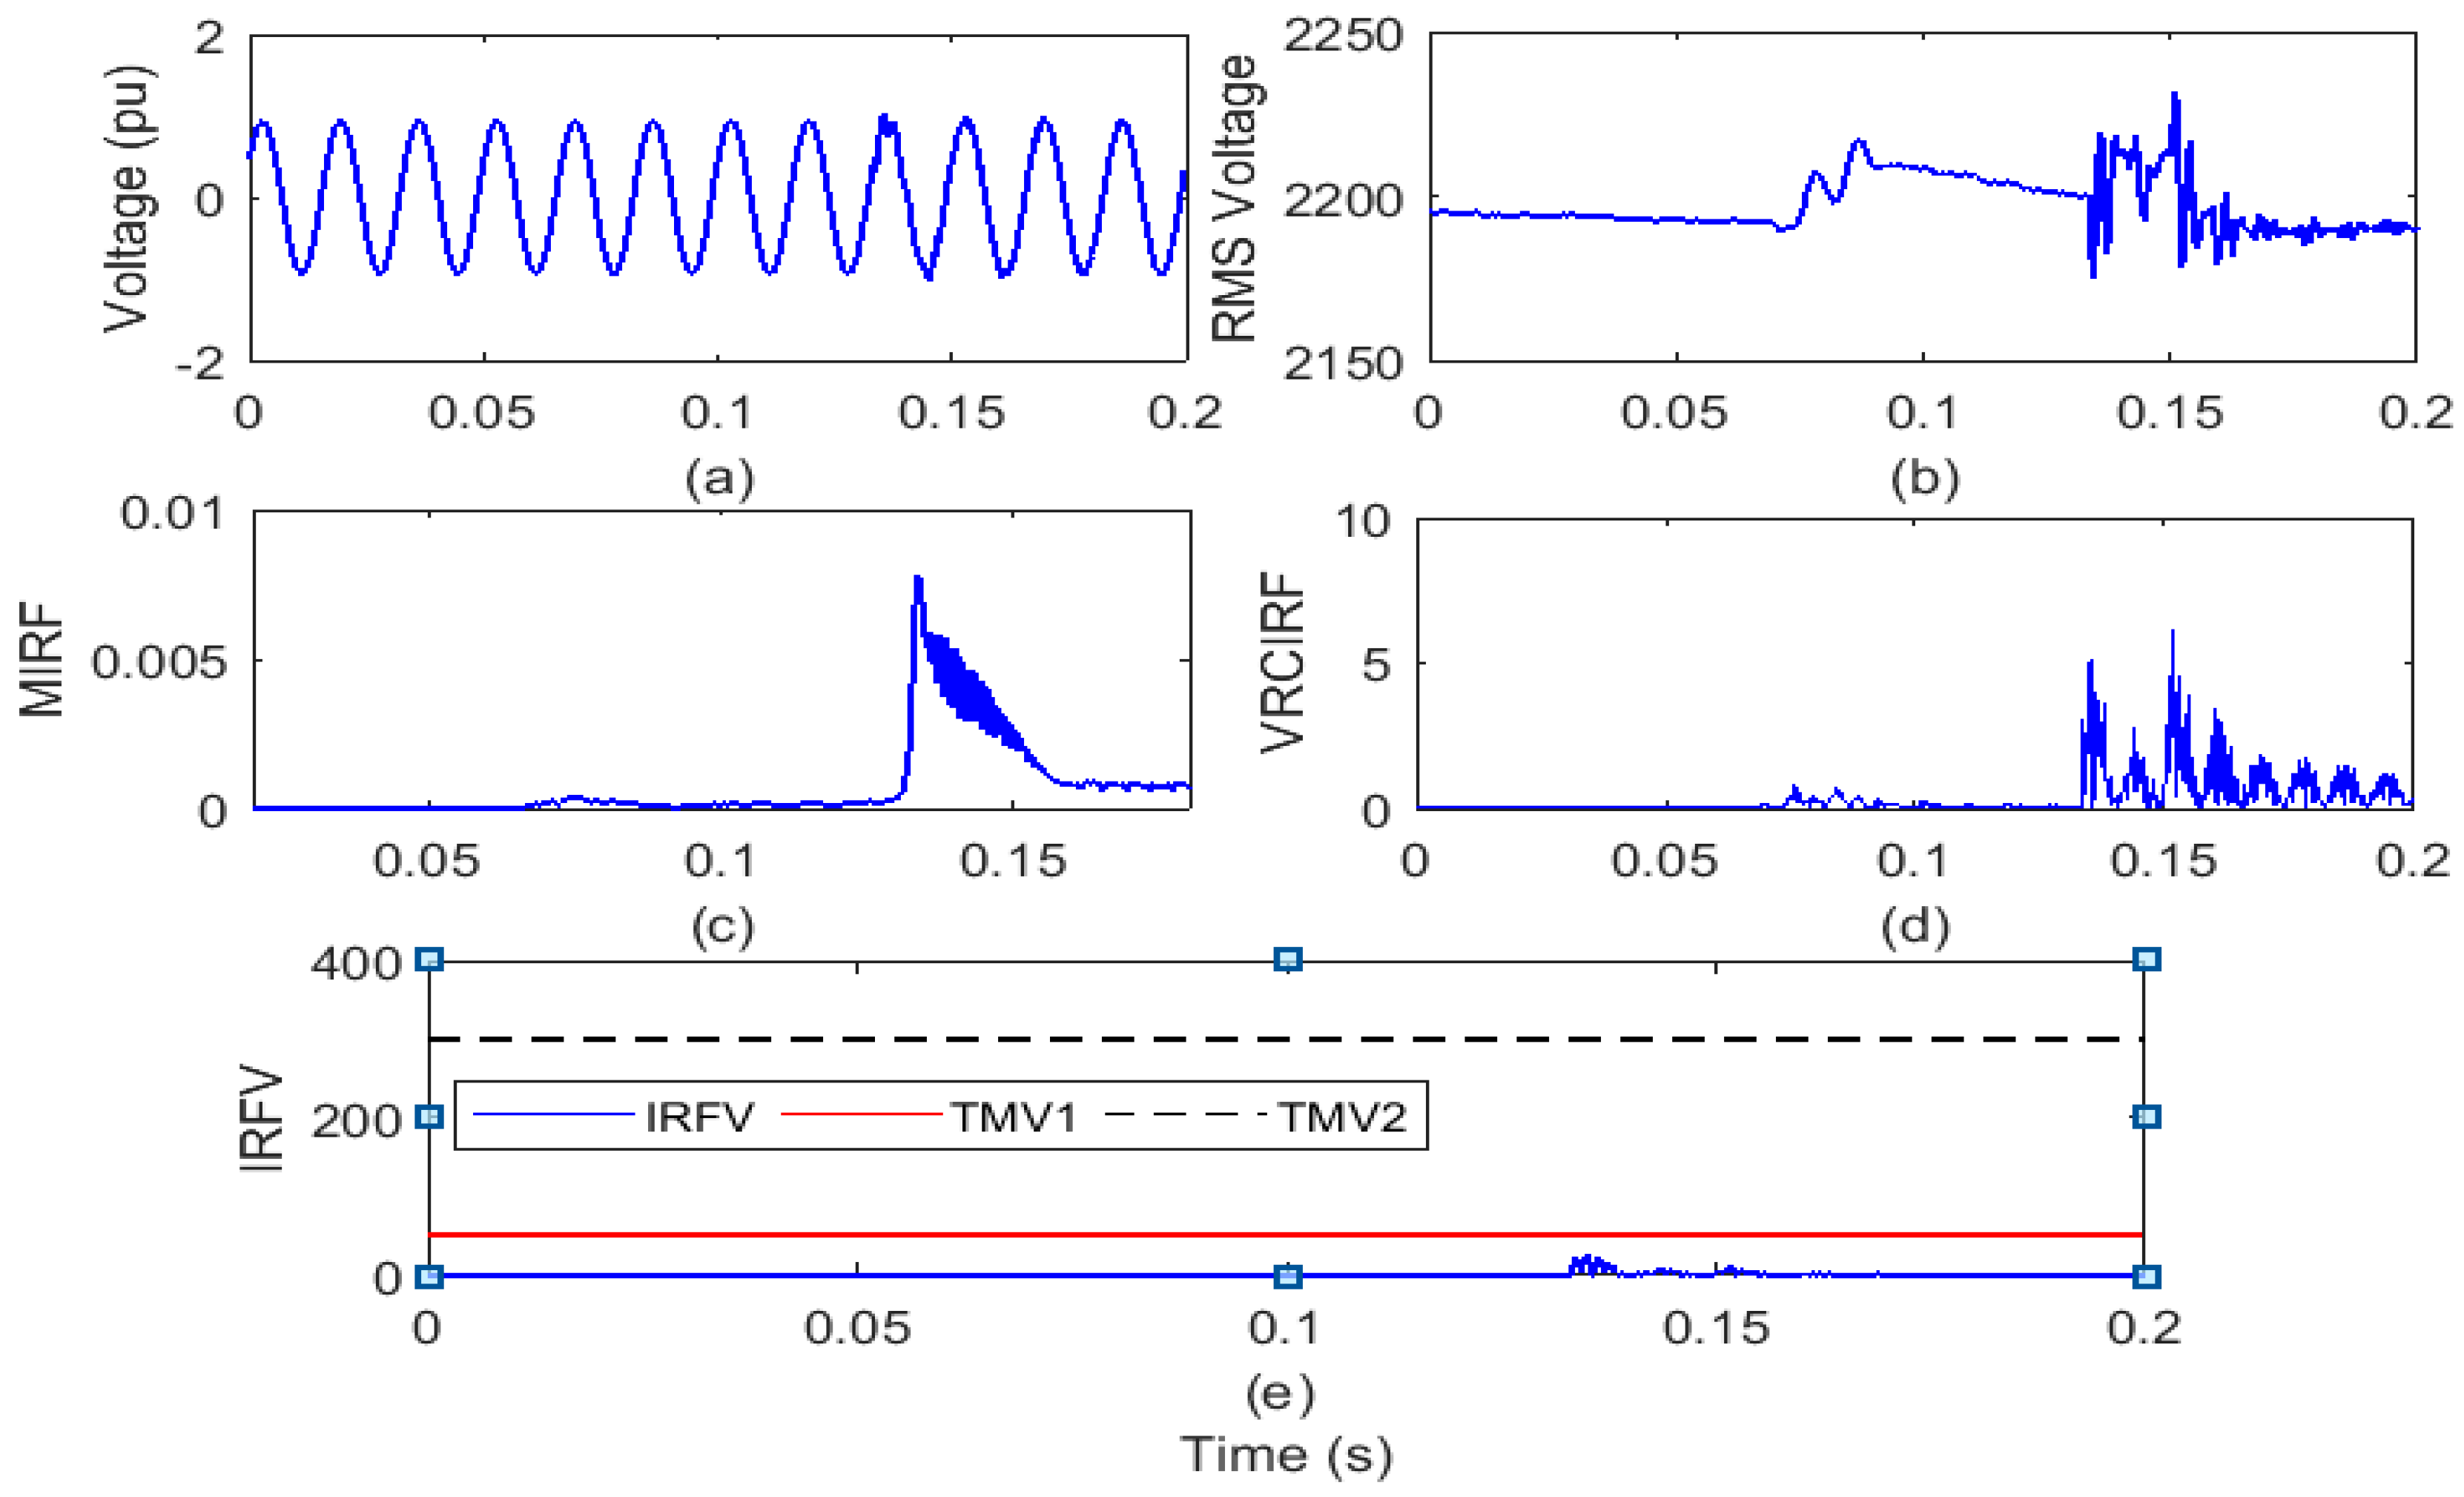
4.2.2. Islanding with Wind Energy Production

The test grid of a remote distribution system interfaced with a 1.5 MW power wind turbine is run over a span of 0.2 s. The SPP with a capacity of 1 MW is kept disconnected from the test grid in this situation. The islanding is simulated by opening the circuit breaker (CB) near node 650 of the test grid in the 6th cycle. On the islanding relay (IRL) node, the voltage waveform and root mean square value of the voltage (VR) is reported and shown in Figure 5a,b, respectively. The voltage signal is processed to compute the MIRF index using the Stockwell transform and is defined in Figure 5c. In addition, by differentiating the VR, the VRCIRF index is determined and represented in Figure 5d. In addition, the proposed voltage-based IRFV index for the identification of islanding events is computed with an acceptable WFV weight factor by element-to-element multiplication of MIRF and VRCIRF, as illustrated in Figure 5e.
After the analysis of the voltage waveform from Figure 5a, it is observed that the voltage magnitude has decreased after the incidence of the islanding event. In addition, it is also visible from Figure 5b that the magnitude of the RMS voltage decreased from 2180 V to a minimum of 940 V. In addition, the RMS voltage is often correlated with disturbances. In addition, it is compiled from Figure 5c that in the presence of wind power generation, the magnitude of the MIRF index is zero before the occurrence of the islanding event and becomes finite at the time of incidence of the event. After the occurrence of an incident, the magnitude decreases again and becomes close to zero. The VRCIRF index included in Figure 5d indicates that the magnitude is near to zero before the incidence of the islanding event in the presence of wind power generation. After the incidence of the islanding event, the magnitude increases and becomes high, and continuous high magnitude ripples are observed. The magnitude of the IRFV index included in Figure 5e is zero before incidence of the islanding event and becomes high at the time of incidence of the islanding event. At the moment when the islanding event is incident in the presence of wind power generation, the magnitude of the IRFV index becomes greater than the threshold TMV1 but remains below the threshold TMV2. Hence, it is concluded that the islanding event in the presence of wind power generation is recognized effectively and also discriminated from both the faulty events and operational events.

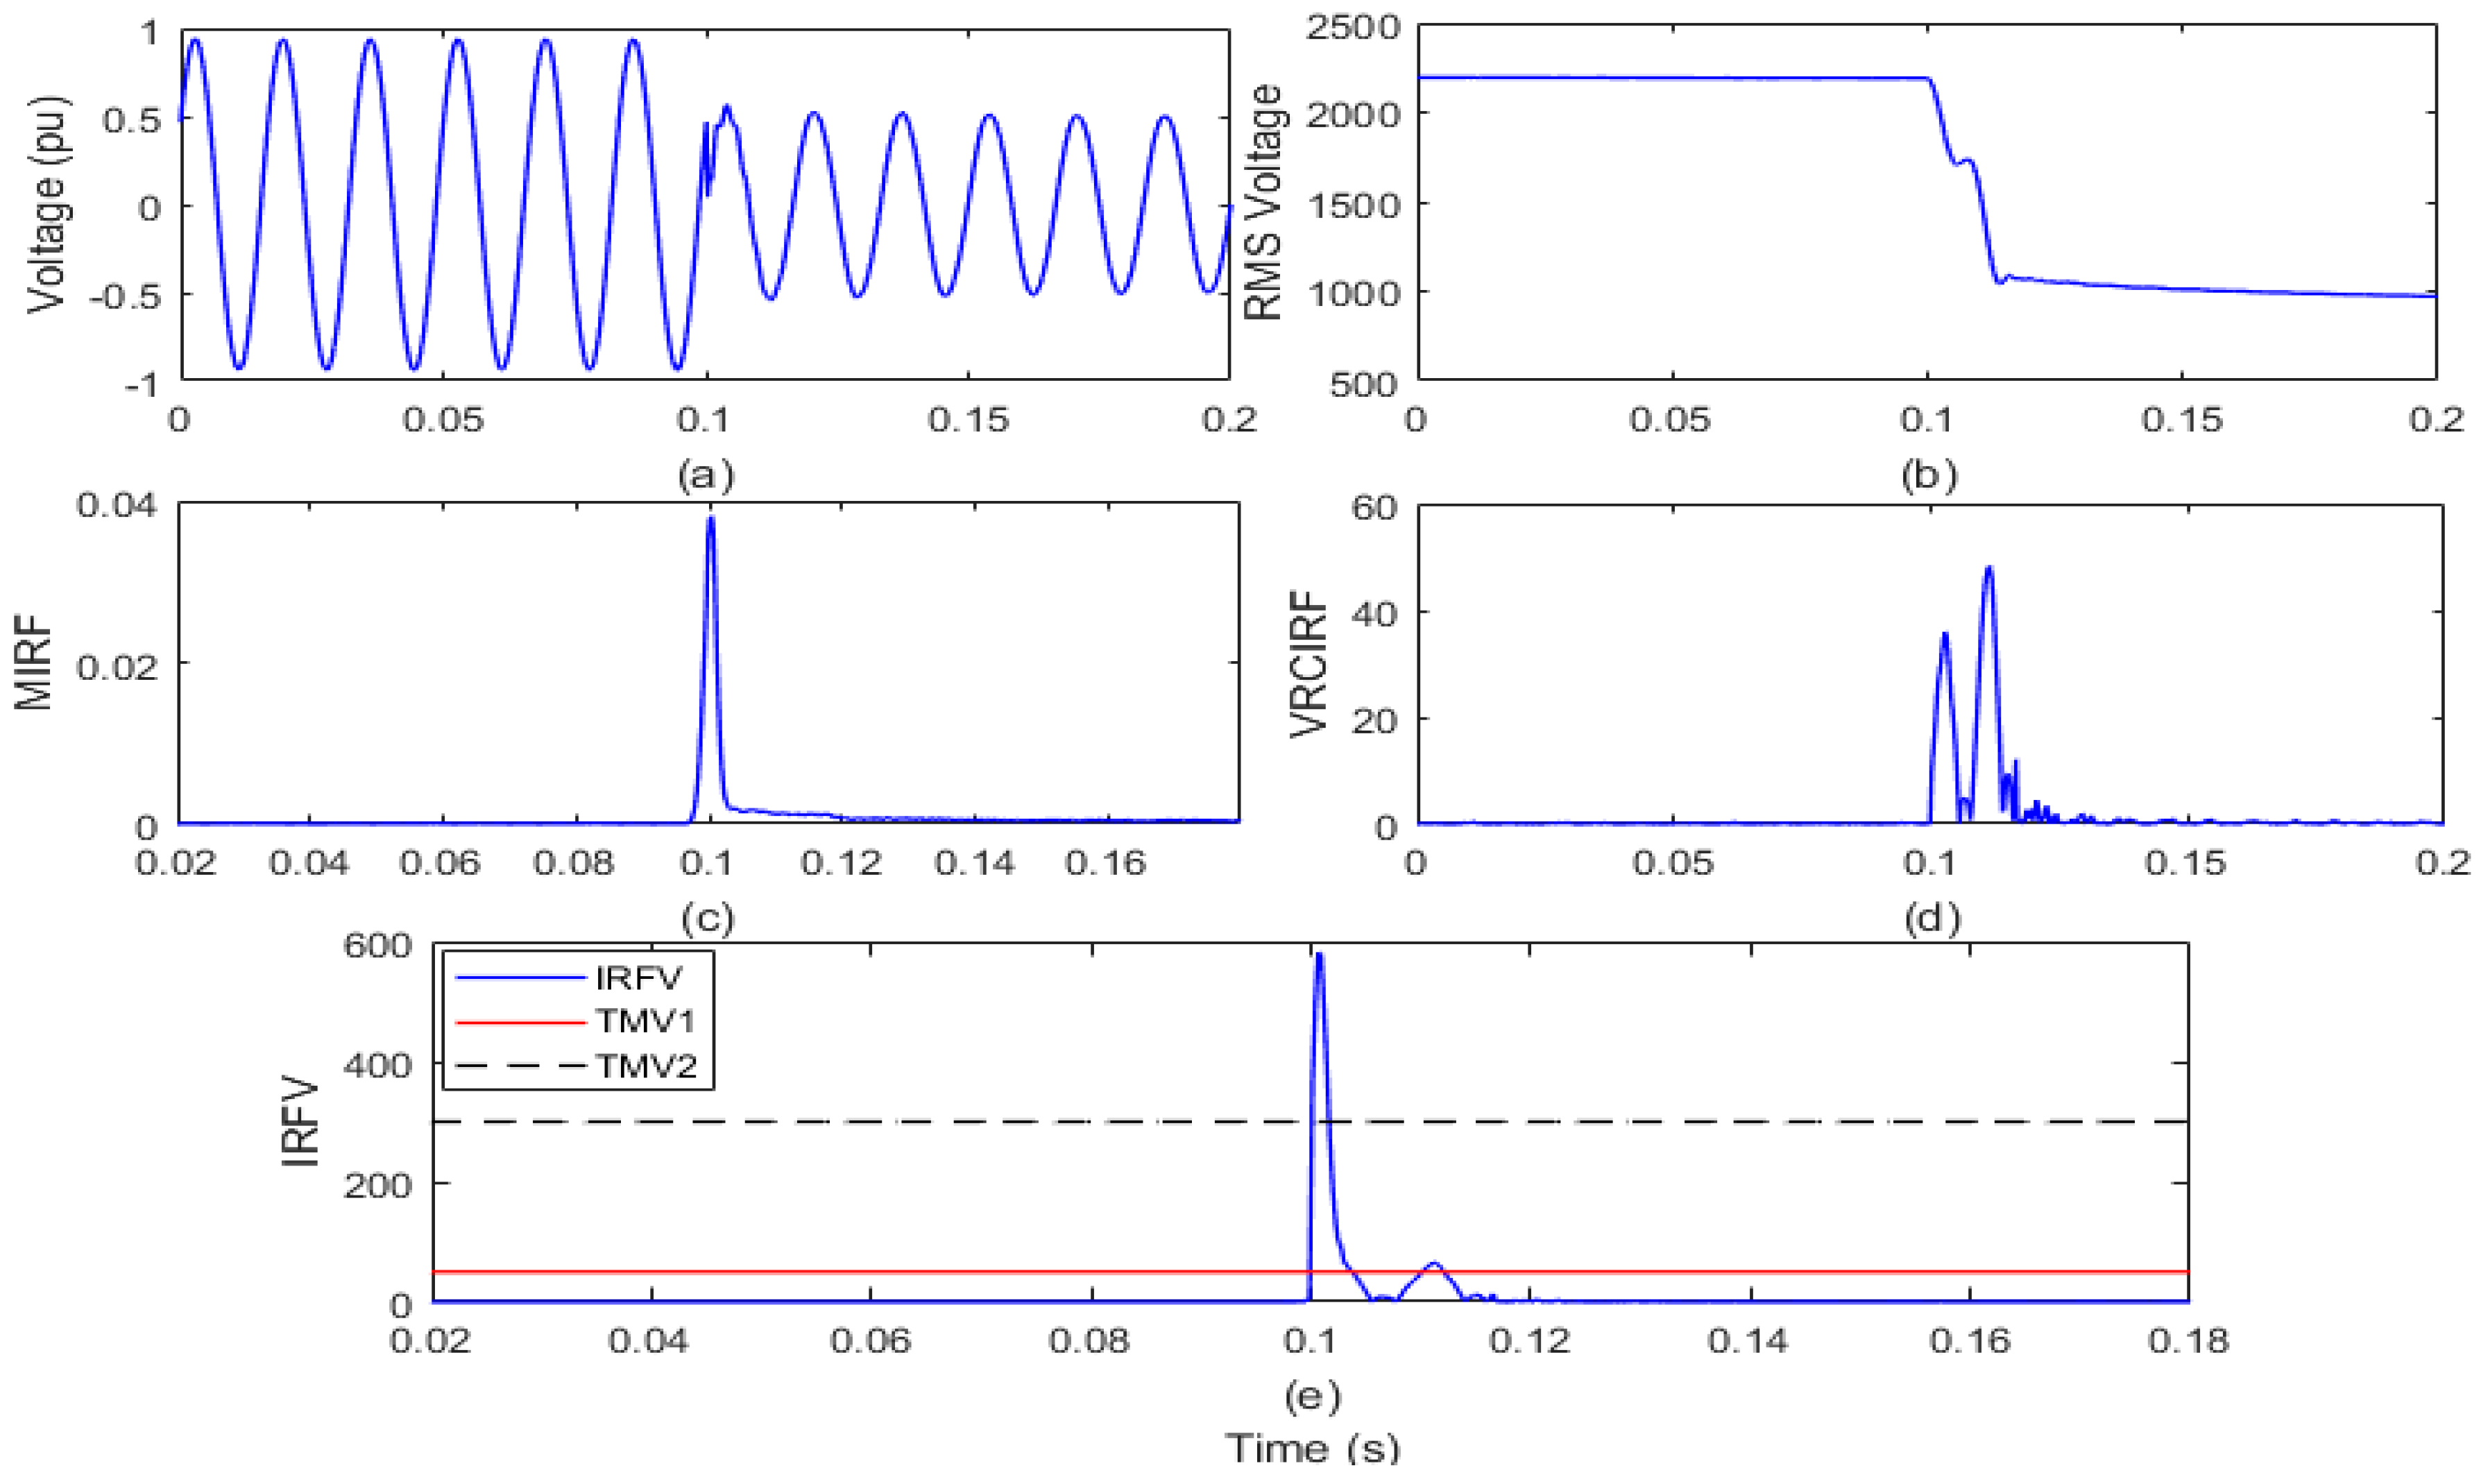
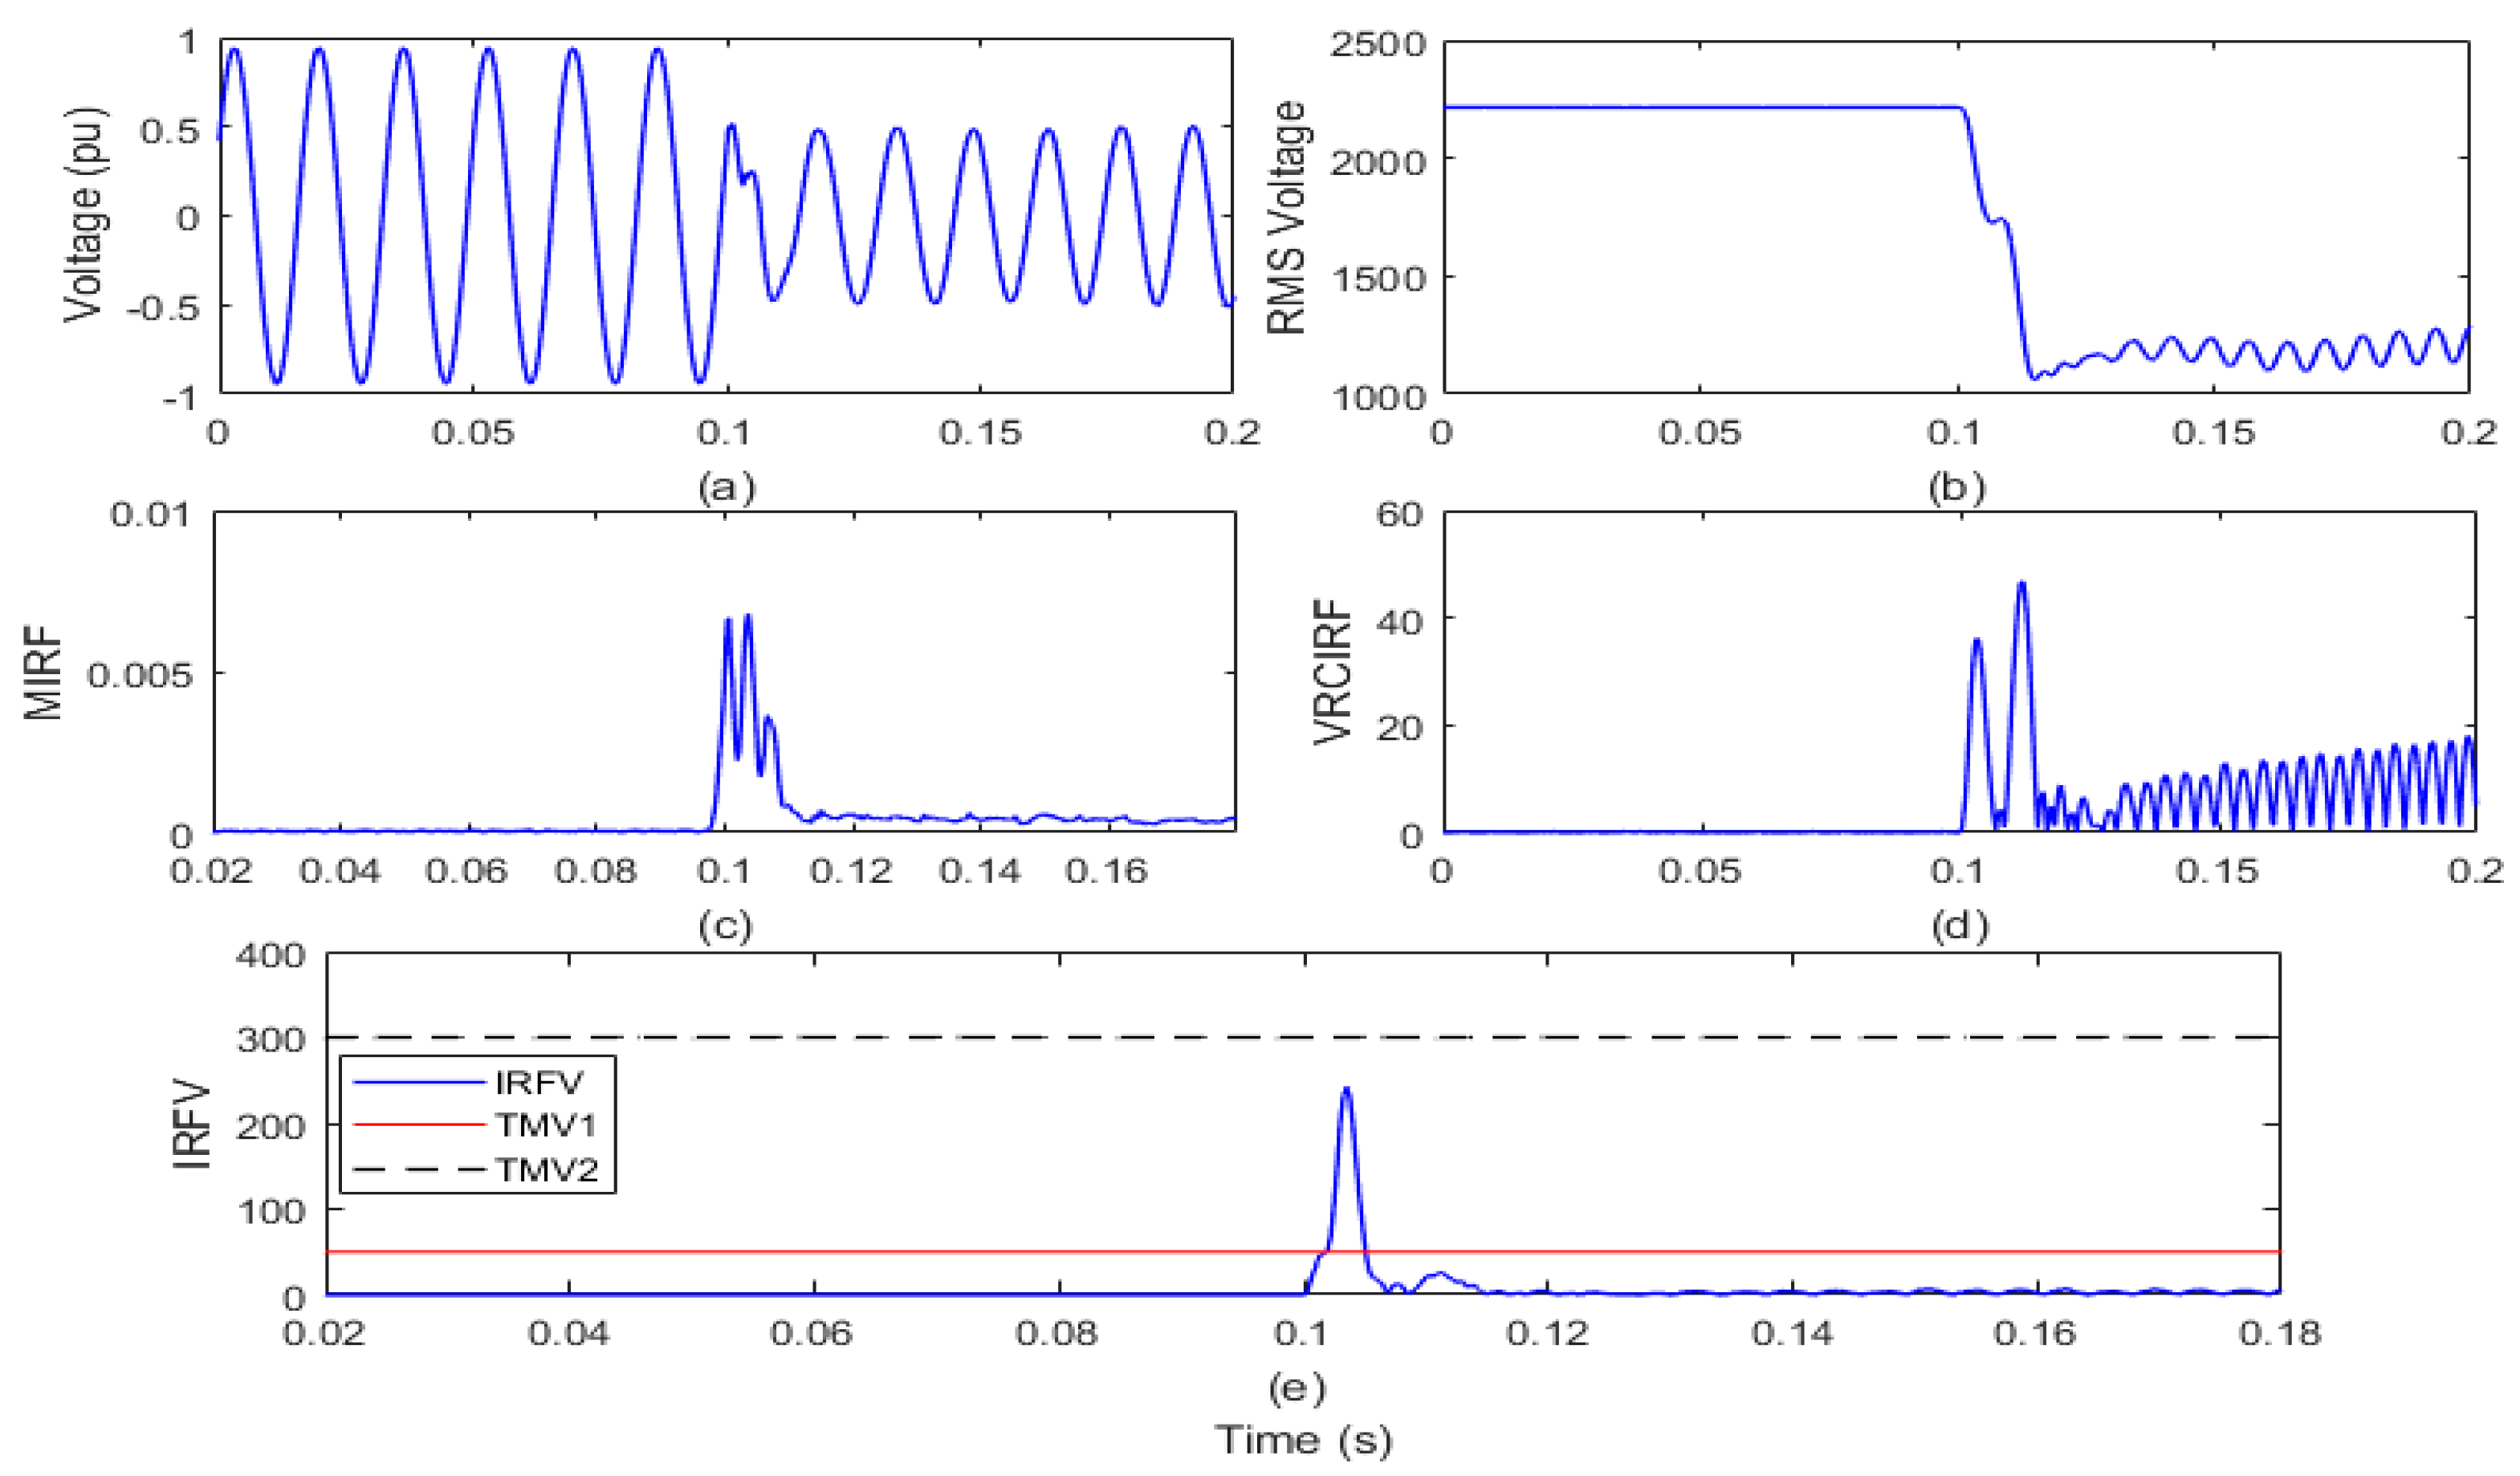
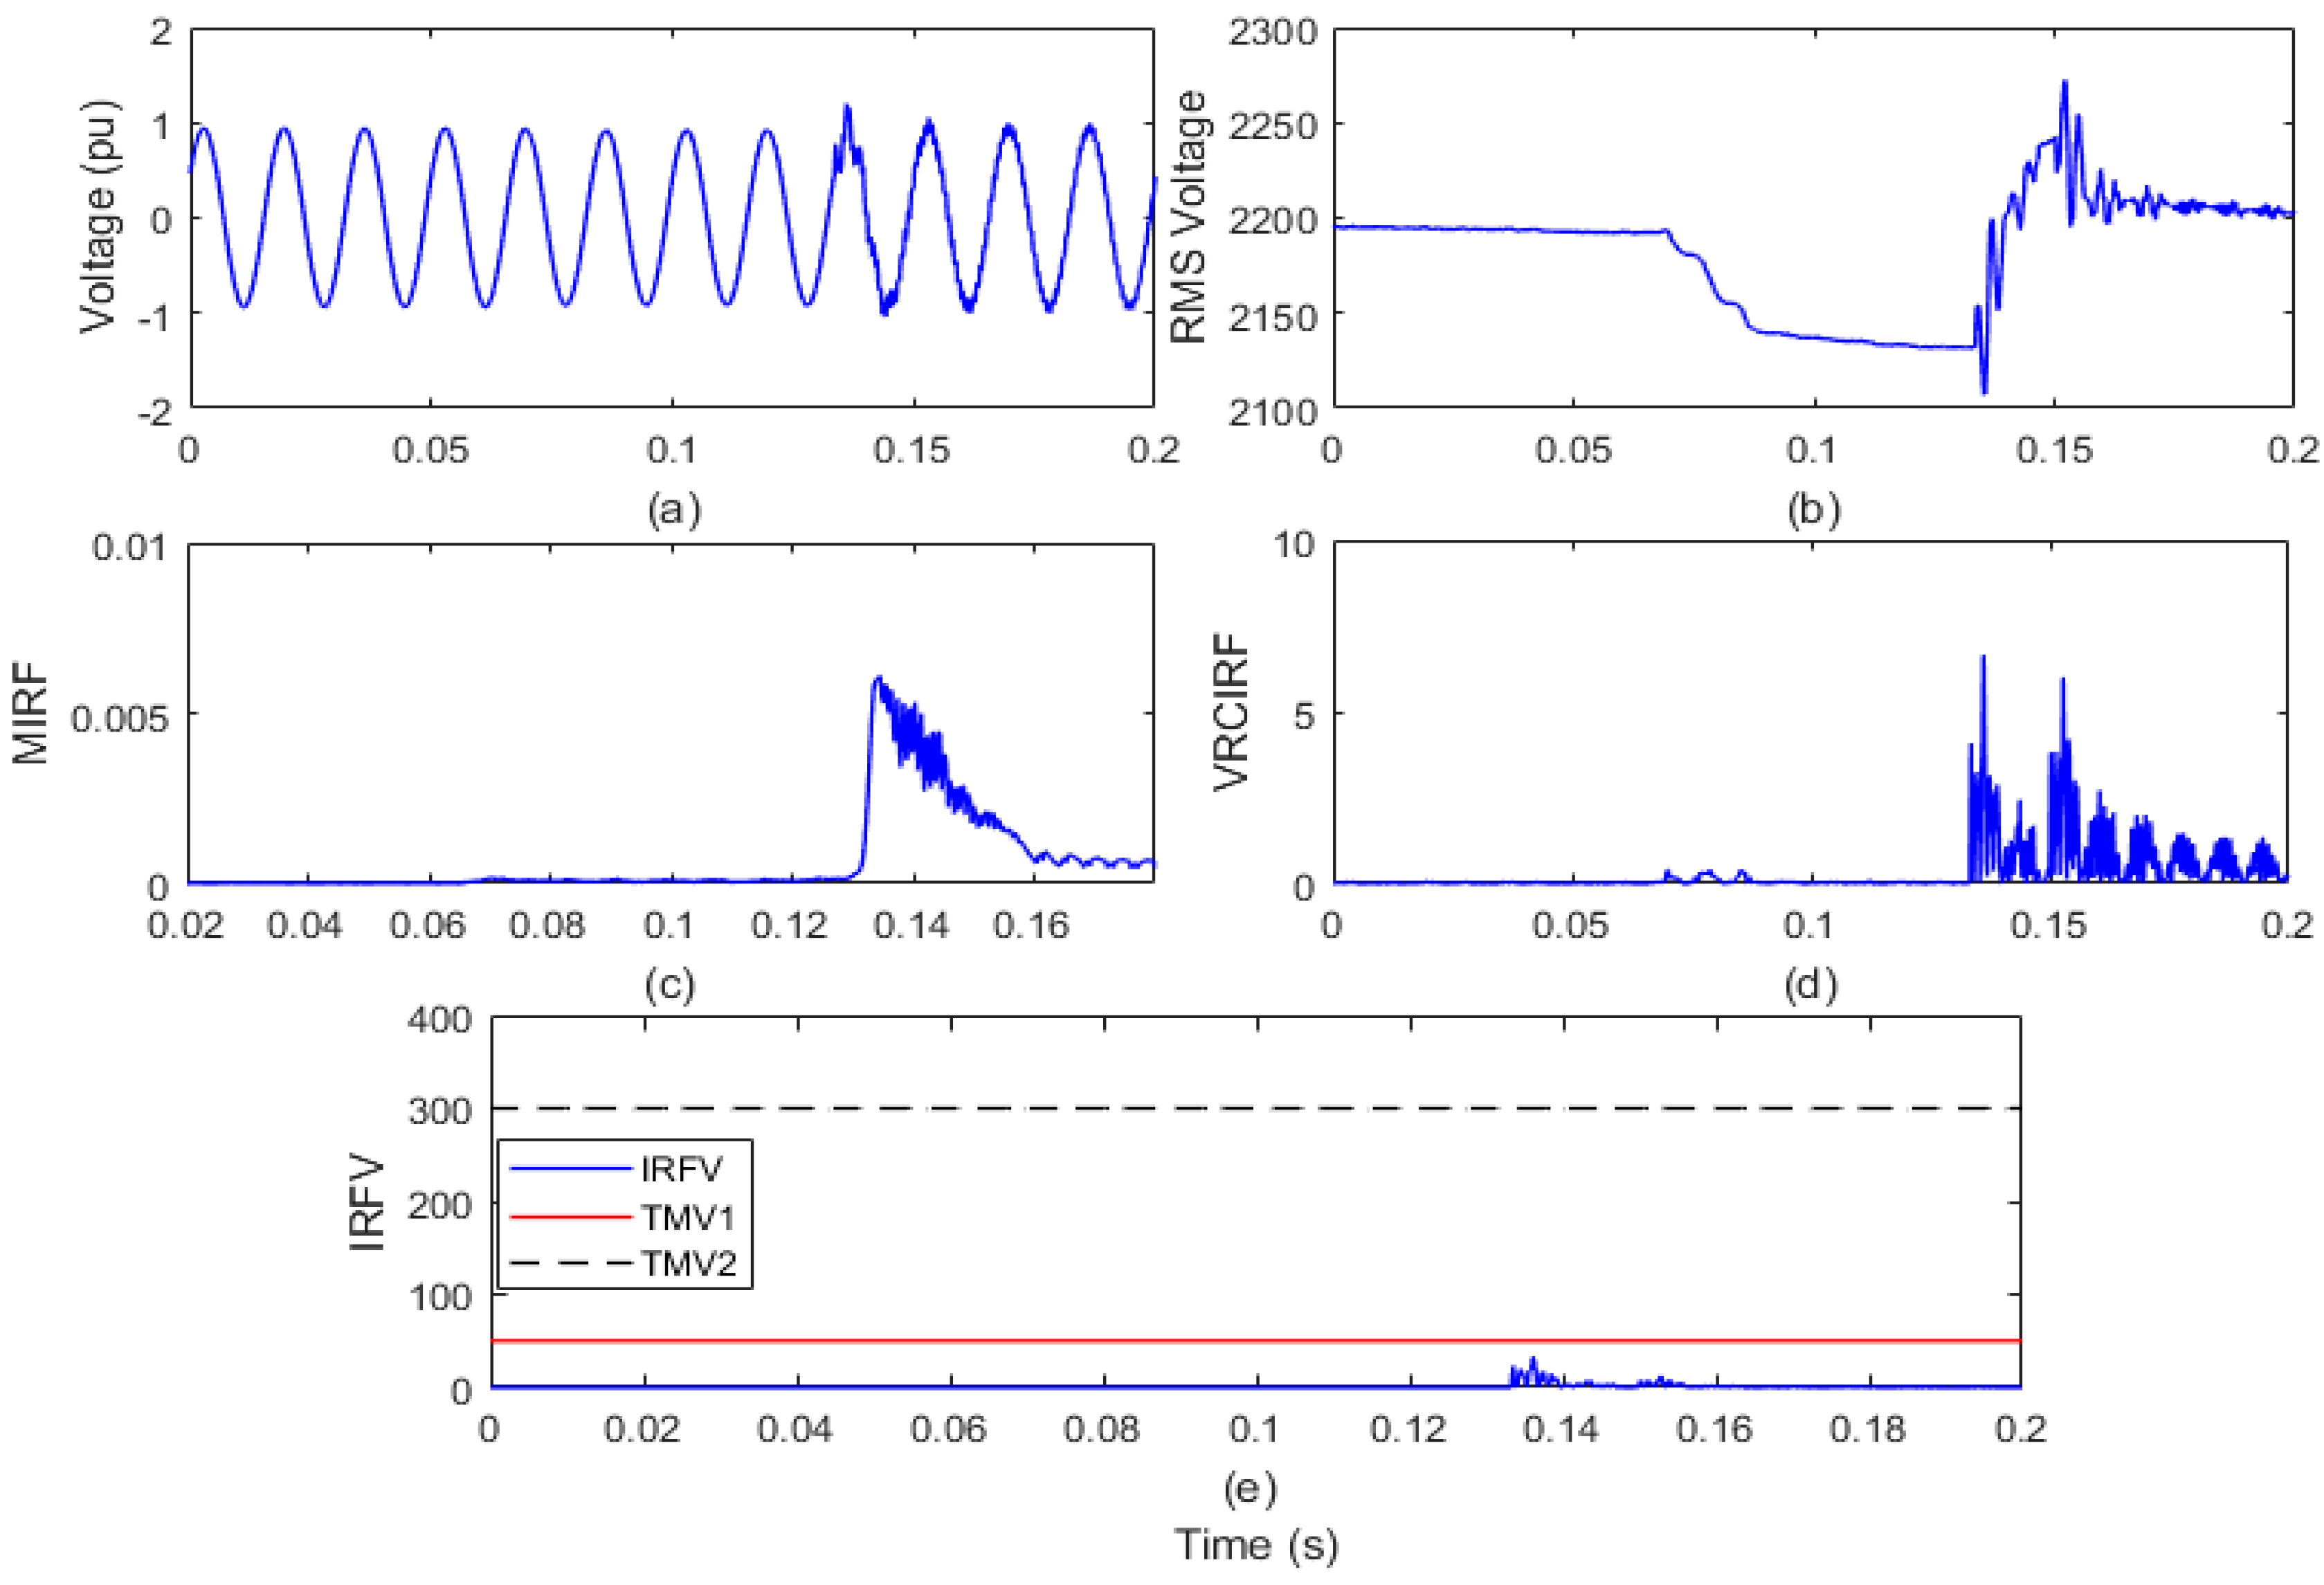
4.2.3. Islanding with Solar Energy Production
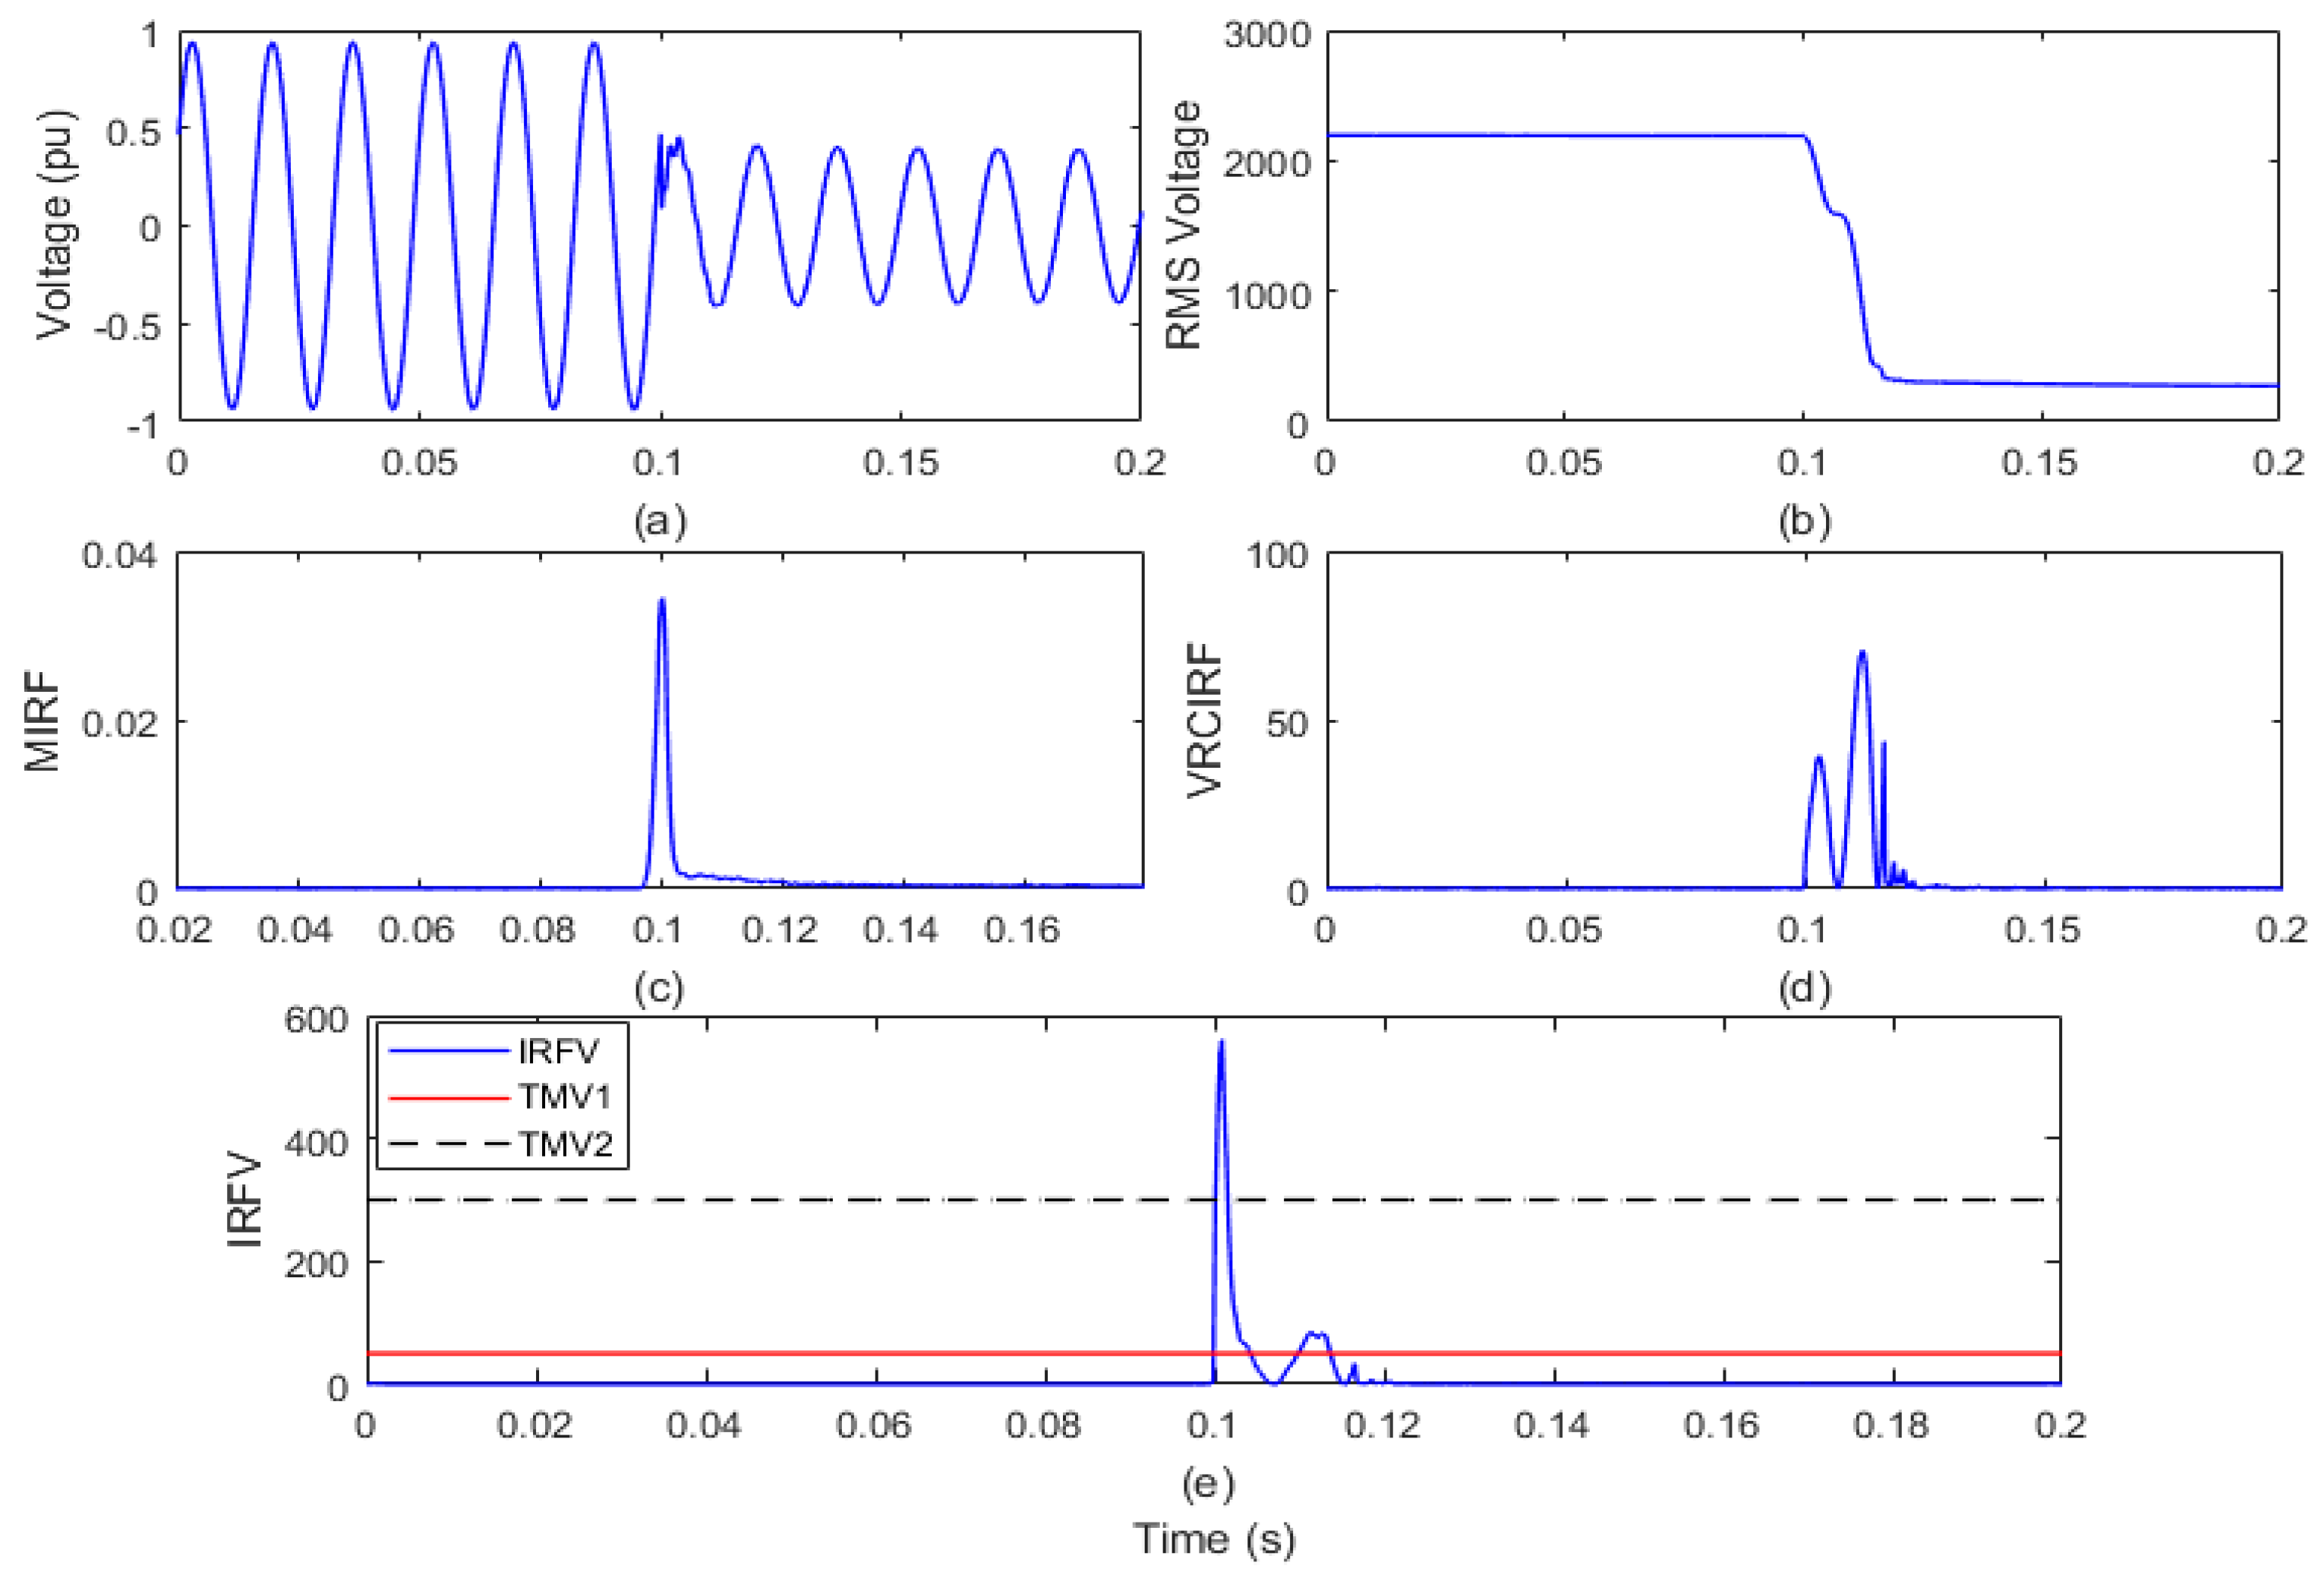
The test grid of a remote distribution system interfaced with a 1 MW solar photovoltaic power plant is run over a span of 0.2 s. The WPP of 1.5 MW power is kept disconnected from the test grid in this situation. By opening the circuit breaker (CB) installed near node 650 of the test grid in the 6th cycle, the islanding event is simulated. The voltage waveform and root mean square value of the voltage (VR) are recorded on the islanding relay location (IRL) node and shown in Figure 6a,b, respectively. The voltage signal is processed to compute the MIRF index using the Stockwell transform and is defined in Figure 6c. In addition, by differentiating the VR, the VRCIRF index is determined and represented in Figure 6d. In addition, the proposed voltage-based IRFV index for the identification of islanding events is computed with an acceptable WFV weight factor by element-to-element multiplication of MIRF and VRCIRF, as illustrated in Figure 6e.
After the voltage waveform analysis from Figure 6a, it is observed that the voltage magnitude has decreased in the presence of solar power generation after the occurrence of the islanding event. In addition, it is also visible from Figure 6b that the magnitude of the RMS voltage decreased from 2180 V to a minimum of 1102 V. In addition, the RMS voltage is often correlated with disturbances. It is, however, compiled from Figure 6c that with solar energy production before the incidence of the islanding event, the magnitude of the MIRF index is zero and becomes finite at the time of the event’s incidence. After the occurrence of an incident, the magnitude decreases again and becomes close to zero. An index of VRCIRF included in Figure 6d indicates that the magnitude is close to zero with solar energy production, prior to the occurrence of the islanding phenomenon. After the incidence of the islanding event, magnitude increases and becomes high, and continuous high magnitude ripples are observed. The magnitude of the IRFV index included in Figure 6e is zero before the incidence of the islanding event and becomes high at the time of incidence of the islanding event. At the moment when the islanding event is incident with solar energy production, the magnitude of the IRFV index becomes greater than the threshold TMV1 but remains below the threshold TMV2. Hence, it is concluded that the islanding event with solar energy production is recognized effectively and also discriminated from both the faulty events and operational events.

4.3. Faulty Events

The results of the recognition of defective events such as a single-phase fault, two-phase fault, two-phase-to-ground fault and three-phase fault involving ground are detailed in this section.

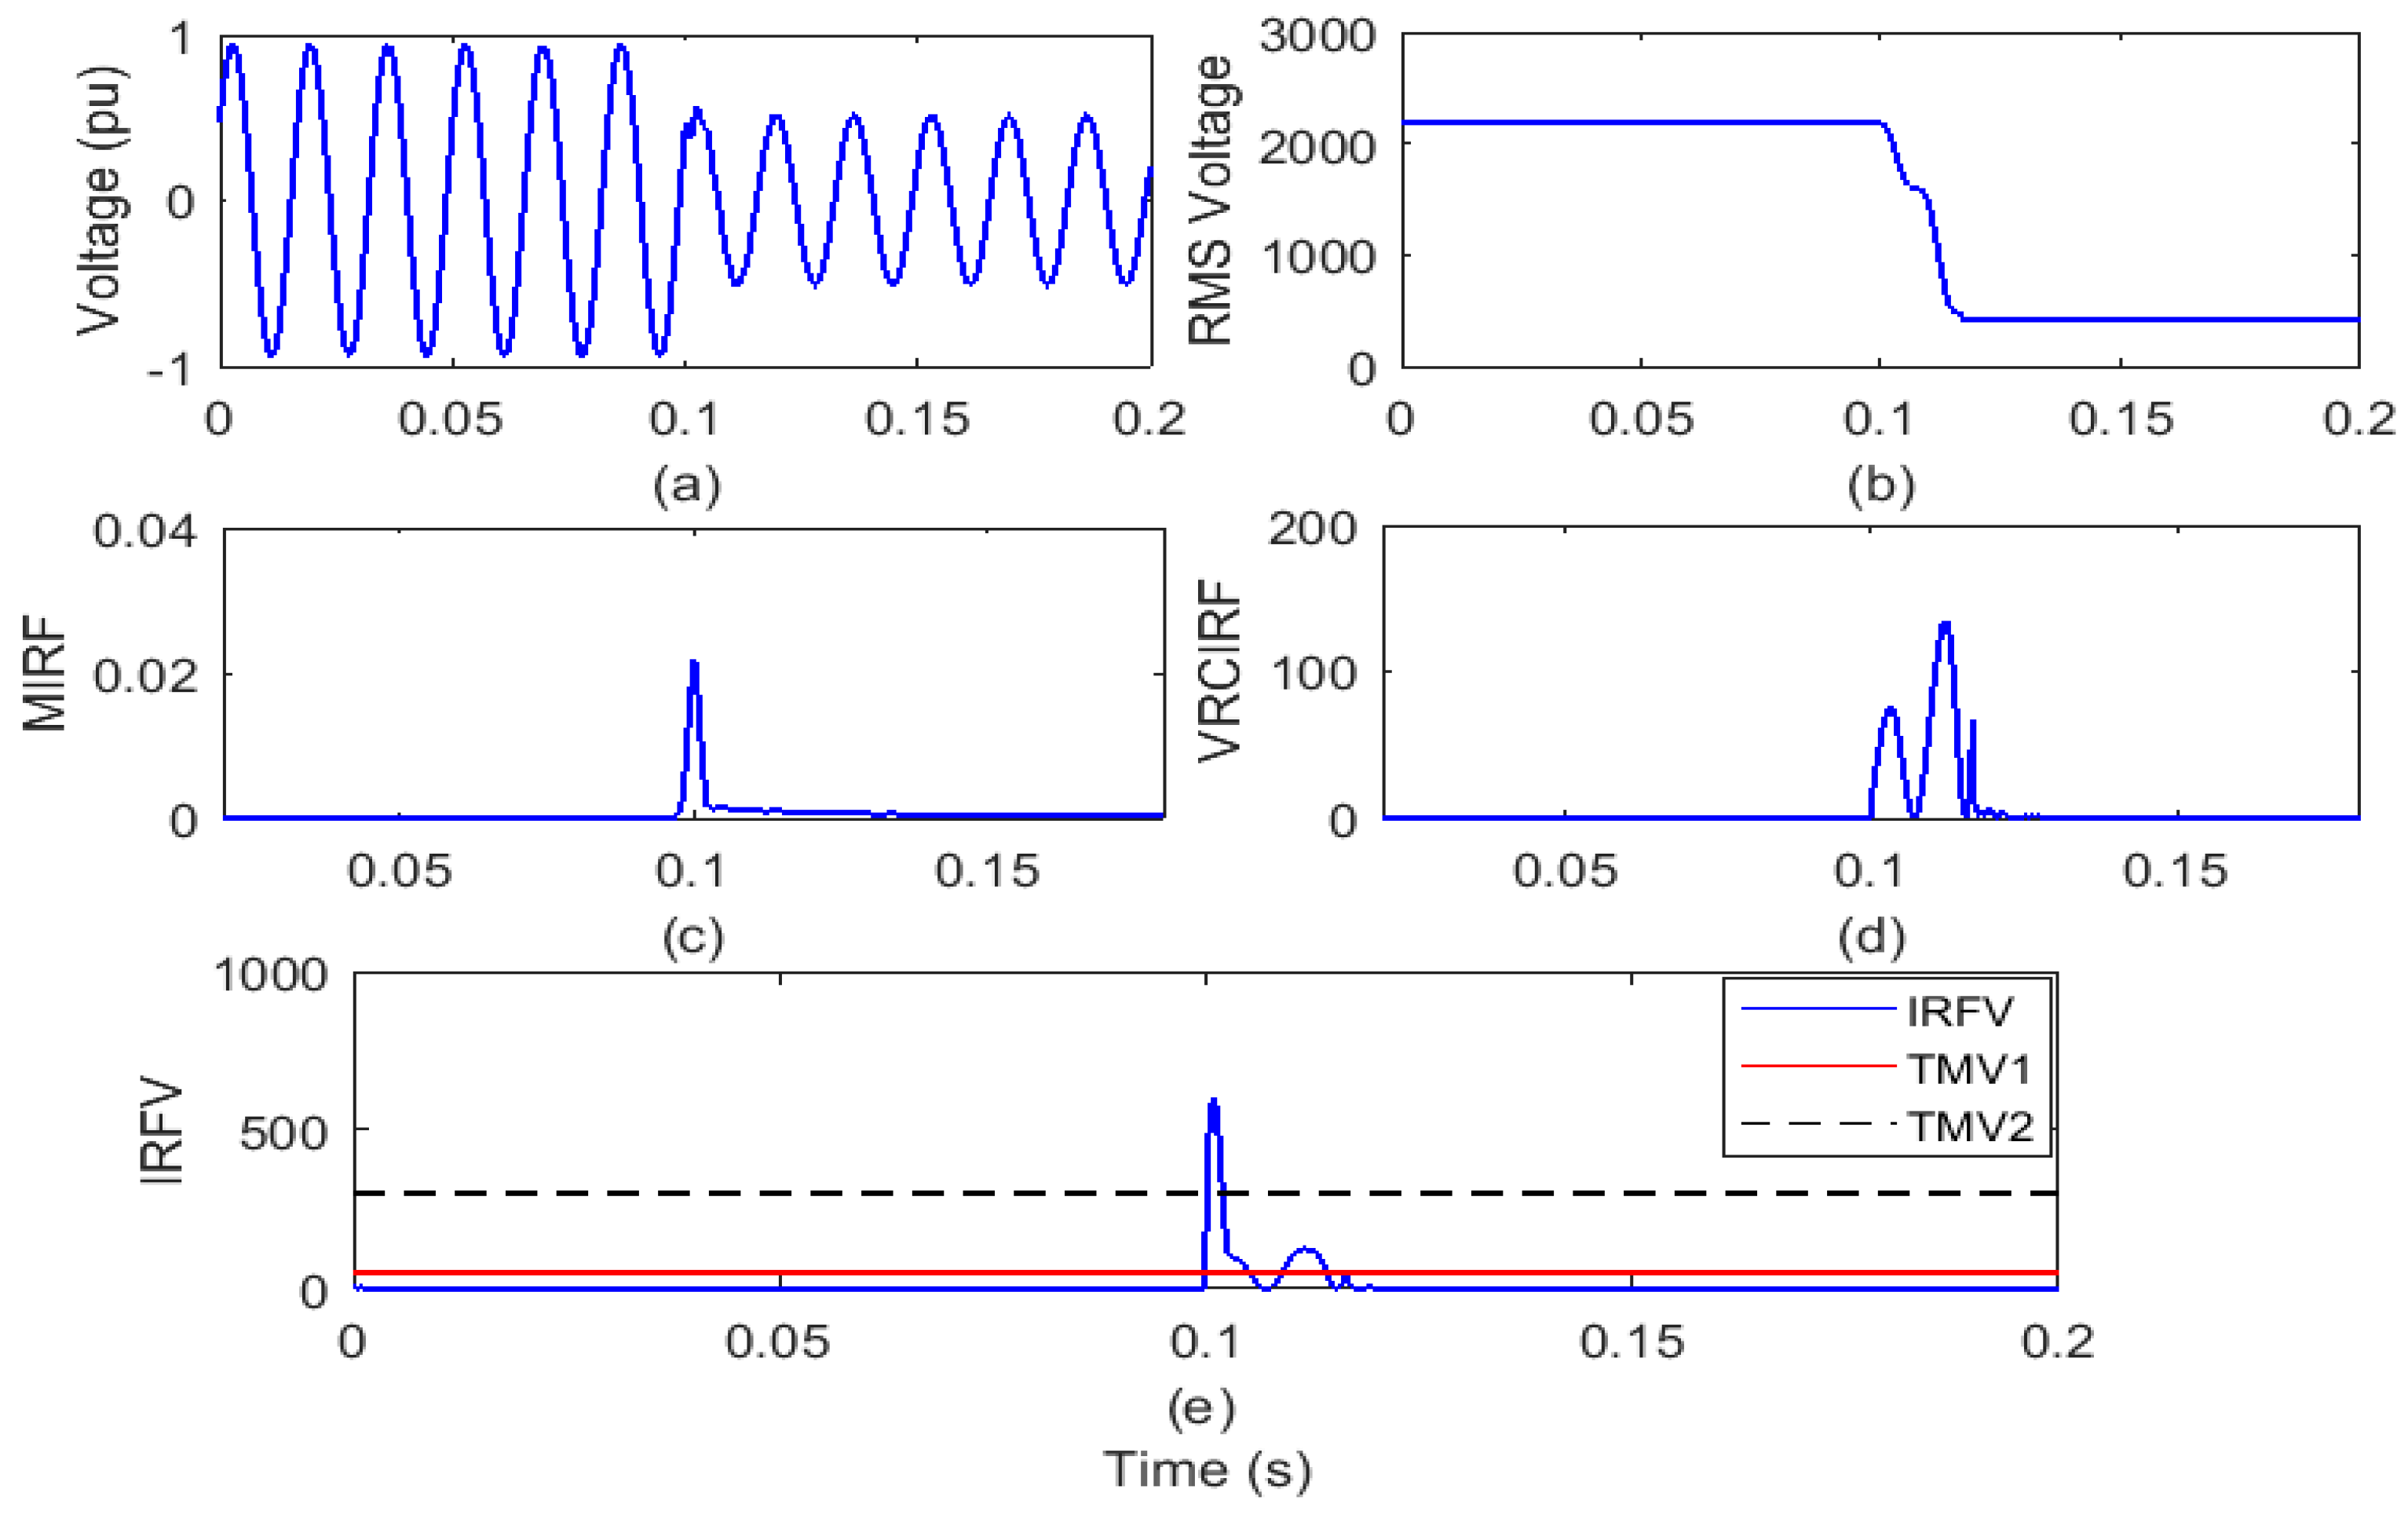
4.3.1. Single-Phase-to-Ground Fault

For a time of 0.2 s, the test grid of the remotely located distribution system is interfaced with WPP and SPP operates. At node 646 of the test grid, a line-to-ground (LG) fault is simulated during the 6th cycle. On the islanding relay position (IRL) node, the voltage waveform and RMS value of the voltage (VR) are reported and shown in Figure 7a,b, respectively. The voltage signal is processed to compute the MIRF index using Stockwell transform and is defined in Figure 7c. In addition, by differentiating the VR represented in Figure 7d, the VRCIRF index is determined. In addition, the proposed voltage-based IRFV index for the identification of islanding events is computed with an acceptable WFV weight factor by element-to-element multiplication of MIRF and VRCIRF, as illustrated in Figure 7e.
After an analysis of the voltage waveform from Figure 7a, it is clear that the voltage magnitude has decreased after the incidence of LG fault. In addition, it is also visible from Figure 7b that after the LG fault occurrence, the RMS voltage magnitude decreased from 2180 V to a minimum of 506 V. In addition, the RMS voltage is often correlated with disturbances. Furthermore, it is compiled from Figure 7c that the MIRF index magnitude is zero prior to the incidence of LG fault and becomes finite at the time of incidence of LG fault. After the incidence of LG fault event, the magnitude again decreases and becomes near to zero. VRCIRF index included in Figure 7d indicates that the magnitude is near to zero before incidence of the LG fault. After the incidence of the LG fault, magnitude increases and becomes high, two continuous high magnitude ripples are observed, and magnitude finally again becomes zero. The magnitude of the IRFV index included in Figure 7e is zero before incidence of the LG fault and becomes high at the time of incidence of the LG fault. At the moment of the LG fault incidence, the magnitude of the IRFV index becomes greater than the threshold TMV2. Hence, it is concluded that the LG fault is recognized effectively and also discriminated from both the islanding event and operational events.

4.3.2. Two-Phase Fault

The test grid of the remotely located distribution system interfaced with WPP and SPP is operated for a period of 0.2 s. At node 646 of the test grid, a line-to-line (LL) fault is simulated at the 6th cycle. On the islanding relay position (IRL) node, the voltage waveform and RMS value of the voltage (VR) are reported and shown in Figure 8a,b, respectively. The voltage signal is processed to compute the MIRF index using the Stockwell transform and is defined in Figure 8c. In addition, by differentiating the VR, the VRCIRF index is determined and represented in Figure 8d. In addition, the proposed voltage-based IRFV index for the identification of islanding events is computed with an acceptable WFV weight factor by element-to-element multiplication of MIRF and VRCIRF, as illustrated in Figure 8e.
After the voltage waveform analysis from Figure 8a, it is observed that the magnitude of the voltage decreased after the LL fault occurrence. In addition, it is also visible from Figure 8b that the RMS voltage magnitude after the LL fault incidence has decreased from 2180 V to a minimum of 1001 V. In addition, the RMS voltage is often correlated with disturbances. In addition, it is compiled from Figure 8c that the MIRF index magnitude is zero before the LL fault incidence and becomes finite at the time of the LL fault incidence. The magnitude decreases again after the occurrence of the LL fault event and becomes close to zero. The VRCIRF index included in Figure 8d indicates that the magnitude is near to zero before the incidence of the LL fault. After the incidence of the LL fault, the magnitude increases and becomes high, two continuous high magnitude ripples are observed, and magnitude finally again becomes zero. The magnitude of the IRFV index included in Figure 8e is zero before the incidence of the LL fault and becomes high at the time of incidence of the LL fault. At the moment of LL fault incidence, the magnitude of the IRFV index becomes greater than the threshold TMV2. Hence, it is concluded that the LL fault is recognized effectively and also discriminated from both the islanding event and operational events.

4.3.3. Two-Phase-to-Ground Fault

The test grid of the remotely located distribution system interfaced with WPP and SPP is operated for a period of 0.2 s. A two-phase-to-ground (LLG) fault is simulated in the 6th cycle at node 646 of the test grid. On the islanding relay position (IRL) node, the voltage waveform and root mean square value of the voltage (VR) are reported and shown in Figure 9a,b, respectively. The voltage signal is processed to compute the MIRF index using Stockwell transform and is defined in Figure 9c. In addition, by differentiating the VR, the VRCIRF index is determined and represented in Figure 9d. Further, proposed voltage-based index IRFV for islanding events recognition is computed by element-to-element multiplication of MIRF and VRCIRF with a suitable weight factor WFV, which is illustrated in Figure 9e.
After the voltage waveform analysis from Figure 9a, it is observed that the magnitude of the voltage decreased after the LLG fault incidence. In addition, it is also visible from Figure 9b that, after the LLG fault occurrence, the RMS voltage magnitude decreased from 2180 V to a minimum of 428 V. In addition, the RMS voltage is often correlated with disturbances. In addition, it is compiled from Figure 9c that the magnitude of the MIRF index is zero before the LLG fault incidence and becomes finite when the LLG fault incidence occurs. After the incidence of the LLG fault event, the magnitude again decreases and becomes near to zero. The VRCIRF index included in Figure 9d indicates that the magnitude is near to zero before the incidence of the LLG fault. After the incidence of the LLG fault, the magnitude increases and becomes high, two continuous high magnitude ripples are observed, and magnitude finally again becomes zero. The magnitude of the IRFV index included in Figure 9e is zero before the incidence of the LLG fault and becomes high at the time of incidence of the LLG fault. At the moment of the LLG fault incidence, the magnitude of the IRFV index becomes greater than the threshold TMV2. Hence, it is concluded that the LLG fault is recognized effectively and also discriminated from both the islanding event and operational events.

4.3.4. Three-Phase Fault with Ground

The test grid of the remotely located distribution system interfaced with WPP and SPP is operated for a period of 0.2 s. At node 646 of the test grid, a three-phase-to-ground (LLLG) fault is simulated at 6th cycle. On the islanding relay position (IRL) node, the voltage waveform and root mean square value of the voltage (VR) are reported and shown in Figure 10a,b, respectively. The voltage signal is processed to compute the MIRF index using Stockwell transform and is defined in Figure 10c. In addition, by differentiating the VR, the VRCIRF index is determined and represented in Figure 10d. Further, the proposed voltage-based index IRFV for islanding events recognition is computed by element-to-element multiplication of MIRF and VRCIRF with a suitable weight factor WFV, which is illustrated in Figure 10e.
After the voltage waveform analysis from Figure 10a, it is observed that after the occurrence of LLLG failure, the voltage magnitude decreased. In addition, it is also visible from Figure 10b that after the LLLG fault occurrence, the RMS voltage magnitude decreased from 2180 V to a minimum of 278 V. In addition, the RMS voltage is often correlated with disturbances. In addition, it is compiled from Figure 10c that magnitude of the MIRF index is zero prior to LLLG fault incidence and becomes finite at the time of LLLG fault incidence. After the incidence of LLLG fault event, the magnitude again decreases and becomes near to zero. The VRCIRF index included in Figure 10d indicates that magnitude is near to zero before the incidence of the LLLG fault. After the incidence of the LLLG fault, the magnitude increases and becomes high, two continuous high magnitude ripples are observed, and magnitude finally again becomes zero. The magnitude of the IRFV index included in Figure 10e is zero before the incidence of the LLLG fault and becomes high at the time of incidence of the LLLG fault. At the moment of LLLG fault incidence, the magnitude of the IRFV index becomes greater than the threshold TMV2. Hence, it is concluded that the LLLG fault is recognized effectively and also discriminated from both the islanding event and operational events.

4.4. Operational Events

This section explains the effects of the detection of operational events such as SPP and WPP outages, SPP and WPP grid synchronization, feeder service, load switching and capacitor switching.

4.4.1. Outage of Wind Power Plant from Test Grid

The test grid of the remotely located distribution system interfaced with WPP and SPP is operated for a period of 0.2 s. The WPP is disconnected from the test grid to perform the outage of WPP at the 6th cycle. Voltage waveform and RMS value of the voltage (VR) are captured on the IRL node and shown in Figure 11a,b respectively. The voltage signal is processed to compute the MIRF index using Stockwell transform and is defined in Figure 11c. In addition, by differentiating the VR, the VRCIRF index is determined and represented in Figure 11d. In addition, the proposed voltage-based IRFV index for the identification of islanding events is computed with an acceptable WFV weight factor by element-to-element multiplication of MIRF and VRCIRF, as illustrated in Figure 11e.
After the analysis of the voltage waveform from Figure 11a, it is observed that the voltage magnitude remains unaffected due to the event of WPP outage. Further, it is also seen from Figure 11b that RMS voltage magnitude has increased from 2180 V to a minimum of 2224 V after WPP outage. Further, disturbances are also associated with the RMS voltage. In addition, it is compiled from Figure 11c that the value of the MIRF index is zero prior to occurrence of the WPP outage case and becomes finite by a small amount at the time of the WPP outage incidence. After incidence of event of WPP outage, magnitude again decreases and becomes near to zero. The VRCIRF index included in Figure 11d indicates that the magnitude is near to zero before the incidence of the WPP outage event. After the incidence of the WPP outage event, the magnitude increases and becomes high for short time duration and finally again becomes zero. The magnitude of the IRFV index included in Figure 11e is zero before and after the incidence of the WPP outage event. At the moment of the WPP outage event, the magnitude of the IRFV index is lower compared to the threshold TMV1. Hence, it is concluded that the WPP outage event is recognized as an operational event.

4.4.2. Outage of Solar Power Plant from Test Grid

The test grid of the remotely located distribution system interfaced with WPP and SPP is operated for a period of 0.2 s. The SPP is disconnected from the test grid to perform the outage of SPP at the 6th cycle. Voltage waveform and the RMS value of the voltage (VR) is recorded on the islanding relay location (IRL) node and shown in Figure 12a,b, respectively. Voltage signal is processed using Stockwell transform to compute the MIRF index and described in Figure 12c. Further, the VRCIRF index is computed by differentiating the VR, which is depicted in Figure 12d. Further, the proposed voltage-based index IRFV for islanding events recognition is computed by element-to-element multiplication of MIRF and VRCIRF with a suitable weight factor WFV and is illustrated in Figure 12e.
After the analysis of the voltage waveform from Figure 12a, it is observed that voltage magnitude remains unaffected due to the event of SPP outage. In addition, it is also visible from Figure 12b that the RMS voltage magnitude decreased after the SPP blackout from 2180 V to a minimum of 2165 V. In addition, the RMS voltage is decreased with disturbances. In addition, it is compiled from Figure 12c that the value of the MIRF index is zero prior to the occurrence of the SPP outage case and becomes finite by a small amount at the time of the SPP outage incidence. After incidence of the event of SPP outage, the magnitude again decreases and becomes near to zero. The VRCIRF index included in Figure 12d indicates that magnitude is near to zero before incidence of the SPP outage event. After incidence of the SPP outage event, the magnitude increases and becomes high for short time duration and finally again becomes zero. The magnitude of the IRFV index included in Figure 12e is zero before and after the incidence of the SPP outage event. At the moment of the SPP outage event, the magnitude of the IRFV index is lower compared to the threshold TMV1. Hence, it is concluded that the SPP outage event is recognized as an operational event.

4.4.3. Synchronization of SPP to Grid

The test grid of the remotely located distribution system interfaced with WPP is operated for a period of 0.2 s. SPP is initially kept disconnected from the test grid. The SPP is connected to the test grid at the 6th cycle to perform the grid synchronization of SPP. On the islanding relay position (IRL) node, the voltage waveform and RMS value of the voltage (VR) are reported and shown in Figure 13a,b, respectively. The voltage signal is processed using Stockwell transform to compute the MIRF index and described in Figure 13c. Further, the VRCIRF index is computed by differentiating the VR and is depicted in Figure 13d. Further, the proposed voltage-based index IRFV for islanding events recognition is computed by element-to-element multiplication of MIRF and VRCIRF with a suitable weight factor WFV and is illustrated in Figure 13e.
After the analysis of the voltage waveform from Figure 13a, it is observed that the voltage magnitude is increased with sharp peak transient components due to the event of SPP grid synchronization. In addition, it is also visible from Figure 13b that low magnitude transient components with RMS voltage magnitude are added after SPP grid synchronization occurs. In addition, it is compiled from Figure 13c that the value of the MIRF index is zero prior to the occurrence of the SPP grid synchronization outage event and becomes finite by a small amount at the time of the occurrence of the SPP grid synchronization event. The VRCIRF index included in Figure 13d indicates that the magnitude is near to zero before incidence of the event of SPP grid synchronization. After incidence of the SPP grid synchronization event, the magnitude becomes finite and continues until the disturbances are associated with the RMS voltage magnitude. The magnitude of the IRFV index included in Figure 13e is zero before and after incidence of the SPP grid synchronization event. At the moment of the SPP grid synchronization event, the magnitude of the IRFV index is lower compared to the threshold TMV1. Hence, it is concluded that the SPP grid synchronization event is recognized as an operational event.

4.4.4. Synchronization of WPP to Grid

The test grid of the remotely located distribution system interfaced with SPP is operated for a period of 0.2 s. The WPP is initially kept disconnected from the test grid. The WPP is connected to the test grid at 6th cycle to perform the grid synchronization of WPP. Voltage waveform and RMS value of the voltage (VR) are recorded on the islanding relay location (IRL) node and shown in Figure 14a,b, respectively. The voltage signal is processed to compute the MIRF index using Stockwell transform and is defined in Figure 14c. In addition, by differentiating the VR, the VRCIRF index is determined and represented in Figure 14d. In addition, the proposed voltage-based IRFV index for the identification of islanding events is computed with an acceptable WFV weight factor by element-to-element multiplication of MIRF and VRCIRF, as illustrated in Figure 14e.
After the analysis of the voltage waveform from Figure 14a, it is observed that voltage magnitude is increased with sharp peak transient components due to the event of WPP grid synchronization. In addition, it is also visible from Figure 14b that the magnitude of the RMS voltage first increases and then decreases because of the WPP grid synchronization event. Transient components of a small magnitude are often correlated with the RMS voltage. In addition, it is compiled from Figure 14c that the magnitude of the MIRF index is zero before the occurrence of the WPP grid synchronization event and becomes finite by a small amount at the time of the occurrence of the synchronization of the WPP grid event. The VRCIRF index included in Figure 14d indicates that the magnitude is near to zero before incidence of the event of WPP grid synchronization. After incidence of the WPP grid synchronization event, the magnitude becomes finite and continues until the disturbances are associated with the RMS voltage magnitude. The magnitude of the IRFV index included in Figure 14e is zero before and after the incidence of the WPP grid synchronization event. At the moment of the WPP grid synchronization event, the magnitude of the IRFV index is lower compared to the threshold TMV1. Hence, it is concluded that the WPP grid synchronization event is recognized as an operational event.

4.4.5. Feeder Operation

The test grid of the remotely located distribution system interfaced with WPP and SPP is operated for a period of 0.2 s. At the 4th cycle, the feeder containing nodes 692 and 675 is opened and reconnected to simulate the feeder tripping and closing at the 8th cycle. On the islanding relay position (IRL) node, voltage waveform and root mean square value of voltage (VR) are reported and shown in Figure 15a,b, respectively. Using Stockwell transform to compute the MIRF index, the voltage signal is processed and defined in Figure 15c. The VRCIRF index is further computed by differentiating the VR and shown in Figure 15d. In addition, the proposed voltage-based IRFV index for the identification of islanding events is computed with an acceptable WFV weight factor by element-to-element multiplication of MIRF and VRCIRF, as illustrated in Figure 15e.
After the voltage waveform analysis from Figure 15a, it is observed that the voltage magnitude at the time of the feeder trip is not affected. However, at the time of the feeder closure, the small magnitude transient is correlated with the voltage. In addition, it is also visible from Figure 15b that at the time of feeder tripping, the RMS voltage magnitude rises and decreases at the time of feeder closure. Both the occurrence of tripping and closing the feeder are correlated with transient components. However, relative to feeder tripping, high frequency and high magnitude transients are correlated with the feeder closing. In addition, it is compiled from Figure 15c that the magnitude of the MIRF index is zero prior to the occurrence of a feeder tripping incident. Large magnitude peaks at the time of tripping and closing of the feeder are observed. An index of VRCIRF included in Figure 15d shows that the magnitude before the occurrence of a feeder activity event is close to zero. After the feeder trip happens, the amplitude rises and decreases again. Increased magnitude at the time of feeder closure and high magnitude peaks are observed before the transient components are available with the RMS voltage. The IRFV index magnitude used in Figure 15e increases by a small amount at the time of tripping and closing of feeders. However, relative to the TMV1 threshold, the magnitude is smaller. It is, therefore, inferred that activity of the feeder event is known as an operational event.

4.4.6. Capacitor Switching

The test grid of the remotely located distribution system interfaced with WPP and SPP is operated for a period of 0.2 s. The capacitor bank of capacity 600 kVAr connected on node 675 is disconnected at the 4th cycle and reconnected at the 8th cycle to simulate the capacitor switching event. On the islanding relay position (IRL) node, voltage waveform and RMS value of the voltage (VR) are reported and shown in Figure 16a,b, respectively. The voltage signal is processed to compute the MIRF index using Stockwell transform and is defined in Figure 16c. In addition, by differentiating the VR, the VRCIRF index is determined and represented in Figure 16d. In addition, the proposed voltage-based IRFV index for identification of the islanding events is computed with an acceptable WFV weight factor by element-to-element multiplication of MIRF and VRCIRF, as illustrated in Figure 16e.
After the analysis of the voltage waveform from Figure 16a, it is observed that voltage magnitude is not affected at the time the capacitor is switched off. However, at the moment when the capacitor is turned on, the small magnitude transient is correlated with the voltage. In addition, it is also visible from Figure 16b that when the capacitor is turned off, the RMS voltage magnitude decreases and increases when the capacitor is switched on. Transient components are associated with the event that the capacitor is switched on. In addition, it is compiled from Figure 16c that the MIRF index magnitude is zero prior to the occurrence of the operation of the capacitor. At the time of the capacitor switching off, a small magnitude peak is observed, and a high magnitude peak is observed at the time of the capacitor switching on. The VRCIRF index included in Figure 16d indicates that the magnitude is near to zero before incidence of the event of capacitor operation. After incidence of the capacitor switching off, the magnitude increases and again decreases. At the time of the capacitor switching on, the magnitude increases, and high magnitude peaks are observed until the transient components are available with the RMS voltage. The magnitude of the IRFV index included in Figure 16e increases by a small amount at the moment of capacitor operation. However, the magnitude is lower compared to the threshold TMV1. Hence, it is concluded that the capacitor operation event is recognized as an operational event.

4.4.7. Load Switching

The test grid of the remotely located distribution system interfaced with WPP and SPP is operated for a period of 0.2 s. The load with rating 843 kW and 462 kVAr connected on node 675 is disconnected at the 4th cycle and reconnected at the 8th cycle to simulate the load switching event. Voltage waveform and RMS value of the voltage (VR) are recorded on the islanding relay location (IRL) node and shown in Figure 17a,b, respectively. Voltage signal is processed using Stockwell transform to compute the MIRF index and described in Figure 17c. Further, the VRCIRF index is computed by differentiating the VR and is depicted in Figure 17d. Further, the proposed voltage-based index IRFV for islanding events recognition is computed by element-to-element multiplication of MIRF and VRCIRF with a suitable weight factor WFV and is illustrated in Figure 17e.
After analysis of the voltage waveform from Figure 17a, it is observed that there is no disturbance associated to voltage waveform. It is also seen from Figure 17b that RMS voltage magnitude increases after the load is switched off and again regains original magnitude after the load is switched on. Low magnitude transient components are associated with the event of load operation. It is established from Figure 17c that sharp magnitude peaks are observed at the time of load switching off and load switching on. The VRCIRF index included in Figure 17d indicates that the magnitude is near to zero before incidence of the event of load operation. After incidence of the capacitor switching off, the magnitude increases and again decreases. At the time of the load switching on and off, the magnitude increases, and high magnitude peaks are observed until the transient components are available with the RMS voltage. The magnitude of IRFV index included in Figure 17e increases by a small amount at the moment of load operation. However, the magnitude is lower compared to the threshold TMV1. Hence, it is concluded that the load operation event is recognized as an operational event.

5. Identification of Non-Detection Zone

Non-detection zone (NDZ) is an important parameter to analyze the effectiveness of an IDM. In this zone, the islanding event is not identified in a definite time due to a mismatch in the power generation and demand. In this study, NDZ is identified using a mismatch in active power and voltage of grid. The method reported in [27] is utilized to compute the difference in RE power generation and loads using the below detailed relation.
Δ P = 3 V × I 3 ( V + Δ V ) × I = 3 Δ V × I
here, V: test system rated voltage, which is considered equal to 4.16 kV; I: rated current. As per Indian electricity grid codes, the permissible limits of voltage variations in the distribution grid are 0.88 and 1.1 pu, which are used to estimate NDZ. Loads and generation from the wind and solar generators are changed to simulate scenarios of power mismatch. Effectiveness of IDM for islanding detection considering different scenarios of active power mismatch and voltage is included in Table 3. The identification of an islanding event is represented by 1, and 0 indicates that islanding is not identified. From Table 3, it is pointed out that an islanding event is not identified for power limits of ΔP = −8 kW to ΔP = 8 kW at voltage equal to 1.0 pu and voltage limits of V = 0.92 pu to V = 1.1 pu at power change in ΔP = 0 kW.

6. Classification of Events

The classification of islanding events, fault events and operational events in different categories is achieved using the simple decision rules supported by the peak magnitude of the voltage-based IRF. The peak magnitude of the voltage-based IRF (MIRFV) for all the investigated events is tabulated in Table 4. Classification of the events to discriminate the islanding events from the operational and faulty events is described in Figure 18. It is observed that different events are classified one by one. If MIRFV > TMV2, then the event is faulty in nature. Further, if MIRFV < TMV1, then the event is an operational event. For the islanding events, TMV1 < MIRFV < TMV2 condition is followed.

7. Performance Comparison of Algorithm

The proposed voltage-based IDM is efficient in recognizing the islanding event at a time period of less than 0.05 cycles compared to the voltage change rate (ROCOV) and frequency change rate (ROCOF) IDM that detects the islanding event at a time period of 0.25 to 0.5 cycles [28]. Compared to the wavelet transform-based method [29], the method implemented in this paper is also fast and precise. Performance of the DWT-based method reported in [29] is affected by the noise with a noise level higher than 40 dB signal-to-noise ratio (SNR), whereas the performance of the proposed method is not affected, even in the presence of high noise level of 10 dB SNR. Further, hybridization of the ROCOV with the features computed using ST in the present method reduces the non-detection zone compared to the ROCOV- and ROCOF-based methods reported in the literature. A comparative study to indicate the different investigation reported in [28,29] and proposed IDM is included in Table 5. Here, SI indicates that the scenario is investigated, and SNI indicates that the scenario is not investigated.

8. Conclusions

An algorithm for the identification of islanding events in the remotely located distribution grid with renewable energy sources using the voltage signals is introduced in this work. Voltage signal is processed using Stockwell transform to compute MIRF. The rate of change in RMS voltage is computed by differentiating the RMS voltage with respect to time to compute VRCIRF. The proposed voltage-based islanding recognition factor (IRFV) is computed by multiplying the MIRF and VRCIRF element to element. Threshold magnitudes TMV1 and TMV2 are set equal to 50 and 300, respectively, for the IRFV. The islanding event is discriminated from the faulty and operational events using the simple decision rules using the peak magnitude of IRFV. If the peak magnitude of IRFV is less than TMV1, then the event is an operational event. For peak magnitudes of IRFV between the TMV1 and TMV2, the event is islanding. However, if the IRFV’s peak magnitude is higher than the TMV2, then the event is defective in nature. It is concluded that IDM dependent on voltage is successful in identifying the islanding events and discriminating against the defective and operational events as well. Further, the proposed IDM identifies the islanding events with small NDZ. In addition, compared to the IDMs stated in the literature and based on voltage change rate and frequency change rate, the proposed algorithm is found to have better performance. The identification of islanding events in the presence of power electronics devices will be considered as future work.

Author Contributions

Conceptualization, O.P.M., Y.S. and S.A.; validation, O.P.M.; supervision, A.R.G. and B.K. All authors have read and agreed to the published version of the manuscript.

Funding

This research received no external funding.

Institutional Review Board Statement

Not applicable.

Informed Consent Statement

Not applicable.

Data Availability Statement

Data presented must be original and not inappropriately selected, manipulated, enhanced, or fabricated. Relevant data to reproduce results are included in manuscript and provided relevant citation.

Conflicts of Interest

The authors declare no conflict of interest.

References

  1. Xie, X.; Huang, C.; Li, D. A new passive islanding detection approach considering the dynamic behaviour of load in micro-grid. Electr. Power Energy Syst. 2020, 117, 105619. [Google Scholar] [CrossRef]
  2. Paiva, S.C.; de Araujo Ribeiro, R.L.; Alves, D.K.; Costa, F.B.; Rocha, T.D. A wavelet-based hybrid islanding detection system applied for distributed generators interconnected to AC microgrids. Electr. Power Energy Syst. 2020, 121, 106032. [Google Scholar] [CrossRef]
  3. Tsang, K.M.; Chan, W.L. Rapid islanding detection using multi-level inverter for grid-interactive PV system. Energy Convers. Manag. 2014, 77, 278–286. [Google Scholar] [CrossRef]
  4. Kolli, A.T.; Ghaffarzadeh, N. A novel phaselet-based approach for islanding detection in inverter-based distributed generation systems. Electr. Power Syst. Res. 2020, 182, 106226. [Google Scholar] [CrossRef]
  5. Ahmad, K.N.; Selvaraj, J.; Abd Rahim, N. A review of the islanding detection methods in grid-connected PV inverters. Renew. Sustain. Energy Rev. 2013, 21, 756–766. [Google Scholar] [CrossRef]
  6. Kaushik, R.; Mahela, O.P.; Bhatt, P.K.; Khan, B.; Garg, A.R.; Alhelou, H.H.; Siano, P. Recognition of Islanding and Operational Events in Power System with Renewable Energy Penetration Using a Stockwell Transform Based Method. IEEE Syst. J. 2020, 1–10. [Google Scholar] [CrossRef]
  7. Mahela, O.P.; Heydarian-Forushani, E.; Alhelou, H.H.; Khan, B.; Garg, A.R.; Al-Sumaiti, A.S. Combined Stockwell and Hilbert Transforms Based Technique for the Detection of Islanding Events in Hybrid Power System. In Proceedings of the 46th Annual Conference of the IEEE Industrial Electronics Society (IES), IECON 2020, Singapore, 18–21 October 2020. [Google Scholar] [CrossRef]
  8. Mahela, O.P.; Gupta, R.; Khan, B.; Sanjeevikumar, P.; Leonowicz, Z.; Choudhary, S.; Alhelou, H.H. A Voltage Based Algorithm Using Combined Features of Stockwell Transform and Hilbert Transform for Detection of Islanding Events. In Proceedings of the 2020 IEEE International Conference on Environment and Electrical Engineering, Madrid, Spain, 9–12 June 2020. [Google Scholar]
  9. Ahmadipour, M.; Hizam, H.; Othman, M.L.; Radzi, M.A.; Chireh, N. A novel islanding detection technique using modified Slantlet transform in multi-distributed generation. Int. J. Electr. Power Energy Syst. 2019, 112, 460–475. [Google Scholar] [CrossRef]
  10. Ahmadipour, M.; Hizam, H.; Othman, M.L.; Radzi, M.A.; Murthy, A.S. Islanding detection technique using Slantlet Transform and Ridgelet Probabilistic Neural Network in grid-connected photovoltaic system. Appl. Energy 2018, 231, 645–659. [Google Scholar] [CrossRef]
  11. Admasie, S.; Bukhari, S.B.; Haider, R.; Gush, T.; Kim, C.H. A passive islanding detection scheme using variational mode decomposition based mode singular entropy for integrated microgrids. Electr. Power Syst. Res. 2019, 177, 105983. [Google Scholar] [CrossRef]
  12. Omar, A.I.; Aleem, S.H.; El-Zahab, E.E.; Algablawy, M.; Ali, Z.M. An improved approach for robust control of dynamic voltage restorer and power quality enhancement using grasshopper optimization algorithm. ISA Trans. 2019, 95, 110–129. [Google Scholar] [CrossRef]
  13. Gandoman, F.H.; Sharaf, A.M.; Abdel Aleem, S.H.; Jurado, F. Distributed FACTS stabilization scheme for efficient utilization of distributed wind energy systems. Int. Trans. Electr. Energy Syst. 2017, 27, e2391. [Google Scholar] [CrossRef]
  14. Kulshrestha, A.; Mahela, O.P.; Gupta, M.K.; Gupta, N.; Patel, N.; Senjyu, T.; Danish, M.S.; Khosravy, M. A Hybrid Protection Scheme Using Stockwell Transform and Wigner Distribution Function for Power System Network with Solar Energy Penetration. Energies 2020, 13, 3519. [Google Scholar] [CrossRef]
  15. Shaik, A.G.; Mahela, O.P. Power quality assessment and event detection in hybrid power system. Electr. Power Syst. Res. 2018, 161, 26–44. [Google Scholar] [CrossRef]
  16. Mahela, O.P.; Shaik, A.G. Power Quality Improvement in Distribution Network using DSTATCOM with Battery Energy Storage System. Int. J. Electr. Power Energy Syst. 2016, 83, 229–240. [Google Scholar] [CrossRef]
  17. Mahela, O.P.; Shaik, A.G. Power Quality Recognition in Distribution System with Solar Energy Penetration Using S-Transform and Fuzzy C-Means Clustering. Renew. Energy 2017, 106, 37–51. [Google Scholar] [CrossRef]
  18. Mahela, O.P.; Shaik, A.G. Comprehensive Overview of Grid Interfaced Solar Photovoltaic Systems. Renew. Sustain. Energy Rev. 2017, 68, 316–332. [Google Scholar] [CrossRef]
  19. Mahela, O.P.; Shaik, A.G. Detection of power quality disturbances associated with grid integration of 100 kW solar PV plant. In Proceedings of the 1st IEEE Uttar Pradesh Conference-International Conference on Energy Economics and Environment (ICEEE 2015), Galgotia Institute of Engineering and Technology, Noida, India, 27–28 March 2015. [Google Scholar] [CrossRef]
  20. Mahela, O.P.; Shaik, A.G. Comprehensive Overview of Grid Interfaced Wind Energy Generation Systems. Renew. Sustain. Energy Rev. 2016, 57, 260–281. [Google Scholar] [CrossRef]
  21. Mahela, O.P.; Shaik, A.G. Power quality detection in distribution system with wind energy penetration using discrete wavelet transform. In Proceedings of the 2nd IEEE International Conference on Advances in Computing and Communication Engineering (ICACCE-2015), Dehradun, India, 1–2 May 2015. [Google Scholar] [CrossRef]
  22. Mahela, O.P.; Khan, B.; Alhelou, H.H.; Siano, P. Power Quality Assessment and Event Detection in Distribution Network with Wind Energy Penetration Using Stockwell Transform and Fuzzy Clustering. IEEE Trans. Ind. Inform. 2020, 16, 6922–6932. [Google Scholar] [CrossRef]
  23. Mahela, O.P.; Shaik, A.G.; Khan, B.; Mahla, R.; Alhelou, H.H. Recognition of Complex Power Quality Disturbances Using S-Transform Based Ruled Decision Tree. IEEE Access 2020, 8, 173530–173547. [Google Scholar] [CrossRef]
  24. Mahela, O.P.; Shaik, A.G. Recognition of Power Quality Disturbances Using S-Transform Based Ruled Decision Tree and Fuzzy C-Means Clustering Classifiers. Appl. Soft Comput. 2017, 59, 243–257. [Google Scholar] [CrossRef]
  25. Mahela, O.P.; Shaik, A.G.; Gupta, N.; Khosravy, M.; Khan, B.; Alhelou, H.H.; Padmanaban, S. Recognition of the Power Quality Issues Associated with Grid Integrated solar Photovoltaic Plant in Experimental Frame Work. IEEE Syst. J. Early Access 2020, 1–9. [Google Scholar] [CrossRef]
  26. Mahela, O.P.; Khan, B.; Alhelou, H.H.; Tanwar, S. Assessment of Power Quality in the Utility Grid Integrated with Wind Energy Generation. IET Power Electron. 2020, 13, 2917–2925. [Google Scholar] [CrossRef]
  27. Samet, H.; Hashemi, F.; Ghanbari, T. Minimum non detection zone for islanding detection using an optimal artificial neural network algorithm based on PSO. Renew. Sustain. Energy Rev. 2015, 52, 1–18. [Google Scholar] [CrossRef]
  28. Quoc-Tuan, T. New Methods of Islanding Detection for Photovoltaic Inverters. In Proceedings of the 2016 IEEE PES Innovative Smart Grid Technologies Conference Europe (ISGT-Europe), Ljubljana, Slovenia, 9–12 October 2016. [Google Scholar]
  29. Sharma, R.; Singh, P. Islanding Detection and Control in Grid Based System Using Wavelet Transform. In Proceedings of the 2012 IEEE Fifth Power India Conference, Murthal, India, 19–22 December 2012. [Google Scholar]
Figure 1. Remotely located distribution grid.
Informatics 08 00021 g001
Figure 2. Proposed voltage-based algorithm for identification of islanding events.
Informatics 08 00021 g002
Figure 3. Healthy condition (a) voltage signal (b) root means square value of voltage (c) median-based islanding recognition factor (IRF) (d) rate of change in voltage-based IRF (e) islanding recognition factor based on voltage.
Informatics 08 00021 g003
Figure 4. Islanding event in the presence of both wind and solar power generation (a) voltage signal (b) root means square value of voltage (c) median-based IRF (d) rate of change in voltage-based IRF (e) islanding recognition factor based on voltage.
Informatics 08 00021 g004
Figure 5. Islanding event in the presence of wind power generation (a) voltage signal (b) root means square value of voltage (c) median-based IRF (d) rate of change in voltage-based IRF (e) islanding recognition factor based on voltage.
Informatics 08 00021 g005
Figure 6. Islanding event in the presence of solar power generation (a) voltage signal (b) root means square value of voltage (c) median-based IRF (d) rate of change in voltage-based IRF (e) islanding recognition factor based on voltage.
Informatics 08 00021 g006
Figure 7. Single-phase-to-ground fault (a) voltage signal (b) root means square value of voltage (c) median-based IRF (d) rate of change in voltage-based IRF (e) islanding recognition factor based on voltage.
Informatics 08 00021 g007
Figure 8. Two-phase fault (a) voltage signal (b) root means square value of voltage (c) median-based IRF (d) rate of change in voltage-based IRF (e) islanding recognition factor based on voltage.
Informatics 08 00021 g008
Figure 9. Two-phase-to-ground fault (a) voltage signal (b) root means square value of voltage (c) median-based IRF (d) rate of change in voltage-based IRF (e) islanding recognition factor based on voltage.
Informatics 08 00021 g009
Figure 10. Three-phase fault with ground (a) voltage signal (b) root means square value of voltage (c) median-based IRF (d) rate of change in voltage-based IRF (e) islanding recognition factor based on voltage.
Informatics 08 00021 g010
Figure 11. Outage of wind power plant from test grid (a) voltage signal (b) root means square value of voltage (c) median-based IRF (d) rate of change in voltage-based IRF (e) islanding recognition factor based on voltage.
Informatics 08 00021 g011
Figure 12. Outage of solar power plant from test grid (a) voltage signal (b) root means square value of voltage (c) median-based IRF (d) rate of change in voltage-based IRF (e) islanding recognition factor based on voltage.
Informatics 08 00021 g012
Figure 13. Synchronization of solar power plant (SPP) to grid (a) voltage signal (b) root means square value of voltage (c) median-based IRF (d) rate of change in voltage-based IRF (e) islanding recognition factor based on voltage.
Informatics 08 00021 g013
Figure 14. Synchronization of wind power plant (WPP) to grid (a) voltage signal (b) root means square value of voltage (c) median-based IRF (d) rate of change in voltage-based IRF (e) islanding recognition factor based on voltage.
Informatics 08 00021 g014
Figure 15. Feeder operation (a) voltage signal (b) root means square value of voltage (c) median-based IRF (d) rate of change in voltage-based IRF (e) islanding recognition factor based on voltage.
Informatics 08 00021 g015
Figure 16. Capacitor switching (a) voltage signal (b) root means square value of voltage (c) median-based IRF (d) rate of change in voltage-based IRF (e) islanding recognition factor based on voltage.
Informatics 08 00021 g016
Figure 17. Load switching (a) voltage signal (b) root means square value of voltage (c) median-based IRF (d) rate of change in voltage-based IRF (e) islanding recognition factor based on voltage.
Informatics 08 00021 g017
Figure 18. Discrimination of islanding event from the faulty and operational events using voltage-based IRF.
Informatics 08 00021 g018
Table 1. Loading status of test system.
Nodes of Test Distribution GridLoad Connected at Various Nodes of Test Distribution GridCapacitor Banks at Various Nodes of Test Distribution Grid (kVAr)
kWkVAr
634400290
645170125
646230132
65212886
6711155660
675843462600
692170151
61117080100
632–671200116
680
650
Table 2. Data of transformer of test system.
TransformerTransformer MVA RatingkV-HV Winding TransformerkV-LV Winding TransformerHV WindingLV Winding
R (Ω)X (Ω)R (Ω)X (Ω)
Grid-ICT101154.1629.095211.600.11420.8306
T-Feeder54.160.480.0113.01590.0113.0159
T-WPP54.160.5750.38072.76880.05100.0042
T-SPP54.160.2600.0011.13100.0011.1310
Table 3. Peak magnitude of voltage-based IRF.
ΔP (kW)Voltage (pu)
0.880.900.920.940.960.981.01.1
−1011111111
−811111101
−611111001
−411110000
−211100000
011000000
211100000
411110000
611111001
811111101
1011111111
1211111111
Table 4. Peak magnitude of voltage-based IRF.
S. No.Type of EventPeak Magnitude of IRFV
1Healthy condition without any disturbance.0.03
2Islanding event in the presence of both wind and solar power generation.105.04
3Islanding event in the presence of wind power generation.141.63
4Islanding event in the presence of solar power generation.242.60
5Single-phase-to-ground fault.598.12
6Two-phase fault.587.70
7Two-phase-to-ground fault.561.05
8Three-phase fault with ground.399.40
9Outage of wind power plant.2.09
10Outage of solar power plant.3.14
11Synchronization of SPP.32.81
12Synchronization of WPP.26.49
13Feeder operation.23.15
14Capacitor switching.33.25
15Load switching.0.351
Table 5. Performance comparative study of islanding detection methods (IDMs).
S. No.AttributeReference [24]Reference [25]Proposed IDM
1Islanding detection time.SISISI
2Non-detection zone.SISNISI
3Effect of noise.SNISNISI
4Differentiation of islanding events from faulty conditions.SNISNISI
5Differentiation of islanding events from switching events.SNISNISI
Publisher’s Note: MDPI stays neutral with regard to jurisdictional claims in published maps and institutional affiliations.

