
Factors Affecting the Use of Smart Mobile Examination Platforms by Universities’ Postgraduate Students during the COVID-19 Pandemic: An Empirical Study

 ,
,  , ,
, ,  ,
,  and
and 
Abstract
:1. Introduction
1.1. Actual Use of Mobile Examination Platforms
1.2. The Importance of Mobile Examination Platforms
2. Background
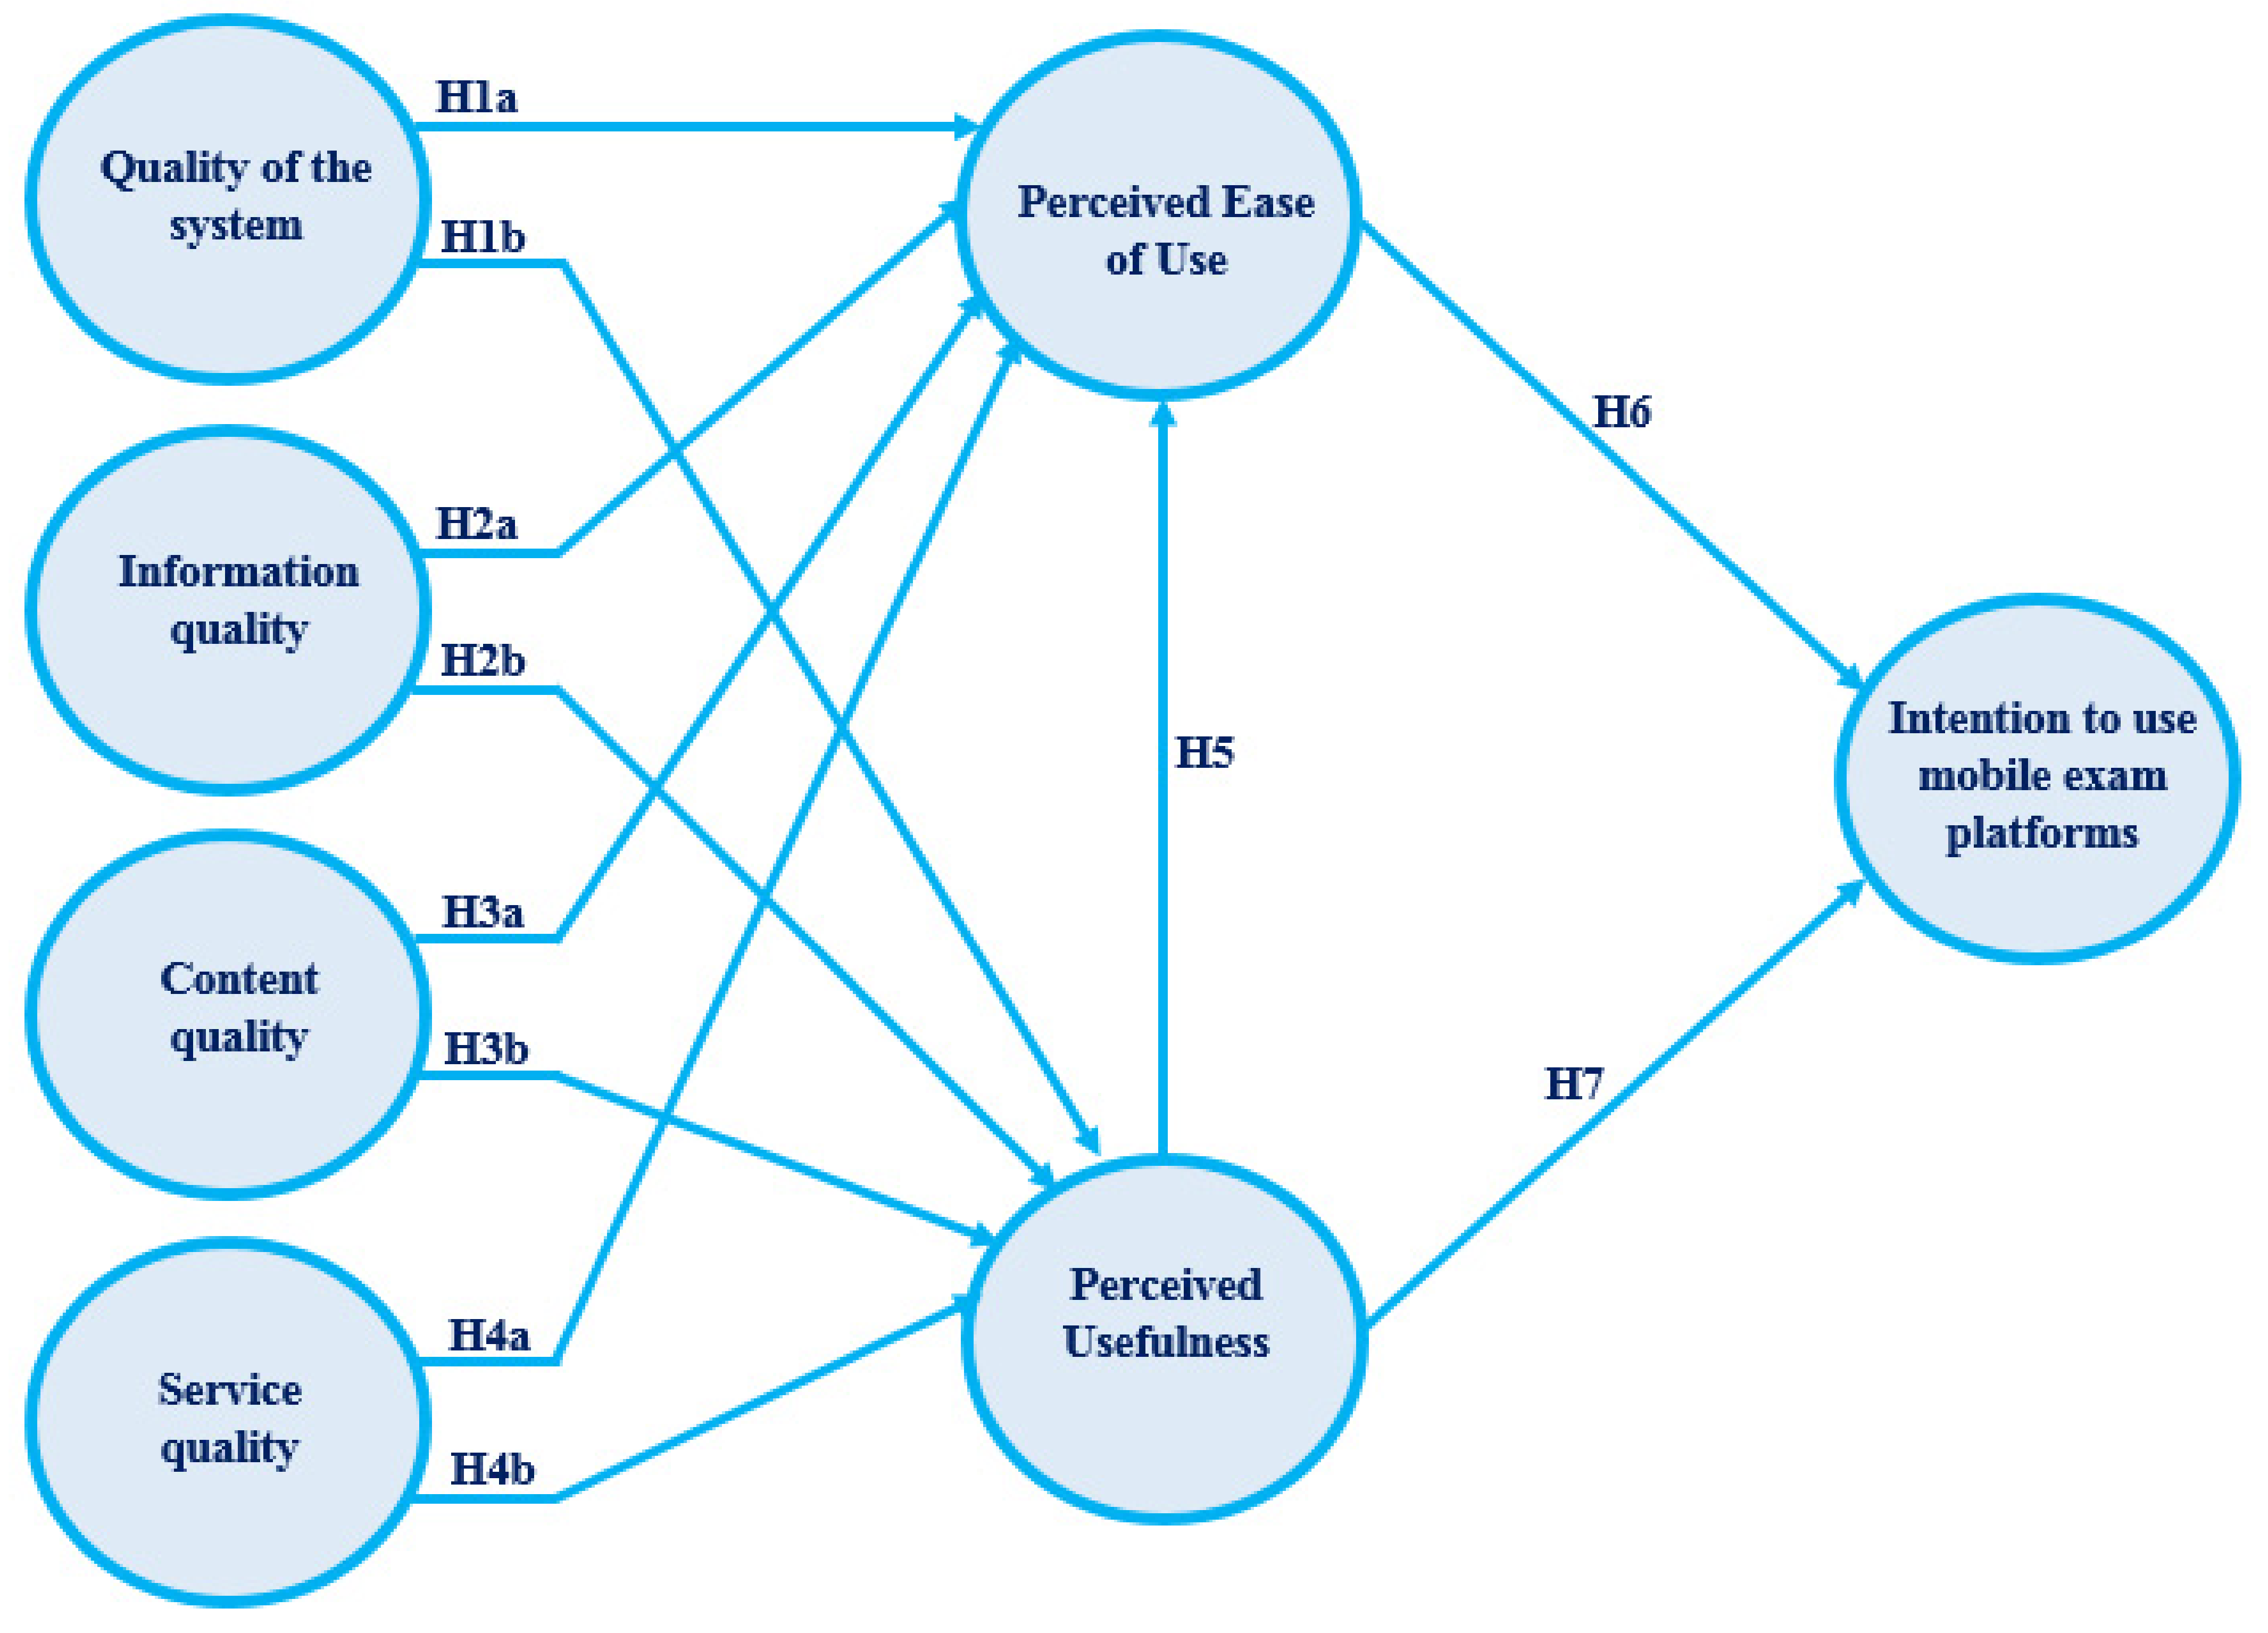
2.1. System Characteristics
2.1.1. Quality of System
2.1.2. Information Quality
2.1.3. Content Quality
2.1.4. Service Quality
2.2. The Technology Acceptance Model and User Beliefs
2.2.1. Perceived Ease of Use (PEOU)
2.2.2. Perceived Usefulness (PU)
3. Materials and Methods
3.1. Data Collection
3.2. Study Instrument
3.3. Survey Structure
- 1.
- The first section concerned the personal data of the participants.
- 2.
- The second section focused on the five items illustrating the general question regarding mobile-learning systems.
- 3.
- The third section contained the 15 items that show Intention to use mobile examination platforms, Content quality, Information quality, Perceived Ease of Use, Perceived Usefulness, Quality of the system, and Service quality.
3.4. A Pilot Study of the Study Constructs
3.5. The Study Sample
3.6. The Study Sample’s Demographic Data
4. Results and Discussion
4.1. Data Analysis
4.1.1. Convergent Validity
4.1.2. Discriminant Validity
4.2. Model Fit
4.3. Hypotheses Testing—Path Coefficient
5. Conclusions
5.1. Theoretical and Practical Implications of the Study and Recommendations
5.2. Research Limitations
Author Contributions
Funding
Institutional Review Board Statement
Informed Consent Statement
Data Availability Statement
Acknowledgments
Conflicts of Interest
References
- Kemp, S. Every Single Stat You Need to Know about the Internet; Digital Trends: Portland, OR, USA, 2019. [Google Scholar]
- Ng’Ambi, D.; Knaggs, A. Using Mobile Phones for Exam Preparation. In Proceedings of the IADIS International Mobile Learning Conference, Algarve, Portgual, 11–13 April 2008; pp. 35–42. [Google Scholar]
- Nisbet, D.; Austin, D. Enhancing ESL Vocabulary Development through the Use of Mobile Technology. J. Adult Educ. 2013, 42, 1–7. [Google Scholar]
- Alshurideh, M.; Salloum, A.; Kurdi, B.; Azza, M. Understanding the Quality Determinants that Influence the Intention to Use the Mobile Learning Platforms: A Practical Study. Int. J. Interact. Mob. Technol. 2019, 13, 157–183. [Google Scholar] [CrossRef]
- Kuznekoff, J.H.; Titsworth, S. The Impact of Mobile Phone Usage on Student Learning. Commun. Educ. 2013, 62, 233–252. [Google Scholar] [CrossRef]
- Salloum, S.A.; Maqableh, W.; Mhamdi, C.; Al Kurdi, B.; Shaalan, K. Studying the Social Media Adoption by University Students in the United Arab Emirates. Int. J. Inf. Technol. Lang. Stud. 2018, 2, 83–95. [Google Scholar]
- Glahn, C.; Gruber, M.R.; Tartakovski, O. Beyond Delivery Modes and Apps: A Case Study on Mobile Blended Learning in Higher Education. In Design for Teaching and Learning in a Networked World; Springer: Berlin/Heidelberg, Germany, 2015; pp. 127–140. [Google Scholar]
- Rambe, P.; Bere, A. Using Mobile Instant Messaging to Leverage Learner Participation and Transform Pedagogy at a South African University of Technology. Br. J. Educ. Technol. 2013, 44, 544–561. [Google Scholar] [CrossRef]
- Habel, C.; Stubbs, M. Mobile Phone Voting for Participation and Engagement in a Large Compulsory Law Course. Res. Learn. Technol. 2014, 22. [Google Scholar] [CrossRef] [Green Version]
- Sayedalamin, Z.; Alshuaibi, A.; Almutairi, O.; Baghaffar, M.; Jameel, T.; Baig, M. Utilization of Smart Phones Related Medical ap-Plications among Medical Students at King Abdulaziz University, Jeddah: A Cross-Sectional Study. J. Infect. Public Health 2016, 9, 691–697. [Google Scholar] [CrossRef] [Green Version]
- Alhashmi, S.F.S.; Alshurideh, M.; Al Kurdi, B.; Salloum, S.A.; Alhashmi, S.F.S.; Alshurideh, M.; Al Kurdi, B.; Salloum, S.A. A Systematic Review of the Factors Affecting the Artificial Intelli-Gence Implementation in the Health Care Sector. In Joint European-US Workshop on Applications of Invariance in Computer Vision; Springer: Cham, Switzerland, 2020; pp. 37–49. [Google Scholar]
- Simonova, I. Mobile Devices in Technical and Engineering Education with Focus on ESP. Int. J. Interact. Mob. Technol. 2016, 10, 33. [Google Scholar] [CrossRef] [Green Version]
- Looi, C.-K.; Zhang, B.; Chen, W.; Seow, P.; Chia, G.; Norris, C.; Soloway, E. 1:1 Mobile Inquiry Learning Experience for Primary Science Students: A Study of Learning Effectiveness. J. Comput. Assist. Learn. 2010, 27, 269–287. [Google Scholar] [CrossRef]
- Karadeniz, S. Effects of Gender and Test Anxiety on Student Achievement in Mobile Based Assessment. Procedia-Soc. Behav. Sci. 2011, 15, 3173–3178. [Google Scholar] [CrossRef] [Green Version]
- Alzaza, N.S.; Yaakub, A.R. Students’ Awareness and Requirements of Mobile Learning Services in the Higher Education Envi-ronment. Am. J. Econ. Bus. Adm. 2011, 3, 95–100. [Google Scholar]
- Al Kurdi, B.; Alshurideh, M.; Salloum, S.A.; Obeidat, Z.M.; Al-Dweeri, R.M. An Empirical Investigation into Examination of Fac-tors Influencing University Students. Behavior towards Elearning Acceptance Using SEM Approach. Int. J. Interact. Mob. Technol. 2020, 14, 19–41. [Google Scholar] [CrossRef] [Green Version]
- Bursalioglu, O.; Murat, L.U.Y.; Volkan, A.; Erguzen, A. Mobile Device Supported Online Examination System Appropriate to Distance Learning. Int. E-J. Adv. Educ. 2016, 2, 95–104. [Google Scholar] [CrossRef] [Green Version]
- Salloum, S.A.; Shaalan, K. Adoption of E-Book for University Students. In Proceedings of the Advances in Human Factors, Business Management, Training and Education, Washington DC, USA, 24–28 July 2019; Metzler, J.B., Ed.; Springer: Cham, Switzerland, 2019; pp. 481–494. [Google Scholar]
- Al-Hakeem, M.S.; Abdulrahman, M.S. Developing a New e-Exam Platform to Enhance the University Academic Examinations: The Case of Lebanese French University. Int. J. Mod. Educ. Comput. Sci. 2017, 9, 9–16. [Google Scholar] [CrossRef] [Green Version]
- Wilkinson, K.; Barter, P. Do Mobile Learning Devices Enhance Learning in Higher Education Anatomy Classrooms? J. Pedagog. Dev. 2016, 6, 14–23. [Google Scholar]
- Dobbins, C.; Denton, P. MyWallMate: An Investigation into the use of Mobile Technology in Enhancing Student Engagement. TechTrends 2017, 61, 541–549. [Google Scholar] [CrossRef] [Green Version]
- Sung, Y.-T.; Chang, K.-E.; Liu, T.-C. The Effects of Integrating Mobile Devices with Teaching and Learning on Students’ Learning Performance: A Meta-Analysis and Research Synthesis. Comput. Educ. 2016, 94, 252–275. [Google Scholar] [CrossRef] [Green Version]
- Lim, W.N. Improving Student Engagement in Higher Education through Mobile-Based Interactive Teaching Model Using Socra-Tive. In Proceedings of the 2017 IEEE Global Engineering Education Conference (EDUCON), Athens, Greece, 25–28 April 2017; pp. 404–412. [Google Scholar]
- Nikou, S.A.; Economides, A.A. Acceptance of Mobile-Based Assessment from the Perspective of Self-Determination Theory of Motivation. In Proceedings of the 2014 IEEE 14th International Conference on Advanced Learning Technologies; Institute of Electrical and Electronics Engineers (IEEE), Athens, Greece, 7–10 July 2014; pp. 454–458. [Google Scholar]
- Lalitha, V.; Periasamy, J.K. Mobile Based Secured Student Online Exam System. Int. J. Eng. Technol. 2018, 7, 118–120. [Google Scholar] [CrossRef] [Green Version]
- Murphy, H.E. Digitalizing Paper-Based Exams: An Assessment of Programming Grading Assistant. In Proceedings of the 2017 ACM SIGCSE Technical Symposium on Computer Science Education, Seattle, WA, USA, 8–11 March 2017; pp. 775–776. [Google Scholar]
- Kaiiali, M.; Ozkaya, A.; Altun, H.; Haddad, H.; Alier, M. Designing a Secure Exam Management System (SEMS) for M-Learning Environments. IEEE Trans. Learn. Technol. 2016, 9, 258–271. [Google Scholar] [CrossRef] [Green Version]
- Shyshkanova, G.; Zaytseva, T.; Frydman, O. Mobile technologies make education a part of everyday life. Inf. Learn. Sci. 2017, 118, 570–582. [Google Scholar] [CrossRef]
- Katz, J.E. Mobile Phones in Educational Settings. In Magic in the Air; Routledge India: New Delhi, India, 2017; pp. 87–101. [Google Scholar]
- Han, I.; Shin, W.S. The Use of a Mobile Learning Management System and Academic Achievement of Online Students. Comput. Educ. 2016, 102, 79–89. [Google Scholar] [CrossRef]
- De Witt, C.; Gloerfeld, C. Mobile Learning and Higher Education. In The Digital Turn in Higher Education; Springer: Berlin/Heidelberg, Germany, 2018; pp. 61–79. [Google Scholar]
- Kadam, A.J.; Singh, A.; Jagtap, K.; Tankala, S. Mobile Web Based Android Application for College Management System. Int. J. Eng. Comput. Sci. 2017, 6, 20206–20209. [Google Scholar]
- Joo, Y.J.; Kim, N.; Kim, N.H. Factors Predicting Online University Students’ Use of a Mobile Learning Management System (m-LMS). Educ. Technol. Res. Dev. 2016, 64, 611–630. [Google Scholar] [CrossRef]
- Zahay, D.; Kumar, A.; Trimble, C. Motivation and Active Learning to Improve Student Performance: An Extended Abstract. In Developments in Marketing Science: Proceedings of the Academy of Marketing Science; Metzler, J.B., Ed.; Springer: Cham, Switzerland, 2017; pp. 1259–1263. [Google Scholar]
- Chang, R.-C.; Yang, C.-Y. Developing a Mobile App for Game-Based Learning in Middle School Mathematics Course. In Proceedings of the 2016 International Conference on Applied System Innovation (ICASI), Institute of Electrical and Electronics Engineers (IEEE), Okinawa, Japan, 26–30 May 2016; pp. 1–2. [Google Scholar]
- Basoglu, E.B.; Akdemir, O. A Comparison of Undergraduate Students’ English Vocabulary Learning: Using Mobile Phones and Flash Cards. Turk. Online J. Educ. Technol. 2010, 9, 1–7. [Google Scholar]
- Fayyoumi, A.; Mohammad, H.; Faris, H. Mobile Based Learning and Examination: Students and Instructors Perceptions from Different Arab Countries. J. Softw. Eng. Appl. 2013, 6, 662–669. [Google Scholar] [CrossRef] [Green Version]
- García Laborda, J.; Magal Royo, T.; Litzler, M.F.; Gimenez Lopez, J.L. Mobile Phones for Spain’s University Entrance Examina-tion Language Test. J. Educ. Technol. Soc. 2014, 17, 17–30. [Google Scholar]
- Alshurideh, M.; Al Kurdi, B.; Salloum, S. Examining the Main Mobile Learning System Drivers’ Effects: A Mix Empirical Examina-tion of Both the Expectation-Confirmation Model (ECM) and the Technology Acceptance Model (TAM). In Proceedings of the International Conference on Advanced Intelligent Systems and Informatics, Cairo, Egypt, 26–28 October 2019; pp. 406–417. [Google Scholar]
- Aghazamani, A. How do University Students Spend their Time on Facebook? An Exploratory Study. J. Am. Sci. 2010, 6, 730–735. [Google Scholar]
- Zolkepli, I.A.; Kamarulzaman, Y. Social Media Adoption: The Role of Media Needs and Innovation Characteristics. Comput. Hum. Behav. 2015, 43, 189–209. [Google Scholar] [CrossRef]
- Akar, E.; Mardikyan, S. Analyzing Factors Affecting Users’ Behavior Intention to Use Social Media: Twitter Case. Int. J. Bus. Soc. Sci. 2014, 5, 85–95. [Google Scholar]
- Sife, A.; Lwoga, E.; Sanga, C. New Technologies for Teaching and Learning: Challenges for Higher Learning Institutions in Devel-Oping Countries. Int. J. Educ. Dev. Using ICT 2007, 3, 57–67. [Google Scholar]
- Wiid, J.; Cant, M.C.; Nell, C. Open Distance Learning Students Perception of the Use of Social Media Networking Systems as an Educational Tool. Int. Bus. Econ. Res. J. (IBER) 2013, 12, 867. [Google Scholar] [CrossRef]
- Salloum, S.A.S.; Shaalan, K. Investigating Students’ Acceptance of E-Learning System in Higher Educational Environments in the UAE: Applying the Extended Technology Acceptance Model (TAM); The British University in Dubai: Dubai, United Arab Emirates, 2018. [Google Scholar]
- Evans, J.R.; Lindsay, W.M. The Management and Control of Quality 4th Edition South; Westernllege College Publishing: Cincinnati, OH, USA, 1999. [Google Scholar]
- Salloum, S.A.; Alhamad, A.Q.M.; Al-Emran, M.; Monem, A.A.; Shaalan, K. Exploring Students’ Acceptance of E-Learning Through the Development of a Comprehensive Technology Acceptance Model. IEEE Access 2019, 7, 128445–128462. [Google Scholar] [CrossRef]
- Al-Emran, M.; Mezhuyev, V.; Kamaludin, A.; AlSinani, M. Development of M-learning Application Based on Knowledge Man-Agement Processes. In Proceedings of the 2018 7th International conference on Software and Computer Applications (ICSCA 2018), Kuantan, Malaysia, 8–10 February 2018. [Google Scholar]
- Abuhashesh, M.; Al-Khasawneh, M.; Al-Dmour, R.; Masa’Deh, R. The Impact of Facebook on Jordanian Consumers’ Decision Process in the Hotel Selection. IBIMA Bus. Rev. 2019, 1–16. [Google Scholar] [CrossRef]
- Wang, Y.-S.; Wang, H.-Y.; Shee, D.Y. Measuring e-Learning Systems Success in an Organizational Context: Scale Development and Validation. Comput. Hum. Behav. 2007, 23, 1792–1808. [Google Scholar] [CrossRef]
- Al-Qaysi, N.; Al-Emran, M. Code-Switching Usage in Social Media: A Case Study from Oman. Int. J. Inf. Technol. Lang. Stud. 2017, 1, 25–38. [Google Scholar]
- Al Mazroa, M.; Gulliver, S. Understanding the Usage of Mobile Payment Systems—The Impact of Personality on the Continuance Usage. In Proceedings of the 2018 4th International Conference on Information Management (ICIM); Institute of Electrical and Electronics Engineers (IEEE), England, UK, 25–27 May 2018; pp. 188–194. [Google Scholar]
- Bates, A.W.; Bates, T. Technology, E-Learning and Distance Education; Psychology Press: Hove, UK, 2005. [Google Scholar]
- Chang, C.-C.; Hung, S.-W.; Cheng, M.-J.; Wu, C.-Y. Exploring the Intention to Continue Using Social Networking Sites: The Case of Facebook. Technol. Forecast. Soc. Chang. 2015, 95, 48–56. [Google Scholar] [CrossRef]
- Bhattacherjee, A. Understanding Information Systems Continuance: An Expectation-Confirmation Model. MIS Q. 2001, 25, 351–370. [Google Scholar] [CrossRef]
- Chen, C.-F. Investigating Structural Relationships between Service Quality, Perceived Value, Satisfaction, and Behavioral Inten-Tions for Air Passengers: Evidence from Taiwan. Transp. Res. Part A Policy Pract. 2008, 42, 709–717. [Google Scholar] [CrossRef]
- Chou, H.-K.; Lin, I.-C.; Woung, L.-C.; Tsai, M.-T. Engagement in E-Learning Opportunities: An Empirical Study on Patient Educa-Tion Using Expectation Confirmation Theory. J. Med. Syst. 2012, 36, 1697–1706. [Google Scholar] [CrossRef] [PubMed]
- Dumpit, D.Z.; Fernandez, C.J. Analysis of the Use of Social Media in Higher Education Institutions (HEIs) Using the Technology Acceptance Model. Int. J. Educ. Technol. High. Educ. 2017, 14, 5. [Google Scholar] [CrossRef]
- Pituch, K.A.; Lee, Y.-K. The Influence of System Characteristics on E-Learning Use. Comput. Educ. 2006, 47, 222–244. [Google Scholar] [CrossRef]
- Freeze, R.D.; Alshare, K.A.; Lane, P.L.; Wen, H.J. IS Success Model in E-Learning Context Based on Students’ Perceptions. J. Inf. Syst. Educ. 2010, 21, 173–2010. [Google Scholar]
- Gachago, D.; Ivala, E. Social Media for Enhancing Student Engagement: The Use of Facebook and Blogs at a University of Tech-Nology. S. Afr. J. High. Educ. 2012, 26, 152–167. [Google Scholar]
- Habes, M.; Alghizzawi, M.; Khalaf, R.; Salloum, S.A.; Ghani, M.A. The Relationship between Social Media and Academic Per-Formance: Facebook Perspective. Int. J. Inf. Technol. Lang. Stud. 2018, 2, 12–18. [Google Scholar]
- Thong, J.Y.L.; Hong, S.-J.; Tam, K.Y. The Effects of Post-Adoption Beliefs on the Expectation-Confirmation Model for Infor-Mation Technology Continuance. Int. J. Hum. Comput. Stud. 2006, 64, 799–810. [Google Scholar] [CrossRef]
- Obeidat, B.Y.; Sweis, R.J.; Zyod, D.S.; Masa’Deh, R.; Moh’D, T.; Alshurideh, M. The Effect of Perceived Service Quality on Customer Loyalty in Internet Service Providers in Jordan. J. Manag. Res. 2012, 4, 224–242. [Google Scholar] [CrossRef] [Green Version]
- Zu’bi, Z.; Al-Lozi, M.; Dahiyat, S.; Alshurideh, M.; Al Majali, A. Examining the Effects of Quality Management Practices on Prod-Uct Variety. Eur. J. Econ. Financ. Adm. Sci. 2012, 51, 123–139. [Google Scholar]
- Hair, J.; Hollingsworth, C.L.; Randolph, A.B.; Chong, A.Y.L. An Updated and Expanded Assessment of PLS-SEM in Information Systems Research. Ind. Manag. Data Syst. 2017, 117, 442–458. [Google Scholar] [CrossRef]
- Davis, F.D. Perceived Usefulness, Perceived Ease of Use, and User Acceptance of Information Technology. MIS Q. 1989, 13, 319–340. [Google Scholar] [CrossRef] [Green Version]
- Prestridge, S. A Focus on Students’ Use of Twitter–Their Interactions with Each Other, Content and Interface. Act. Learn. High. Educ. 2014, 15, 101–115. [Google Scholar] [CrossRef] [Green Version]
- Henseler, J.; Ringle, C.M.; Sarstedt, M. A New Criterion for Assessing Discriminant Validity in Variance-Based Structural Equa-Tion Modeling. J. Acad. Mark. Sci. 2015, 43, 115–135. [Google Scholar] [CrossRef] [Green Version]
- McKinney, V.; Yoon, K.F.; Mariam, Z. The Measurement of Web-Customer Satisfaction: An Expectation and Disconfir-Mation Approach. Inf. Syst. Res. 2002, 13, 296–315. [Google Scholar] [CrossRef]
- Keller, C.; Cernerud, L. Students’ Perceptions of E-Learning in University Education. J. Educ. Media 2002, 27, 55–67. [Google Scholar] [CrossRef]
- Koper, R. Use of the Semantic Web to Solve Some Basic Problems in Education: Increase Flexible, Distributed Lifelong Learning; Decrease Teacher’s Workload. J. Interact. Media Educ. 2004, 2004, 5. [Google Scholar] [CrossRef] [Green Version]
- Palmer, S. Characterisation of the use of Twitter by Australian Universities. J. High. Educ. Policy Manag. 2013, 35, 333–344. [Google Scholar] [CrossRef] [Green Version]
- Lee, M.J.W.; Chan, A. Pervasive, Lifestyle-Integrated Mobile Learning for Distance Learners: An Analysis and Unexpected Re-Sults from a Podcasting Study. Open Learn 2007, 22, 201–218. [Google Scholar] [CrossRef]
- Lieberman, Playfulness: Its Relationship to Imagination and Creativity; Academic Press: Cambridge, MA, USA, 2014.
- Tam, C.; Santos, D.; Oliveira, T. Exploring the Influential Factors of Continuance Intention to Use Mobile Apps: Extending the Expectation Confirmation Model. Inf. Syst. Front. 2020, 22, 243–257. [Google Scholar] [CrossRef]
- Lin, C.S.; Wu, S.; Tsai, R.J. Integrating Perceived Playfulness into Expectation-Confirmation Model for Web Portal Context. Inf. Manag. 2005, 42, 683–693. [Google Scholar] [CrossRef]
- Lin, J.C.-C.; Lu, H. Towards an Understanding of the Behavioural Intention to Use a Web Site. Int. J. Inf. Manag. 2000, 20, 197–208. [Google Scholar] [CrossRef]
- Nikou, S.A.; Economides, A.A. Mobile-Based Assessment: Investigating the Factors that Influence Behavioral Intention to Use. Comput. Educ. 2017, 109, 56–73. [Google Scholar] [CrossRef]
- Liu, Y.; Li, H.; Carlsson, C. Factors Driving the Adoption of m-Learning: An Empirical Study. Comput. Educ. 2010, 55, 1211–1219. [Google Scholar] [CrossRef]
- Joo, Y.J.; Lim, K.Y. Investigating the Structural Relationship Among Perceived Innovation Attributes, Intention to Use and Actual Use of Mobile Learning in an Online University in South Korea. Australas. J. Educ. Technol. 2014, 30, 427–439. [Google Scholar] [CrossRef]
- Jeffrey Mingle, D.M.A. Social Media Network Participation and Academic Performance In Senior High Schools in Ghan. Libr. Philos. Pract. 2015, 1286, 7–21. [Google Scholar]
- Padilla-Meléndez, A.; del Aguila-Obra, A.R.; Garrido-Moreno, A. Perceived Playfulness, Gender Differences and Technology Acceptance Model in a Blended Learning Scenario. Comput. Educ. 2013, 63, 306–317. [Google Scholar] [CrossRef]
- Levy, Y.; Ramim, M.M.; Furnell, S.M.; Clarke, N.L. Comparing Intentions to Use University-Provided vs Vendor-Provided Multibiometric Authentication in Online Exams. Campus-Wide Inf. Syst. 2011, 28, 102–113. [Google Scholar] [CrossRef]
- Krejcie, R.V.; Morgan, D.W. Determining Sample Size for Research Activities. Educ. Psychol. Meas. 1970, 30, 607–610. [Google Scholar] [CrossRef]
- Chuan, C.L.; Penyelidikan, J. Sample Size Estimation Using Krejcie and Morgan and Cohen Statistical Power Analysis: A Com-Parison. J. Penyelid. IPBL 2006, 7, 78–86. [Google Scholar]
- Hair, J.F., Jr.; Hult, G.T.M.; Ringle, C.M.; Sarstedt, M. A Primer on Partial Least Squares Structural Equation Modeling (PLS-SEM); Sage Publications: Thousand Oaks, CA, USA, 2016. [Google Scholar]
- Rym, B.; Olfa, B.; Mélika, B.M. Determinants of E-Learning Acceptance: An Empirical Study in the Tunisian Context. Am. J. Ind. Bus. Manag. 2013, 3, 307–321. [Google Scholar] [CrossRef] [Green Version]
- Almaiah, M.A.; Jalil, M.A.; Man, M. Extending the TAM to Examine the Effects of Quality Features on Mobile Learning Ac-Ceptance. J. Comput. Educ. 2016, 3, 453–485. [Google Scholar] [CrossRef]
- Cheng, Y.-M. Antecedents and Consequences of E-Learning Acceptance. Inf. Syst. J. 2010, 21, 269–299. [Google Scholar] [CrossRef]
- Alsabawy, A.Y.; Cater-Steel, A.; Soar, J. Determinants of Perceived Usefulness of E-Learning Systems. Comput. Hum. Behav. 2016, 64, 843–858. [Google Scholar] [CrossRef]
- Aparicio, M.; Bacao, F.; Oliveira, T. Grit in the Path to E-Learning Success. Comput. Hum. Behav. 2017, 66, 388–399. [Google Scholar] [CrossRef]
- Roca, J.C.; Chiu, C.-M.; Martínez, F.J. Understanding e-Learning Continuance Intention: An Extension of the Technology Ac-Ceptance Model. Int. J. Hum. Comput. Stud. 2006, 64, 683–696. [Google Scholar] [CrossRef] [Green Version]
- Mohammadi, H. Investigating Users’ Perspectives on E-Learning: An Integration of TAM and IS Success Model. Comput. Hum. Behav. 2015, 45, 359–374. [Google Scholar] [CrossRef]
- Chang, C.-T.; Hajiyev, J.; Su, C.-R. Examining the Students’ Behavioral Intention to Use e-Learning in Azerbaijan? The General Extended Technology Acceptance Model for E-learning Approach. Comput. Educ. 2017, 111, 128–143. [Google Scholar] [CrossRef]
- Fathema, N.; Shannon, D.; Ross, M. Expanding the Technology Acceptance Model (TAM) to Examine Faculty Use of Learning Management Systems (LMSs) In Higher Education Institutions. J. Online Learn. Teach. 2015, 11, 210–232. [Google Scholar]
- Marjanovic, U.; Delić, M.; Lalic, B. Developing a Model to Assess the Success of E-learning systems: Evidence from a manufac-turing company in transitional Economy. Inf. Syst. E-Bus. Manag. 2016, 14, 253–272. [Google Scholar] [CrossRef]
- Nunnally, J.C. Psychometric Theory, 2nd ed.; McGraw-Hill: New York, NY, USA, 1978. [Google Scholar]
- Al-Emran, M.; Salloum, S.A. Students’ Attitudes Towards the Use of Mobile Technologies in e-Evaluation. Int. J. Interact. Mob. Technol. 2017, 11, 195–202. [Google Scholar] [CrossRef]
- Ringle, C.M.; Wende, S.; Becker, J.-M. SmartPLS 3. Bönningstedt: SmartPLS. 2015. Available online: https://www.smartpls.com/ (accessed on 29 March 2021).
- Urbach, N.; Ahlemann, F. Structural Equation Modeling in Information Systems Research Using Partial Least Squares. J. Inf. Technol. Theory Appl. 2010, 11, 5–40. [Google Scholar]
- Goodhue, D.L.; Lewis, W.; Thompson, R. Does PLS Have Adavantages for Small Sample Size or Non-Normal Data? MIS Quaterly 2012, 36, 981–1001. [Google Scholar] [CrossRef] [Green Version]
- Barclay, D.; Higgins, C.; Thompson, R. The Partial Least Squares (PLS) Approach to Casual Modeling: Personal Computer Adoption Ans Use as an Illustration. Technol. Stud. 1995, 2, 285–324. [Google Scholar]
- Nunnally, J.C.; Bernstein, I.H. Psychometric Theory, 3rd ed.; McGraw-Hill: New York, NY, USA, 1994. [Google Scholar]
- Kline, R.B. Principles and Practice of Structural Equation Modeling, 4th ed.; Guilford Publications: New York, NY, USA, 2015. [Google Scholar]
- Dijkstra, T.K.; Henseler, J. Consistent and asymptotically normal PLS estimators for linear structural equations. Comput. Stat. Data Anal. 2015, 81, 10–23. [Google Scholar] [CrossRef] [Green Version]
- Hair, J.F., Jr.; Ringle, C.M.; Sarstedt, M. PLS-SEM: Indeed a Silver Bullet. J. Mark. Theory Pr. 2011, 19, 139–152. [Google Scholar] [CrossRef]
- Henseler, J.; Ringle, C.M.; Sinkovics, R.R. The Use of Partial Least Squares Path Modeling in International Marketing. In New Challenges to International Marketing; Emerald Group Publishing Limited: Bingley, UK, 2009; Volume 20, pp. 277–319. [Google Scholar]
- Fornell, C.; Larcker, D.F. Evaluating Structural Equation Models with Unobservable Variables and Measurement Error. J. Mark. Res. 1981, 18, 39. [Google Scholar] [CrossRef]
- Trial, D. Model Fit. Available online: https://www.smartpls.com/documentation/algorithms-and-techniques/model-fit (accessed on 29 March 2021).
- Hu, L.; Bentler, P.M. Fit Indices in Covariance Structure Modeling: Sensitivity to Underparameterized Model Misspecifi-Cation. Psychol. Methods 1998, 3, 424. [Google Scholar] [CrossRef]
- Bentler, P.M.; Bonett, D.G. Significance Tests and Goodness of Fit in the Analysis of Covariance Structures. Psychol. Bull. 1980, 88, 588. [Google Scholar] [CrossRef]
- Lohmöller, J.B. Latent Variable Path Modeling with Partial Least Squares; Physica-Verlag: Heidelberg, Germany, 1989. [Google Scholar]
- Henseler, J.; Theo, K.; Marko, S.; Christian, M.R.; Adamantios, D.; Detmar, W.S.; David, J.K.J.; Joseph, F.H.; Tomas, M.G.; Hult, R.J.C. Common Beliefs and Reality About PLS: Comments on Rönkkö and Evermann. Organ. Res. Methods 2013, 17, 182–209. [Google Scholar] [CrossRef] [Green Version]
- Milošević, I.; Živković, D.; Manasijević, D.; Nikolić, D. The Effects of the Intended Behavior of Students in the Use of M-learning. Comput. Hum. Behav. 2015, 51, 207–215. [Google Scholar] [CrossRef]
- Salloum, S.A.; Mhamdi, C.; Al Kurdi, B.; Shaalan, K. Factors Affecting the Adoption and Meaningful Use of Social Media: A Structural Equation Modeling Approach. Int. J. Inf. Technol. Lang. Stud. 2018, 2, 96–109. [Google Scholar]
- Alhashmi, S.F.S.; Salloum, S.A.; Abdallah, S. Critical Success Factors for Implementing Artificial Intelligence (AI) Projects in Dubai Government United Arab Emirates (UAE) Health Sector: Applying the Extended Technology Acceptance Model (TAM). In Artificial Intelligence, Computer and Software Engineering Advances; Springer Science and Business Media LLC: Berlin/Heidelberg, Germany, 2019; Volume 1058, pp. 393–405. [Google Scholar]
- Al-Maroof, S.S.A.R.S. An Integrated Model of Continuous Intention to Use of Google Classroom. In Recent Advances in Intelligent Systems and Smart Applications; Al-Emran, M., Shaa-lan, K., Hassanien, A., Eds.; Springer: Cham, Switzerland, 2021; Volume 295. [Google Scholar]
- Aburayya, A.; Alshurideh, M.; Al Marzouqi, A.; Al Diabat, O.; Alfarsi, A.; Suson, R.; Bash, M.; Salloum, S.A. An Empirical Examination of the Effect of TQM Practices on Hospital Service Quality: An Assessment Study in UAE Hospitals. Syst. Rev. Pharm. 2020, 11, 347–362. [Google Scholar]
- Saeed Al-Maroof, R.; Alhumaid, K.; Salloum, S. The Continuous Intention to Use E-Learning, from Two Different Per-Spectives. Educ. Sci. 2021, 11, 6. [Google Scholar] [CrossRef]
- Chin, W.W. The Partial Least Squares Approach to Structural Equation Modeling. Mod. Methods Bus. Res. 1998, 295, 295–336. [Google Scholar]
- Dreheeb, A.E.; Basir, N.; Fabil, N. Impact of System Quality on Users’ Satisfaction in Continuation of the Use of e-Learning System. Int. J. e-Educ. e-Bus. e-Manag. e-Learn. 2016, 6, 13. [Google Scholar] [CrossRef] [Green Version]
- Senapathi, M.; Srinivasan, A. An Empirical Investigation of the Factors Affecting Agile Usage. In Proceedings of the 18th International Conference on Hybrid Systems: Computation and Control, London, UK, 13–14 May 2014; ACM: London, UK; pp. 1–10. [Google Scholar]
- Al-Dweeri, R.M.; Obeidat, Z.M.; Al-Dwiry, M.A.; Alshurideh, M.T.; Alhorani, A.M. The Impact of E-Service Quality and E-Loyalty on Online Shopping: Moderating Effect of E-Satisfaction and E-Trust. Int. J. Mark. Stud. 2017, 9, 92. [Google Scholar] [CrossRef] [Green Version]
- Al Dmour, H.; Alshurideh, M.; Shishan, F. The Influence of Mobile Application Quality and Attributes on the Continuance Intention of Mobile Shopping. Life Sci. J. 2014, 11, 172–181. [Google Scholar]
- Akour, I.; Alshurideh, M.; Al Kurdi, B.; Al Ali, A.; Salloum, S. Using Machine Learning Algorithms to Predict People’s In-Tention to Use Mobile Learning Platforms During the COVID-19 Pandemic: Machine Learning Approach. JMIR Med. Educ. 2021, 7, 1–17. [Google Scholar] [CrossRef]
- Bacca-Acosta, J.; Avila-Garzon, C. Student Engagement with Mobile-Based Assessment Systems: A Survival Analysis. J. Comput. Assist. Learn. 2021, 37, 158–171. [Google Scholar] [CrossRef]
- Alsharari, N.M.; Alshurideh, M.T. Student Retention in Higher Education: The Role of Creativity, Emotional Intelligence and Learner Autonomy. Int. J. Educ. Manag. 2021, 35, 233–247. [Google Scholar] [CrossRef]
- Alshamsi, A.; Alshurideh, M.; Al Kurdi, B.; Salloum, S.A. The Influence of Service Quality on Customer Retention: A Systematic Review in the Higher Education. In Proceedings of the Intelligent and Fuzzy Techniques in Big Data Analytics and Decision Making; Springer Science and Business Media LLC: Berlin/Heidelberg, Germany, 2021; pp. 404–416. [Google Scholar]
- Alshurideh, M.; Al Kurdi, B.; Salloum, S.A.; Arpaci, I.; Al-Emran, M. Predicting the Actual Use of M-Learning Systems: A Comparative approach Using PLS-SEM and Machine Learning Algorithms. Interact. Learn. Environ. 2020, 1–15. [Google Scholar] [CrossRef]
- Liu, Y.; Han, S.; Li, H. Understanding the Factors Driving M-Learning Adoption: A Literature Review. Campus-Wide Inf. Syst. 2010, 27, 210–226. [Google Scholar] [CrossRef] [Green Version]
- Day, L.; Smith, E.L. Integrating Quality and Safety Content into Clinical Teaching in the Acute Care Setting. Nurs. Outlook 2007, 55, 138–143. [Google Scholar] [CrossRef] [PubMed]
- Gorla, N.; Somers, T.M.; Wong, B. Organizational Impact of System Quality, Information Quality, and Service Quality. J. Strat. Inf. Syst. 2010, 19, 207–228. [Google Scholar] [CrossRef]
- Manner, J.; Nienaber, D.; Schermann, M.; Krcmar, H. Six Principles for Governing Mobile Platforms. In Proceedings of the 11th Interna-Tional Conference on Wirtschaftsinformatik, Leipzig, Germany, 27 February–1 March 2013; pp. 1375–1389. [Google Scholar]
- Nikou, S.A.; Economides, A.A. The Impact of Paper-Based, Computer-Based and Mobile-Based Self-Assessment on Students’ Science Motivation and Achievement. Comput. Hum. Behav. 2016, 55, 1241–1248. [Google Scholar] [CrossRef]
- Nikou, S.A.; Economides, A.A. Student Achievement in Paper, Computer/Web and Mobile Based Assessment. In Proceedings of the 6th Balkan Conference in Informatics, BCI-LOCAL 2013, Thessaloniki, Greece, 19–21 September 2013; pp. 107–114. [Google Scholar]
- Tufekci, A.; Ekinci, H.; Kose, U. Development of an Internet-Based Exam System for Mobile Environments and Evalua-tion of its Usability. Mevlana Int. J. Educ. 2013, 3, 57–74. [Google Scholar] [CrossRef]
- Romero, C.; Ventura, S.; De Bra, P. Using Mobile and Web-Based Computerized Tests to Evaluate University Students. Comput. Appl. Eng. Educ. 2009, 17, 435–447. [Google Scholar] [CrossRef] [Green Version]
- Tan, T.-H.; Liu, T.-Y. The Mobile-Based Interactive Learning Environment (MOBILE) and a Case Study for Assisting Ele-Mentary School English Learning. In Proceedings of the IEEE International Conference on Advanced Learning Technologies, Joensuu, Finland, 30 August–1 September 2004; pp. 530–534. [Google Scholar]
- Al Masri, A. Using Mobile Phone for Assessing University Students in English Literature in Jordan. Eur. Sci. J. 2012, 8, 195–206. [Google Scholar]
- Coulby, C.; Hennessey, S.; Davies, N.; Fuller, R. The Use of Mobile Technology for Work-Based Assessment: The Student Experience. Br. J. Educ. Technol. 2011, 42, 251–265. [Google Scholar] [CrossRef]
- Georgieva, E. A Comparison Analysis of Mobile Learning Systems. Commun. Cogn. 2007, 40, 1–6. [Google Scholar]
- Hwang, G.-J.; Chang, H.-F. A Formative Assessment-Based Mobile Learning Approach to Improving the Learning Atti-Tudes and Achievements of Students. Comput. Educ. 2011, 56, 1023–1031. [Google Scholar] [CrossRef]
- Sinclair, M.; Education in Emergencies. Learning for A Future: Refugee Education in Developing Countries. 2001, pp. 1–84. Available online: https://www.unhcr.org/3b8a1ba94.pdf (accessed on 29 March 2021).
- van Tryon, P.J.S.; Bishop, M.J. Theoretical Foundations for Enhancing Social Connectedness in Online Learning Environments. Distance Educ. 2009, 30, 291–315. [Google Scholar] [CrossRef]

| Constructs | Number of Items | Source |
|---|---|---|
| INT | 2 | [4] |
| CONT | 4 | [88,89,90] |
| INF | 4 | [91,92,93,94] |
| PEOU | 4 | [88,95,96] |
| PU | 4 | [88,91,95,96] |
| SYS | 4 | [91,92,93,96,97] |
| SERV | 4 | [90,91,92,94] |
| Construct | Cronbach’s Alpha |
|---|---|
| INT | 0.868 |
| CONT | 0.882 |
| INF | 0.829 |
| PEOU | 0.799 |
| PU | 0.836 |
| SYS | 0.890 |
| SERV | 0.845 |
| Criterion | Factor | Frequency | Percentage |
|---|---|---|---|
| Gender | Female | 271 | 48% |
| Male | 295 | 52% | |
| Age | 18–29 | 320 | 57% |
| 30–39 | 190 | 34% | |
| 40–49 | 48 | 8% | |
| 50–59 | 8 | 1% | |
| College | College of Business Administration | 242 | 43% |
| College of Humanities and Social Sciences | 35 | 6% | |
| College of Engineering and Information Technology | 130 | 23% | |
| College of General Education | 51 | 9% | |
| College of Mass Communication and Public Relations | 108 | 19% | |
| Education qualification | Bachelor’s | 395 | 70% |
| Master’s | 105 | 19% | |
| Doctorate | 66 | 11% |
| Constructs | Items | Factor Loading | Cronbach’s Alpha | CR | PA | AVE |
|---|---|---|---|---|---|---|
| Intention to use mobile exam platforms | INT1 | 0.799 | 0.815 | 0.828 | 0.821 | 0.625 |
| INT2 | 0.728 | |||||
| Content quality | CONT1 | 0.758 | 0.718 | 0.755 | 0.780 | 0.661 |
| CONT2 | 0.865 | |||||
| CONT3 | 0.859 | |||||
| CONT4 | 0.796 | |||||
| Information quality | INF1 | 0.839 | 0.753 | 0.801 | 0.798 | 0.650 |
| INF2 | 0.887 | |||||
| INF3 | 0.740 | |||||
| INF4 | 0.822 | |||||
| Perceived Ease of Use | PEOU1 | 0.730 | 0.869 | 0.819 | 0.836 | 0.612 |
| PEOU2 | 0.777 | |||||
| PEOU3 | 0.885 | |||||
| PEOU4 | 0.848 | |||||
| Perceived Usefulness | PU1 | 0.799 | 0.852 | 0.903 | 0.894 | 0.709 |
| PU2 | 0.868 | |||||
| PU3 | 0.912 | |||||
| PU4 | 0.820 | |||||
| Quality of the system | SYS1 | 0.760 | 0.806 | 0.887 | 0.889 | 0.598 |
| SYS2 | 0.850 | |||||
| SYS3 | 0.884 | |||||
| SYS4 | 0.826 | |||||
| Service quality | SERV1 | 0.731 | 0.897 | 0.839 | 0.842 | 0.741 |
| SERV2 | 0.882 | |||||
| SERV3 | 0.851 | |||||
| SERV4 | 0.844 |
| INT | CONT | INF | PEOU | PU | SYS | SERV | |
|---|---|---|---|---|---|---|---|
| INT | 0.798 * | ||||||
| CONT | 0.430 | 0.852 | |||||
| INF | 0.518 | 0.459 | 0.817 | ||||
| PEOU | 0.514 | 0.600 | 0.528 | 0.832 | |||
| PU | 0.268 | 0.225 | 0.458 | 0.336 | 0.859 | ||
| SYS | 0.328 | 0.158 | 0.316 | 0.125 | 0.158 | 0.874 | |
| SERV | 0.520 | 0.105 | 0.444 | 0.540 | 0.487 | 0.230 | 0.785 |
| INT | CONT | INF | PEOU | PU | SYS | SERV | |
|---|---|---|---|---|---|---|---|
| INT | |||||||
| CONT | 0.200 | ||||||
| INF | 0.652 | 0.698 | |||||
| PEOU | 0.550 | 0.605 | 0.408 | ||||
| PU | 0.391 | 0.300 | 0.399 | 0.105 | |||
| SYS | 0.205 | 0.574 | 0.498 | 0.618 | 0.501 | ||
| SERV | 0.299 | 0.505 | 0.345 | 0.700 | 0.544 | 0.229 |
| Criteria | Complete Model | |
|---|---|---|
| Saturated Model | Estimated Mod | |
| SRMR | 0.042 | 0.050 |
| d_ULS | 0.895 | 2.408 |
| d_G | 0.677 | 0.626 |
| Chi-Square | 470.827 | 482.459 |
| NFI | 0.715 | 0.738 |
| RMS Theta | 0.082 | |
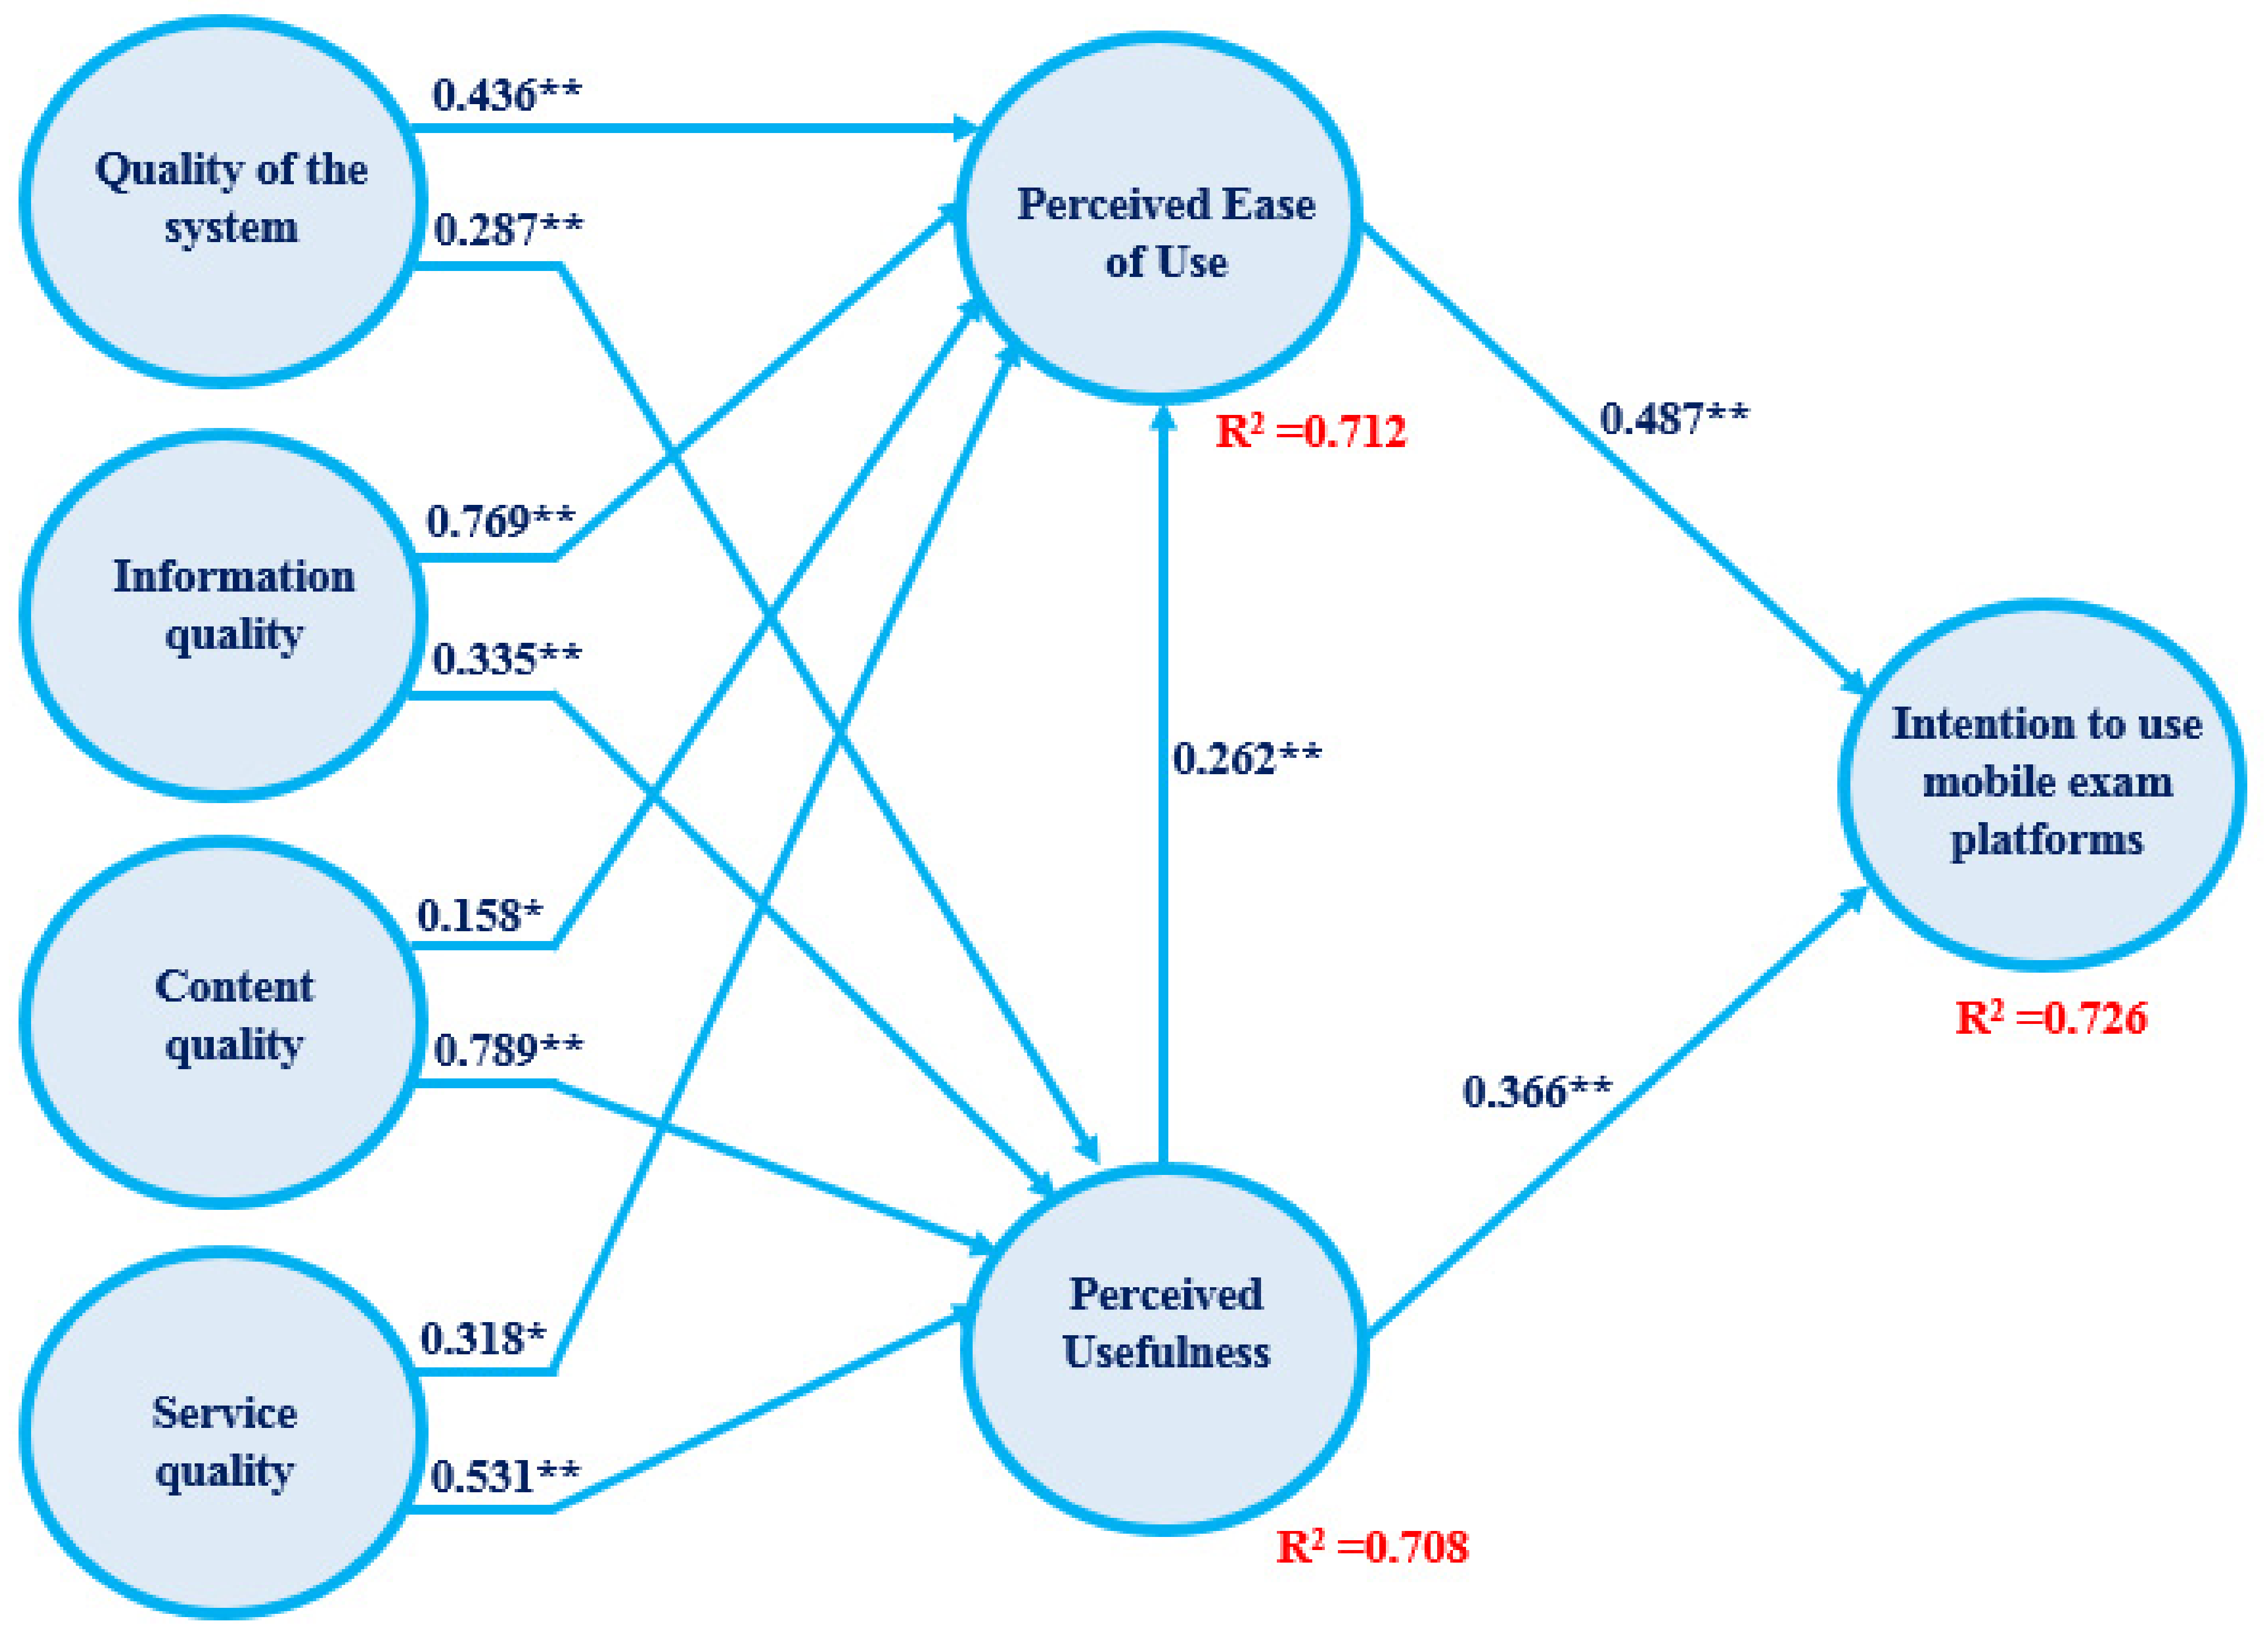
| Constructs | R2 | Results |
|---|---|---|
| INT | 0.726 | High |
| PEOU | 0.719 | High |
| PU | 0.708 | High |
| Hypothesis | Relationship | Path | T-Value | Path Coefficient | Result |
|---|---|---|---|---|---|
| H1a | SYS -> PEOU | 0.436 | 24.635 | +0.000 | Accepted ** |
| H1b | SYS -> PU | 0.287 | 18.009 | +0.000 | Accepted ** |
| H2a | INF -> PEOU | 0.769 | 15.546 | +0.000 | Accepted ** |
| H2b | INF -> PU | 0.335 | 10.222 | +0.000 | Accepted ** |
| H3a | CONT -> PEOU | 0.158 | 2.521 | +0.022 | Accepted * |
| H3b | CONT -> PU | 0.789 | 9.445 | +0.003 | Accepted ** |
| H4a | SERV -> PEOU | 0.318 | 1.630 | +0.026 | Accepted * |
| H4b | SERV -> PU | 0.531 | 13.780 | +0.000 | Accepted ** |
| H5 | PEOU -> PU | 0.262 | 11.248 | +0.000 | Accepted ** |
| H6 | PEOU -> INT | 0.487 | 13.990 | +0.000 | Accepted ** |
| H7 | PU -> INT | 0.366 | 10.201 | +0.001 | Accepted ** |
Publisher’s Note: MDPI stays neutral with regard to jurisdictional claims in published maps and institutional affiliations. |
© 2021 by the authors. Licensee MDPI, Basel, Switzerland. This article is an open access article distributed under the terms and conditions of the Creative Commons Attribution (CC BY) license (https://creativecommons.org/licenses/by/4.0/).
Share and Cite
Alshurideh, M.T.; Al Kurdi, B.; AlHamad, A.Q.; Salloum, S.A.; Alkurdi, S.; Dehghan, A.; Abuhashesh, M.; Masa’deh, R. Factors Affecting the Use of Smart Mobile Examination Platforms by Universities’ Postgraduate Students during the COVID-19 Pandemic: An Empirical Study. Informatics 2021, 8, 32. https://0-doi-org.brum.beds.ac.uk/10.3390/informatics8020032
Alshurideh MT, Al Kurdi B, AlHamad AQ, Salloum SA, Alkurdi S, Dehghan A, Abuhashesh M, Masa’deh R. Factors Affecting the Use of Smart Mobile Examination Platforms by Universities’ Postgraduate Students during the COVID-19 Pandemic: An Empirical Study. Informatics. 2021; 8(2):32. https://0-doi-org.brum.beds.ac.uk/10.3390/informatics8020032
Chicago/Turabian StyleAlshurideh, Muhammad Turki, Barween Al Kurdi, Ahmad Qasim AlHamad, Said A. Salloum, Shireen Alkurdi, Ahlam Dehghan, Mohammad Abuhashesh, and Ra’ed Masa’deh. 2021. "Factors Affecting the Use of Smart Mobile Examination Platforms by Universities’ Postgraduate Students during the COVID-19 Pandemic: An Empirical Study" Informatics 8, no. 2: 32. https://0-doi-org.brum.beds.ac.uk/10.3390/informatics8020032