Article

A Simplified and High Accuracy Algorithm of RSSI-Based Localization Zoning for Children Tracking In-Out the School Buses Using Bluetooth Low Energy Beacon

1
School of Engineering and Technology, Walailak University, Nakhon Si Thammarat 80160, Thailand
2
Center of Excellence on Wood and Biomaterials, Walailak University, Nakhon Si Thammarat 80160, Thailand
3
Center of Excellence for Sustainable Disaster Management, Walailak University, Nakhon Si Thammarat 80160, Thailand
4
National Institute of Public Administration (INTAN), Kuala Lumpur 50480, Malaysia
*
Authors to whom correspondence should be addressed.
Submission received: 18 August 2021 / Revised: 16 September 2021 / Accepted: 20 September 2021 / Published: 25 September 2021
(This article belongs to the Special Issue Big Data and Transportation)

Abstract

:
To avoid problems related to a school bus service such as kidnapping, children being left in a bus for hours leading to fatality, etc., it is important to have a reliable transportation service to ensure students’ safety along journeys. This research presents a high accuracy child monitoring system for locating students if they are inside or outside a school bus using the Internet of Things (IoT) via Bluetooth Low Energy (BLE) which is suitable for a signal strength indication (RSSI) algorithm. The in/out-bus child tracking system alerts a driver to determine if there is a child left on the bus or not. Distance between devices is analyzed for decision making to affiliate the zone of the current children’s position. A simplified and high accuracy machine learning of least mean square (LMS) algorithm is used in this research with model-based RSSI localization techniques. The distance is calculated with the grid size of 0.5 m × 0.5 m similar in size to an actual seat of a school bus using two zones (inside or outside a school bus). The averaged signal strength is proposed for this research, rather than using the raw value of the signal strength in typical works, providing a robust position-tracking system with high accuracy while maintaining the simplicity of the classical trilateration method leading to precise classification of each student from each zone. The test was performed to validate the effectiveness of the proposed tracking strategy which precisely shows the positions of each student. The proposed method, therefore, can be applied for future autopilot school buses where students’ home locations can be securely stored in the system used for references to transport each student to their homes without a driver.

1. Introduction

Today it has been found that children using school buses have encountered a number of problems, such as the kidnapping of students, or the case of a student who became stuck and died in a school bus, which was found in China. With these problems, no one can be sure that students will arrive safely at home or school. Therefore, all safety-conscious parents are looking for ways that can track real-time locations of a school bus and their children to ensure the safety of their children when using the school bus. The location tracking systems consist of two systems which are the outdoor and indoor positioning systems. The real-time location tracking of children using the school bus can be used in both systems that are school bus location tracking, which is an outdoor positioning system and the other is the tracking system for the location of students that are still stuck in the car, which is an indoor positioning system.
The location tracking is used to track the location of children using the school bus to prevent and check if the child is still stuck in the car after the school bus has been sent from the bus stop. It may be a case of the child falling asleep, etc. Nowadays, there are several approaches for Indoor Positioning such as infrared, ultrasound [1,2,3,4] radio frequency [2], magnetic [5], microelectromechanical systems [6,7] vision-based [8], audible sound [9,10], WiFi-based, Bluetooth Low Energy (BLE), Radio Frequency Identification (RFID)-based and Global Positioning Systems (GPS). With general indoor positioning technologies, there is no single technology that can balance cost, accuracy, performance, robustness, complexity, and limitations [11].
The location tracking of children in the school bus using Bluetooth Low Energy (BLE) technology is growing in popularity and use due to improvements in accuracy while reducing costs. BLE is a low power wireless technology developed from Bluetooth Special Interest Groups (SIG). The special feature of Bluetooth 6.0 is to support next-generation wireless devices which have low power and low latency. It can be used in a short distance (not more than 50 m or 160 feet). The BLE is guaranteed on the IEEE 802.15.1 standard. The main function of the BLE central device is to scan and connect to the BLE peripheral devices. Moreover, the BLE is a small and low-cost hardware device that also consumes low power. BLE technology is widely used in several applications, for example, BLE used in occupancy tracking in office spaces [12], in building emergency management [13], to identify occupant–appliance interaction patterns [14], and for smart energy management [15], etc.
The summary details of BLE are shown in Table 1. The BLE positioning algorithms are divided into two methods: the received signal strength indication (RSSI) distance method and wireless fingerprint positioning technology. Most of the past pioneering work simply used the BLE received signal strength indication (RSSI), which made BLE widely used in various indoor environments. In general, the RSSI distance method will receive the received signal strength (RSS) from the primary Bluetooth reference point to determine distance loss patterns, and then estimate the user’s position through some algorithms. This method can find a precise distance with accurate reception signal strength. However, in practical tests, the accuracy was still average. Several pieces of research have improved and solved the accuracy problem such as using a back diffusion neural network (BPNN) by creating an RSS distance model to estimate the values, which improves the estimation accuracy of the distance loss model. However, this method requires a lot of data to train the neural network model to be accurate [16]. Kalman’s filter is used to process the initially collected RSSI. Then, create an RSSI distance model by modulating curves and positions using a weighted least square algorithm [17]. However, RSSI noise continues to fluctuate in both methods, as RSSI is caused by complex noise, and Gaussian distribution with Kalman filters may not yet be clearly optimized. Moreover, either method may improve the accuracy of distance estimation to some extent with the constant transmit power of Bluetooth beacons in one position. However, power transmission fluctuates from time to time, resulting in incorrect distance loss models. Therefore, to solve this problem, this research proposes a real-time modified RSSI method to mitigate the influence of volatility.
This research will be organized into five sections as follows. Section 2 presents the methods of the location tracking with the received signal strength indication (RSSI), is used to analyze the distance between the devices. Then, the RSSI value is calculated to increase the accuracy and positioning ability of the device. The proposed system includes the RSSI distance model algorithm. Section 3 describes presents the experiments by using BLE to track the location of the school bus. The test is to display the result from the analysis of the signal strength of Bluetooth via an application. Finally, Section 4 concludes the paper and provides some future directions.

2. Materials and Methods

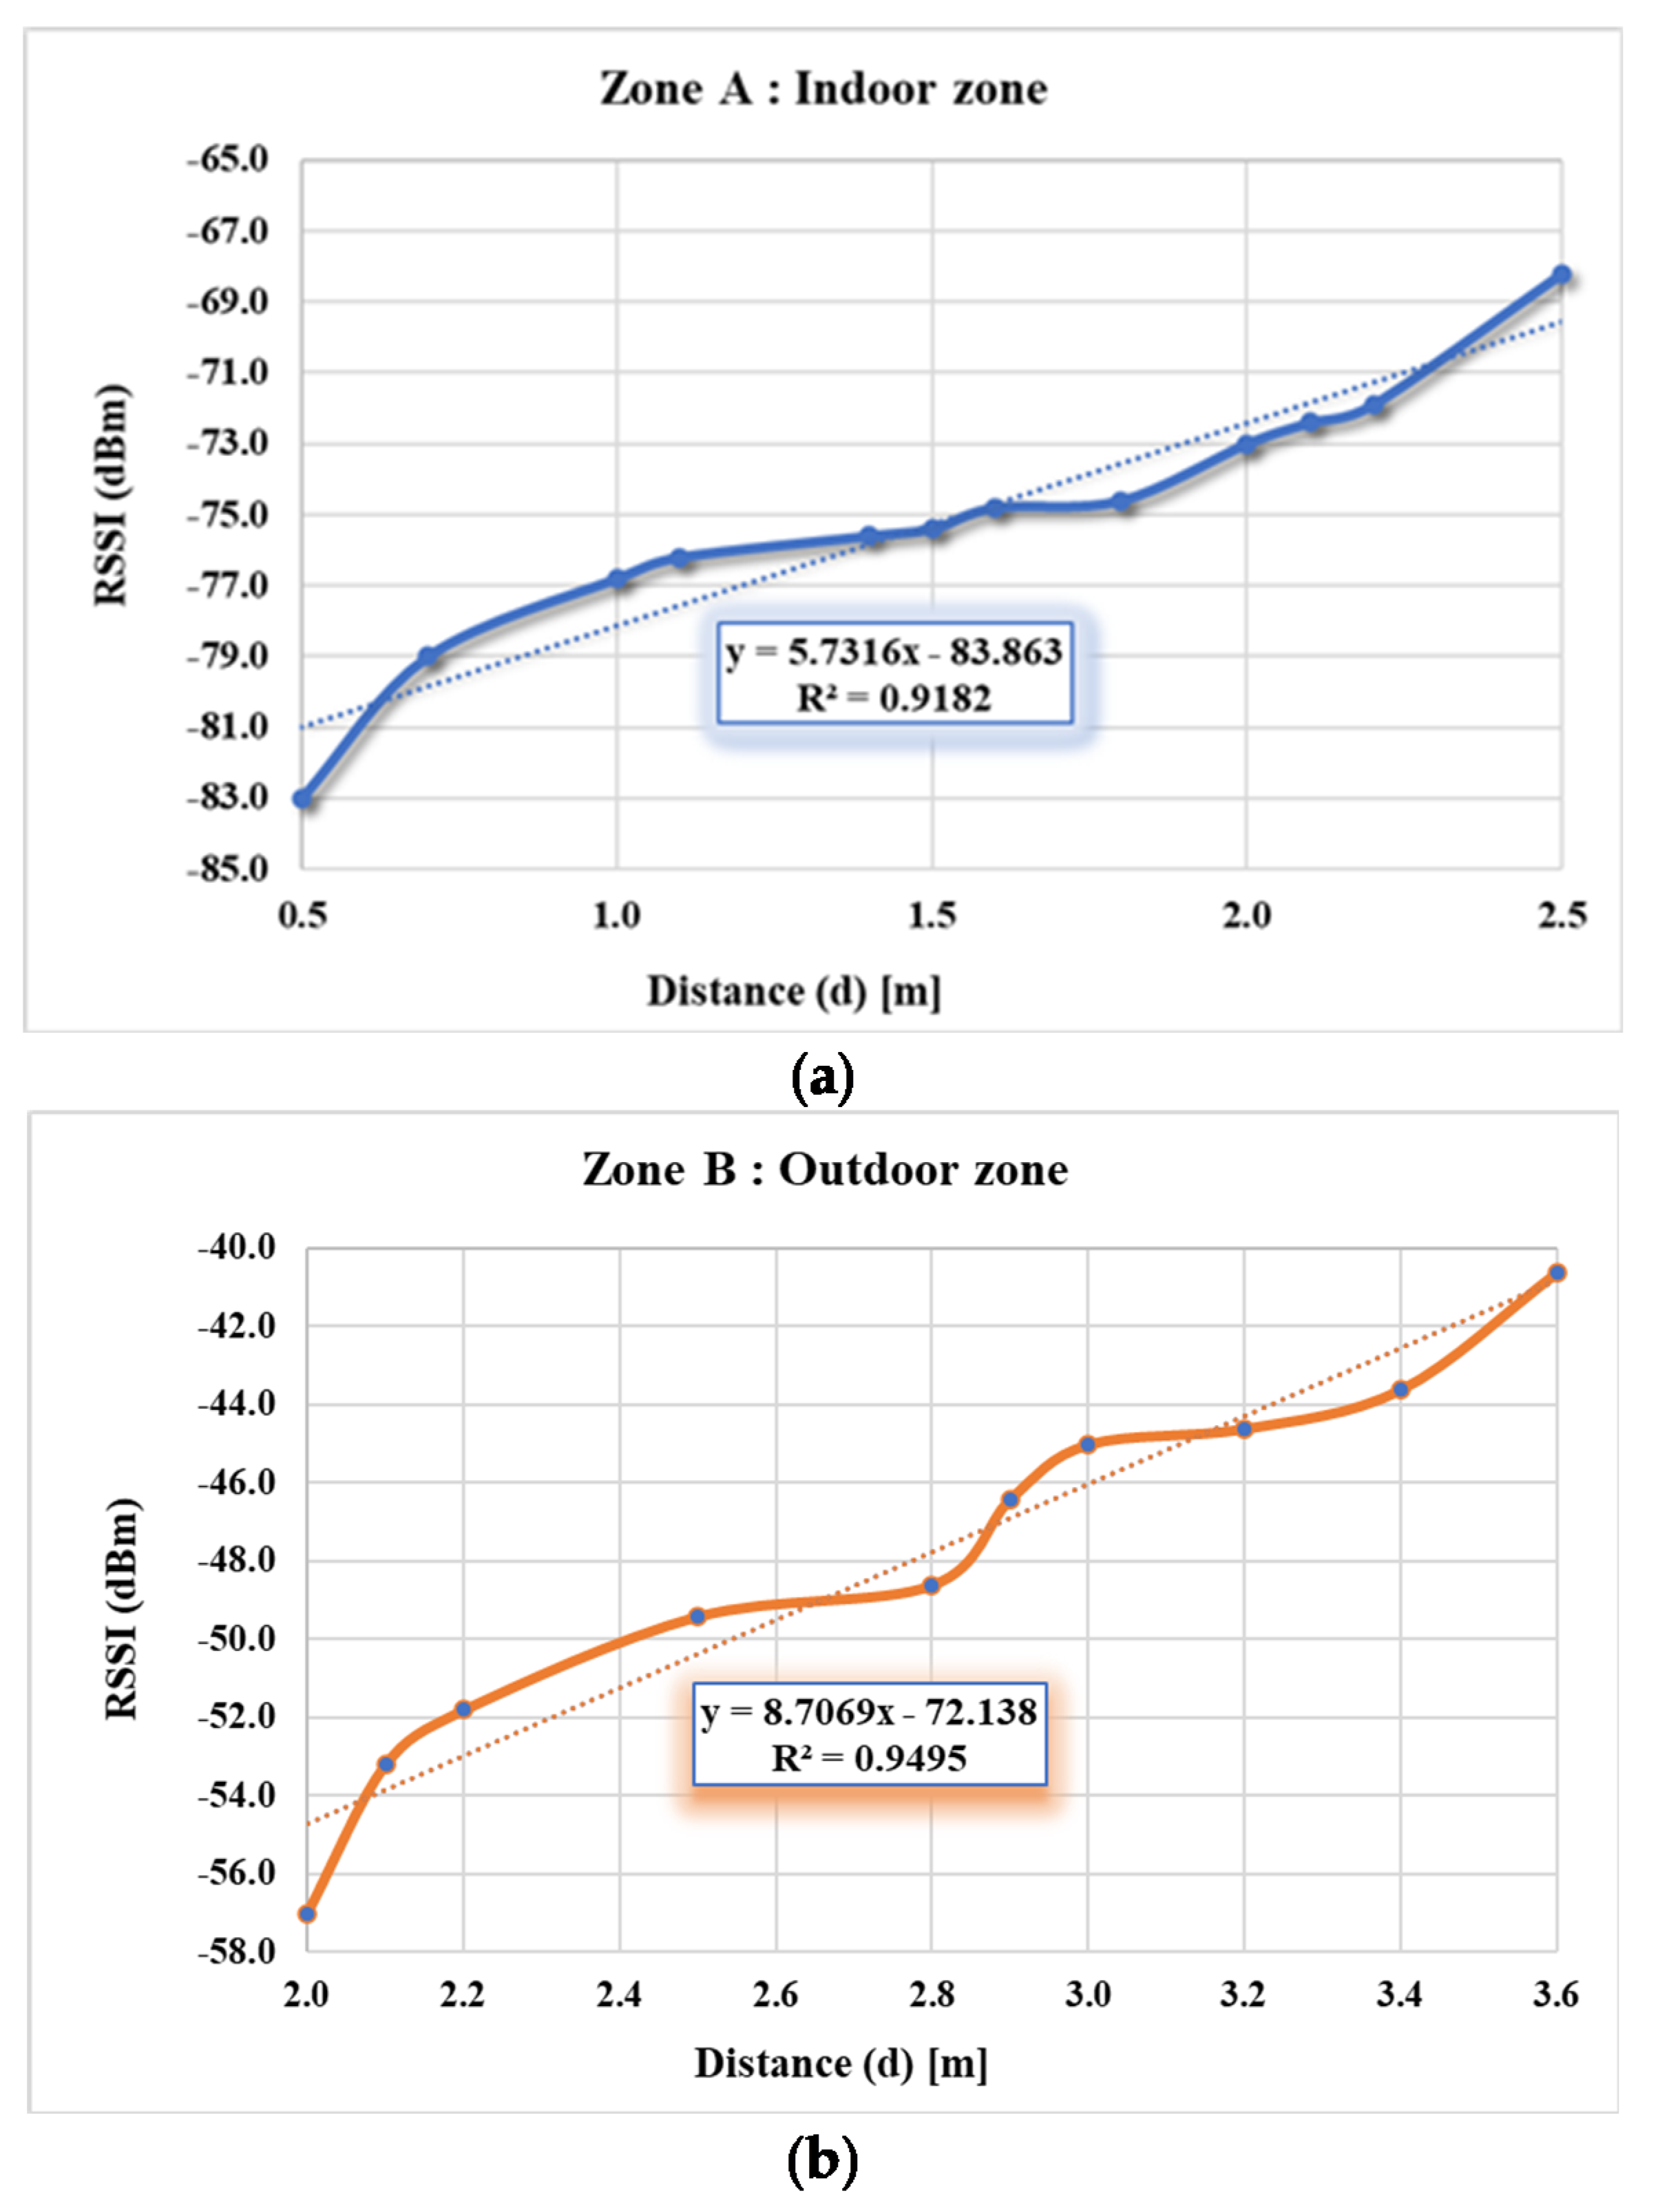
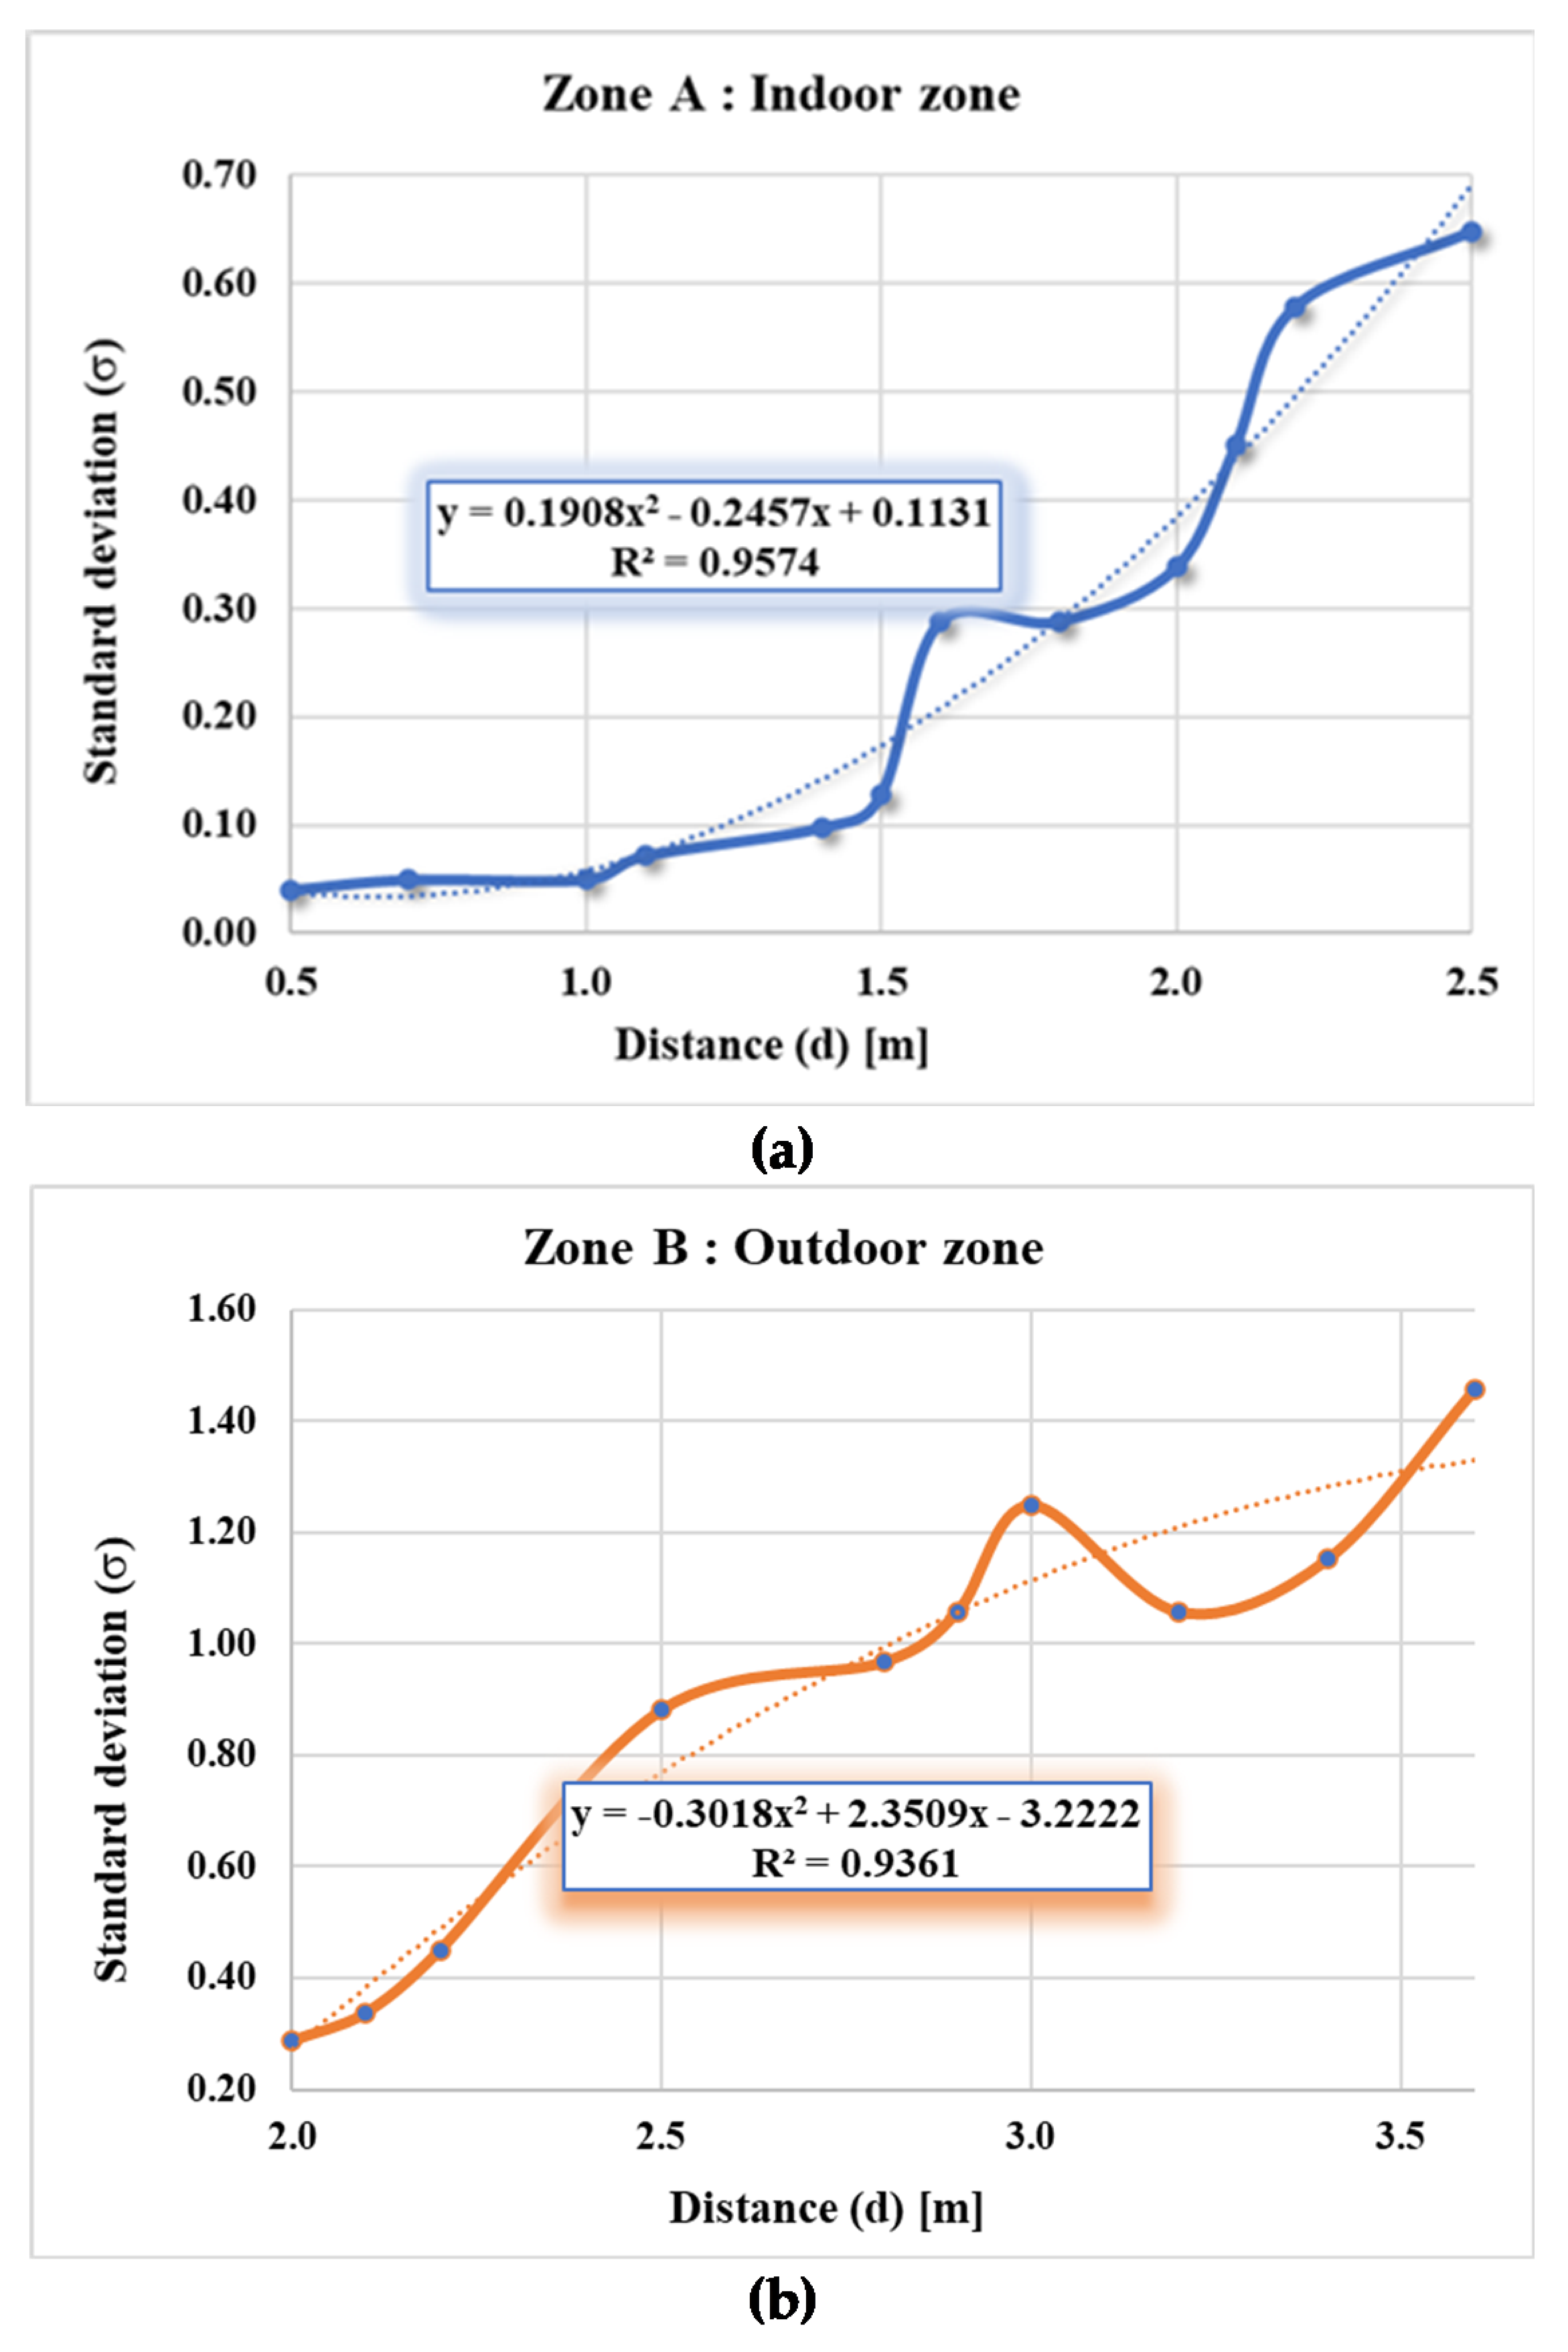
2.1. RSSI Distance Model

The technology is of great interest for school bus children’s RSSI location tracking, namely WiFi and BLE, both of which are classified as types of indoor location tracking, while GPS is often used for outdoor location tracking. Both WiFi and BLE operate on the 2.4 GHz band. WiFi has over 50 sub-bands, while BLE has 40 channels. The WiFi received signal strength indicator (RSSI) reflects the total value of all channel information. For this reason, WiFi is not useful for indoor applications. The BLE is becoming the focus of current indoor positioning technologies because it takes advantage of low power consumption and easy deployment [18]. Bluetooth RSSI is measured with constant power transmission. There will be complex noise that greatly affects positioning accuracy and results in the appearance of the time-varying characteristics of RSSI. In addition, indoor electromagnetic environments, multiple fading and other noise, as well as the RSSI fluctuation of two Bluetooth beacons made by different companies all affect the accuracy and Bluetooth RSSI measured in the system [19,20,21,22]. In order to reduce random fluctuations and power consumption of RSSI and improve positioning accuracy, this research presents a design of a student-tracking smartwatch device by measuring signal strength with RSSI to determine whether the child is still inside or got off the school bus. Moreover, there is a notification to the carpool teacher and the driver.
The distance of propagation path-loss shows the channel fading characteristic follows a lognormal distribution. Thus, the instant RSSI distance measurement generally uses the logarithmic distance path-loss model, the propagation model that reveals the corresponding relationship between distance and RSSI can be expressed as Equation (1) [16,17,18].
R S S I = 10 n l o g ( D D 0 ) + A + X σ
where RSSI is a dependent variable of the received signal strength indication, D is the estimated distance between the transmitter and the receiver, and n is a path-loss parameter related to the specific wireless transmission environment. The more obstacles there are, the larger n will be. A is the RSSI with distance D0 from the transmitter, which is a constant value. σ is a parameter representing the path loss exponent while Xσ is a Gaussian-distribution random variable with mean 0 and variance σ2. For the convenience of calculation, D0 usually takes a constant value. Since Xσ has a mean of 0, the distance-loss model can be obtained with
R S S I ( k , i ) = 10 n k l o g ( d k ) + A k
where d k is the distance from the unknown transmitter node to the kth the receiver node, and A k and n k are the model parameters of the kth receiver node. A k is the measured RSSI when the received node is a fixed distance away from the transmitting node. Form (2) found that the parameters A k and n k should be accurately estimated to improve the accuracy. The n k parameters are relevant with the wireless transmission environment which can be obtained through the optimization of many experimental measurements. A k depends on the transmitting power of Bluetooth. Ideally, A k should be determined by specifying one of the Bluetooth signals. The transmission power of Bluetooth varies with time.
Accurately calculating the relationship between RSSI and distances using the logarithmic distance loss model due to the complex indoor environment is extremely difficult for researchers. Therefore, there are several methods for modelling the RSSI with the most accurate distances based on any application system. However, several applications do not require a high accuracy localization, but need area-based localization; similarly, this article does not require the actual position of the tracked object, but rather to ensure the objects are within a certain area. Rather than having an accurate position of the object, users are more interested to know with absolute certainty that the tracked object is within a certain area. Therefore, this research presents a simplified method to locate tracked objects in zones with high certainty and reliability to separate the positional zone between in the car and outside the school bus only to track whether the students, especially young children, are still stuck in the school bus or not. Thus, the least mean squares (LMS) algorithm is used to fit the parameters by gathering the RSSI values for Bluetooth beacons at different distances. Suppose that the distance estimation is based on M samples of R S S I ( k , i ) , which represents the ith RSSI sample measured by the kth the receiver node. For getting a good performance, the median value of R S S I ( k , i ) is used to obtain the distance estimate:
d k ^ = 10 A k R S S I k 10 n k
where R S S I k is the median RSSI value measured by the kth and the receiver node is given by
R S S I k = M E D I A N { R S S I ( k , i ) , i = 1 , , M
To characterize the RSSI model indoor environment, measurements have been realized. The experiment has been done on a school bus.

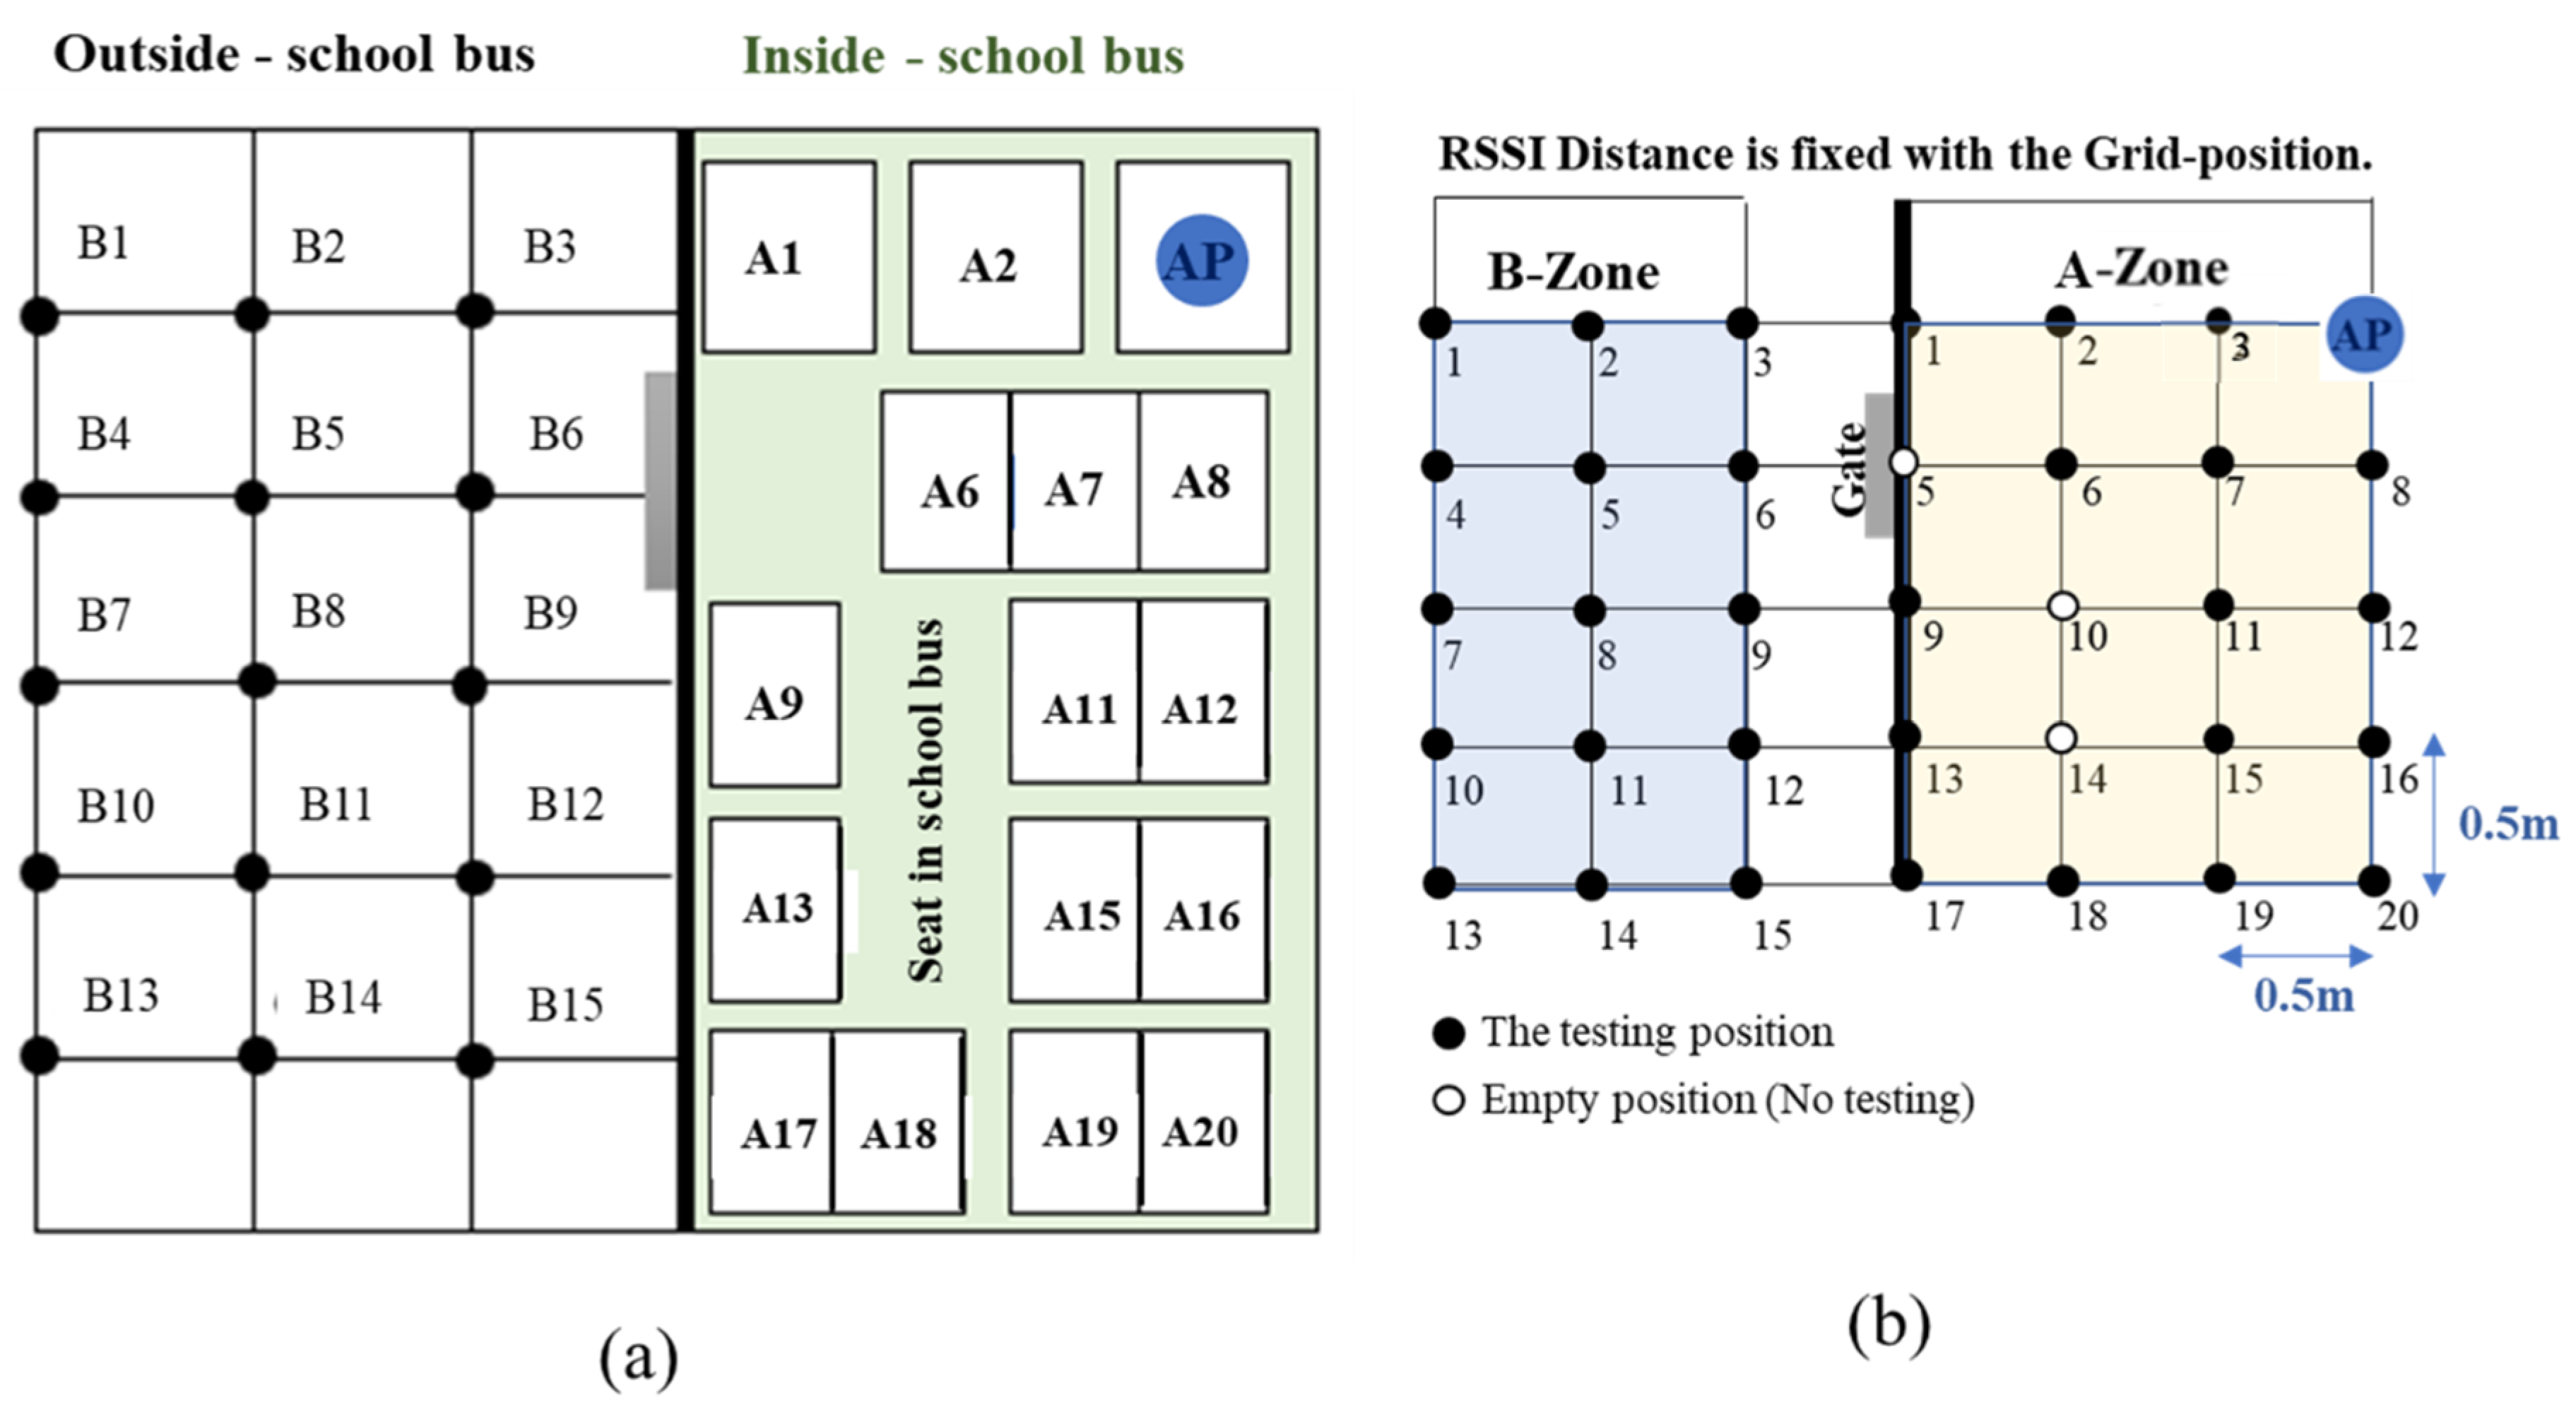
2.2. RSSI Mapping and Experimental Setup

RSSI mapping is a testing location arranged by a set of devices in the indoor/outdoor space of the school bus, as shown in Figure 1a. The position of each device is precisely defined, which is modelled as a grid as shown in Figure 1b, where it is supposed that at one of the intersection dots of a grid, the distance is defined as about 0.5 m of each of the intersection points (the size of the grid is 0.5 m × 0.5 m). The testing location is covered by the antenna of the access point (AP), which is a Raspberry pi 3 Model B+ and is shown as the blue point in Figure 1. The AP is used to receive the Bluetooth signal from the smartwatch. To test the signal strength, there are 30 positions of A and B zones, which are located in and outside the school bus. If there are obstacles in working conditions, it causes signal degradation in the central device and Bluetooth. Therefore, each of the positions is relocated and tested in a loop based on the movement of the smart wristband. Each position of zone A and B are tested 40 times to find the accurate value of the RSSI.

2.3. Tracking and Calculating a Location from Signal Strength

When students get on the school bus, the device will start to detect the BLE signal sending from a smart wristband. The BLE signal will calculate the distance by using the signal strength. In order to find the distance using the signal strength, the RSSI values are collected in a loop to find the average value. The average RSSI value is used to detect whether the students are inside or outside the bus. BLE can calculate the signal strength in the unit of dBm. The calculation of distance using the signal strength to find the average value of the signal strength uses the trilateration algorithm, which is a basic positioning method. The trilateration algorithm was chosen in this study because of the fact that a precise alignment between a reference point (a transmitter node) and smartwatches (unknown nodes) is not required and only distances between nodes are needed, which is suitable for the studied application where a school bus and each student are continuously moving during a journey. In this article, the position of the transmitter nodes is assumed to be known. The relationship between the unknown nodes’ position and the transmitter node positions can be expressed as:
log ( d k ) = ( x x k ) 2 + ( y y k ) 2
where (x,y) are the coordinates of the reference or unknown nodes ( x k , y k ) , and ( x 3 , y 4 ) are the coordinates of the transmitter nodes.

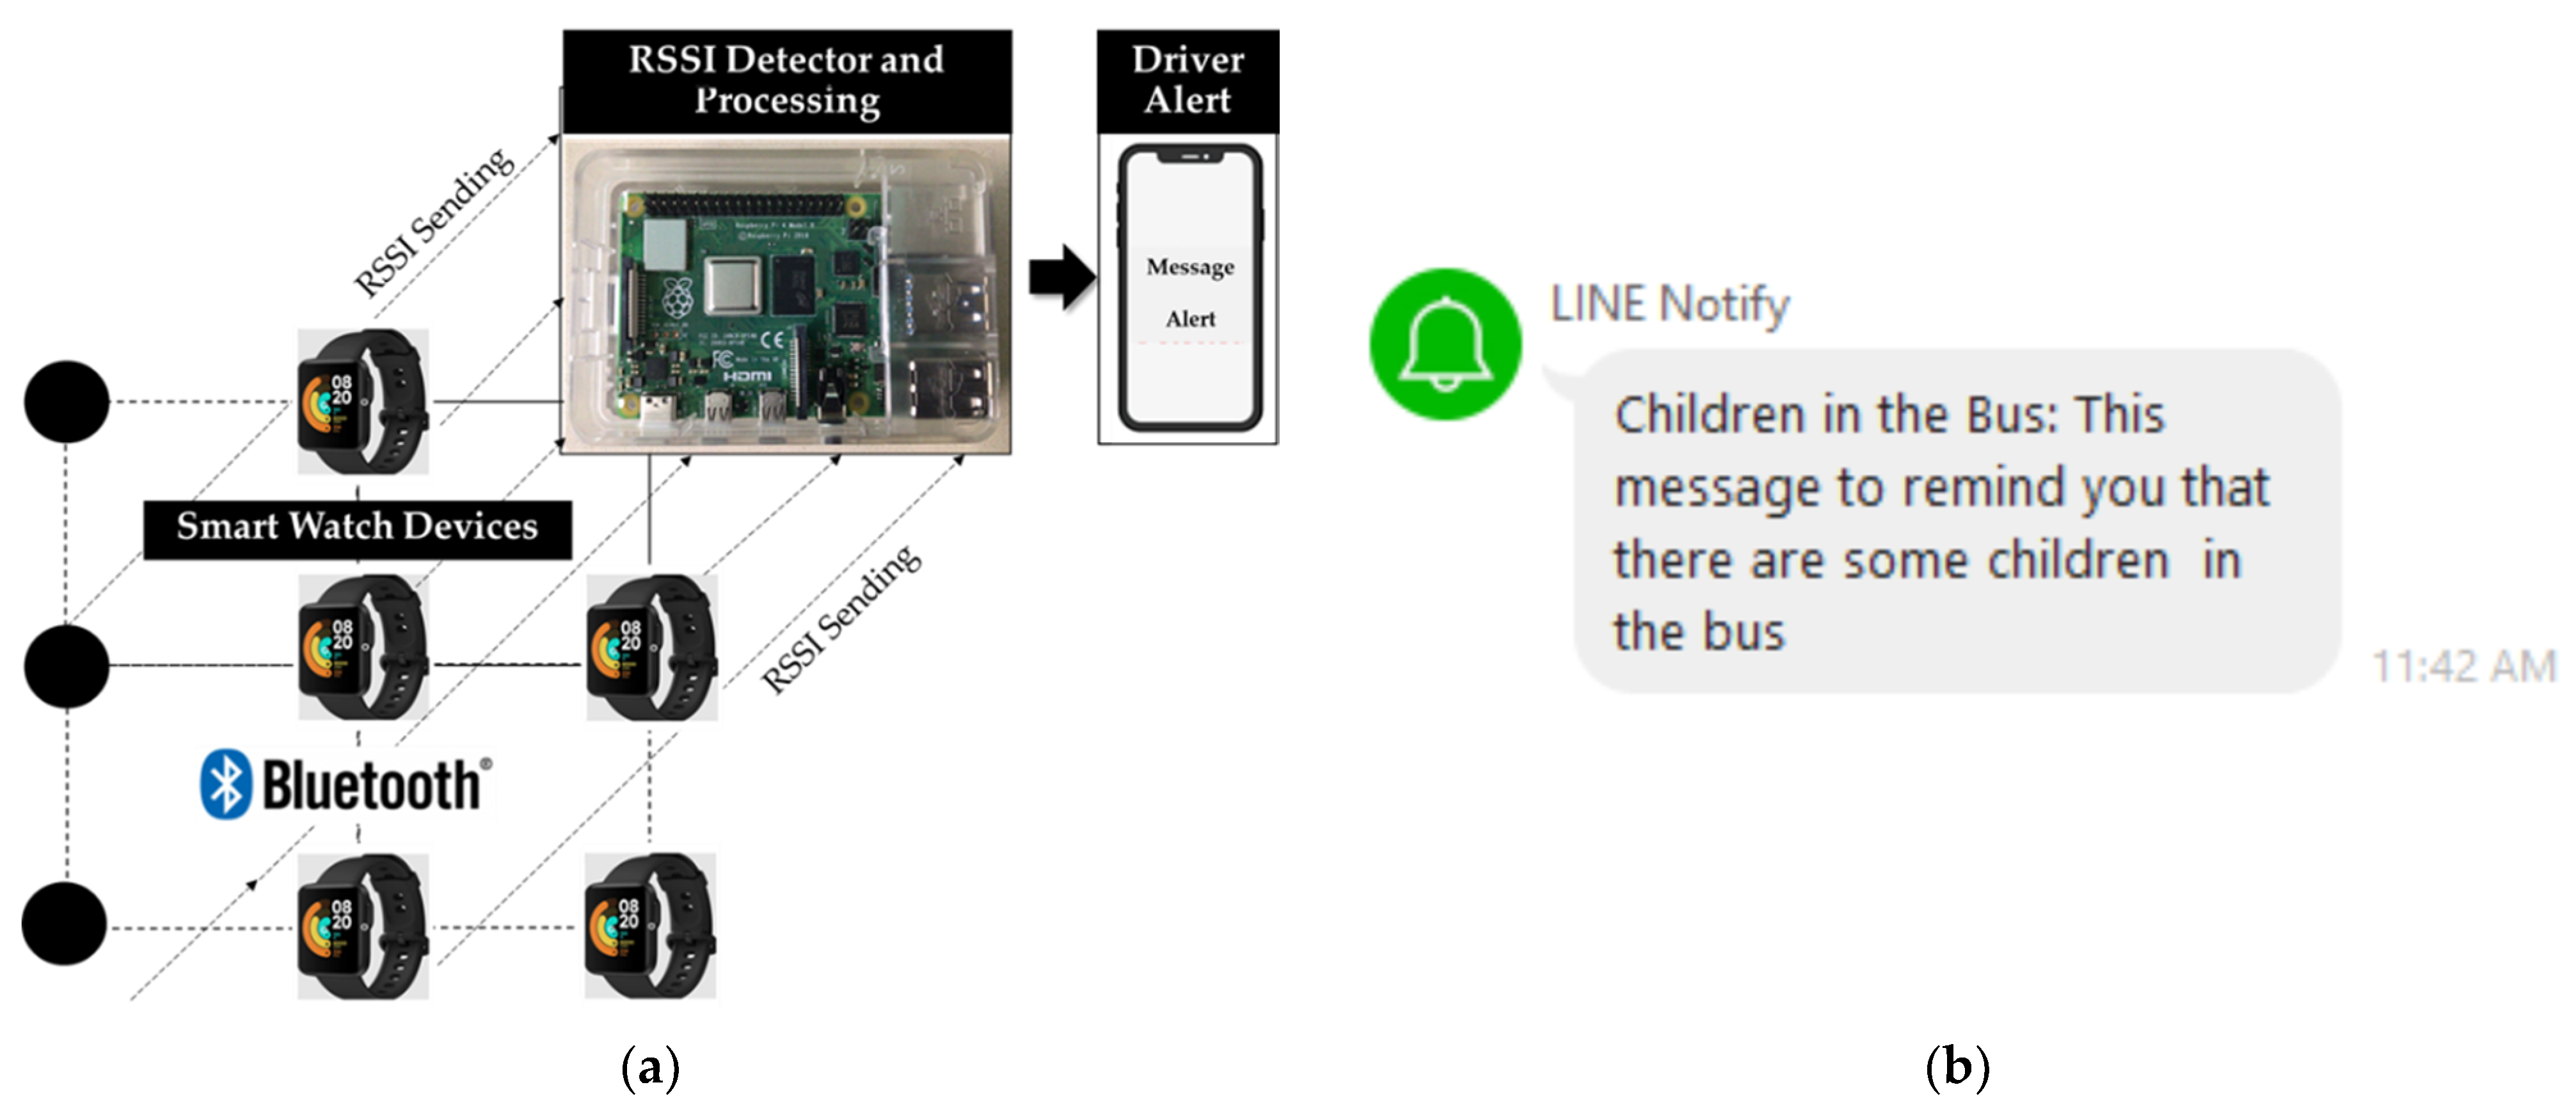
2.4. Description of the System

Any commercially available brands of smartwatches worn by students in a school bus can be set up for connection with the BLE system. The Bluetooth MAC address is installed to specify the ID of each targeted smartwatch. The Raspberry pi is used to scan for nearby Bluetooth devices with the AP and measure the RSSI signal strength of the BLE from every targeted node. The signal strength from each targeted node is compared with the reference value, set at −60 dBm. If the signal strength is less than the reference value (<−60 dBm), the system identifies that a student is at an “indoor” state (A-Zone) and if the signal strength is greater than the referent value (>−60 dBm), the system identifies that a student is at “outdoor” state (B-Zone). At every scanning, the system counts for existing nodes which represents the number of students in the school bus and stores that number until the last scanning round when the bus reaches its destination. If there is still an existing node being recorded in the system, two rounds of scanning will be performed to confirm that there is no student in the bus. If there is still an existing node in the bus, a sound and message notification will be sent to the chosen application (LINE application in this study) in the smartphone of the driver, and also a person who is responsible for the child. The sound and message notification were coded by Python software with systemctl and btmgmt command lines and the overall system architecture comprises of smartwatches, an RSSI detector and processing. A smartphone used for receiving notifications is presented in Figure 2.

3. Results

Practical channel modelling separates zones A and B. Numerous measurements are performed at different locations by placing the receiver device in the manner shown in Figure 1b, which is tested outdoors. Position the RSSI value receiver at each point by having equal distance between each access point 0.5 m apart, then repeat the measurements of each point 30 times and average the distance to the AP. We can obtain a large amount of RSSI data by changing the distance from 0.5 m to 3.6 m with an interval of 0.5 m and calculating the distance vector according to Equation (5). The RSSI results each point of dk, which is calculated in Equation (5), is presented in Table 2.
Based on the measured RSSI data, the median RSSI was calculated for a single distance. Figure 3 shows the median RSSI measured as a function of distance. As expected, it was found that the median RSSI decreased with distance. From these results, the parameters in Equation (2) presented the results of the measured RSSI data by separating values for two zones. Thus, the parameters of A k and η k can be expressed as two zone values that are A k = −83.86, η k = 5.73 for zone A and Ak = −72.14, η k = 8.71 for zone B.
Meanwhile, the standard deviation of the noise for each distance can be estimated by:
σ ^ k = 1 N i = 1 N ( R S S I ( k , i ) R S S I k ¯ ) 2
where R S S I k ¯ is the mean value of R S S I ( k , i ) , given by:
R S S I k ¯ = 1 N i = 1 N R S S I ( k , i )
The obtained results are shown in Figure 4. From the experimental results, the standard deviation of the noise, in terms of the distance from 0.5 to 2.5 m of zone A and from 2.0 to 3.6 m for zone B, can be expressed as:
σ(d) = 0.1908d2 − 0.2457d + 0.1131 :   (Zone A)
σ(d) = −0.3018d2 + 2.3509d − 3.2222 :   (Zone B)

4. Discussion and Conclusions

Using BLE to locate position is of interest, and thus several applications have embedded BLE into electronic devices. In this research, smartwatches were also run with BLE to locate whether a student is inside or outside a school bus, which helps the driver and person responsible for transporting students to/from a school or to their homes to be sure that there is no student left in the bus for each journey. Although the BLE is widely used in several applications, its Bluetooth signal strength varies due to many obstructions and bus movement during a journey, which compensates the location accuracy in the students’ tracking application. Therefore, in this research, the average signal strength is proposed to be compared with a known location resulting in improved accuracy.
The results of the positioning test calculated from signal strength between each position (A and B) were performed and it suggests that the RSSI values unpleasantly vary which could be improved by recollecting the values multiple times and using its averaged value instead. The tested position inside the bus (A area) gives the averaged RSSI value between −68.2 and −83.0 dBm, while that outside the bus (B area) gives the averaged RSSI value between −40.6 and −57.0 dBm. The averaged value of the signal strength proposed in this research can, therefore, be used to analyze the positioning with high accuracy, leading to the precise classification of each student from zone A and zone B
The high accuracy positioning measurement method proposed in this research can be further applied to a smarter student transportation bus system where a home location of students can be added to the proposed system which can be linked with each student’s individual smartwatch. When the school bus approaches each student’s home, notifications can be sent to the driver, the person in charge, and also the student. As a result, drivers may be flexible with the lowest risk of skipping students from their homes. Moreover, the mentioned smart system may be used with unmanned school buses in the future.

Author Contributions

Conceptualization, K.S., S.S. and K.F.; Formal analysis, K.S. and S.S.; Investigation, K.S., S.S. and K.F.; Methodology, K.S. and S.S.; Software, K.S.; Supervision, K.S. and K.F.; Writing—original draft, S.S.; Writing—review and editing, R.H. and K.F. All authors have read and agreed to the published version of the manuscript.

Funding

This study did not receive grants from any funding agencies in the public commercial, or not-for-profit sectors.

Institutional Review Board Statement

Not applicable.

Informed Consent Statement

Not applicable.

Acknowledgments

The authors would like to sincerely thank all students from School of Engineering and Technology, Walailak University, Nakhon Si Thammarat, Thailand for their time on helping the authors to perform experiments of the proposed devices for the devices’ accuracy validations.

Conflicts of Interest

The authors declare no conflict of interest.

References

  1. Dardari, D.; Closas, P.; Djuric, P.M. Indoor tracking: Theory, methods, and technologies. IEEE Trans. Veh. Technol. 2015, 64, 1263–1278. [Google Scholar] [CrossRef] [Green Version]
  2. Liu, H.; Darabi, H.; Banerjee, P.; Liu, J. Survey of wireless indoor positioning techniques and systems. IEEE Trans. Syst. Man Cybern. Part C Appl. Rev. 2007, 37, 1067–1080. [Google Scholar] [CrossRef]
  3. Shieh, W.Y.; Hsu, C.C.J.; Wang, T.H. Vehicle Positioning and Trajectory Tracking by Infrared Signal-Direction Discrimination for Short-Range Vehicle-To-Infrastructure Communication Systems. IEEE Trans. Intell. Transp. Syst. 2018, 19, 368–379. [Google Scholar] [CrossRef]
  4. Ma, F.; Liu, F.; Zhang, X.; Wang, P.; Bai, H.; Guo, H. An ultrasonic positioning algorithm based on maximum correntropy criterion extended Kalman filter weighted centroid. Signal Image Video Process. 2018, 12, 1207–1215. [Google Scholar] [CrossRef]
  5. Lee, N.; Ahn, S.; Han, D. AMID: Accurate magnetic indoor localization using deep learning. Sensors 2018, 18, 1598. [Google Scholar] [CrossRef] [PubMed] [Green Version]
  6. Liu, J.; Chen, R.; Pei, L.; Guinness, R.; Kuusniemi, H. A hybrid smartphone indoor positioning solution for mobile LBS. Sensors 2012, 12, 17208–17233. [Google Scholar] [CrossRef] [PubMed]
  7. Chen, L.R.; Chen, Y.; Pei, L.; Chen, L. iParking: An intelligent indoor location-based smartphone parking service. Sensors 2012, 12, 14612–14629. [Google Scholar] [CrossRef]
  8. Wu, T.; Liu, J.; Li, Z.; Liu, K.; Xu, B. Accurate smartphone indoor visual positioning based on a high-precision 3D photorealistic map. Sensors 2018, 18, 1974. [Google Scholar] [CrossRef] [PubMed] [Green Version]
  9. Mandai, A.; Lopes, C.V.; Givargis, T.; Haghighat, A.; Jurdak, R.; Baldi, P. Beep: 3D indoor positioning using audible sound. In Proceedings of the 2005 2nd IEEE Consumer Communications and Networking Conference, CCNC2005, Las Vegas, NV, USA, 6 January 2005. [Google Scholar]
  10. Rishabh, I.; Kimber, D.; Adcock, J. Indoor localization using controlled ambient sounds. In Proceedings of the 2012 International Conference on Indoor Positioning and Indoor Navigation, Sydney, Australia, 13–15 November 2012. [Google Scholar]
  11. Gu, Y.; Lo, A.; Niemegeers, I. A survey of indoor positioning systems for wireless personal networks. IEEE Commun. Surv. Tutor. 2009, 11, 13–32. [Google Scholar] [CrossRef] [Green Version]
  12. Tekler, Z.D.; Low, R.; Gunay, B.; Andersen, R.K.; Blessing, L. A scalable Bluetooth Low Energy approach to identify occupancy patterns and profiles in office spaces. Build. Environ. 2020, 171, 106681. [Google Scholar] [CrossRef]
  13. Filippoupolitis, A.; Oliff, W.; Loukas, G. Occupancy detection for building emergency management using BLE beacons. Commun. Comput. Inf. Sci. 2016, 659, 233–240. [Google Scholar]
  14. Tekler, Z.D.; Low, R.; Blessing, L. Using smart technologies to identify occupancy and plug-in appliance interaction patterns in an office environment. IOP Conf. Ser. Mater. Sci. Eng. 2019, 609. [Google Scholar] [CrossRef]
  15. Choi, M.; Park, W.K.; Lee, I. Smart office energy management system using bluetooth low energy based beacons and a mobile app. In Proceedings of the 2015 IEEE International Conference on Consumer Electronics, ICCE 2015, Las Vegas, NV, USA, 26 March 2015. [Google Scholar] [CrossRef]
  16. Faragher, R.; Harle, R. Location fingerprinting with bluetooth low energy beacons. IEEE J. Sel. Areas Commun. 2015, 33, 2418–2428. [Google Scholar] [CrossRef]
  17. Li, W.; Wei, D.; Lai, Q.; Li, X.; Yuan, H. Geomagnetism-aided indoor Wi-Fi radio-map construction via smartphone crowdsourcing. Sensors 2018, 18, 1462. [Google Scholar] [CrossRef] [PubMed] [Green Version]
  18. Faragher, D.; Harle, R. An analysis of the accuracy of bluetooth low energy for indoor positioning applications. In Proceedings of the 27th International Technical Meeting of the Satellite Division of The Institute of Navigation (ION GNSS+ 2014), Tampa, FL, USA, 8–12 September 2014; pp. 201–210. [Google Scholar]
  19. Neburka, J.; Tlamsa, Z.; Benes, V.; Polak, L.; Kaller, O.; Bolecek, L.; Sebesta, J.; Kratochvil, T. Study of the performance of RSSI based bluetooth smart indoor positioning. In Proceedings of the 26th International Conference Radioelektronika, Kosice, Slovakia, 19–20 April 2016. [Google Scholar] [CrossRef]
  20. Golestani, A.; Petreska, N.; Wilfert, D.; Zimmer, C. Improving the precision of RSSI-based low-energy localization using path loss exponent estimation. In Proceedings of the 2014 11th Workshop on Positioning, Navigation and Communication, Dresden, Germany, 26 June 2014. [Google Scholar] [CrossRef]
  21. Nowak, T.; Hartmann, M.; Zech, T.; Thielecke, J. A path loss and fading model for RSSI-based localization in forested areas. In Proceedings of the 2016 6th IEEE-APS Topical Conference on Antennas and Propagation in Wireless Communications, IEEE APWC 2016, Cairns, Australia, 19–23 September 2016. [Google Scholar] [CrossRef]
  22. Nguyen, H.A.; Guo, H.; Low, K.S. Real-time estimation of sensor node’s position using particle swarm optimization with log-barrier constraint. IEEE Trans. Instrum. Meas. 2011, 60, 3619–3628. [Google Scholar] [CrossRef]
Figure 1. An application scenario about (a) the location set with a set of devices in it (b) Grid defining the distance calculator of the possible positions.
Informatics 08 00065 g001
Figure 2. (a) System architecture; (b) Example of a message notification being sent to a driver.
Informatics 08 00065 g002
Figure 3. Relationship of measured RSSI values and distance of (a) Zone A and (b) Zone B.
Informatics 08 00065 g003
Figure 4. Relationship of the noise standard deviation and distance for measured data of (a) Zone A and (b) Zone B.
Informatics 08 00065 g004
Table 1. The BLE information.
CharacteristicBluetooth Low Energy Information
Signal Rate720 Kbps
Normal Range10 m
Transmission Power1 dBm
Energy Consumption15 mA
Hardware costlow
Table 2. Relationship of measured RSSI values and distance in each Zoning.
Zone A (Indoor)Zone B (Outdoor)
Distance (d) (m) R S S I ( k , i ) ( dBm ) R S S I k   ¯   ( dBm ) SDDistance (d) (m) R S S I ( k , i ) ( dBm ) R S S I k   ¯ ( dBm ) SD
0.5−83.0−83.50.042.0−57.0−58.20.29
0.7−79.0−79.50.052.1−53.2−54.50.34
1.0−76.8−77.30.052.2−51.8−53.30.45
1.1−76.2−76.80.072.5−49.4−51.50.88
1.4−75.6−76.30.102.8−48.6−50.80.97
1.5−75.4−76.20.132.9−46.4−48.71.06
1.6−74.8−76.00.293.0−45.0−47.51.25
1.8−74.6−75.80.293.2−44.6−46.91.06
2.0−73.0−74.30.343.4−43.6−46.01.15
2.1−72.4−73.90.453.6−40.6−43.31.46
2.2−71.9−73.60.58
2.5−68.2−70.00.65
Publisher’s Note: MDPI stays neutral with regard to jurisdictional claims in published maps and institutional affiliations.

