
UTAUT Model for Smart City Concept Implementation: Use of Web Applications by Residents for Everyday Operations


1
Transport and Telecommunication Institute, 1 Lomonosov Str., LV-1019 Riga, Latvia
2
Baltic International Academy, 4 Lomonosov Str., LV-1003 Riga, Latvia
*
Author to whom correspondence should be addressed.
Informatics 2022, 9(1), 27; https://0-doi-org.brum.beds.ac.uk/10.3390/informatics9010027
Submission received: 11 January 2022
/
Revised: 4 March 2022
/
Accepted: 8 March 2022
/
Published: 10 March 2022
(This article belongs to the Special Issue Building Smart Cities and Infrastructures for a Sustainable Future)
Abstract
:The article considers the attitude of smart city residents towards the use of web applications in everyday life. It is very important for many stakeholders since it affects the involvement of people in all processes of urban life and contributes to the implementation of the smart city concept. The goal of the research is to study the factors influencing the intention and use of web applications in a smart city. Based on the results of surveying the residents of Riga, the UTA UT model was applied with the employment of partial least squares structural equation modeling in Smart PLS. The traditional constructs of the UTAUT model—Performance Expectancy (PE), Effort Expectancy (EE), Social Influence (SI), Facilitating Conditions (FC), as well as Attitude towards the use of Applications (ATA)—had a direct or indirect positive relationship with the intention to use technologies (Behavioral Intention: BI) and/or with usage of these technologies (Use Behavior: UB). Anxiety indirectly via ATA showed a negative effect on UB. The influence of Age, Gender and Education on BI and UB as moderators was also investigated. Only Age as a moderator negatively affected the relationship between FC and PE and SI. The results showed that in order to involve in full scope of the population of Riga in the use of communication technologies and the implementation of the smart city concept, it is necessary to create the appropriate conditions for residents, in particular by teaching people on a permanent basis. Some of the obtained results were different from similar studies’ results, which emphasizes that city authorities and other stakeholders should make decisions on the involvement of citizens in smart process based on the local peculiarities, which supports the slogan of smart cities—think globally, act locally.
1. Introduction
The concept of the smart city is one of the most widespread research topics in the contemporary scientific literature. This popularity is due to several facts: the great rate of urbanization [1], social and ecological problems within the urban environment [2], the disruptive growth of technological development and state-of-the-art technologies in human everyday routine life [3], and new economic realia and relations [4,5].
There are many various definitions of a smart city; nevertheless, the authors use the definition used by [6,7]: a city can be defined as smart when investments in human and social capital and traditional (transport) and modern (ICT) communication infrastructure fuel sustainable economic development and a high quality of life, with a wise management of natural resources, through participatory governance.
The population takes a special position in smart cities. The smart city concept pre-supposes that people are the source of changes in smart city, and simultaneously they are the object and target of all activities. The smart city is a place where traditional networks and services function more efficiently with the use of digital and telecommunication technologies for the benefit of its inhabitants and businesses [8,9,10]. The attitude of people to information technologies in different spheres depends on many factors. Some city residents do not accept information technologies or have certain problems with their use due to various reasons, for example, personal characteristics, lack of knowledge or technical resources, and so on [11,12]. These people may have problems with integration into the activities of a smart city, which, in turn, may become a barrier to smart city functioning, since the usage of information technologies is a requirement that smart cities put forward [3]. It is also inefficient from an economic point of view, since disuse of technologies results in poor allocation of resources and low efficacy [13,14,15]. The development of smart city areas requires an integrated understanding of various features of services, which influence the decision of people to use these services. Otherwise, they can be the source of the new forms of social exclusion due to a lack of skills and competence in using technologies [16], or a poor infrastructure or absence of necessary devices [17]. The technologies must contribute to constructing an inclusive society with a high rate of civic participation and transparency [6,18]. Therefore, it is important to study the behavior of people, their motivation, incentives [5,19] and the factors that influence the intention to use and the usage of the communication technologies for solving everyday tasks.
The goal of the research is to study the factors influencing the intention and use of web applications for everyday operations in smart cities. We assume that this study can facilitate all the processes involved in the implementation of a smart city due to understanding the problems of integrating the residents into the new digital environment and creating a base for developing approaches that facilitate this integration.
The important task of city authorities is to involve all groups of people in smart processes. Therefore, the objectives of the research are to determine the factors that can be used by authorities and businesses to improve the situation with citizens of Riga (Latvia) using web applications.
The practical value of this research is in investigating the factors affecting people’s decision to use applications and to participate in smart city operations.
The research has a certain scientific value since it adopts the Unified Theory of Acceptance and Use of Technology (UTAUT) model, which is traditionally applied to studying specific features, while the authors use it for investigating the general acceptance of technological tools. Moreover, this model is usually applied to technologies, while the authors consider web applications. This novelty can contribute to enhancing the methods implementation.
The practical value of the research is significantly higher; the stakeholders, such as the city authorities, utilities services, banks and other institutions, can use the results of this study to understand the issue of general acceptance of information technologies and web applications by the population of a smart city; it allows the authorities to involve people effectively in city processes, to facilitate the use of applications by all groups of a population within a smart city.
2. Literature Review
The concept of a smart city is represented in the scientific literature in many directions: technological tasks, ecological problems, issues of administrating, and so on. Many articles are devoted to the behavior of people in smart cities. Usually, the behavior of a population is considered in terms of energy and resource consumption [20,21,22], in ecological situations [8,23,24,25], social behavior [26,27,28] and economic behavior [29,30,31].
Usually, the authors consider six smart areas in their research: smart economy, smart people, smart governance, smart living, smart mobility and smart environment [1,32]. All these components include the intensive use of various technologies and applications.
A smart economy, based on innovations and oriented on sustainable and efficient resource allocations [33], can facilitate the improvement of quality of living for inhabitants. City economic life is organized via encouraging the active participation of people in a “collaborative and sharing economy” [34]. Another very important factor is supporting business in the contemporary environment. The usage of technologies brings additional advantages to the companies allowing them to operate in a bigger market involving bigger groups of consumers, which gives them even greater possibilities in the time of the pandemic [35].
Official bodies at all levels support the authorities and government and allow them to function via engaging the population in all activities using the internet and applications [36]. The population receives the information from the authorities, submits various forms and participates in different activities—all of these actions require the usage of special applications, which are oriented on facilitating the communication between various governmental structures and different groups of city inhabitants. These applications should be used by people with different levels of skill and competence; therefore, they should be user-friendly and easy to operate. So, understanding how people perceive the applications, used by governments for communication with inhabitants, is highly important for authorities to provide the proper conditions for increasing the inclusiveness of citizens.
According to [37], the technologies are not just issues providing certain benefits if people have access to them (which is the condition of smart city functioning). They have great social and cultural effects and work as artefacts, improving the lives of people in difficult times. Social aspects of using technologies are very important for all people. We are significantly determined by our social connections. The role of society affecting human behavior is difficult to overestimate. On the other hand, society not only influences our behavior and attitudes towards technologies, but in general the inclusiveness of an individual into society is determined by the ability to meet the requirements of the society, including the ones in the area of technologies. To be a part of contemporary society, a person should master certain technologies and applications, which are essential for communication and living in a smart city.
Mobility in smart cities is also an area which uses contemporary technologies. Technologies allow the quality of obtained data to be improved, and these data, obtained timely and regularly, result in advanced traffic management [38]. There are technologies which enable us to follow the routes effectively [39] and to improve the drivers’ comfort and efficiency [40]. These technologies, as well as many other ones, make mobility in smart cities more convenient for people. The implementation of these technologies is not so easy, it requires time and effort to be adopted at a high degree [41].
Many technological innovations are integrated into the so called “public goods” (traffic regulation, information panels, lighting, and so on) [42,43], and all people consume them without direct “communication” with smart technologies. Usually, this process does not require any special knowledge or skills. However, the introduction of many innovations is resource-intensive, and further use of such smart solutions requires the active participation of a population.
Therefore, technology will bring success only if people use them. It is possible to assume that not all people take these “smart” devices and applications as really user-friendly or making everyday life easy. Consequently, the attitude of people of different ages towards smart solutions should be studied, since it can change the life of a city.
As we live with the great pressure of the coronavirus pandemic, the usage of communication technologies is gaining even greater importance. The situation causes people to master and use the applications in the sphere, where once they could not even imagine a lack of direct face-to-face communication. For example, in education we face instructions given online, and it is a real challenge and a “natural experiment” [44]. Online shopping has become the necessity, especially for older people, who are a high-risk group in the time of the pandemic. The situation pushes them to start using applications which they have never used before. The same situation is created in communication with authorities—in many cases the use of applications is the only way to receive a governmental service (for example, to submit a tax declaration or to receive a vaccination QR code). Businesses which use the applications gained a lot in the beginning of pandemic, and many of them continue surviving only due to the applications available for their customers.
Therefore, the usage of various web applications in general and especially in the time of the pandemic requires the inclusion of all parts of a population in this process. Therefore, it is especially important for the implementation of smart cities to study carefully the willingness and ability of people to use communication technologies in everyday life on a permanent basis.
Many researchers consider the necessity to investigate and comprehend the roots of the behavior of citizens in smart cities. For example, [6] considers the participation of citizens via the model CItiVoice Framework. The scholars in [45] created a model for determining the “complex perspective of the awareness and ability of citizens to use smart city services”, which answered the questions about perceived value, security level, sustainability and reliability of services within a smart city. They also created a matrix of clusters of value-adding services, based on knowledge flows and dependence on time and space, which is very important for creating the foundation for successful the implementation of the smart city concept. This study was continued by research [16] presenting the model, which considers such areas as technology anxiety, work–life interface, engagement orientation, support orientation, quality of life for considering the opinions of residents and their perception of smart city services. This research is important both for science and for its practical use in various fields.
The goal of this research is to study the acceptance of communication technologies and web applications by population. There are several studies investigating similar issues, for example, the studies [46,47,48,49,50,51]. These studies considered the engagement of city inhabitants, the transformation of the city due to increased satisfaction of the population, the adoption of the e-governmental services within the city and acceptance of information systems, the factors determining this acceptance, trust in the government and the decision of people to use the smart e-governmental services.
However, the presented research is different from the above-discussed ones. It demonstrates the attitudes which people demonstrate towards the usage of applications in their everyday operations.
There are numerous models for investigating the acceptance of technologies, for example, the predictive models “Theory of Reasoned Action” (TRA), “Theory of Planned Behavior” (TPB), “Social Cognitive Theory” (SCT) and “Extended Technology Acceptance Model” (TAM2). However, these theories have serious limitations, and it is impossible to describe multi-aspects of individuals’ acceptance of technologies. The Unified Theory of Acceptance and Use of Technology (UTAUT) is an attempt to create a unified model, integrating various theories [52,53]; due to this fact, this model is one of the most comprehensive theories [54]. The model, the Unified Theory of Acceptance and Use of Technology (UTAUT), is oriented on determining the intention of citizens to use technology and on manifesting the links between Performance Expectancy, Effort Expectancy, Social Influence, Facilitating Conditions, Behavioral Intention to use the system and usage behavior. The theory is widely applied, and there are numerous extensions of this theory allowing the introduction of new variables [55]. The detailed description of the constructs used by the authors in this study is presented in the Section 3 titled Setting the Research Hypotheses
3. Setting the Research Hypotheses
The four classical constructs of the UTAUT model are Performance Expectancy, Effort Expectancy, Social Influence and Facilitating Conditions. They, in turn, determine the intention to use technologies (Behavioral Intention) and the usage of these technologies (Use Behavior).
According to [53], Performance Expectancy is “the degree to which an individual believes that using the system will help him or her to attain gains in job performance”. According to many researchers, this construct has a positive relationship with Behavioral Intention. It allowed the authors to put forward the following hypotheses:
H1(a,b).
(a) The intention of residents to use digital applications and (b) the use of applications in everyday life is positively affected by Performance Expectation.
According to [53], Effort Expectancy is “the degree of ease associated with the use of the system”. Much research of various digital spheres confirms that Effort Expectancy has a positive relationship with Behavioral Intention. It allowed us to put forward the following hypotheses:
H1(c,d).
(c) The intention of residents to use and (d) the use of digital applications in everyday life is positively affected by Effort Expectation.
The next construct—Social Influence—is “the degree to which an individual perceives that “important others” believe that he or she should use the new system” [53]. Many researchers have confirmed the relationship of this construct with Behavioral Intention, and this fact allowed us to propose the following hypotheses:
H1(e,f).
(e) The intention of residents to use and (f) the use of digital applications in everyday life is positively affected by Social Influence.
The fourth basic construct—Facilitating Conditions—is “the degree to which an individual believes that an organizational and technical infrastructure exists to support the use of the system” [53]. Many researchers have stated the relationship of this construct with Behavioral Intention, and we propose the following hypotheses:
H1(g,h).
(g) The intention of residents to use and (h) the use of digital applications in everyday life is positively affected by Facilitating Conditions.
In practice, not only the intention to use technologies (Behavioral Intention) is important, but also their actual use (Use Behavior). This condition resulted in the formulation of the following hypothesis:
H1(m).
The use of applications by residents is positively influenced by the intention to use them.
Many existing models consider Attitude towards the use of Applications (ATA) and Anxiety (Anx) as core constructs (TRA, TPB, SCT); nevertheless, the UTAUT model does not include these variables as direct determinants. They are supposed by the model to be indirect determinants, and they are fully determined by ease of use [53].
However, the authors have extended the model with these additional variables as core constructs.
We suppose that they have special importance for Riga (Latvia). Riga is in the world and European lists of smart cities (96th and 34th positions, respectively) [56,57]; it has a high rate of technologies implemented in different areas. Like other CEE (Central and Eastern European) countries, Latvia demonstrates a high rate of technological infrastructure, based on state-of-the-art technologies [58]. Nevertheless, many people still demonstrate anxiety when they are pushed to use the technologies. This contradiction can be explained by the fact that Latvia, as with all CEE countries, started to adopt technologies significantly later compared to other European countries; a great part of the population have comparatively low incomes, which also creates a barrier to possessing contemporary devices and, as a result, a low understanding of the span of use of modern technologies. This is especially true about older people.
The authors of the study shift the emphasis from technologies to applications. Therefore, they used the Attitude towards the use of Applications construct, which is determined by the subjective perception of the impact of applications on life and people’s desire to master new applications.
The fears of people to make mistakes in the process of using technologies avert people from using them. In general, the higher the risk of mistake, the lower the wish to use it [58], and this is especially important for CEE countries. Therefore, the authors assume that these controversial facts allow them to introduce these variables as core constructs.
We can determine the Attitude towards the use of Applications as evaluated by the degree of impact of an individual’s feeling on the use of technologies in everyday operations. In turn, the Anxiety construct shows the degree to which personal fears and negative emotions affect the intention to use the technologies. These two variables allow us to formulate the following hypotheses:
H1(i,j).
(i) The intention of residents to use and (j) the use of digital applications in everyday life is positively affected by Attitude towards the use of Applications.
H1(k,l).
(k) The intention of residents to use and (l) the use of digital applications in everyday life is negatively affected by Anxiety (Anx).
Then, since the goal of the research is to study the acceptance of information technologies by people for everyday operations in smart cities, it is important to deter-mine the moderators for the model. First of all, the moderators are Age and Gender, which many authors consider as moderators. Moreover, the level of education can also be assumed as a moderator for the model, since we assume that people with a higher education are more flexible in general in adopting new things in their lives, including technologies. Therefore, we put forward the following hypotheses:
H2(a,b,c,d,e,f).
Age is the moderator of the relationship between Behavioral Intention and with other UTAUT model elements: (a) PE, (b) EE, (c) SI, (d) FC, (e) Anx, (f) ATA.
H2(g,h,i,j,k,l).
The level of education is the moderator of the relationship between Behavioral Intention and other elements of the UTAUT model: (g) PE, (h) EE, (i) SI, (j) FC, (k) ATA, (l) Anx.
H2(m,n,o,p,q,r).
Gender is the moderator of the relationship between Behavioral Intention and other elements of the OUTPUT model: (m) PE, (n) EE, (o) SI, (p) FC, (q) Anx, (r) ATA.
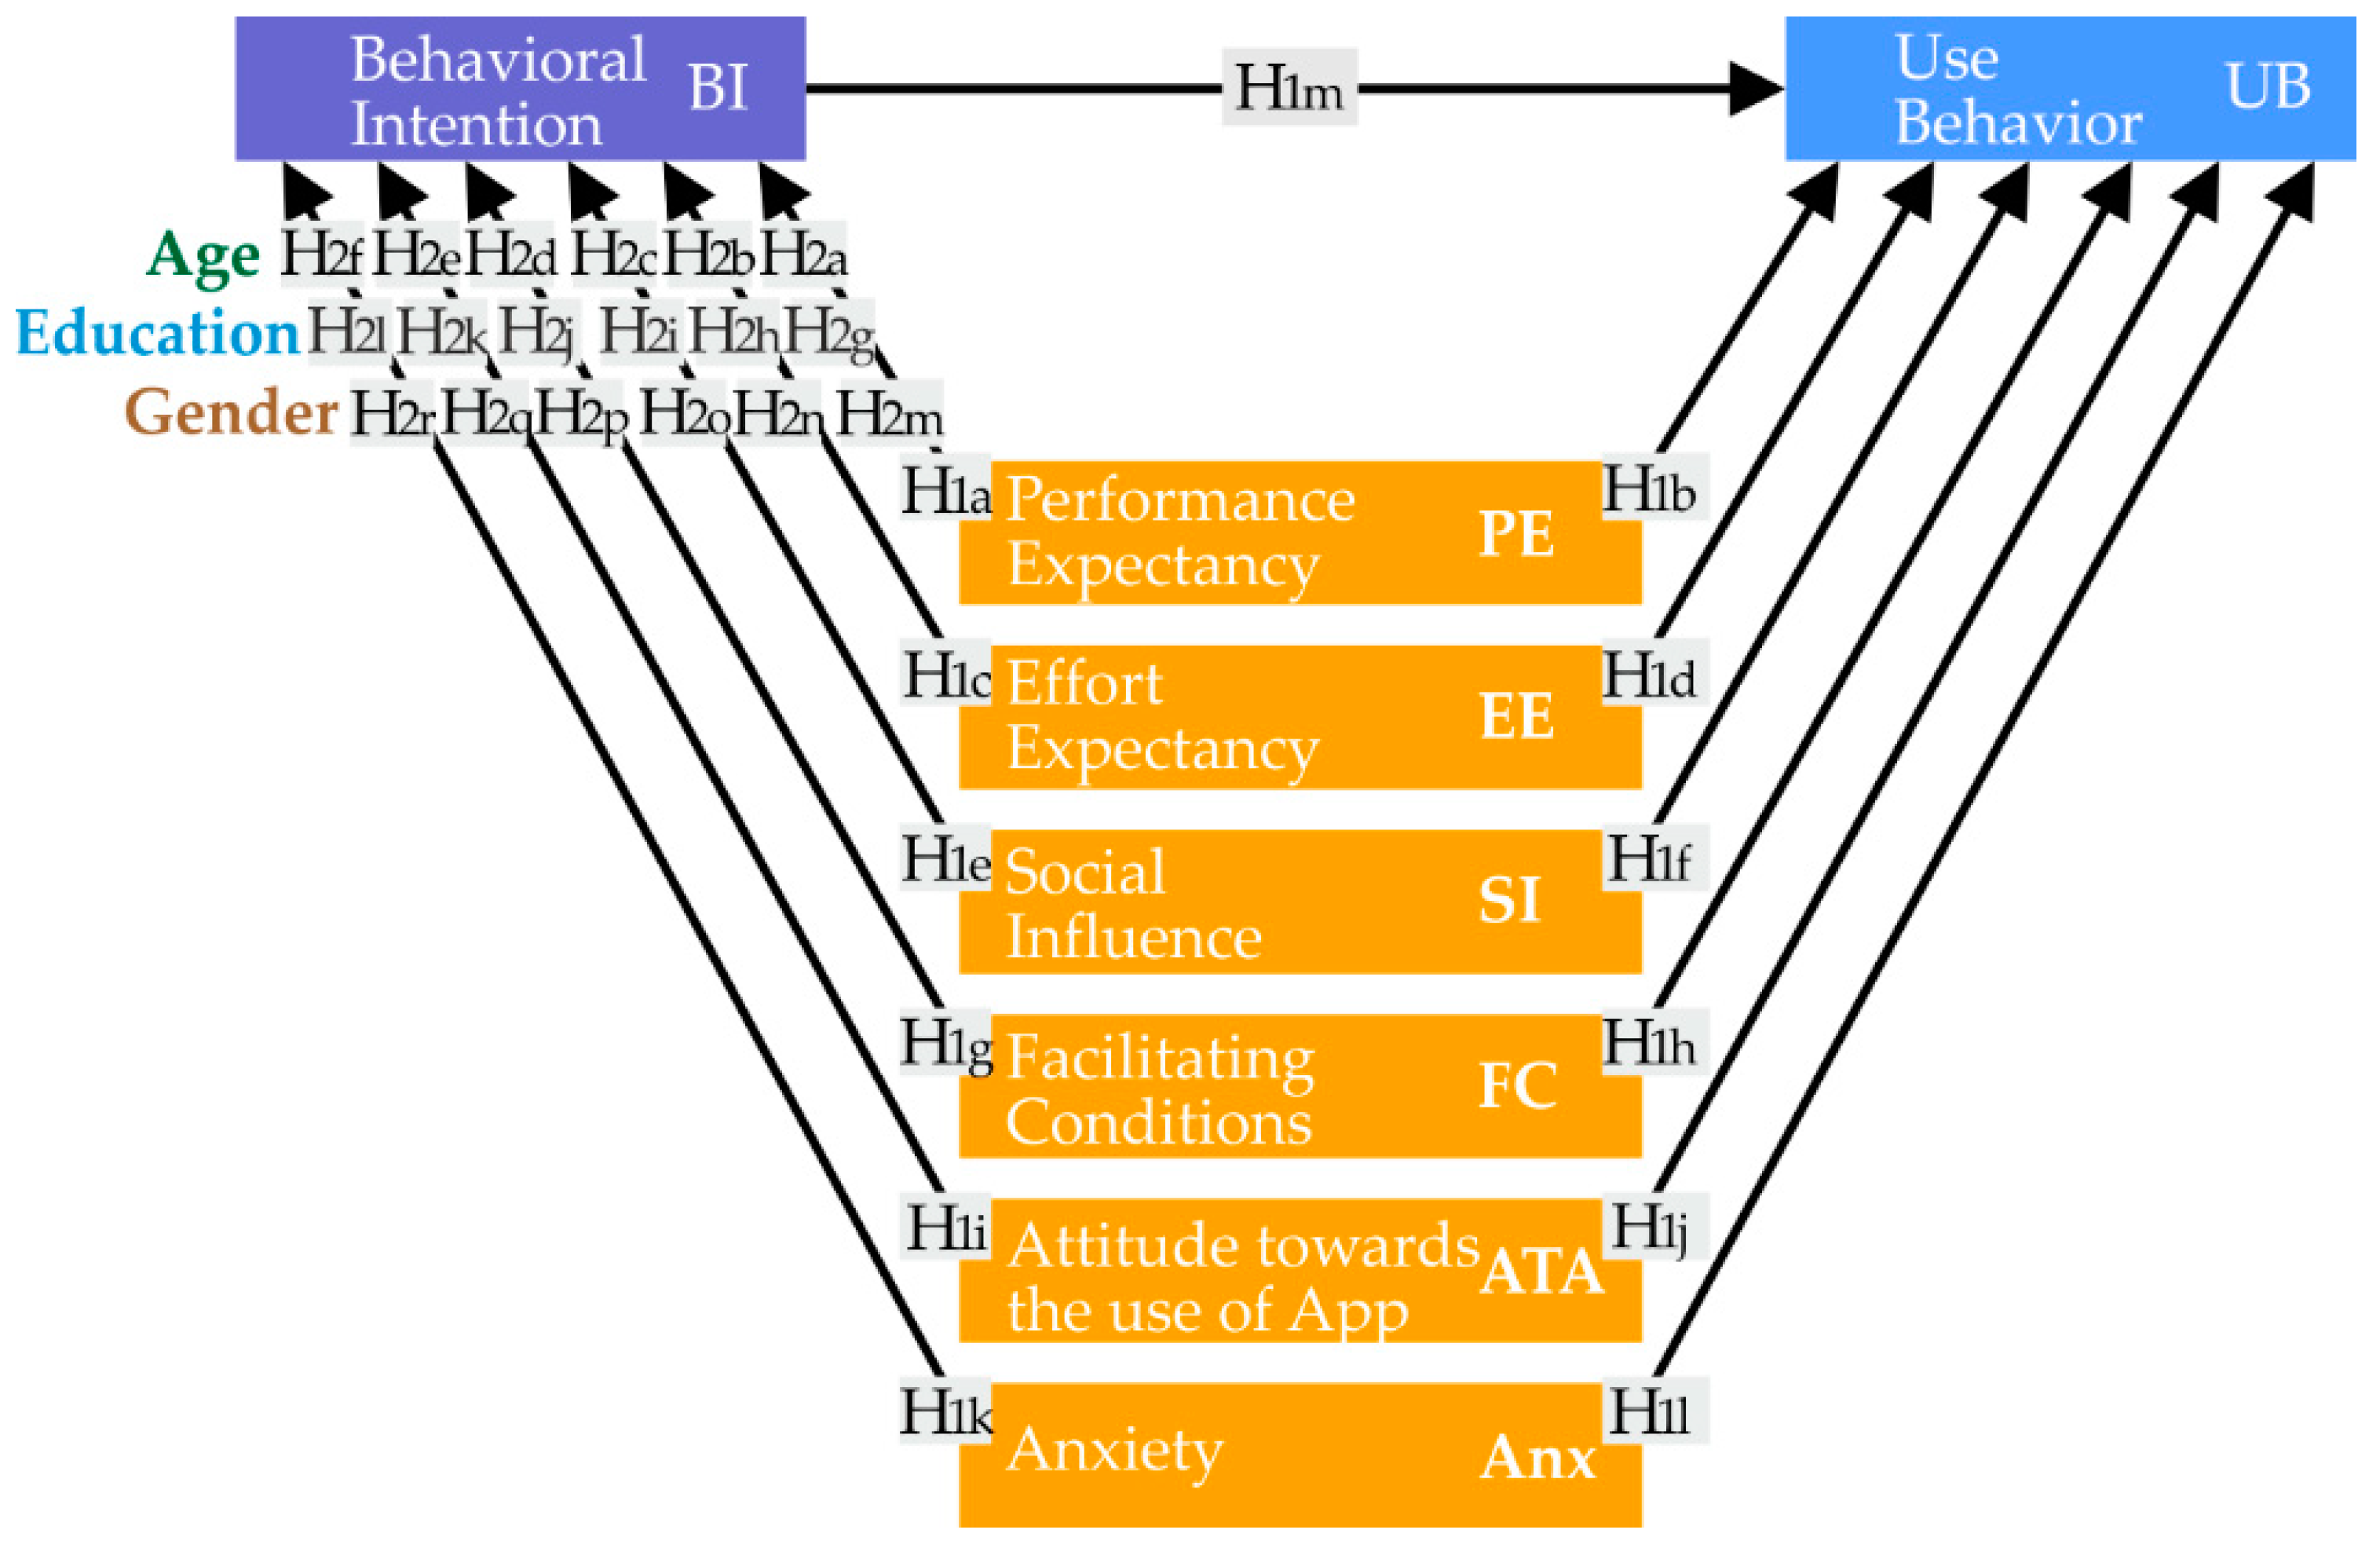
These hypotheses were set within the frameworks of the proposed research conceptual model (see Figure 1).
As it is demonstrated in Figure 1, all the hypotheses refer to the Behavioral Intention or Use Behavior, considering the constructs of Performance Expectancy (PE), Effort Expectancy (EE), Social Influence (SE), Facilitating Conditions (FC), Attitude towards the use of Apps (ATA) and Anxiety (Anx). The model also includes the components of Age, Education and Gender.
4. Materials and Methods
4.1. Model
In our study, we used the UTAUT model and partial least squares structural equation modeling (PLS-SEM). PLS-SEM is widely used as a method for estimating the path models with latent variables and their relationships. A common goal of PLS-SEM analysis is to identify the key factors for target constructs; in the UTAUT model they are Behavioral Intention and Use Behavior.
Performance Expectation (PE), Effort Expectation (EE), Social Influence (SI), Facilitating Conditions (FC), Behavioral Intention BI), Use Behavior (UB), Attitude to-wards the use of Applications (ATA) and Anxiety (Anx) were used as the UTAUT con-structs. Age, Gender and Education were considered as moderators.
4.2. Data Collection
The data were obtained via surveying the population of the city. The respondents—citizens of Riga—were invited to participate in the survey via social media and personal contacts of the researchers by a snowball method. As a result, 437 respondents took part in this research—253 (57.89%) female and 184 (42.11%) male persons. In total, 176 (38.99%) of them have a secondary education or secondary vocational education (group 1), 56 (12.53%) are in the age group below 35, 70 (15.66%) in the age group 35–55, and 50 (11.19%) respondents are in the age group 55+. A total of 271 (61.01%) participants have a higher education (group 2), and 68 (15.21%) are in the age group under 35, 104 (23.27%) are in the age group of 35–55, and 99 (22.15%) are in the age group 55+ (see Table 1).
The questionnaire used within the research consisted of two parts: personal in-formation (age, gender, education) and the questions related to the researched spheres—expected efficiency of using technologies, the efforts needed to use the technologies, general attitude to using technology, social impact on the person regarding the use of technologies, factors facilitating the usage of technologies, self-efficiency and anxiety about using technologies (see Table 2).
The questionnaire was pre-tested on a sample of 15 participants of different ages and education, and on the basis of this test the questionnaire content was improved and clarified [61].
The questions were both closed and open-ended. We used a 5-point Likert type scales: (1) Strongly disagree; (2) Disagree; (3) Neither agree nor disagree; (4) Agree; (5) Strongly agree [62]. The total score of the scales evaluating the elements of the model was obtained by summing up the answers to the relevant questions [63].
To support or reject the set hypotheses, the study involves the analysis of 36 relationships. According to the “ten times rule” [64], which is a rough but simple method for determining the sample size, to be representative this research requires 310 valid surveys, which is less than the sample obtained.
The internal consistency of the questionnaire scales was estimated with Cronbach’s Alpha employment [65], calculated by Statistica 8.0. StatSoft. Inc. software. The received values were as follows: reliable for the scale of Effort Expectation (3 questions; α = 0.85) and high for the scales of Performance Expectation (3 questions; α = 0.75), Attitude towards the use of Applications (5 questions; α = 0.77), Social Influence (4 questions; α = 0.73), Facilitating Conditions (6 questions; α = 0.75), Behavioral Intention (3 questions; α = 0.83), Use Behavior (2 questions; α = 0.79) and Anxiety (4 questions; α = 0.72).
4.3. Software and Statistical Analysis
Statistical data were processed using the software MS Excel 2010 and Statistica 8.0. StatSoft. Inc.
The calculations for the Partial Least Square Structural Equation Modeling (PLS-SEM) for the UTAUT model were done using the software 3.3.3. Smart PLS.
The threshold level of statistical significance α was taken at the value of the criterion p < 0.05.
4.4. Limitation of the Research
1. The research considers the respondents from one city only—Riga (Latvia). Riga demonstrates good indicators of “smartness” [56,57]. Nevertheless, it is a limitation of the research.
2. The second limitation of the research is the set of indicators of the constructs. The model is constructed considering the special focus of the authors; however, the changes in the set of indicators can change the obtained results.
3. The authors used the measurements of factors by example condition. We assume this approach is reasonable, although the conditions used in the study are general.
In the study, the respondents were asked to give a general assessment of all the applications used for domestic issues. This was a risky step, as it is difficult for a person to give generalized estimates for heterogeneous objects. Two approaches were used to reduce the error that could be due to this problem: (1) Before offering the questionnaire to the main group, the preliminary survey was carried out with 15 people to find out what kind of difficulties the respondents might have. Only one person ex-pressed a negative attitude towards the suggestion of a generalized evaluation. In agreement with this person, an explanation of the survey was developed and placed in the questionnaire. (2) All the questions in the questionnaire had the option “Difficult to answer”; moreover, all questions were semi-closed, and each respondent could write his/her attitude towards the question. As a result, the open-answer field was not used by any respondent. Only 2.96% (n = 13) of the questions with a general evaluation of the applications were “Difficult to answer”, while the other questions, such as “When using an internet application, in some cases it scares me that I might lose a lot of information by pressing the wrong key”, were answered by 7.78% (n = 34).
5. Results
The partial least squares (PLS) regression is the most used method for structural equation modeling (SEM). Using this method, the validity and reliability of the measurements are evaluated at the first stage, and the structural model is interpreted at the second stage [66].
5.1. Evaluation of the Model Measurements
First of all, indicators with factor loadings of less than 0.60 were removed. As a result, three latent variables, PE, SI and FC, use fewer indicators (see Table 2). This procedure allowed the authors to detect and to remove the insignificant questions from the questionnaire.
The reliability and validity of the construct variables were estimated with the employment of Composite Reliability (CR) and Average Variance Extracted (AVE) (see Table 3). All CR values were above the recommended level of 0.700 and AVE 0.500, which confirms the convergent validity. The value of each indicator’s Variation Inflation Factor (VIF), which assesses multicollinearity, was <5.0 [67]. The discriminant validity was evaluated using cross-loadings and the Heterotrait-Monotrait Method (HTMT). All factor loadings exceeded their cross-loadings, and the HTMT was less than 0.85, which is a sign of discriminant reliability [67].
In general, the obtained results showed sufficient validity and reliability of measurements. This fact allows for further analysis of the acceptance of technologies with the application of the UTAUT model for testing the set hypotheses.
5.2. Hypothesis Testing
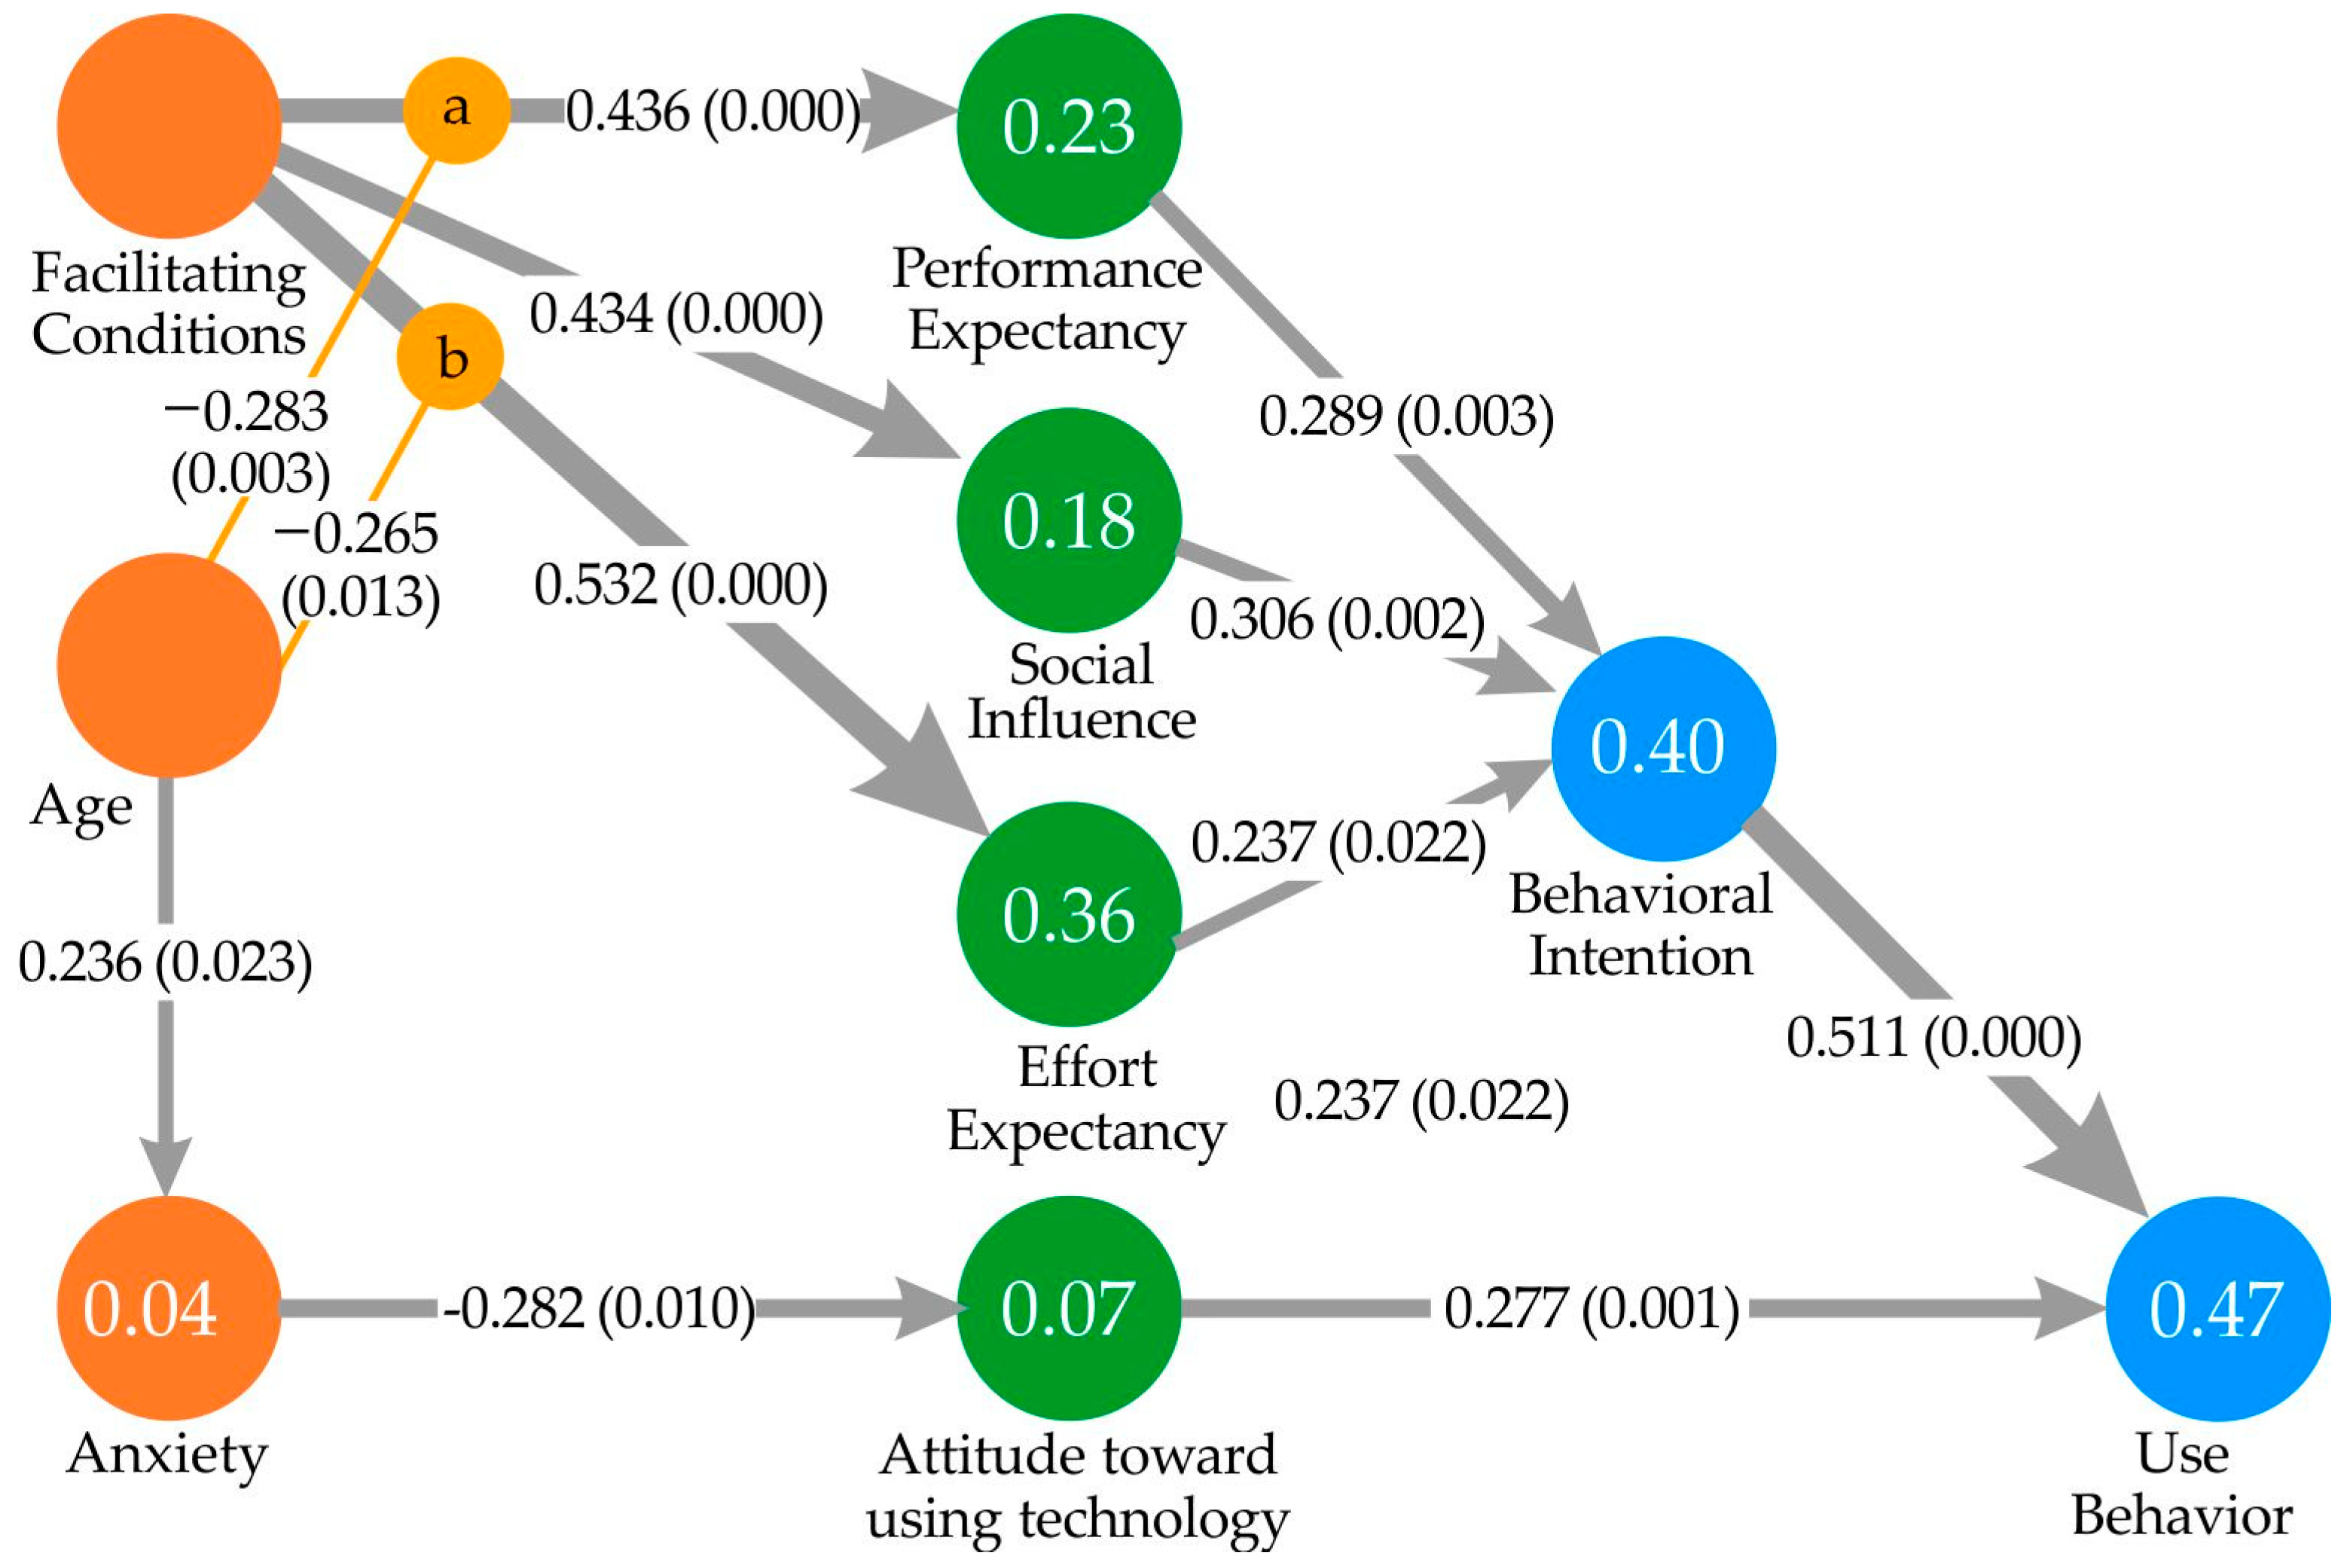
To test the hypotheses, the relationships between elements were investigated using path coefficients (see Figure 2) and R-squared (see Table 3) as the predictive power of the model [59]. To check the statistical significance of path coefficient relationships, the Student’s t-test was used, corresponding to p-value and Confidence Intervals (see Figure 1).
The resulting model explains 39.6% of variance (adjusted R2) in the intention to use the applications and 46.7% of variance in application usage.
Data analysis confirmed only 7 of the 31 hypotheses which were put forward in this study (Table 1, Table 2 and Table 4, Figure 1); it can also be assumed that 2 hypotheses are confirmed only partially:
- H1(a): the intention of residents to use apps in everyday life is positively affected by Performance Expectancy, where β = 0.289, p = 0.003.
- H1(c): the intention of residents to use apps in everyday life is positively affected by Effort Expectancy, where β = 0.237, p = 0.022.
- H1(e): the intention of residents to use apps in everyday life is positively affected by Social Influence, where β = 0.306, p = 0.002.
- H1(g): partially confirmed: the Facilitating Conditions construct did not have a direct effect on BI but had an indirect effect on BI via PE, SI and EE. This was expressed in Total Indirect Effects of FC on BI, where β = 0.385, p = 0.000.
- H1(l): The use of apps by residents is positively influenced by Attitude towards the use of App, where β = 0.277, p = 0.001.
- H1(j): partially confirmed: the Anxiety construct did not have a direct effect on UB but had an indirect effect on UB via ATA. This was expressed in a slight negative Total Indirect Effects of Anxiety on UB, β = −0.078, p = 0.040.
- H1(m): The use of apps by residents is positively influenced by the intention to use them, where β = 0.511, p = 0.000.
- H2(d): there noted the negative influence of Age on the relationships of Facilitating Conditions and Performance Expectancy (β = −0.283, p = 0.003).
- H2(b): there also revealed the negative influence of Age on the relationships of Facilitating Conditions and Effort Expectancy (β = −0.265, p = 0.013).
The above-described situation with hypotheses confirmation should be supplemented with the following results:
- 10.
- The constructs Anxiety and Facilitating Conditions had only an indirect effect on the intention to use apps (Figure 1).
- 11.
- The construct Anxiety has a negative relation with ATA (β = −0.282, p = 0.010).
- 12.
- Facilitating Conditions have shown a strong direct positive effect on the constructs EE (β = 0.532, p = 0.000), PE (β = 0.436, p = 0.000) and SI (β = 0.434, p = 0.000).
6. Discussion
A smart city puts forward certain requirements for its successful implementation at all levels of city structure. Considering the fact that a smart city presupposes the implementation of all functions of the city via technology employment, one of the most important issues is the readiness of citizens of the city to use these technologies. Therefore, determining whether people are ready to use the technologies for everyday operations in a smart city is very important for the implementation of the concept of smart cities.
Many authors write about the necessity of technology usage by people. Technologies are under examination by researchers in technical areas and also in social ones. According to [68], many researchers assume that the intensive use of information and communication technologies is the principal factor for forming smart cities and achieving success. Nevertheless, smart cities are not only about technologies, but also people and governance [69]. Therefore, to turn these technologies from pure technical solutions into really smart solutions used to change the urban environment, cities should be people-centric and facilitate the inclusion of people in active life within a smart technological environment [70]. It is of high importance nowadays, when the concept of a smart city is implemented in the urban environment, changing the life of people, businesses, governance processes, etc. Technologies can significantly change the values of society and influence human behavior [71]. The term “smart” is used in relation to governance, communities, social learning [72], environmental sustainability, knowledge and creativity.
In general, the contemporary usage of the word “smart” presupposes something user-friendly and that makes life easier. According to [73], the real smartness is not in using numerous technologies; they should not be “electronic toys”, rather the smart city should concentrate on using them for taking care of all dimensions of the smart city. The technologies should be used to “shorten the distance between individual citizens and between citizens and administration”. Moreover, technologies must be oriented on creating social capital [74]. The authorities and public agencies use technologies believing that these technologies can help them achieve sound success in communication with the population [75]. It seems that technologies could be “smart” in these areas only if they are intensively used by people, and if people do not feel any inconvenience in utilizing them. In other cases, technologies, being “intelligent” in their essence, cannot be referred to as “smart” ones. Therefore, it is very important to understand what drivers can be used to make technologies more attractive to a population.
The electronic services for solving everyday tasks have become an integral part of social life, and electronic governance has become an obligatory function of local and state organizations.
In the process of the development of a smart city, an increasing expansion in the introduction of e-services is expected due to a closer integration with the residents [46]. Since citizens are users of e-services, it is vital that their ideas and views are taken into account when developing and managing such services.
The goal of the research is to study the factors influencing the intention and the use of web applications in smart cities.
In our study, we used the UTAUT model и partial least squares structural equation modeling (PLS-SEM), which is widely used as a method for estimating the path models with latent variables and their relationships.
The UTAUT theory [53] is used by many scholars in their research on the use of e-services, including e-government [76]; it is widely used to study the adoption of various information systems [77].
This model has different interpretations, which include from 4 to 7 or more determinants, such as Expected Performance (PE), Expected Efficiency (EE), Social Influence (SI), Facilitating Conditions (FC), Hedonic Motivation (HM), Price Value (PV) and Habit (HB); the last three are introduced to account for Consumer Behavior.
Venkatesh et al., in their basic UTAUT model, considered such regulatory variables as gender, age, experience and voluntariness (Venkatesh et al., 2003). Some studies prove gender differences in the use of electronic services. For example, with regard to e-payment systems, mobility and reputation have a more significant impact on the trust of male people, while setup and security have a stronger impact on the trust of females [78]. At the same time, the influence of gender on the relationship with ICT can be ambiguous; in some cases, the best results regarding the use of ICT are observed for male persons, in others, for female [79,80]. Other studies have shown that there are no gender differences in the use of information and communication technology (ICT) [81].
Our study has not identified any gender differences within the framework of the studied model. This result might be a special case and might not be repeated when conducting research on other samples. At the same time, such a result may be a specific feature of the population of Riga; however, such a conclusion requires further verification.
Demographic trends of recent years in developed countries show a rapid growth in the number of aging people. This fact requires careful attention to maintaining the quality of life of elderly people, in particular, to prevent the segregation of society by age when using e-services to solve everyday issues. Despite the fact that elderly people are becoming more and more literate in digital technologies [82,83,84], the age gap still has a significant impact on the use of e-services [84] and can lead to digital inequality [85].
To discuss the results obtained in the course of our research, the influence of the age of respondents is quite explainable. On the one hand, age showed a significant positive relationship with the level of Anxiety. In this study, the level of Anxiety in general was determined by uncertainty and fears when using the App in everyday life. Thus, our results show that the gap in the use of information technology and digital inequality can grow with age. Consequently, state bodies need to take measures on an ongoing basis to increase the digital literacy of the population in a timely manner. The experience of Australia can serve as a benchmark, since it shows a significant progress in this matter [83].
On the other hand, age served as a moderating factor, having a negative impact on the relationship between Facilitating Conditions and Performance Expectation and Effort Expectation. In other words, age decreases the influence of the availability of technical devices and the subjective level of knowledge on Performance Expectation and Effort Expectation. Performance Expectation is determined by a positive attitude towards using an App to solve everyday tasks. Therefore, it could be assumed that, at a more mature age, the availability of devices for digital communications does not necessarily contribute to the active use of e-services. This assumption is confirmed by the non-statistical observation that many elderly people aged 70+ use the internet and messengers actively, but do not use the internet applications of state, municipal and other services. Therefore, it will be relevant to recommend to developers of e-services that they consider the necessity of paying more attention to reducing the difficulties associated with the use and research of digital applications, so that their use and adoption is more effective at any age [76].
We also consider the principal constructs of the model. The construct Facilitating Conditions relates to technical devices, special knowledge and the possibility to receive help in the process of using the applications. According to the presented research, the Facilitating Conditions construct did not have a direct effect on Behavioral Intention; it affects BI indirectly via PE, SI and EE.
The authors of [81,86,87] confirm that people who have devices, have a more positive attitude towards technologies. The authors of [88,89] develop the same idea about smartphones and tablets as devices accessible for people. The authors of [90] discuss the accessibility of the internet as a condition of the possible attitude towards technology use. It partially contradicts the obtained results. It can possibly be explained by the fact that nowadays almost all people in Latvia have access to devices, and about 97% of the population of Latvia have access to the internet; these factors, which were very important in the previous years, have lost their actuality for the contemporary situation.
Another element of Facilitating Conditions is knowledge and skills competences. The authors of [89,91] have detected the negative impact of computer usage frequency and prior computer skills on attitudes towards using the technologies, while [92,93,94,95] suppose that they have a positive influence. According to [89], digital literacy and the frequency of the use of computer devices significantly affect the attitude towards the use of ICT.
If we consider these factors as direct predictors of people’s attitudes towards technologies, the results of this study differ; however, if we consider that competences and skills in the computer field make interaction with applications easier and make communication efficient without any special effort, this interpretation is supported by the obtained results, since FC indirectly affects the intention to use the applications via PE (expected productivity and efficiency) and EE (easy interaction without special learning).
One of the confirmed hypotheses—Performance Expectancy (PE) influences the intention to use technology—is also supported by other scholars, for example, [96]. According to this study, students have a positive attitude towards ICT if they see that these technologies can provide them with true and reliable information, for example.
The Social Influence is also very important for the attitudes to the use of technologies. For instance, [97] assumes that socio economic status can have an impact on attitude; people of lower classes perceive technologies as challenging ones, and belief in themselves and surrounding people can support them in using the technologies. The authors of [59] discuss the importance of the opinion of “important people” regarding participation in any activities, the pressure to be involved in activities as a subjective norm existing in society, and the dominance of the opinion of “peers and superiors”. The authors of [98] also point out that social factors have a special effect on people living in isolation.
7. Conclusions
The research considers the attitudes of people towards using web applications for everyday operations in a smart city. Therefore, the concept of a smart city and people as the main component of it were considered.
The authors analyzed the existing models used for the description of the attitudes of a population towards technologies; we made a decision to use the Unified Theory of Acceptance and Use of Technology (UTAUT). There were 31 hypotheses set, and only 7 of them were confirmed; 2 hypotheses were confirmed only partially. The intention of residents to use apps in everyday life is positively affected by Performance Expectancy, Effort Expectancy, Social Influence and Attitude towards the use of Apps. The use of apps by residents is positively influenced by the intention to use them. Age has a negative influence on the relationships of Facilitating Conditions and Performance Expectancy and on the relationships of Facilitating Conditions and Effort Expectancy. We consider the absence of a direct impact but existence of an indirect effect as partially supported hypotheses. The Facilitating Conditions construct has an indirect effect on BI via PE, SI and EE. The Anxiety (Anx) construct has an indirect effect on UB via ATA. We also obtained the following results: the constructs Anxiety (Anx) and Facilitating Conditions (FC) had only an indirect effect on the intention to use Apps; the construct Anxiety (Anx) has a negative relation with ATA; Facilitating Conditions have shown a strong direct positive effect on the construct EE.
The authors believe that the findings of this research will allow the authorities of Riga (Latvia) to facilitate all the processes of the smart city concept implementation via increased involvement of the population in using the applications in all spheres of everyday life. It becomes especially important in times of pandemic, when people who do not use applications find themselves excluded from the life of the city.
The research has scientific novelty since it uses the UTAUT model not to investigate specific technology, but the general attitude of a population towards the technologies/applications. This fact allows the employment of the model to be expanded to study a bigger number of cases.
However, the main value of this research is in its practical use. It can be implemented by the local authorities for the better involvement of the population into all processes within a smart city.
Author Contributions
Conceptualization, Y.P. and D.Z.; data curation, Y.P. and D.Z.; formal analysis, Y.P. and D.Z.; methodology, Y.P. and D.Z.; writing—original draft, Y.P.; writing—review and editing, Y.P. All authors have read and agreed to the published version of the manuscript.
Funding
This work was financially supported by the specific support objective activity, Project id. N. 1.1.1.2/16/I/001) of the Republic of Latvia, funded by the European Regional Development Fund. Research project No. 1.1.1.2/VIAA/3/19/458 Development of Model of Smart Economy in Smart City.
Institutional Review Board Statement
Not applicable.
Informed Consent Statement
Not applicable.
Data Availability Statement
Data available on request.
Conflicts of Interest
The authors declare no conflict of interest.
References
- Kumar, T.V.; Dahiya, B. Smart economy in smart cities. In Smart Economy in Smart Cities; Springer: Singapore, 2017; pp. 3–76. [Google Scholar]
- De Jong, M.; Joss, S.; Schraven, D.; Zhan, C.; Weijnen, M. Sustainable–smart–resilient–low carbon–eco–knowledge cities; making sense of a multitude of concepts promoting sustainable urbanization. J. Clean. Prod. 2015, 109, 25–38. [Google Scholar] [CrossRef] [Green Version]
- Voordijk, H.; Dorrestijn, S. Smart city technologies and figures of technical mediation. Urban Res. Pract. 2021, 14, 1–26. [Google Scholar] [CrossRef]
- Popova, Y. Economic or Financial Substantiation for Smart City Solutions: A Literature Study. Econ. Ann. XXI 2020, 83, 125–133. [Google Scholar] [CrossRef]
- Popova, Y.; Sproge, I. Decision-Making within Smart City: Waste Sorting. Sustainability 2021, 13, 10586. [Google Scholar] [CrossRef]
- Simonofski, A.; Asensio, E.S.; Wautelet, Y. Citizen participation in the design of smart cities: Methods and management framework. In Smart Cities: Issues and Challenges; Elsevier: Amsterdam, The Netherlands, 2019; pp. 47–62. [Google Scholar]
- Caragliu, A.; Del Bo, C.; Nijkamp, P. Smart Cities in Europe. J. Urban Technol. 2011, 18, 65–82. [Google Scholar] [CrossRef]
- Li, D.; Zhao, L.; Ma, S.; Shao, S.; Zhang, L. What influences an individual’s pro-environmental behavior? A literature review. Resour. Conserv. Recycl. 2019, 146, 28–34. [Google Scholar] [CrossRef]
- Etezadzadeh, C. Smart City–Future City: Smart City 2.0 as a Livable City and Future Market; Springer: Berlin/Heidelberg, Germany, 2016. [Google Scholar] [CrossRef]
- European Commission. What are Smart Cities? Cities and Urban Development, Smart Cities: 2014. Available online: https://ec.europa.eu/info/eu-regional-and-urban-development/topics/cities-and-urban-development/city-initiatives/smart-cities_en (accessed on 14 October 2021).
- Sriyabhand, T.; John, S.P. An empirical study about the role of personality traits in information technology adoption. Humanit. Arts Soc. Sci. 2014, 14, 67–90. [Google Scholar]
- Zagulova, D.; Prokofyeva, N.; Ziborova, V.; Špakova, A. Perception of forced distance learning by its students: The influence of gender and Jungian personality types. In Proceedings of the Society Integration Education International Scientific Conference, Rezekne, Latvia, 27–28 May 2021; Volume 5, pp. 268–279. [Google Scholar]
- Nam, T.; Pardo, T.A. Conceptualizing Smart City with Dimensions of Technology, People, and Institutions. In Proceedings of the 12th Annual International Digital Government Research Conference on Digital Government Innovation in Challenging Times, College Park, MD, USA, 12–15 June 2011; p. 282. [Google Scholar] [CrossRef]
- Thomas, V.; Wang, D.; Mullagh, L.; Dunn, N. Where’s Wally? In search of citizen perspectives on the smart city. Sustainability 2016, 8, 207. [Google Scholar] [CrossRef] [Green Version]
- Townsend, A. Smart Cities: Big Data, Civic Hackers, and the Quest for a New Utopia; WW Norton & Company: New York, NY, USA, 2013. [Google Scholar]
- Lytras, M.D.; Visvizi, A.; Chopdar, P.K.; Sarirete, A.; Alhalabi, W. Information Management in Smart Cities: Turning end users’ views into multi-item scale development, validation, and policy-making recommendations. Int. J. Inf. Manag. 2021, 56, 102146. [Google Scholar] [CrossRef]
- Karvonen, A.; Cugurullo, F.; Caprotti, F. (Eds.) Inside Smart Cities: Place, Politics and Urban Innovation; Routledge: London, UK, 2018. [Google Scholar]
- OECD. Enhancing the Contribution of Digitalisation to the Smart Cities of the Future; Organization for Economic Co-Operation and Development (OECD): Paris, France, 2019; Available online: http://www.oecd.org/cfe/regional-policy/Smart-Cities-FINAL.pdf (accessed on 11 January 2022).
- Mingaleva, Z.; Vukovic, N.; Volkova, I.; Salimova, T. Waste Management in Green and Smart Cities: A Case Study of Russia. Sustainability 2019, 12, 94. [Google Scholar] [CrossRef] [Green Version]
- Haque, M.N.; Bakshi, A.; Mobin, F. Assessing the Factors of Energy Consumption Behavior in Urban Area. Int. J. Civ. Eng. Sci. Technol. 2021, 12, 124–140. [Google Scholar] [CrossRef]
- Marzouk, O.A.; Mahrous, A.A. Sustainable consumption behavior of energy and water-efficient products in a resource-constrained environment. J. Glob. Mark. 2020, 33, 335–353. [Google Scholar] [CrossRef]
- Ashouri, M.; Fung, B.C.; Haghighat, F.; Yoshino, H. Systematic approach to provide building occupants with feedback to reduce energy consumption. Energy 2020, 194, 116813. [Google Scholar] [CrossRef]
- Trudel, R. Sustainable consumer behavior. Consum. Psychol. Rev. 2019, 2, 85–96. [Google Scholar] [CrossRef]
- Salmon, J.; Hesketh, K.D.; Arundell, L.; Downing, K.L.; Biddle, S.J. Changing Behavior Using Ecological Models. In The Handbook of Behavior Change; Cambridge University Press: Cambridge, UK, 2020; pp. 237–250. [Google Scholar]
- Ahvenniemi, H.; Häkkinen, T. Households’ potential to decrease their environmental impacts: A cost-efficiency analysis of carbon saving measures. Int. J. Energy Sect. Manag. 2020, 14, 193–212. [Google Scholar] [CrossRef]
- Cullen, I.; Phelps, E. Patterns of Behavior and Responses to the Urban Environment. In Public Policy in Temporal Perspective; Michelson, W.M., Ed.; De Gruyter Mouton: The Hague, The Netherlands, 1978; pp. 105–181. [Google Scholar]
- Pali, B.; Schuilenburg, M. Fear and fantasy in the smart city. Crit. Crim. 2020, 28, 775–788. [Google Scholar] [CrossRef]
- Zastrow, C.; Kirst-Ashman, K.K.; Hessenauer, S.L. Understanding Human Behavior and the Social Environment; Empowerment Series; Cengage Learning: Boston, MA, USA, 2019. [Google Scholar]
- Bataev, A.V.; Dedyukhina, N.; Nasrutdinov, M.N. Innovations in the financial sphere: Performance evaluation of introducing service robots with artificial intelligence. In Proceedings of the 2020 9th International Conference on Industrial Technology and Management (ICITM) IEEE, Oxford, UK, 11–13 February 2020; pp. 256–260. [Google Scholar] [CrossRef]
- Tsegaye, S.; Gallagher, K.C.; Missimer, T.M. Coping with future change: Optimal design of flexible water distribution systems. Sustain. Cities Soc. 2020, 61, 102306. [Google Scholar] [CrossRef]
- Turečková, K.; Nevima, J. The cost benefit analysis for the concept of a smart city: How to measure the efficiency of smart solutions? Sustainability 2020, 12, 2663. [Google Scholar] [CrossRef] [Green Version]
- Giffinger, R.; Fertner, C.; Kramar, H.; Kalasek, R.; PichlerMilanoviü, N.; Meijers, E. Smart Cities: Ranking of European Medium-Sized Cities; Centre of Regional Science (SRF), Vienna University of Technology: Vienna, Austria, 2007; Available online: http://www.smartcities.eu/download/smart_cities_final_report.pdf (accessed on 27 December 2021).
- IGI Global. What is Smart Economy; Publisher of Timely Knowledge: Hershey, PA, USA, 2021; Available online: https://0-www-igi--global-com.brum.beds.ac.uk/dictionary/smart-city--smart-citizen--smart-economy/87778 (accessed on 30 October 2021).
- Tyas, W.P.; Nugroho, P.; Sariffuddin, S.; Purba, N.G.; Riswandha, Y.; Sitorus, G.H.I. Applying Smart Economy of Smart Cities in Developing World: Learnt from Indonesia’s Home Based Enterprises. In Proceedings of the IOP Conference Series: Earth and Environmental Science, Bandung, Indonesia, 25–26 October 2019; Volume 248, p. 012078. [Google Scholar] [CrossRef]
- EdSurge. Analysts Watch for Coronavirus Impact on Edtech Stocks. EdSurge. 2020. Available online: https://www.edsurge.com/news/2020-03-05-public-markets-watch-for-coronavirus-impact-on-edtech-stocks (accessed on 20 October 2021).
- Kumar, T.V. E-Governance for Smart Cities; Springer: Singapore, 2015; pp. 1–43. [Google Scholar]
- Williamson, B.; Eynon, R.; Potter, J. Pandemic politics, pedagogies and practices: Digital technologies and distance education during the coronavirus emergency. Learn. Media Technol. 2020, 45, 107–114. [Google Scholar] [CrossRef]
- Talebpour, A.; Mahmassani, H.S. Influence of connected and autonomous vehicles on traffic flow stability and throughput. Transp. Res. Part C Emerg. Technol. 2016, 71, 143–163. [Google Scholar] [CrossRef]
- Vanhoof, M.; Reis, F.; Smoreda, Z.; Ploetz, T. Detecting home locations from CDR data: Introducing spatial uncertainty to the state-of-the-art. arXiv 2018, arXiv:1808.06398. [Google Scholar]
- Lu, N.; Cheng, N.; Zhang, N.; Shen, X.; Mark, J.W. Connected vehicles: Solutions and challenges. IEEE Internet Things J. 2014, 1, 289–299. [Google Scholar] [CrossRef]
- Karami, Z.; Kashef, R. Smart transportation planning: Data, models, and algorithms. J. Transp. Eng. 2020, 2, 100013. [Google Scholar] [CrossRef]
- Batabyal, A.A.; Beladi, H. The optimal provision of information and communication technologies in smart cities. Technol. Forecast. Soc. Chang. 2019, 147, 216–220. [Google Scholar] [CrossRef] [Green Version]
- Anttiroiko, A.V.; Komninos, N. Smart public services: Using smart city and service ontologies in integrative service design. In Setting Foundations for the Creation of Public Value in Smart Cities; Springer: Cham, Switzerland, 2019; pp. 17–47. [Google Scholar]
- Zimmerman, J. Coronavirus and the Great Online-Learning Experiment. The Chronicle of Higher Education. Available online: https://www.chronicle.com/article/Coronavirusthe-Great/248216 (accessed on 30 November 2021).
- Lytras, M.D.; Visvizi, A. Who uses smart city services and what to make of it: Toward interdisciplinary smart cities research. Sustainability 2018, 10, 1998. [Google Scholar] [CrossRef] [Green Version]
- Habib, A.; Alsmadi, D.; Prybutok, V.R. Factors that determine residents’ acceptance of smart city technologies. Behav. Inf. Technol. 2020, 39, 610–623. [Google Scholar] [CrossRef]
- Chong, M.; Habib, A.; Evangelopoulos, N.; Park, H.W. Dynamic capabilities of a smart city: An innovative approach to discovering urban problems and solutions. Gov. Inf. Q. 2018, 35, 682–692. [Google Scholar] [CrossRef]
- Chang, V.; Wang, Y.; Wills, G. Research investigations on the use or non-use of hearing aids in the smart cities. Technol. Forecast. Soc. Chang. 2020, 153, 119231. [Google Scholar] [CrossRef]
- Dwivedi, Y.K.; Rana, N.P.; Jeyaraj, A.; Clement, M.; Williams, M.D. Re-examining the unified theory of acceptance and use of technology (UTAUT): Towards a revised theoretical model. Inf. Syst. Front. 2019, 21, 719–734. [Google Scholar] [CrossRef] [Green Version]
- Almuraqab, N.A.S. M-government adoption factors in the UAE: A partial least squares approach. Int. J. Bus. Inf. Syst. 2017, 11, 404–431. [Google Scholar]
- Almuraqab, N.A.S.; Jasimuddin, S.M. Factors that Influence End Users’ Adoption of Smart Government Services in the UAE: A Conceptual Framework. Electron. J. Inf. Syst. Eval. 2017, 20, 11–23. [Google Scholar]
- Bhatiasevi, V. An extended UTAUT model to explain the adoption of mobile banking. Inf. Dev. 2016, 32, 799–814. [Google Scholar] [CrossRef]
- Venkatesh, V.; Morris, M.G.; Davis, G.B.; Davis, F.D. User acceptance of information technology: Toward a unified view. MIS Q. 2003, 27, 425–478. [Google Scholar] [CrossRef] [Green Version]
- Min, Q.; Ji, S.; Qu, G. Mobile commerce user acceptance study in China: A revised UTAUT model. Tsinghua Sci. Technol. 2008, 13, 257–264. [Google Scholar] [CrossRef]
- Venkatesh, V.; Thong, J.Y.; Xu, X. Unified theory of acceptance and use of technology: A synthesis and the road ahead. J. Assoc. Inf. 2016, 17, 328–376. [Google Scholar] [CrossRef]
- Findexable Limited. The Global Fintech Index. City Rankings Report. Findexable Limited& The Global Fintech Index. 2020. Available online: https://findexable.com/wp-content/uploads/2019/12/Findexable_Global-Fintech-Rankings-2020exSFA.pdf (accessed on 20 September 2021).
- Popova, Y. Economic Basis of Digital Banking Services Produced by FinTech Company in Smart City. J. Tour. Serv. 2021, 23, 86–104. [Google Scholar] [CrossRef]
- Chao, C.M. Factors determining the behavioral intention to use mobile learning: An application and extension of the UTAUT model. Front. Psychol. 2019, 10, 1652. [Google Scholar] [CrossRef] [PubMed] [Green Version]
- Bozan, K.; Parker, K.; Davey, B. A closer look at the social influence construct in the UTAUT Model: An institutional theory-based approach to investigate health IT adoption patterns of the elderly. In Proceedings of the 2016 49th Hawaii International Conference on System Sciences (HICSS), Koloa, HI, USA, 5–8 January 2016; pp. 3105–3114. [Google Scholar]
- Puspitasari, N.; Firdaus, M.B.; Haris, C.A.; Setyadi, H.J. An application of the UTAUT model for analysis of adoption of integrated license service information system. Procedia Comput. Sci. 2019, 161, 57–65. [Google Scholar] [CrossRef]
- Urbach, N.; Ahlemann, F. Structural equation modeling in information systems research using partial least squares. J. Theor. Appl. Inf. Technol. 2010, 11, 5–40. [Google Scholar]
- Chyung, S.Y.; Roberts, K.; Swanson, I.; Hankinson, A. Evidence-based survey design: The use of a midpoint on the Likert scale. Perform. Improv. 2017, 56, 15–23. [Google Scholar] [CrossRef] [Green Version]
- Sullivan, G.M.; Artino Jr, A.R. Analyzing and interpreting data from Likert-type scales. J. Grad. Med. Educ. 2013, 5, 541–542. [Google Scholar] [CrossRef] [PubMed] [Green Version]
- Hair, J.; Hollingsworth, C.L.; Randolph, A.B.; Chong, A.Y.L. An updated and expanded assessment of PLS-SEM in information systems research. Ind. Manag. Data Syst. 2017, 117, 442–458. [Google Scholar] [CrossRef]
- Tavakol, M.; Dennick, R. Making sense of Cronbach’s alpha. Int. J. Med. Educ. 2011, 2, 53. [Google Scholar] [CrossRef] [PubMed]
- Ringle, C.; Da Silva, D.; Becker, J.-M. SmartPLS 3; SmartPLS GmbH: Boenningstedt, Germany, 2015. [Google Scholar]
- Henseler, J.; Ringle, C.M.; Sarstedt, M. A new criterion for assessing discriminant validity in variance-based structural equation modeling. Acad. Mark. Sci. Rev. 2015, 43, 115–135. [Google Scholar] [CrossRef] [Green Version]
- Hollands, R.G. Will the real smart city please stand up? City 2008, 12, 303–320. [Google Scholar] [CrossRef]
- Cowley, R.; Joss, S.; Dayot, Y. The smart city and its publics: Insights from across six UK cities. Urban Res. Pract. 2017, 11, 53–77. [Google Scholar] [CrossRef] [Green Version]
- Cardullo, P.; Kitchin, R. Being a ‘citizen’ in the smart city: Up and down the scaffold of smart citizen participation in Dublin, Ireland. GeoJournal 2019, 84, 1–13. [Google Scholar] [CrossRef]
- Kudina, O.; Verbeek, P.P. Ethics from Within. Sci. Technol. Hum. Values 2018, 44. [Google Scholar] [CrossRef] [Green Version]
- Coe, A.; Paquet, G.; Roy, J. E-Governance and Smart Communities: A Social Learning Challenge; Working Paper 53; Faculty of Administration, University of Ottawa: Ottawa, ON, Canada, 2000. [Google Scholar]
- Leone, A. Smart cities, smart people, smart planning. Plurimondi 2017, 12, 151–168. [Google Scholar]
- Camarda, D. Spatial Intelligence and Planning. From Governance to Multi-Agents; Series of Territory’s Methods; FrancoAngeli: Milan, Italy, 2012. [Google Scholar]
- SmartResults Research Team. Smart Capital Evaluation Guidelines Report: Performance Measurement and Assessment of Smart Capital; University of Ottawa, Center on Governance: Ottawa, ON, Canada, 2003; Available online: http://www.christopherwilson.ca/papers/Guidelines_report_Feb2003.pdf (accessed on 12 December 2021).
- Talukder, M.S.; Shen, L.; Talukder, M.F.H.; Bao, Y. Determinants of user acceptance and use of open government data (OGD): An empirical investigation in Bangladesh. Technol. Soc. 2019, 56, 147–156. [Google Scholar] [CrossRef]
- Gupta, A.; Dogra, N.; George, B. What determines tourist adoption of smartphone apps? J. Hosp. Tour. Technol. 2018, 9, 50–64. [Google Scholar] [CrossRef]
- Shao, Z.; Zhang, L.; Li, X.; Guo, Y. Antecedents of trust and continuance intention in mobile payment platforms: The moderating effect of gender. Electron. Commer. Res. Appl. 2019, 33, 100823. [Google Scholar] [CrossRef]
- Ngo, H.; Eichelberger, A. College students’ attitudes toward ICT use for English learning. Int. J. Educ. Dev. Using ICT (IJEDICT) 2019, 15, 231–244. [Google Scholar]
- Siddiq, F.; Scherer, R. Is there a gender gap? A meta-analysis of the gender differences in students’ ICT literacy. Educ. Res. Rev. 2019, 27, 205–217. [Google Scholar] [CrossRef]
- Shaw, G.; Marlow, N. The role of student learning styles, gender, attitudes and perceptions on information and communication technology assisted learning. Comput. Educ. 1999, 33, 223–234. [Google Scholar] [CrossRef]
- Šimonová, I.; Klímová, B.; Poulová, P.; Pražák, P. The use of ICT devices by older people with a special focus on their type and respondents’ age: A Czech case study. Educ. Gerontol. 2017, 43, 641–649. [Google Scholar] [CrossRef]
- Thomas, J.; Barraket, J.; Parkinson, S.; Wilson, C.; Holcombe-James, I.; Kennedy, J.; Mannell, K.; Brydon, A. Australian Digital Inclusion Index: 2021; RMIT, Swinburne University of Technology, and Telstra: Melbourne, Australia, 2021. [Google Scholar] [CrossRef]
- Álvarez-Dardet, S.M.; Lara, B.L.; Pérez-Padilla, J. Older adults and ICT adoption: Analysis of the use and attitudes toward computers in elderly Spanish people. Comput. Hum. 2020, 110, 106377. [Google Scholar] [CrossRef]
- Wagner, N.; Hassanein, K.; Head, M. Computer use by older adults: A multi-disciplinary review. Comput. Hum. 2010, 26, 870–882. [Google Scholar] [CrossRef]
- Motshegwe, M.M.; Batane, T. Factors influencing instructors’ attitudes toward technology integration. J. Educ. Technol. Dev. Exch. (JETDE) 2015, 8, 1–15. [Google Scholar] [CrossRef] [Green Version]
- Seyal, A.H.; Rahman, M.N.; Rahman, M.M. Determinants of academic use of the internet: A structural equation model. Behav. Inf. Technol. 2002, 21, 71–96. [Google Scholar] [CrossRef]
- Hargittai, E. Survey measures of web-oriented digital literacy. Soc. Sci. Comput. 2005, 23, 371–379. [Google Scholar] [CrossRef] [Green Version]
- Jan, S. Investigating the relationship between students’ digital literacy and their attitude towards using ICT. Int. J. Educ. Technol. 2017, 5, 26–34. [Google Scholar]
- Klomsri, T.; Tedre, M. Poor information literacy skills and practices as barriers to academic performance: A mixed methods study of the University of Dar es Salaam. Ref. User Serv. 2016, 55, 293–305. [Google Scholar] [CrossRef] [Green Version]
- Liaw, S.S.; Huang, H.M. A study of investigating learners’ attitudes toward e-learning. In Proceedings of the 5th International Conference on Distance Learning and Education, Beijing, China, 22–25 May 2011; Volume 12, pp. 28–32. Available online: https://pdfs.semanticscholar.org/798b/880bb4e1a5a2dadcea73f828178bf28cf313.pdf (accessed on 14 November 2021).
- Rhema, A.; Miliszewska, I. Analysis of student attitudes towards e-learning: The case of engineering students in Libya. Issues Inf. Sci. Inf. Technol. (IISIT) 2014, 11, 169–190. Available online: http://iisit.org/Vol11/IISITv11p169-190Rhema0471.pdf (accessed on 13 September 2021). [CrossRef] [Green Version]
- Abdullah, Z.D.; Ziden, A.B.A.; Aman, R.B.C.; Mustafa, K.I. Students’ attitudes towards information technology and the relationship with their academic achievement. Contemp. Educ. Technol. 2015, 6, 338–354. [Google Scholar] [CrossRef]
- Hussain, I. A study of student’s attitude towards virtual education in Pakistan. Turk. J. Distance Learn. 2007, 8, 69–79. Available online: http://tojde.anadolu.edu.tr/tojde26/pdf/article_6.pdf (accessed on 12 September 2021).
- Nassoura, A.B. Students’ acceptance of mobile learning for higher education in Saudi Arabia. Am. Educ. Res. J. 2012, 4, 24–30. Available online: https://pdfs.semanticscholar.org/37a5/c952e6e0e3d6d7cd5c30cf4307ee06e4ab5c.pdf (accessed on 15 September 2021). [CrossRef]
- Qing, L. Student and teacher views about technology: A tale of two cities? J. Res. Technol. Educ. 2007, 39, 377–397. Available online: http://files.eric.ed.gov/fulltext/EJ768884.pdf (accessed on 2 September 2021).
- Agha, A. A Stakeholder Based Assessment of Developing Country Challenges and Solutions in Smart Mobility within the Smart City Framework: A Case of Lahore; University of Cambridge: Cambridge, UK, 2016. [Google Scholar]
- Nicholson, N.R., Jr. Social isolation in older adults: An evolutionary concept analysis. J. Adv. Nurs. 2008, 65, 1342–1352. [Google Scholar] [CrossRef] [PubMed]
Figure 1.
The proposed research conceptual model. Source: Generated by the authors.

Figure 2.
The Unified Theory of Acceptance and Use of Technology (UTAUT) model. Source: Generated by the authors. N.B.: The adjusted R2 is indicated inside the circles, path coefficients on the arrows and t-statistics in brackets. a,b—modulating impact of Age on relations of Facilitating Conditions and Performance Expectancy (a) and Effort Expectancy (b).


Table 1.
Sample structure: distribution of respondents depending on age, gender and education: group 1—secondary or secondary vocational, and group 2—higher.
Table 1.
Sample structure: distribution of respondents depending on age, gender and education: group 1—secondary or secondary vocational, and group 2—higher.
| Age | ||||||
| <35 | 35–55 | >35 | All | |||
| 124 (42.74%) | 174 (41.38%) | 149 (39.60%) | 447 (100%) | |||
| Education | ||||||
| group 1 | group 2 | group 1 | group 2 | group 1 | group 2 | |
| 56 (12.53%) | 68 (15.21%) | 70 (15.66%) | 104 (23.27%) | 50 (11.19%) | 99 (22.15%) | 447 (100%) |
| Male | ||||||
| 22 (11.96%) | 31 (16.85%) | 27 (14.67%) | 45 (24.46%) | 21 (11.41%) | 38 (20.65%) | 184 (42.11%) |
| Female | ||||||
| 34 (12.93%) | 37 (14.07%) | 43 (16.35%) | 59 (22.43%) | 29 (11.03%) | 61 (23.19%) | 253 (57.89) |
N.B.: the results in the table are presented as n (%). Source: generated by the authors.
Table 2.
Factor loadings (FL) and Variance Inflation Factor (VIF) of components.
| Constructs | Indicator | FL | VIF |
|---|---|---|---|
| Performance Expectance | Benefit | 0.36 * | |
| Productivity | 0.87 | 1.460 | |
| Increasing effectiveness | 0.90 | 1.460 | |
| Effort Expectancy | Ease of interaction | 0.88 | 2.559 |
| Ease of learning | 0.91 | 3.816 | |
| Ease of use | 0.96 | 3.597 | |
| Social Influence | Attitudes towards the use of applications | 0.80 | 1.266 |
| Attitude towards applications | 0.90 | 1.266 | |
| The need of applications for communications | 0.37 * | ||
| Facilitating Conditions | Sufficiency of technical devices | 0.50 * | |
| Presence of knowledge | 0.86 | 1.680 | |
| Sufficiency of knowledge | 0.74 | 1.684 | |
| Assistance in use | 0.64 | 1.063 | |
| Anxiety | Fear of use | 0.74 | 1.737 |
| Fear of loss of information | 0.65 | 1.268 | |
| Fear of error | 0.89 | 2.473 | |
| Fear of application | 0.85 | 1.839 | |
| Behavioral Intention | Planning to use long-term | 0.91 | 1.571 |
| Planning to use more often | 0.87 | 2.654 | |
| Planning to use more | 0.89 | 1.975 | |
| Use Behavior | Use for information | 0.91 | 1.653 |
| Use for transactions | 0.89 | 1.878 | |
| Attitude towards the use of Applications | Reluctance for apps to stop working | 0.78 | 1.617 |
| The ability of apps to make life more interesting | 0.84 | 1.663 | |
| The pleasure of mastering new applications | 0.90 | 1.974 |
* not used. Source: generated by the authors.
Table 3.
The measurement model results: Composite Reliability (CR) and Average Variance Extracted (AVE) of the variables and adjusted R Square (adjR2).
Table 3.
The measurement model results: Composite Reliability (CR) and Average Variance Extracted (AVE) of the variables and adjusted R Square (adjR2).
| Constructs | AVE t-Value (p-Value) | CR t-Value (p-Value) | adjR2 |
|---|---|---|---|
| Performance Expectance | 0.750 10.607 (0.000) | 0.857 15.303 (0.000) | 0.234 |
| Effort Expectancy | 0.721 12.024 (0.000) | 0.837 15.249 (0.000) | 0.357 |
| Social Influence | 0.758 14.083 (0.000) | 0.862 22.271 (0.000) | 0.178 |
| Facilitating Conditions | 0.601 9.616 (0.000) | 0.816 17.936 (0.000) | |
| Anxiety | 0.73 16.45 (0.000) | 0.892 36.960 (0.000) | 0.044 |
| Attitude towards the use of Applications | 0.508 6.011 (0.000) | 0.754 7.071 (0.000) | 0.068 |
| Behavioral Intention | 0.750 10.599 (0.000) | 0.875 23.798 (0.000) | 0.396 |
| Use Behavior | 0.771 13.205 (0.000) | 0.849 15.752 (0.000) | 0.467 |
Table 4.
Hypothesis Testing Statistics (Total Effect): Path Coefficient (Std Beta), standard deviation (SD) and the Student’s t-test (t-value).
Table 4.
Hypothesis Testing Statistics (Total Effect): Path Coefficient (Std Beta), standard deviation (SD) and the Student’s t-test (t-value).
| Relationships between Constructs | Std Beta | SD | t-Value | p-Value |
|---|---|---|---|---|
| Direct Influence | ||||
| Age→Anxiety | 0.236 | 0.116 | 2.031 | 0.021 |
| Age→Effort expectancy | −0.106 | 0.100 | 1.062 | 0.144 |
| Age→Performance expectancy | 0.111 | 0.104 | 1.061 | 0.145 |
| Anxiety→Attitude towards using technology | −0.282 | 0.132 | 2.135 | 0.017 |
| Attitude towards using technology→Use Behavior | 0.277 | 0.094 | 2.948 | 0.002 |
| Behavioral intention→Use Behavior | 0.511 | 0.094 | 5.456 | 0.000 |
| Effort expectancy→Behavioral intention | 0.237 | 0.122 | 1.940 | 0.026 |
| Facilitating conditions→Effort expectancy | 0.532 | 0.096 | 5.520 | 0.000 |
| Facilitating conditions→Performance expectancy | 0.436 | 0.120 | 3.641 | 0.000 |
| Facilitating conditions→Social influence | 0.434 | 0.119 | 3.650 | 0.000 |
| Performance expectancy→Behavioral intention | 0.289 | 0.101 | 2.875 | 0.002 |
| Social influence→Behavioral intention | 0.306 | 0.109 | 2.818 | 0.003 |
| Specific Indirect Effects | ||||
| Social influence→Behavioral intention→Use Behavior | 0.156 | 0.056 | 2.781 | 0.003 |
| Effort expectancy→Behavioral intention→Use Behavior | 0.121 | 0.070 | 1.736 | 0.042 |
| Performance expectancy→Behavioral intention→Use Behavior | 0.148 | 0.062 | 2.373 | 0.009 |
| Social influence→Behavioral intention→Use Behavior | 0.156 | 0.056 | 2.781 | 0.003 |
| Effort expectancy→Behavioral intention→Use Behavior | 0.121 | 0.070 | 1.736 | 0.042 |
| Performance expectancy→Behavioral intention→Use Behavior | 0.148 | 0.062 | 2.373 | 0.009 |
| Facilitating conditions→Effort expectancy→Behavioral intention to use the system | 0.126 | 0.074 | 1.710 | 0.044 |
| Facilitating conditions→Social influence→Behavioral intention to use the system | 0.133 | 0.063 | 2.121 | 0.017 |
| Facilitating conditions→Performance expectancy→Behavioral intention to use the system | 0.126 | 0.061 | 2.060 | 0.020 |
| Facilitating conditions→Effort expectancy→Behavioral intention to use the system→Use Behavior | 0.064 | 0.042 | 1.537 | 0.062 |
| Facilitating conditions→Social influence→Behavioral intention to use the system→Use Behavior | 0.068 | 0.033 | 2.054 | 0.020 |
| Facilitating conditions→Performance expectancy→Behavioral intention to use the system→Use Behavior | 0.064 | 0.036 | 1.772 | 0.038 |
| Anxiety→Attitude towards using technology→Use Behavior | −0.078 | 0.047 | 1.651 | 0.050 |
| Age→Anxiety→Attitude towards using technology→Use Behavior | −0.067 | 0.045 | 1.488 | 0.069 |
| Total Indirect Effects | ||||
| Facilitating conditions→Behavioral intention to use the system | 0.385 | 0.103 | 3.724 | 0.000 |
| Facilitating conditions→Use Behavior | 0.197 | 2.786 | 0.003 | 0.050 |
| Anxiety→Use Behavior | −0.078 | 0.045 | 1.754 | 0.040 |
Publisher’s Note: MDPI stays neutral with regard to jurisdictional claims in published maps and institutional affiliations. |
© 2022 by the authors. Licensee MDPI, Basel, Switzerland. This article is an open access article distributed under the terms and conditions of the Creative Commons Attribution (CC BY) license (https://creativecommons.org/licenses/by/4.0/).
Share and Cite
MDPI and ACS Style
Popova, Y.; Zagulova, D. UTAUT Model for Smart City Concept Implementation: Use of Web Applications by Residents for Everyday Operations. Informatics 2022, 9, 27. https://0-doi-org.brum.beds.ac.uk/10.3390/informatics9010027
AMA Style
Popova Y, Zagulova D. UTAUT Model for Smart City Concept Implementation: Use of Web Applications by Residents for Everyday Operations. Informatics. 2022; 9(1):27. https://0-doi-org.brum.beds.ac.uk/10.3390/informatics9010027
Chicago/Turabian StylePopova, Yelena, and Diana Zagulova. 2022. "UTAUT Model for Smart City Concept Implementation: Use of Web Applications by Residents for Everyday Operations" Informatics 9, no. 1: 27. https://0-doi-org.brum.beds.ac.uk/10.3390/informatics9010027
Note that from the first issue of 2016, this journal uses article numbers instead of page numbers. See further details here.