Article

An Exploratory Study on the Validation of THUNDERS: A Process to Achieve Shared Understanding in Problem-Solving Activities

by
Vanessa Agredo-Delgado
1,2,
Pablo H. Ruiz
1,2,
Cesar A. Collazos
2 and
Fernando Moreira
3,4,*
1
Facultad de Ingeniería, Corporación Universitaria Comfacauca—Unicomfacauca, Popayán 190003, Colombia
2
IDIS Research Group, Departamento de Sistemas, Facultad de Ingeniería Electrónica y Telecomunicaciones, Universidad del Cauca, Popayán 190003, Colombia
3
REMIT, IJP, Universidade Portucalense, 4200 Porto, Portugal
4
IEETA, Universidade de Aveiro, 3810 Aveiro, Portugal
*
Author to whom correspondence should be addressed.
Submission received: 28 March 2022 / Revised: 22 April 2022 / Accepted: 27 April 2022 / Published: 30 April 2022
(This article belongs to the Special Issue Feature Papers in Informatics in 2022)

Abstract

:
The complexity in collaborative work is mainly related to the difficulty in social interaction, which generates low levels of understanding among participants about what they should do and about the problem to be solved, resulting in problems in the motivation to generate true collaboration. Therefore, in the search to improve collaborative work and encourage this collaboration, it is necessary to implement strategies that promote the construction of shared understanding and obtain better group results. However, building it becomes a challenge due to the factors that influence it and how little is known about its construction. In this sense, to improve collaborative work, as a result of a research process, the THUNDERS process is proposed, which provides a set of elements to build shared understanding in problem-solving activities and with heterogeneous group formation. Specifically, this paper presents the results of the statistical validation of THUNDERS through the Student’s t-test, which was used in an exploratory study in the educational field in two Colombian universities, where learning styles were considered for the formation of groups; having groups that used the process and other control groups that did not use it, the collaborative activity consisted of determining the scope of a process line simulating a software development company. According to the results obtained in the context of this study, it can be considered that THUNDERS encourages and improves shared understanding when people in a group work collaboratively to solve a problem. In addition, elements for improvement were identified that should be incorporated in further stages of this research so that the process allows for an easy and guided construction of shared understanding in any application context.

1. Introduction

The importance of teamwork arises from the consideration that the greater the number of participants committed to carrying out an activity, the greater the quantity and quality of the obtained results [1], alongside considering that working with other people can achieve better results than working individually since it is gathering and complementing a group of people with different capabilities, abilities, ideas, and skills regardless of the context in which the collaborative activity is performed [2]. That is why today the concept is related to group work dynamics in different contexts: work, study, and family, thus obtaining the benefits of achieving common goals, whether corporate, learning, or simply as an activity of social interaction [3].
Achieving collaboration improves the way a team works together and solves a problem, leading to greater innovation, efficient processes, more success, and better communication [4]. In order to collaborate, group members have permanent interactions with shared goals, a high degree of negotiation, interactivity, and interdependence, to define and assign tasks, and exchange ideas or points of view [5]. Therefore, it is necessary to establish social rules to organize a collaborative activity [6]. However, while the idea of collaboration seems easy enough, in reality, it can be quite complex working with others. Each person on a team has strengths and weaknesses, communication preferences, and personal goals [7]. When not handled correctly, these can fundamentally affect the way of working, generating communication difficulties between people and, indeed, causing the group to fail to agree on the interpretation of the tasks they will carry out, what they are working on, how they will work together, and the topic of the activity—in other words, failures in shared understanding, which consequently generate low levels of collaboration [8]. In this sense, the scant understanding among group participants about what they should do in the activity and about the problem to solve generates little motivation to collaborate, causing tasks to be performed without the necessary coordination [9]. Shared understanding can be defined as the level at which the members of a group who work on a particular issue agree on the perspectives and interpretations on that issue, reaching mutual agreements, and in this way, are able to act in a coordinated manner [10]. For this reason, since a group that works in a collaborative activity must achieve the objective and solve the proposed problem, it is necessary to build within the group a shared understanding [11] of the content, the procedure, and the use of communication technologies that will be used between them. This is done in order that all the participants know where they are going and in this way act in coordination towards the same goal [12]. For this, it is necessary to find the application of techniques, strategies, activities, and processes that support the construction of a shared understanding in specifically heterogeneous groups, where it is expected that these groups achieve efficiency and effectiveness in their work, producing better group results [13]. The importance of having a shared understanding in this type of organization of groups, specifically heterogeneous, is that shared understanding improves their performance because everyone knows what they should do and speaks the same language. However, its construction is a challenge, especially in the early stages of defining the problem [14], and more, in this type of group [13,15], because due to their varied skills, knowledge, experiences, personalities, or educational levels, the group members perhaps use the same words for different concepts or different words for the same concepts without realizing it [16]. Differences in interpretations and meanings assigned to key concepts can interfere with the productivity of collaborative work if these are not clarified early on [17,18,19], in addition to the fact that very little is known about what leads to its construction [13]. Hence there is a need to have a shared understanding among the members of the group and to know how to build it. If it is sought to create a shared understanding in a collaborative activity, this must operate on how a person works alone and how the group works to solve the activity [10]. It cannot simply bring people together in a room, hand them the need to solve something, and wait for them to create a shared understanding without support. For this, they must instead have guided work processes that unite people continuously, to share their understanding of what is happening, and the activity being carried out, in addition to generating a debate to show disagreements, different points of view, improve uneven understandings, and finally reach a common point, where everyone participates and agrees [20].
According to the main problem of collaborative work presented above, which is summarized in the difficulty of obtaining collaboration by all participants to achieve the common goal, the objective of this research is to define a process that improves collaborative work through the construction, monitoring, and assistance of shared understanding, which will improve communication among participants and as a consequence will result in greater collaboration. Therefore, in the search to build a process that meets these needs, this paper presents the results of the statistical validation, using the Student’s t-test, in the execution of the process known as THUNDERS (CollaboraTive work through sHared UNDErstanding in pRoblem-solving activitieS) as a proposal for the construction of shared understanding in this type of activity and for heterogeneous groups. The validation was conducted by carrying out an exploratory study with groups of students from two universities, who had to carry out a collaborative activity to solve a problem associated with defining the scope in software process lines. For the design, execution, and analysis of the results obtained from the collaborative activity, THUNDERS was used. THUNDERS is a second version of the process presented in [21], which has been improved and complemented thanks to the results obtained from validation of the initial version. The process presented here is based on guidelines with which to guide the entire collaborative process in such a way that it can be ensured that from the design of the activity a shared understanding is built into its execution which thus allows the resolution of the problem. It is a process that is based on having elements of individual construction, collaborative construction of meaning, collaborative construction, and constructive conflict resolution, applying a collaborative engineering approach. In addition, this second version includes the complete detail of each phase, activity, tasks, steps, and necessary work products, including monitoring elements. Specifically, in this paper, the results obtained from the validation of THUNDERS are presented in more detail. In the context of validation of this exploratory study, it can be considered that THUNDERS, the proposed process, encourages and improves shared understanding where a group of people work on the resolution of collaborative activity. In addition, aspects for improvement were identified that should be incorporated in later stages of this research so that the process allows easy construction and measurement of shared understanding in heterogeneous groups. This is because it is still a complex process to apply in collaborative activity. It is necessary to include more support with guides and different elements that support its easier execution.
The main importance of the research and validation presented here is to show the need to analyze and investigate cognitive factors that influence collaborative work and require assistance and guidance for its construction and measurement during the execution of the collaborative activity, in order to take action in time to improve communication among participants and consequently achieve greater collaboration to solve the problem and achieve the objectives set. In addition to this, the results obtained here are empirical evidence of the use of the process in a real academic context that served as a basis for its validation and subsequent improvement.
This document is structured as follows: Section 2 describes the theorical framework with some important concepts and related work; Section 3 briefly defines the THUNDERS process with each of its elements; Section 4 contains the planning, execution of the exploratory study, the results obtained, and their discussion; Section 5 contains the threats from this work; and finally, Section 6 contains the conclusions, limitations, and future work.

2. Theoretical Framework

2.1. Concepts

2.1.1. Collaborative Work

This refers to the participation of a group of people who contribute their ideas and knowledge in order to achieve a common goal [22]. It also involves direct interaction between individuals to produce a product and involves negotiations, discussions, and reaching consensus on the perspectives or ideas of others to obtain the expected results [23].

2.1.2. Shared Understanding

Christiane Bittner et al. [15] defined shared understanding as “The ability to coordinate behaviors towards common goals or objectives (“meaning-in-use” or action perspective) of multiple agents within a group (group level) based on mutual knowledge, beliefs and assumptions (content and structure) about the task, the group, the process or the tools and technologies used (object scope/perspective) that may change throughout the group work process due to various influencing factors and impacts the processes and outcomes of group work”.

2.1.3. Heterogeneous Group

Heterogeneous grouping is a type of membership distribution in which there is a relatively even distribution of people with different characteristics, such as intellectual abilities, different emotional needs, varying ages, educational levels, interests, and special needs [24]. It is necessary to bring mixed ability groups together systematically to ensure a truly heterogeneous composition [25]. In this sense, the idea of collaborative heterogeneous group work is to design group work that requires the multiple skills of group members to solve, manage, and complete a complex task, which has the uncertainty of a challenge [26] and needs the contributions of all group members [27].
To form this type of group, a single characteristic of the participants can be chosen, and each group must have different values of that characteristic, or several characteristics can be chosen, and groups can be formed with the required variety [24].

2.1.4. Problem-Solving Activities

The specific type of activities that THUNDERS is expected to perform are problem-solving activities. In this sense, problem solving is the act of defining a problem, determining its cause, identifying, prioritizing, and selecting alternatives for a solution, and implementing it [28]. Collaborative problem solving (CPS) is defined as “activities in which a problem must be solved involving collaboration among a group of people” [29].
A problem can be of several types [28]:
  • Theoretical: The purpose is to reflect on a topic or knowledge.
  • Practical: With objectives aimed at progress and innovation.
  • Theoretical–practical: To obtain unknown information in the solution of practical problems.
In THUNDERS collaborative problem-solving activities can specify the problem in any context and on any topic, as long as the support of a group of people is needed to identify the causes of the problem, look for possible solutions, choose one of them and implement it, and finally verify that the solution does solve the problem, all this with the collaboration of the group members. The problem can be as simple or complex as desired. For example, if we talk about a simple problem, we have information about the routes and train schedules between two points; the problem is to find out which is the fastest route to make a particular trip, where group members must help each other to find this faster route.

2.2. Related Work

2.2.1. Works Related to Shared Understanding

The objective of [30] was to find out how software developers and designers achieve shared understanding. For this a case study was conducted by interviewing employees of a Finnish ERP product development company to answer the following questions: How do developers and designers achieve shared understanding of the UX of a software system under development? and What are the artifacts used in their collaboration? Similarly, in [31], study, construction, mutual support, cohesion, and constructive conflict were major factors underlying shared understanding in emerging technology (ET) firms; furthermore, we explicitly examined the relationship between shared understanding, shared knowledge quality, and team effectiveness. A mixed methods study was conducted with a valid sample collected from 52 ET firms in co-working spaces located in Taiwan and Vietnam. Moreover, [32] discussed what shared understanding is, its importance, and the positive implications of having it in team sports such as soccer. As a result, practical suggestions were offered on how coaches can achieve shared understanding in teams. In another context [33], in a study involving interprofessional emergency medical teams (emergency medicine residents, nurses, and medical students), resuscitation simulations were carried out, recorded, and coded independently. This study made it possible to measure the team’s perception of the shared understanding according to the information provided and a measurement of the effectiveness of the team leader. Finally, Bates et al. [34] developed and validated a perception questionnaire as a tool to evaluate shared clinical understanding. A questionnaire was validated among physicians of pediatric cardiology patients that determined whether or not according to the critical and objective evaluation of the physicians there was a shared understanding among these physicians on providing patient information.

2.2.2. Works Related to Shared Understanding in the Context of Education

Faculty in health-related academic programs run the risk of misunderstanding when terms and concepts are not clearly defined, which hinders progress in the field. In [35] a methodology was defined based on a template of terms that emerged from a research process where the varied use of terms in biomedical and health profession educational literature contexts was identified and described. The methodology aimed to facilitate clarity of definitions and create a terminology and approach to describing terms to provide shared understanding. In turn [36] used empirical data obtained in a Master’s level business course to show how a responsible mindset can be facilitated among students in business programs by creating a shared understanding of the achievement of the SDGs. Specifically, the work inquires how to facilitate the creation of a shared understanding for a responsible mindset in higher business education. Moreover, in the design area, one of the challenges for students is to learn to work with interactive and interaction technology, since they have to assimilate knowledge about interactive prototypes, to work in teams, as well as many other things, and in a limited time. In this sense, [37] presented a technique called “Acting Machines” that allows a team to collaboratively develop an interactive prototype. The technique is based on the Acting Machine diagram, a visual representation of programmed interactions, which supports shared understanding that links conceptual stages with those of prototype implementation. The work described in [38] explored the shared understanding of how to create a sense of community in large class sizes, where techniques, recommendations, and suggestions for actively creating a sense of community in classrooms of more than 200 students are shared.

2.2.3. Works Related to Shared Understanding in Empirical Studies

In [39] a case study was conducted in three small organizations using continuous software engineering (CSE) to understand and identify the factors that prevent shared understanding of non-functional requirements (NFR) and their relationship to rework. Using a mixed methods approach, the following factors were identified: lack of domain knowledge, rapid pace of change, and communication problems. Some strategies were also identified to mitigate the lack of shared understanding through more effective management of requirements knowledge in such organizations. In the same vein Werner in [40] presents a dissertation on the basis of a theory of the complex and intricate relationship between shared understanding of NFRs and CSE. In [41], how the distribution of the team influences the success of projects by using a shared understanding approach was addressed. An empirical study was carried out in a software product development company in which a quantitative survey design was used, complemented by seven semi-structured interviews. It was found that the level of distribution of the team does not significantly influence the shared understanding of the success of the project. Dossick et. al. in [42] showed the first findings of an empirical study that sought to explore the use of photo elicitation techniques in combination with ethnography to assess the amount of shared understanding in multidisciplinary teams working on a building design project. The study was conducted with students in an interdisciplinary project-based class in which the interactions among students of architecture, construction science, and construction management were studied, and the visualizations these students created and used in order to learn and develop integrated skills. Results from two studies are shown in [43]: an experiment with students and a pilot field study with practitioners using a content validity survey instrument to measure shared understanding in businesses and IT professionals that aimed to monitor the relationships between businesses and the IT units of their organizations.
The first part of this section describes those works in which shared understanding is studied in a general way in different application contexts, the second part focuses on showing related works in the academic context, and the final part of the section describes some empirical studies where shared understanding is used, but it is striking that none of these studies used or defined a process that establishes, step by step, what to do and how to build shared understanding, as is the case of THUNDERS, which is intended to serve as a guide to support the entire collaborative process, from the design of the collaborative activity to the analysis of the results obtained, including elements to achieve a shared understanding specifically in problem-solving activities with heterogeneous groups. It is also important to clarify that this paper focuses mainly on statistical analysis as a result of the validation of THUNDERS in an exploratory study, to determine whether it encourages and improves shared understanding in the context used.

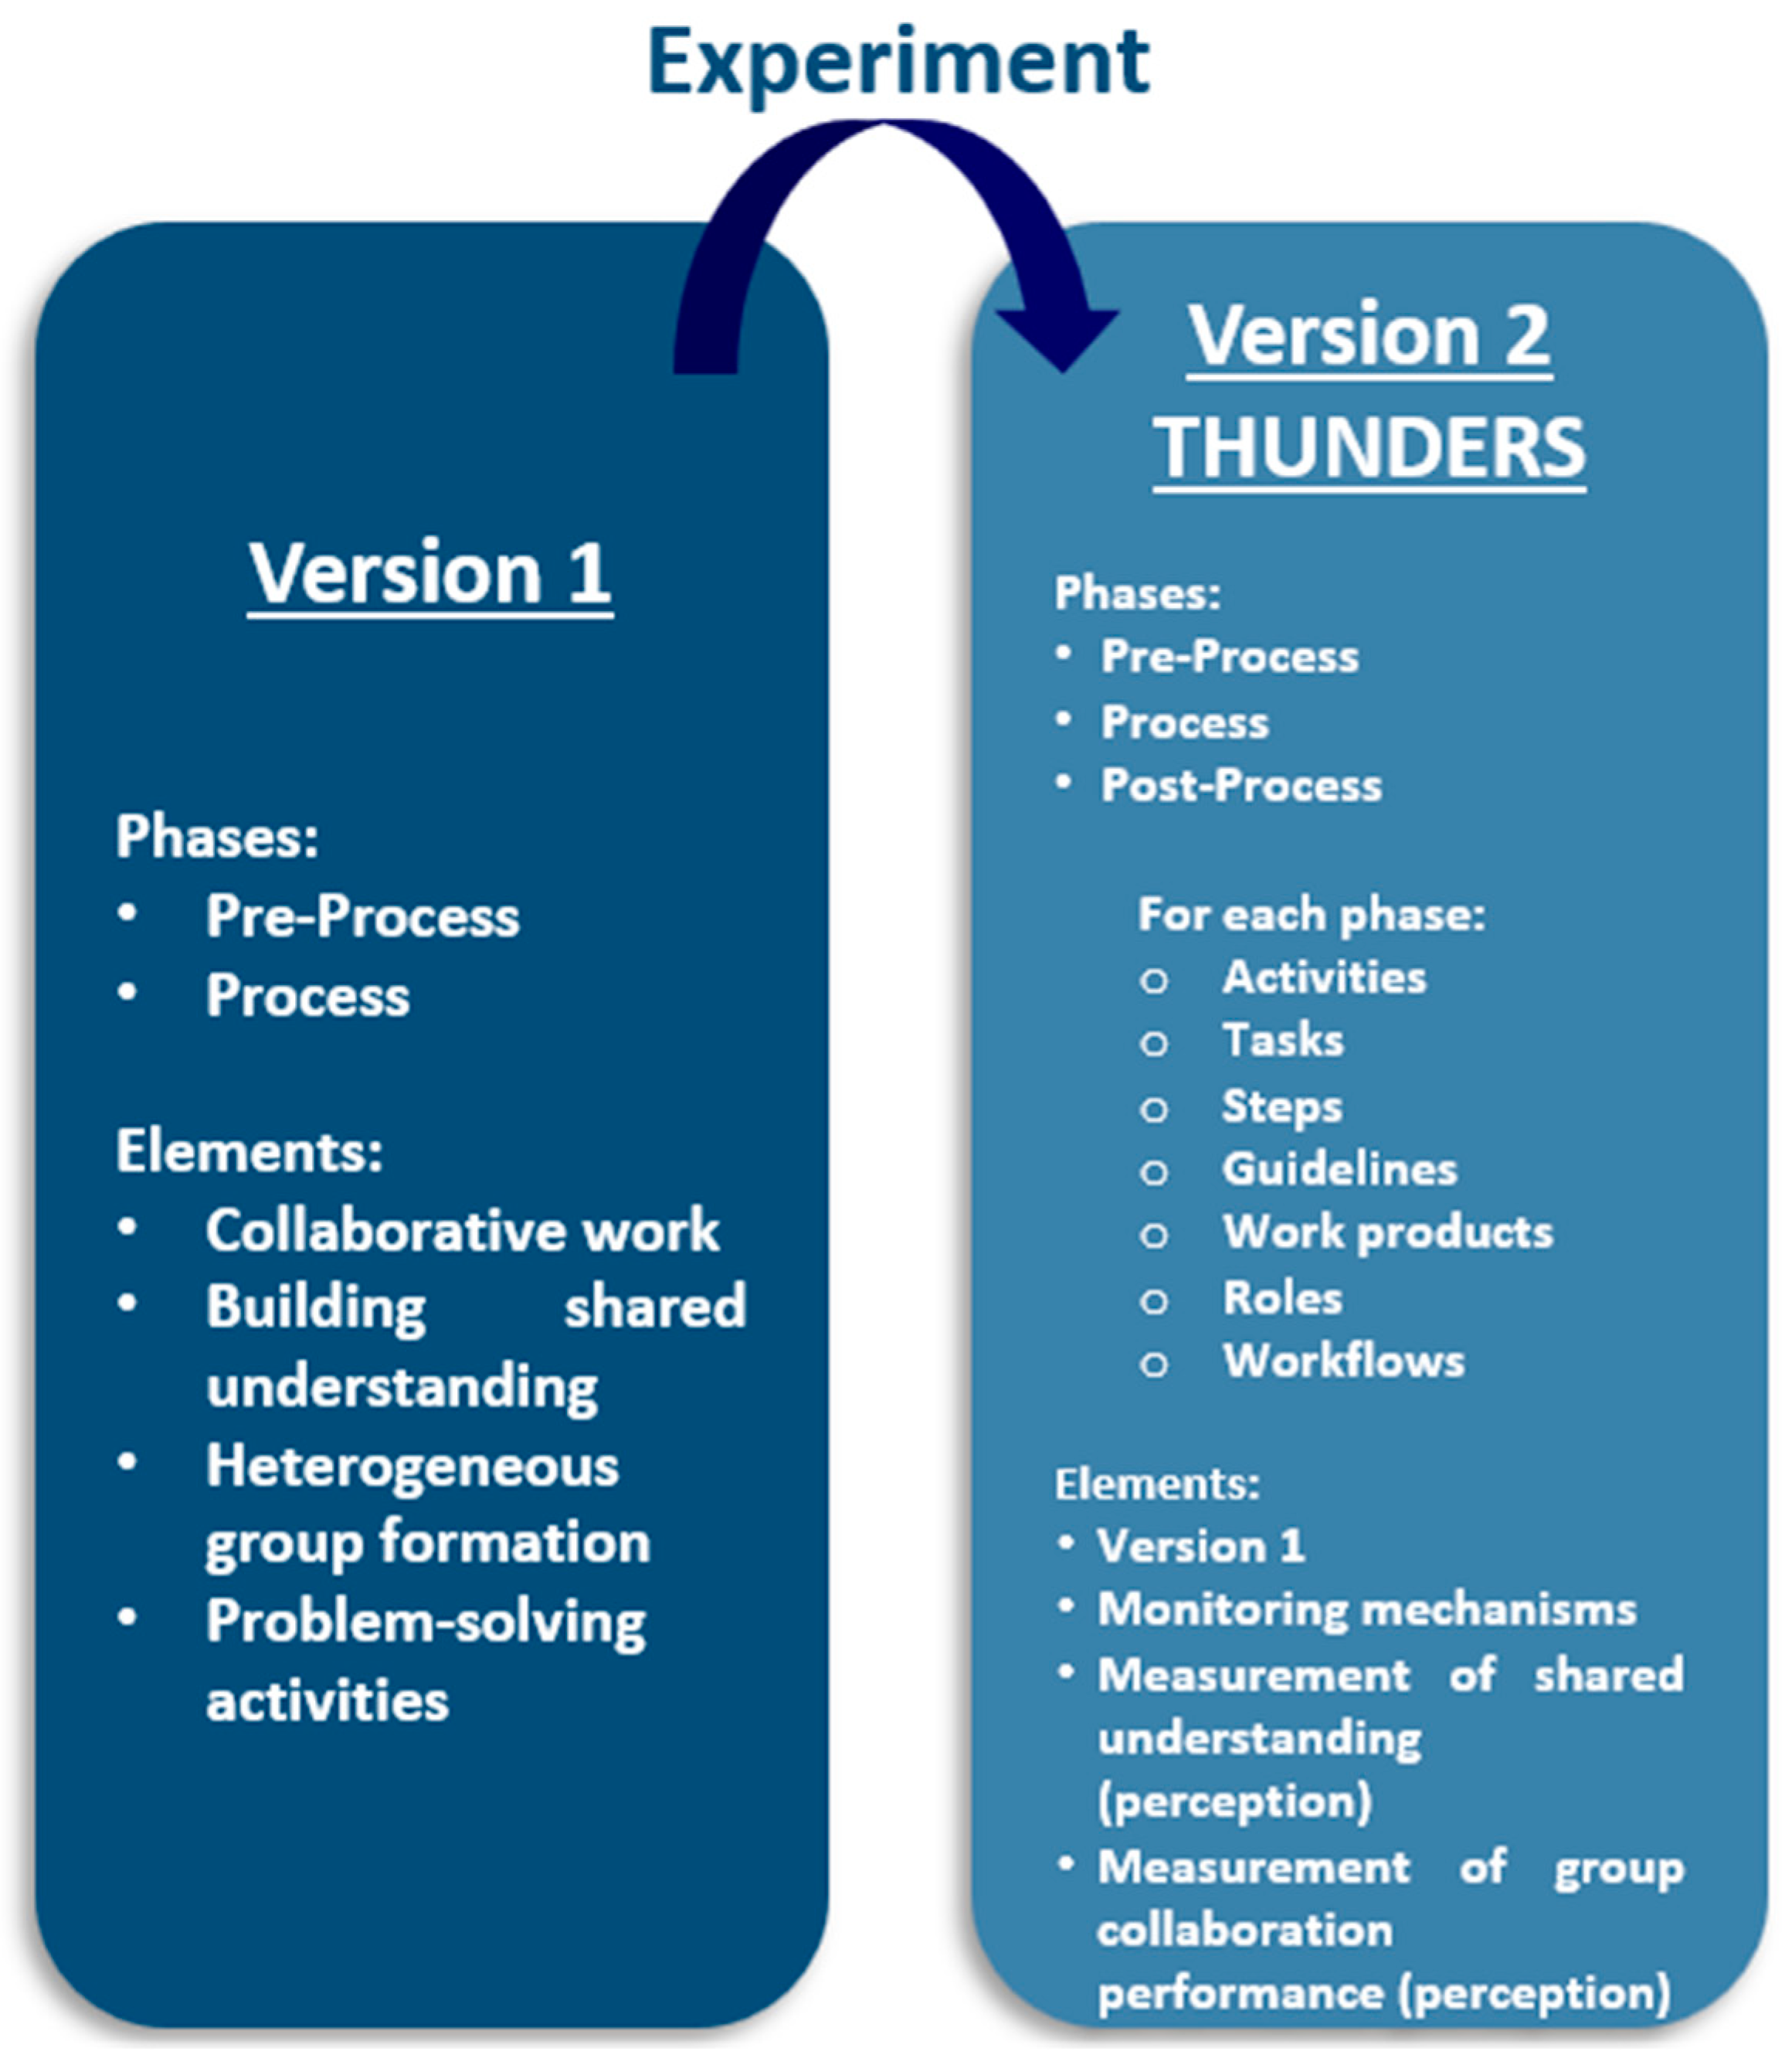
3. THUNDERS in a Nutshell

3.1. THUNDERS Construction

Research into building a process for the construction of shared understanding in collaborative problem-solving activities, specifically with the formation of heterogeneous groups, is research that has been carried out previously. Initially, consider the work defined by Collazos et al. in [30], who divided the computer-supported collaborative learning process into three phases, pre-process, process, and post-process, with some activities and tasks, but for the specific context of learning.
A first version of the process [21] was defined, based on this work, for collaborative work in a variety of contexts and not only in education. For this purpose, the pre-process phase and some activities of the process were updated and adapted, and some elements for the construction of shared understanding were incorporated. These elements were incorporated from the analysis of the information previously obtained in a systematic review of the literature, which sought to characterize and identify the definitions, approaches, and importance of the construction of the existing and proposed shared understanding in the literature, considering the activities of planning, execution of the review, and analysis of the information, as established by Kitchenham et al. [44]. After the execution of the review, a total of 273 papers were obtained, which were subjected to a review and filtering process, considering the research questions, and the inclusion and exclusion criteria previously defined, leaving 21 papers, which were defined as primary papers.
Considering the work that served as the basis and presented in [45] and from these primary papers (mainly from [12,13,15,46,47,48,49]), elements were taken for the construction of the shared understanding, in addition to defining and detailing some elements that were identified as necessary for the specification of the defined phases; the heterogeneous formation of the groups was considered as well as the need to consider that the collaborative activities to be executed should be problem-solving activities; and with this, the components that would make up the process in its initial version were established.
With this initial version, an experiment was conducted that identified some elements to improve and correct in the process. With these results of the experiment, a second version was created, which we called the THUNDERS process, which incorporates the definition and detail of all the phases of the process, monitoring elements, measurement of shared understanding, and measurement of the performance of group collaboration.
Figure 1 below shows the differences between the two versions, with the elements that were defined for each.
In light of this, it is important to make it clear that for this work, a process is a sequence of steps arranged with some type of logic that focuses on achieving a specific result [50]. In this work, the process that we will obtain will be a process defined at the conceptual level. Specifically, THUNDERS is a process that contains phases, activities, tasks, steps, guidelines, work products, roles, and workflows to support the execution of collaborative activities in problem solving and, at the same time, supports the achievement of a shared understanding.

3.2. THUNDERS Phases

As indicated, THUNDERS features three phases: pre-process, process, and post-process. The importance of dividing THUNDERS into three phases is that each phase has a milestone that defines its end and prepares the start of the next. For the pre-process phase, the milestone is the complete design of the collaborative activity; for the process phase, it is the solution of the problem, and finally, for the post-process phase, it is the execution of the mechanism of individual and group performance evaluation of the participants in the activity.
The first phase of pre-process aims to design and define the collaborative activity, with each of its necessary elements, such as activities for the definition of the topic, definition of the problem to be solved, definition of the characteristics of the heterogeneous training, design of roles, complete design of the collaborative activity, definition of the objectives of the activity, definition of the rules, success criteria, design of the necessary material, and design of the methods of verification of compliance and shared understanding (See Figure 2). Each of these activities has tasks, steps, inputs, outputs, and work products that allows each specified activity to be fulfilled.
The objective of each of the activities of the pre-process phase is detailed below (Table 1), in order to learn more about what was actioned in this phase to achieve the design and specification of the collaborative activity.
The process phase aims to execute the collaborative activity and solve the problem. Initially, the design of the activity defined in pre-process is socialized, with its respective problem to be solved, rules, success criteria, objectives, and verification methods. This phase also encompasses creation of the groups, with the assignment of their respective roles and responsibilities, and assignment of the material to the groups. Following socialization, it is determined if shared understanding was constructed and, whenever this does not happen, the necessary actions are taken to guide the group and clearly explain what they must do and must solve. With this information clear, the activity is carried out. With the actions to solve the problem, debate is generated and finally, the solution to the problem posed is obtained. Each of the activities in this phase are shown in Figure 3.
The objective of each of the activities of the process phase is detailed in Table 2 to understand what was actioned in this phase to execute the activity designed in the previous phase and achieve the solution of the problem and the goal set in the activity.
The post-process phase aims to verify the resolution of the collaborative activity problem, where it is initially verified that the success criteria were met and subsequently the performance of the participants and the result obtained by the group are quantitatively defined. Each of the activities in this phase are shown in Figure 4.
The objective of each of the activities of the post-process phase is detailed in Table 3, to understand what was actioned in this phase to verify that after the execution of the activity, the problem and the objectives of the collaborative activity have been solved, in addition to obtaining a summative evaluation that allowed obtaining quantitative results on the results obtained.
THUNDERS can be considered an extension and adaptation of the model proposed by Collazos et al. [44], which defines a guide for the design of collaborative learning activities: it is an extension because new activities are included and new tasks, new roles, and work products are defined to seek to build shared understanding through the execution of the process; and it is an adaptation because the work of Collazos et al. [44] is focused solely on carrying out collaborative learning activities while THUNDERS seeks to be a process to carry out problem-solving activities in collaborative work.

3.3. THUNDERS Roles

Each phase contains a definition of roles, which shows who is in charge of executing the THUNDERS tasks and who is responsible for obtaining the respective work products. A role can be executed by one or several people depending on the complexity of the collaborative activity. For the pre-process phase, there is the Activity Designer who is in charge of defining the outline and details of the collaborative activity to meet the objectives and solve the problem. This role must also ensure that the design is consistent with the participants, problem, and objectives chosen for its subsequent implementation. For the process phase, the Activity Leader is in charge of executing, managing, monitoring, and coordinating the activities, tasks, and steps of the process so that they are carried out within the stipulated time and design. They are also in charge of analyzing the information obtained in order to make the pertinent decisions required. In this phase, there are also the Participants, who are in charge of executing the collaborative activity and solving the problem. Finally, in the post-process phase, there is the Coordinator of the activity, who is in charge of verifying at the end of the collaborative activity that the previously defined success criteria were met and of defining the performance of the participants.

4. Exploratory Study

4.1. Exploratory Study in a Nutshell

Initially, it is necessary to determine that exploratory studies are normally carried out when the objective is to examine a topic or research problem that has been little studied or that has not been addressed before. That is, when the literature review reveals that there are only unresolved guidelines and ideas vaguely related to the problem. This study type serves to increase the degree of familiarity with relatively unknown phenomena, to obtain information on the possibility of carrying out further complete research about a particular context [51]. That is why it was decided to carry out a study of this type, to have more familiarity with the context and to find flaws and opportunities for improvement in the defined process in its second version. This is because similar processes have not been found that will determine what to do, how to do it, and how to guide a collaborative activity from its design in order to build shared understanding and therefore achieve the necessary collaboration and obtain the results expected.

4.2. Context of the Exploratory Study

THUNDERS aims to be a process for collaborative work that can be used in any context. In this case, for the exploratory study, the context in which it was conducted refers to a university environment. This is due to the ease of access to participants and the time they can devote to the execution of the different tasks, without neglecting that the activity to be developed is one that simulates a collaborative activity in a software development company.
In this study, 75 students from the Universidad del Cauca (UC) in Colombia participated; all of them were systems engineering students with 37 on the software engineering I course in the fifth semester (7 women and 30 men) and 38 students on the software engineering II course in the sixth semester (10 women and 28 men). In addition, 75 students from the Corporación Universitaria Comfacauca, Unicomfacauca (UF) in Colombia participated; all of them were systems engineering students with 27 on the software engineering I course in the fifth semester (10 women and 17 men) and 48 students on the software engineering II course in the sixth semester (15 women and 33 men).
With these students, groups of five participants were formed, resulting in 15 groups in each university. For this study, the learning styles characteristic was selected, which refers to the different ways that individuals have of using their intelligence, or, how they prefer to use their abilities to learn some concept or experience [52]. With this, groups were formed in each university using a software tool called Collab [53] that analyzes learning styles and organizes the group heterogeneously using a genetic algorithm described in [54]. The characteristic of learning styles ensures that heterogeneous groups of students are formed, allowing them to complement each other in each group and thus obtain better results. To identify the predominant style of each participant, each participant filled out a questionnaire, and subsequently, based on these results, Collab formed the groups heterogeneously.

4.3. Design of the Exploratory Study

For the execution of the exploratory study, in UC the THUNDERS process was used to define, execute, and verify the collaborative activity, while UF was used as a control group, where each of the groups formed carried out the same collaborative problem-solving activity but without employing THUNDERS. In UF, only the formation of heterogeneous groups was carried out. From there it was left to both teacher and participants to define, execute, and analyze the results of the collaborative activity according to their knowledge and experience.
The problem-solving activity, which the groups from both universities had to solve, specifically in the field of software engineering, consisted of each group assuming that they were part of the process engineering team of a software development company, where they had to establish the development processes that best adapt and support the projects in the company, thus defining the scope of a process line.
It was to be considered that a new project was coming to the company in the domain of banking applications, characterized as follows: a project which needed to be developed entirely in a single location of the company and should have international cooperation; it should be in accordance with international quality standards since it was considered as a large product in which the client would not be involved as part of the development team. With this information, each group had to follow an execution guide called SpeTion-SPrl, following a set of templates and formats that they had to develop collaboratively, in order to solve the problem of the activity, which was mainly to determine the scope of a software process line so that it could adapt and support the projects that the company was currently handling.
Previously, a software tool called MEPAC was developed internally, which served as support to follow the THUNDERS process at UC [55]. Through forms, MEPAC provides the step-by-step to follow each of the activities, tasks, and necessary steps of the process.
The aim of the exploratory study was to inquire about the construction of shared understanding using THUNDERS in a problem-solving activity. The research question of the study was determined as follows: Does the THUNDERS process promote and enhance shared understanding in a problem-solving activity? Considering the exploratory study goal and the research question, the following hypotheses were evaluated:
  • The THUNDERS process encourages the construction of shared understanding in a problem-solving activity.
  • The THUNDERS process improves the construction of shared understanding in a problem-solving activity.
In order to validate these hypotheses, the following variables were considered:
  • Improvement in the group descriptions: this is the level of improvement found in the descriptions after the execution of the process. This variable represents the statistically significant difference between the notes that were given to the individual and group descriptions.
  • Improvement in the UC and UF descriptions: this is the level of improvement found in group descriptions after the execution of the process. This variable represents the statistically significant difference in the notes given to the group descriptions between UC and UF groups.
  • Understanding other descriptions: this comprises the level of understanding that a participant has given the descriptions of what they should do from the activity, from other group participants. This variable represents a perceptual judgment of understanding of other descriptions.
  • The opinion of other descriptions: this is the level of opinion that a participant has with the descriptions of other group participants, of what they should do with the activity. This variable represents a perceptual judgment of opinion of other descriptions.
  • Improvement in homogeneous understanding: this is the level of improvement in the homogeneous understanding of the group of the activity to be undertaken, after use of the proposed process. This variable represents the statistically significant difference between the perceptual judgment of homogeneous understanding before and after the use of the proposed process.
  • Improvement in the discrepancy: the level of improvement in the discrepancy by each participant compared to other participants about the activity, after the use of the proposed process. This variable represents the statistically significant difference between the perceptual judgment of discrepancy before and after the use of the proposed process.
  • Improvement in homogeneous understanding in UC and UF: this is the level of improvement in the homogeneous understanding of the group of the activity to be developed, after the use of the process. This variable represents the statistically significant difference of the perceptual judgment of homogeneous understanding between the UC and UF groups.
  • Improvement in the discrepancy in UC and UF: this is the level of improvement in the discrepancy by each participant compared to other participants about the activity, after the use of the process. This variable represents the statistically significant difference of the perceptual judgment of discrepancy between the UC and UF groups.
  • Improvement in the construction activity: this is the level of improvement in the construction activity results, following use of the process. This variable represents the statistically significant difference of the perceptual judgment of construction activity results between the UC and UF groups.
  • Improvement in the co-construction activity: this is the level of improvement in the co-construction activity results, after the use of the process. This variable represents the statistically significant difference of the perceptual judgment of co-construction activity results between the UC and UF groups.
  • Improvement in the constructive conflict activity: the level of improvement in the constructive conflict activity results, after the use of the process. This variable represents the statistically significant difference of the perceptual judgment of constructive conflict activity results between the UC and UF groups.
  • Improvement in the quality of the results: this is the level of improvement in the quality of the final results obtained in performing the problem-solving activity, after the use of the process. This variable represents the statistically significant given difference of scores to the final results between the UC and UF groups.
  • Improvement in perception about the achievement of the objectives: this is the level of improvement in the perception of the participants, about the achievement of the objectives, after the use of the process. This variable represents the statistically significant difference in the perceptual judgment of objective achievement between the UC and UF groups.
  • Improvement in perception about the satisfaction with the process elements: this is the level of improvement in the perception of the participants, about the satisfaction with the process elements, after making use of the process. This variable represents the statistically significant difference in the perceptual judgment of satisfaction with the process elements between the UC and UF groups.
  • Improvement in perception about the satisfaction with the activity outcome: this comprises the level of improvement in the perception of the participants, about the activity outcome, after the use of the process. This variable represents the statistically significant difference in the perceptual judgment of satisfaction with the outcome of the activity between the UC and UF groups.
To validate the hypothesis on “The THUNDERS process encourages the construction of shared understanding in a problem-solving activity,” variables 3, 4, 9, 10, 11, 12, 13, 14, and 15 were specifically considered.
To validate the hypothesis about “The THUNDERS process improves the construction of shared understanding in a problem-solving activity,” the variables 1, 2, 5, 6, 7, and 8 were specifically considered.

Design of Activities, Time, and Instruments

For the execution of the exploratory study, a set of activities and their respective approximate duration and necessary instruments were designed. For UC who used THUNDERS, a duration of 1 h 25 min was planned for the pre-process phase, 2 h 45 min for the process phase, and finally, 1 h for the post-process phase. Similarly, for UF who did not use THUNDERS, it was planned that it would take 6 h from the planning of the activity to the analysis of the results obtained. For both universities, an additional 20 min were planned so that at the end of the analysis of the results, both participants and teacher completed a survey designed to obtain the necessary information.
For UC the following support instruments were used: Collab [53], MEPAC [55]; presentation of the introduction to the experiment and conceptual elements; activity document and result templates; form for individual writing; form for writing questions about descriptions of other understandings; form for classifying the clarity and opinion about descriptions of understandings (taken from [13]); form for determining the shared knowledge and/or differences in knowledge with their groupmates (taken from [13]); form for writing a group description; and templates to be filled out to solve the problem.
For UF, support instruments used comprised: Collab [53]; PowerPoint presentation of the introduction to the exploratory study and conceptual elements; activity document and results templates; and templates to be filled out in to solve the problem.
Finally, for the participants from both universities, it was planned to use an individual survey format with questions that they were required to answer about their perception of the performance of their group when working collaboratively, about the achievement of objectives within their group, about satisfaction with the elements of the proposed process, and finally, about satisfaction with the results obtained from the activity carried out (taken from [10]).

4.4. Execution of the Exploratory Study

At UC, all the phases, activities, tasks, and steps specified in the THUNDERS process were applied, making use of the tools planned for their support. MEPAC was used to guide each of the phases, and Collab for the formation of groups in the process and the different forms designed to execute the collaborative activity on previously designed process lines, and the necessary forms to collect the information that allowed the analysis of the data provided. UF meanwhile carried out the same designed collaborative activity. They also formed their groups using Collab. The teacher designed the necessary elements for the activity without a specific guide, and simply between the groups, they came up with a solution to that activity without following the proposed process. The time used to apply the THUNDERS process and complete the survey in UC was 4 h and 40 min and for UF it was 3 h and 30 min, from the design of the activity to the analysis of the results and the respective survey.

4.5. Results

From the execution of the exploratory study, results were generated that were statistically analyzed, bearing in mind that a control group (UF) was used that did not employ the THUNDERS process and another group (UC) that did. At first glance, the results appear evident, but it was necessary to ensure that the differences between these were statistically significant. For this, the Student’s t-distribution [56] was used to validate the hypotheses defined in this study. The Student’s t-test is used to determine whether there is a significant difference between means in normally distributed populations of one or two groups by hypothesis testing. A t-test can be used to determine whether a single group differs from a known value (a one-sample t-test), whether two groups differ from each other (independent samples t-test), or whether there is a significant difference in paired measures (a dependent or paired samples t-test) [57].
As previously mentioned, the t-test features three types of tests, which were considered for this study: (a) t-test for means of two paired samples, this means data that come from the same people, that is, the comparison of the experimental group BEFORE and AFTER a stimulus (in this case the stimulus is the application of THUNDERS). The next two types of t-tests use data that come from two different groups, where one received the stimulus, and the other did not (for this case, a control group (UF) that did not use the THUNDERS process and another group (UC) that did use it); (b) t-test for two samples with equal variances; and (c) t-test for two samples with unequal variances.
The calculations of the different Student’s t-tests applied in this study were carried out using the function offered by the Excel Office suite for calculating this test. The values employed to make this calculation are shown in Table 4.
Initially, for the type (b) and (c) t-tests it was necessary to determine if the variances of the values were equal or unequal; this is why it uses the Fisher test (the function provided by Excel Office suite was also used for the F-test to calculate this test) [58], where we defined two hypotheses.
  • H0 = the variances are equal.
  • Ha = the variances are different.
Additionally, in the three test types, the acceptance or rejection of the null hypothesis were considered:
  • If p-value or F-Value ≤ significance level, the null hypothesis is rejected.
  • If p-value or F-Value > significance level, the null hypothesis is accepted.

Statistical Analysis

Once the groups were organized with their respective roles and responsibilities, the necessary information of the activity was shared, and then, each participant was given the specification of the activity to be carried out. Each was assigned a time to read and understand it.
Variable 1: Improvement in the group descriptions
Having completed this individual analysis, the UC groups were asked to write a description of what they individually understood about what they had to do in the activity and about the problem to be solved. After the interaction with the group, and resolving any doubts and generating the necessary debates, they were required to make a description in the group, with the participation of all, about what they understood, in such a way that all agreed with what was specified.
To analyze the shared understanding of the activity carried out, it was necessary to determine what the participants understood both individually and as a group. This is because one premise of shared understanding is that there must be an individual, complete, and correct understanding in order to later interact with the group, improve this individual understanding, and be able to have a common, equally complete, and correct understanding. For this, the statistical difference between the individual and group understanding of the UC groups was first analyzed. To do this, each understanding was scored by the activity coordinator (from 0 to 5, where 0 is the understanding furthest from what they should have done about the activity and 5 is the most correct understanding), obtaining the following values (Table 5):
It is apparent that judging from the results, the group description generates better scores, according to the individual qualifications. To ensure that these differences are not only apparent but statistically significant, the type (a) t-test was applied.
To validate “Improvement in the group descriptions” variable, consideration was made of:
  • Null hypothesis: There is no statistically significant difference in the mean of scores between the individual and group descriptions.
  • Alternative hypothesis: There is a statistically significant difference in the mean of scores between the individual and group descriptions.
Obtaining the following results, t-value = −5.130, p = 0.00015, and critical value = 2.145.
These results can be used to determine that: t (15) = −5.130; p = 0.00015, p (0.00015) < significance level (0.05) meaning that the null hypothesis was rejected, leading to accepting the alternative.
Variable 2: Improvement in the UC and UF descriptions
The UF groups made only group descriptions of what they understood they should have done about the activity and the activity problem. These were also rated by the coordinator, obtaining the following values, shown in comparison to the UC group understanding scores (Table 6).
To analyze the difference between the UF and UC groups, a statistical analysis was needed. This made it possible to determine whether or not the differences in the scores of the group description obtained were statistically significant—perhaps even clearly so—and thereby determine whether or not this might be due to the use of the process.
According to the data analyzed, corresponding to two different groups where one received the stimulus and the other did not, it was necessary to initially assess what type of t-test ought to be used. To do this, the F-test was applied, obtaining a value of 0.261, determining that the null hypothesis was accepted, where variances are equal. Accordingly, the type (b) t-test was applied to the values.
To validate “Improvement in the UC and UF descriptions” variable, these statements were considered:
  • Null hypothesis: There is no statistically significant difference in the mean of scores for group descriptions between UC and UF participants.
  • Alternative hypothesis: There is a statistically significant difference in the mean of scores for group descriptions between UC and UF participants.
The results were as follows, t-value = 2.98, p = 0.0059, and critical value = 2.048.
These results produced a p (0.0059) < significance level (0.05), causing the null hypothesis to be rejected and leading to the alternative being accepted.
Variable 3: Understanding other descriptions
For the UC groups, each participant had to share their individual description in front of the rest of their groupmates, while the others had to rank whether they understood what they heard from their peers (this ranking was from 1 to 5, where 1 was very unclear and 5 was very clear), obtaining the following values (Table 7):
To validate “The understanding other descriptions” variable, the following aspects were considered:
  • Null hypothesis: The percentage of perception about the level of understanding that the participants regarding the descriptions of the other participants in the group is less than 60%.
  • Alternative hypothesis: The percentage of perception about the level of understanding that participants have regarding the descriptions of the other participants in the group is greater than or equal to 60%.
From the obtained values, it can be stated (taking answers “Clear” and “Very Clear” as positive responses) that the percentage of perception about the level of understanding was 81.6%, thereby causing the null hypothesis to be rejected and accepting the alternative.
Variable 4: The opinion of other descriptions
Similarly, for the UC groups, each participant classified the description heard by each of their classmates, determining from 1 to 5 whether or not they agreed with it (1 completely disagree, 5 completely agree), obtaining the following values (Table 8):
To validate the “Opinion of other descriptions” variable, the following aspects were considered:
  • Null hypothesis: The percentage of perception about the level of opinion that the participants have regarding the descriptions of the other participants in the group is less than 60%.
  • Alternative hypothesis: The percentage of perception about the level of opinion that the participants have regarding the descriptions of other participants in the group is greater than or equal to 60%.
From the obtained values it can be stated (taking answers “I Agree” and “I Completely Agree” as positive responses) that the percentage of perception about the level of opinion was 73.9%, thus rejecting the null hypothesis and causing the alternative hypothesis to be accepted.
Variable 5, 6: Improvement in homogeneous understanding and Improvement in the discrepancy
The change in shared understanding was monitored and the effects of THUNDERS were evaluated. As such, in the UC groups, two self-assessment measures were performed to determine if, in the judgment of each participant, there was shared knowledge (Measure 1) and/or discrepancy in knowledge (Measure 2) with their groupmates. These measures were made by means of a questionnaire at two moments, at the beginning of the activity (pre) and the end of the activity (post) (questions taken from [13], with values from 1 to 5, where 1 is less understanding and less difference), obtaining the following values (Table 9):
Although the groups started with different knowledge and different levels of perceived shared knowledge, all of them experienced a substantial improvement in those measures.
It appears that from the results, the scores improve when analyzing them before and after the use of the THUNDERS process, both for Measure 1 (referring to shared knowledge, where the values closest to 4 indicate that the group has a homogeneous understanding) and for Measure 2 (referring to discrepancy in knowledge, where the values closest to 0 indicate that the individual understandings do not differ from the group understandings). It was therefore sought to assure that these differences are not only apparent but statistically significant. For this reason, the type (a) t-test was applied.
To validate “Improvement in the homogeneous understanding” variable, the following aspects were considered:
  • Null hypothesis: There is no statistically significant difference in the mean of the obtained results from the homogeneous understanding of the group before and after the use of the proposed process.
  • Alternative hypothesis: There is a statistically significant difference in the mean of the obtained results from the homogeneous understanding of the group before and after the use of the proposed process.
To validate the “Improvement in the discrepancy” variable, these aspects were considered:
  • Null hypothesis: There is no statistically significant difference in the mean of the obtained results from differences in individual knowledge versus group knowledge, before and after the use of the proposed process.
  • Alternative hypothesis: There is a statistically significant difference in the mean of the obtained results from differences in individual knowledge versus group knowledge, before and after the use of the proposed process.
The following results were obtained (Table 10):
Table 10 shows how the measures for shared knowledge and differing or discrepant knowledge among the members of each group changed from pre-test to post-test. Shared knowledge increased significantly from a mean of 2.45 to 3.51; differences in knowledge decreased from 1.45 to 0.97. With these results, both for shared knowledge p (0.00013) < significance level (0.05), and for the discrepancy in knowledge p (0.029) < significance level (0.05), it can be determined that the null hypotheses were rejected, and the alternatives accepted.
Variables 7, 8: Improvement in homogeneous understanding in UC and UF and Improvement in the discrepancy in UC and UF
Meanwhile, for the UF groups, only the self-assessment measures of shared knowledge and discrepancy in knowledge were researched, at the end of the activity (post). Only this post-evaluation was carried out since in not applying the THUNDERS process the individual understandings were not analyzed. However, it was sought to analyze how shared understanding in UF behaved after the activity (post) without the use of THUNDERS, comparing with results obtained in the post with the UC groups, obtaining the following values (Table 11):
Considering that the data corresponded to two different groups, it was necessary to initially analyze what type of t-test should be used. Due to that, the F-test was again applied, obtaining a value of 0.604 for shared knowledge and 0.933 for discrepancy in knowledge. This factor determines that the null hypotheses were accepted, where the variances are equal and due to this, the type (b) t-test was applied to the values.
To validate the “Improvement in homogeneous understanding in UC and UF” variable, the following aspects were considered:
  • Null hypothesis: There is no statistically significant difference in the mean of the obtained results from the homogeneous understanding between the UC and UF groups.
  • Alternative hypothesis: There is a statistically significant difference in the mean of the obtained results from the homogeneous understanding between the UC and UF groups.
To validate the “Improvement in discrepancy in UC and UF” variable, these aspects were considered:
  • Null hypothesis: There is no statistically significant difference in the mean of the obtained results from differences in the individual knowledge versus the group knowledge, between the UC and UF groups.
  • Alternative hypothesis: There is a statistically significant difference in the mean of the obtained results from differences in the individual knowledge versus the group knowledge, between the UC and UF groups.
The following results were obtained (Table 12):
With the results, both for shared knowledge p (0.000004) < significance level (0.05), and for discrepancy in knowledge p (0.000019) < significance level (0.05), it can be determined that the null hypotheses were rejected leading to the alternatives being accepted.
Variables 9, 10, 11: Improvement in the construction activity, Improvement in the co-construction activity, and Improvement in the constructive conflict activity
At the end of the activity, the participants, both those who used THUNDERS (UC) and those who did not (UF), were asked to complete a survey in which the first group of questions was about the tasks of the stage of shared understanding (construction ©, co-construction (CoC), and constructive conflict (CC)). For this, a version of the nine items proposed by Van den Bossche et al. [10] was used. This questionnaire was principally used to examine how the participants of each group behaved collaboratively while executing the shared understanding process construction. The survey had a set of items measured on a 5-step Likert scale, with 4 = “Strongly Agree” being the highest value and 0 = “Strongly Disagree” being the lowest value, obtaining the following values (Table 13):
Considering that the data corresponded to two different groups, it was necessary to initially analyze what type of t-test should be used. The F-test was applied in each task, obtaining from construction a value of 0.235, co-construction a value of 0.512, and constructive conflict a value of 0.826, which determined that the null hypotheses were accepted in which the variances are equal and due to this fact, the type (b) t-test was applied to the values.
To validate the “Improvement in construction activity” variable, the following aspects were considered:
  • Null hypothesis: There is no statistically significant difference in the mean of the results obtained from the activities of construction between the UC and UF groups.
  • Alternative hypothesis: There is a statistically significant difference in the mean of the results obtained from the activities of construction between the UC and UF groups.
To validate the “Improvement in co-construction activity” variable, these statements were considered:
  • Null hypothesis: There is no statistically significant difference in the mean of the results obtained from the activities of co-construction between the UC and UF groups.
  • Alternative hypothesis: There is a statistically significant difference in the mean of the results obtained from the activities of co-construction between the UC and UF groups.
To validate the “Improvement in constructive conflict activity” variable, these outcomes were considered:
  • Null hypothesis: There is no statistically significant difference in the mean of the results obtained from the activities of constructive conflict between the UC and UF groups.
  • Alternative hypothesis: There is a statistically significant difference in the mean of the results obtained from the activities of constructive conflict between the UC and UF groups.
The following results were thus obtained (Table 14):
With the results, for construction p (0.000033) < significance level (0.05); co-construction p (0.0426) < significance level (0.05); and constructive conflict p (0.00015) < significance level (0.05), it was determined that the null hypotheses were rejected, concluding that the alternatives hypotheses be accepted.
Variable 12: Improvement in the quality of the results
At the end of the activity, in both universities, UC and UF, the groups generated results after solving the problem of defining the scope in a process line. With these solutions developed for the problem, the activity coordinator was asked to assign a score to the solution of each group (scores between 5 and 0, where 5 was for results that were closest to the optimal solution and 0 for those that were furthest away from this solution). This same scoring was assigned to both UC and UF groups, in order to compare the results of the activity, thus analyzing the quality of the results obtained. The following values emerged (Table 15):
Again, bearing in mind that the data corresponded to two different groups, it was necessary to initially analyze what type of t-test should be used. The F-test was applied, obtaining a value of 0.702. This determined that the null hypothesis was accepted, in which the variances are equal. Accordingly, the type (b) t-test was applied to the values.
To validate the “Improvement in the quality of the results” variable, the following aspects were considered:
  • Null hypothesis: There is no statistically significant difference in the mean of the scores from the results after applying the guide between the UF and UC groups.
  • Alternative hypothesis: There is a statistically significant difference in the mean of the scores from the results after applying the guide between the UF and UC groups.
Obtaining the following results: t-value = 6.150, p = 0.000001, and critical value = 2.048.
With these results it was determined that p (0.000001) < significance level (0.05), thus rejecting the null hypothesis and concluding that the alternative hypothesis was accepted.
Variables 13, 14, 15: Improvement in perception about achievement of objectives, Improvement in perception about satisfaction with the process elements, and Improvement in perception about satisfaction with the outcome of the activity
In the survey that each participant was required to complete at the end of the execution of the collaborative activity, for both the UC and UF groups, there was another set of questions that evaluated the perception of participants on the achievement of the objectives (AO) within their group, satisfaction with process items (SP), and satisfaction with the activity outcome (SO). These questions were taken from Briggs et al. [59] which sought to assess the perception of existing collaboration and the satisfaction with what has been delivered in the activity. The following values were obtained (Table 16):
Considering that the data corresponded to two different groups, it was once again necessary to initially analyze what type of t-test should be used. The F-test was applied, obtaining for AO a value of 0.407, for SP a value of 0.596, and for SO a value of 0.996, for which it was determined that the null hypotheses were accepted, where the variances are equal and, therefore, the type (b) t-test was applied to the values.
To validate the “Improvement in perception about the achievement of objectives” variable, these statements were considered:
  • Null hypothesis: There is no statistically significant difference in the mean of the results obtained from perception of participants about the achievement of objectives between the UC and UF groups.
  • Alternative hypothesis: There is a statistically significant difference in the mean of the results obtained from perception of participants about the achievement of objectives between the UC and UF groups.
To validate the “Improvement in perception about the satisfaction with the process elements” variable, it was considered that:
  • Null hypothesis: There is not any statistically significant difference in the mean of the results obtained from satisfaction perceived by the participants about process items between the UC and UF groups.
  • Alternative hypothesis: There is a statistically significant difference in the mean of the results obtained from satisfaction perceived by the participants about process items between the UC and UF groups.
To validate the “Improvement in perception about the satisfaction with the activity outcome” variable, these aspects were considered:
  • Null hypothesis: There is not any statistically significant difference in the mean of the results obtained from satisfaction perceived by the participants about activity outcomes between the UC and UF groups.
  • Alternative hypothesis: There is a statistically significant difference in the mean of the results obtained from satisfaction perceived by the participants about activity outcomes between the UC and UF groups.
The following results were obtained (Table 17):
The results for achievement of objectives (AO) p (0.0002) < significance level (0.05) determined that the null hypothesis was rejected and concluded that the alternative was accepted. For satisfaction of participants with process items (SP) p (0.948) > significance level (0.05) and for satisfaction of participants with activity outcome (SO) p (0.625) > significance level (0.05), it could be determined that the null hypotheses were accepted for both cases, rejecting the alternatives.

4.6. Discussion of Results

Upon executing this exploratory study and applying the Student’s t-test to the resulting values generated from the different surveys and analysis of what was actioned, in variables 3, 4, 9, 9, 10, 11, 12, and 13, the acceptance of the alternative hypotheses was obtained, which refer to: The percentage of perception on the level of understanding and on the level of opinion that the participants have regarding the descriptions of the other participants of the group is greater than or equal to 60%, obtaining 81.6% clear understanding and 73.9% favorable opinion. There is a statistically significant difference in the mean of the scores obtained in the construction, co-construction, and constructive conflict activities between the UC and UF groups. There is a statistically significant difference in the mean of the scores of the results (final deliverables of the collaborative activity) between the UF and UC groups. Finally, there is a statistically significant difference in the mean of the scores obtained from the participants’ perception of the achievement of the objectives between the UC and UF groups. With this, we can establish that the use of THUNDERS generates greater understanding and a favorable opinion about the understandings of the other partners in the collaborative activity, greater individual construction of understanding, debates, and discussions of ideas, which after the conflict generates a group understanding (categories that are defined in [13]), better results, and a perception in the participants of satisfaction for the achievement of the objectives of the collaborative activity. With these hypotheses accepted we can conclude that THUNDERS in this validation context encourages the construction of shared understanding in a problem-solving activity in an acceptable way.
However, in the measurement of variables 14 and 15 the null hypotheses were accepted, which refer to: there is no statistically significant difference in the mean of the results obtained from the satisfaction perceived by the participants on the process elements and on the outcomes of the activity between the UC and UF groups. With this, we can establish that THUNDERS does not generate satisfaction in the participants about the elements (phases, activities, tasks, steps, workflows, work products, and roles) that make up the process and about the results that the participants obtain at the end of the collaborative activity.
However, according to the results obtained in the measurement of variables 1, 2, 5, 6, 7, and 8, their alternative hypotheses were accepted, which refer to: Specifically, in the UC groups (which were the groups that used THUNDERS), there is a statistically significant difference in the mean of the scores between individual and group descriptions. There is a statistically significant difference in the mean of the scores obtained from the homogeneous understanding of the group before and after the use of the proposed process. There is also a statistically significant difference in the mean of the scores obtained from the differences in individual knowledge versus group knowledge, before and after the use of the proposed process. Considering the UC and UF groups, there is a statistically significant difference in the mean of the scores of the group descriptions between the UC and UF participants, in the mean of the results obtained from the homogeneous comprehension, and those obtained from the differences in individual knowledge versus group knowledge between the UC and UF groups. With this, we can establish that the use of THUNDERS generates better individual and group understandings, which are reflected in the deliverables made, a uniform understanding among the members of the groups, and a better group knowledge. With these hypotheses accepted, we can conclude that THUNDERS improves shared understanding in groups that carry out a collaborative activity.

5. Threats

Construct validity: In order to reduce the subjectivity of the instruments used to collect the information necessary for the exploratory study, each of the forms and surveys was reviewed by experts in collaboration issues. To improve the validity of the construct, in this case of THUNDERS, the study was done with differential groups, where results were obtained from two different universities—one with the construct and the other without it—in addition to other tests where the results were analyzed before and after applying the process. In addition, the same collaborative activity was used in both universities. In order to avoid a higher complexity in the concepts of the collaborative activity, an initial contextualization was carried out on process lines, and, in addition, it was sought that the students already had a basic knowledge in this regard, as systems engineering students with knowledge of the topic. Another threat to the validity of the construct was the use of self-assessment surveys to measure shared understanding. To reduce the threat due to the use of a single means of measurement, there was a person in charge of carrying out constant observation of the groups to analyze their performance and the understanding that emerged in them.
Internal validity: To minimize the threat to internal validity, for both universities, each of the phases and the collaborative activity were executed in different sessions, in order to avoid fatigue and the participants losing interest in solving what was requested. To minimize the differences between the participants due to their heterogeneity of characteristics, a software tool was used to form heterogeneous groups that, through their learning style, could complement each other to obtain better collaborative results.
External validity: To minimize one of the threats to external validity, in which the participants tried to answer the questions to analyze the information according to their perception of social desirability or to help the experimenter, all participants were sensitized to the need to be very sincere in their answers and to respond according to what was experienced and observed during the study. In addition, to minimize the effect that the participants saw the process as something appropriate and useful in the context, as a function of the novel, not usual phenomenon, it was sought that the participants not only had knowledge of the activity topic but also that they knew the benefits of working collaboratively and its necessary elements.

6. Conclusions

This paper presents in detail how the statistical analysis was performed, using the Student’s t-test on the data obtained in the execution of an exploratory study to validate the THUNDERS process. The study consisted of the resolution of a problem of scope definition in software process lines by students from two universities, in which a set of variables was validated through their respective hypotheses. According to the measurement of these variables, it was possible to conclude that THUNDERS in this validation context encourages and improves the construction of shared understanding. This is due to the fact that the comparison of the results when applying the Student’s t-test in the groups that used THUNDERS with respect to those that did not, and according to the data taken before and after using the process, showed that there was a statistically significant difference that allowed accepting the hypotheses and guaranteeing said encouragement and improvement. However, it cannot be guaranteed that there is satisfaction on the part of the students with the elements of the process, and with the results obtained from the collaborative activity. This may be due to the fact that the THUNDERS process still needs improvement in the definition of the elements that compose it to make it easier to use, since its documentation is extensive and requires many elements to be used. Similarly, from the observation, it was determined that THUNDERS needs to incorporate new elements to guide and support each of its phases, to make it easier to execute, in addition to the need to include specific roles for monitoring the correct execution of each activity and task, and also to incorporate new mechanisms for measuring shared understanding. This exploratory study allowed us to generate more empirical evidence of the importance of building, maintaining, and assisting true collaboration in this type of activity to achieve better results, and one way to do this is by analyzing cognitive factors and, in this case, obtaining the benefits of shared understanding to generate greater collaboration.
Future work is expected to improve the definition of the different elements that make up THUNDERS, so that it can be subject to further validation in other contexts, not only in the academic environment, and to allow its further improvement; to provide computational support for its execution and monitoring, so that each of the steps provided can be executed with computer support and thus facilitate the observation of the information and the support of the participants; to generate versions of the process that are easier to use depending on the type of collaborative activities and the context, that is, a version for those activities that are simpler to execute and do not require all the rigor and documentation provided by the process, or more complex versions of the process for activities that require it; to incorporate other elements for measuring the shared understanding in such a way that with computational support it allows the execution of actions in time to improve it and correct it in the indicated time. It is also necessary to investigate in greater depth the level of heterogeneity that directly influences the construction of shared understanding, determining which are the best characteristics that a group should have for such understanding to be built in the right way.

Study Limitations

This study had some limitations that are described below. There was a very small number of the sample for the calculation of the Student’s t-test, with which it is not possible to ensure a representative distribution of the population; however, the validation presented here was also intended to identify improvements and corrections to the process, which was achieved with the selected sample. It is expected in later stages of the research to make new validations with larger samples to improve the results obtained. Another limitation is that some measurements were made through the self-evaluation of the participants, which can generate subjective responses; however, it was sought that there should also be an observer who could analyze the actions carried out and thus give appreciations to the study. Another limitation was that the study was intended to be carried out in a software development company to determine that THUNDERS can be used in different contexts; however, due to the amount of time needed to carry out the complete study and the rigorous documentation required by the process, it was not possible to apply it in a company, so the collaborative activity to be carried out was an activity that could take place in a real company.

Author Contributions

Writing—original draft preparation, V.A.-D., P.H.R., and C.A.C.; writing—review and editing, V.A.-D., P.H.R., and F.M.; visualization, F.M.; supervision, F.M. All authors have read and agreed to the published version of the manuscript.

Funding

This work was supported by the FCT—Fundação para a Ciência e a Tecnologia, I.P. [Project UIDB/05105/2020].

Institutional Review Board Statement

Not applicable.

Informed Consent Statement

Not applicable.

Data Availability Statement

The data presented in this study are available on request from the corresponding author.

Conflicts of Interest

The authors declare no conflict of interest.

References

  1. Brindley, J.; Blaschke, L.M.; Walti, C. Creating Effective Collaborative Learning Groups in an Online Environment. Int. Rev. Res. Open Distrib. Learn. 2009, 10, 1–18. [Google Scholar] [CrossRef] [Green Version]
  2. Salas, E.; Reyes, D.L.; McDaniel, S.H. The Science of Teamwork: Progress, Reflections, and the Road Ahead. Am. Psychol. 2018, 73, 593–600. [Google Scholar] [CrossRef]
  3. Kumari, N.; Majumder, S. The Impact of Teamwork and Other Factors for Team Effectiveness on Work Performance of Employees. In Innovative Management Practices—An Interdisciplinary Approach with Special Reference to the New Normal; Syedain, G., Kumar, A., Eds.; Allied Publishers: Chennai, India, 2021; pp. 227–232. [Google Scholar]
  4. Hoegl, M.; Gemuenden, H.G. Teamwork Quality and the Success of Innovative Projects: A Theoretical Concept and Empirical Evidence. Organ. Sci. 2001, 12, 435–449. [Google Scholar] [CrossRef] [Green Version]
  5. Mezura-Godoy, C.; Talbot, S. Towards Social Regulation in Computer-Supported Collaborative Work. In Proceedings of the Proceedings Seventh International Workshop on Groupware. CRIWG 2001, Darmstadt, Germany, 6–8 September 2001; IEEE Computer Society: Washington, DC, USA, 2001; pp. 84–89. [Google Scholar] [CrossRef]
  6. Bronstein, L.R. A Model for Interdisciplinary Collaboration. Soc. Work (Stellenbosch) 2003, 48, 297–306. [Google Scholar] [CrossRef]
  7. Kelly, K.; Schaefer, A. Creating a Collaborative Organizational Culture; Kenan Flagler Business School: Chapel Hill, NC, USA, 2014. [Google Scholar]
  8. Hsieh, Y. Culture and Shared Understanding in Distributed Requirements Engineering. In Proceedings of the 2006 IEEE International Conference on Global Software Engineering (ICGSE’06), Florianopolis, Brazil, 16–19 October 2006; IEEE: Piscataway, NJ, USA, 2006; pp. 101–108. [Google Scholar] [CrossRef]
  9. Bedwell, W.L.; Wildman, J.L.; DiazGranados, D.; Salazar, M.; Kramer, W.S.; Salas, E. Collaboration at Work: An Integrative Multilevel Conceptualization. Hum. Resour. Manag. Rev. 2012, 22, 128–145. [Google Scholar] [CrossRef]
  10. van den Bossche, P.; Gijselaers, W.; Segers, M.; Woltjer, G.; Kirschner, P. Team Learning: Building Shared Mental Models. Instr. Sci. 2011, 39, 283–301. [Google Scholar] [CrossRef] [Green Version]
  11. Glinz, M.; Fricker, S.A. On Shared Understanding in Software Engineering: An Essay. Comput. Sci.-Res. Dev. 2015, 30, 363–376. [Google Scholar] [CrossRef] [Green Version]
  12. Mulder, I.; Swaak, J.; Kessels, J. Assessing Group Learning and Shared Understanding in Technology-Mediated Interaction. Educ. Technol. Soc. 2002, 5, 35–47. [Google Scholar]
  13. Bittner, E.A.C.; Leimeister, J.M. Creating Shared Understanding in Heterogeneous Work Groups: Why It Matters and How to Achieve It. J. Manag. Inf. Syst. 2014, 31, 111–144. [Google Scholar] [CrossRef] [Green Version]
  14. Deshpande, N.; de Vries, B.; van Leeuwen, J.P. Building and Supporting Shared Understanding in Collaborative Problem-Solving. In Proceedings of the Ninth International Conference on Information Visualisation (IV’05), London, UK, 6–8 July 2005; IEEE: Piscataway, NJ, USA, 2005; pp. 737–742. [Google Scholar] [CrossRef]
  15. Bittner, E.A.C.; Leimeister, J.M. Why Shared Understanding Matters—Engineering a Collaboration Process for Shared Understanding to Improve Collaboration Effectiveness in Heterogeneous Teams. In Proceedings of the 2013 46th Hawaii International Conference on System Sciences, Maui, HI, USA, 7–10 January 2013; IEEE: Piscataway, NJ, USA, 2013; pp. 106–114. [Google Scholar] [CrossRef] [Green Version]
  16. Vreede, G.-J.; Briggs, R.; Massey, A. Collaboration Engineering: Foundations and Opportunities: Editorial to the Special Issue on the Journal of the Association of Information Systems. J. Assoc. Inf. Syst. 2009, 10, 121–137. [Google Scholar] [CrossRef] [Green Version]
  17. Kleinsmann, M.; Buijs, J.; Valkenburg, R. Understanding the Complexity of Knowledge Integration in Collaborative New Product Development Teams: A Case Study. J. Eng. Technol. Manag. 2010, 27, 20–32. [Google Scholar] [CrossRef]
  18. Kleinsmann, M.; Valkenburg, R. Barriers and Enablers for Creating Shared Understanding in Co-Design Projects. Des. Stud. 2008, 29, 369–386. [Google Scholar] [CrossRef]
  19. Mohammed, S.; Ferzandi, L.; Hamilton, K. Metaphor No More: A 15-Year Review of the Team Mental Model Construct. J. Manag. 2010, 36, 876–910. [Google Scholar] [CrossRef]
  20. Langan-Fox, J.; Anglim, J.; Wilson, J.R. Mental Models, Team Mental Models, and Performance: Process, Development, and Future Directions. Hum. Factors Ergon. Manuf. Serv. Ind. 2004, 14, 331–352. [Google Scholar] [CrossRef] [Green Version]
  21. Agredo-Delgado, V.; Ruiz, P.H.; Mon, A.; Collazos, C.A.; Fardoun, H.M. Towards a Process Definition for the Shared Understanding Construction in Computer-Supported Collaborative Work. In Human-Computer Interaction. HCI-COLLAB 2020. Communications in Computer and Information Science; Agredo-Delgado, V., Ruiz, P.H., Villalba-Condori, K., Eds.; Springer: Berlin/Heidelberg, Germany, 2020; Volume 1334, pp. 263–274. [Google Scholar] [CrossRef]
  22. Lai, E.R. Collaboration: A Literature Review; Pearson Publisher: London, UK, 2011. [Google Scholar]
  23. Kozar, O. Towards Better Group Work: Seeing the Difference between Cooperation and Collaboration. Engl. Teach. Forum 2010, 48, 16–23. [Google Scholar]
  24. Razmerita, L.; Brun, A. Collaborative Learning in Heterogeneous Classes—Towards a Group Formation Methodology. In Proceedings of the 3rd International Conference on Computer Supported Education, Noordwijkerhout, The Netherlands, 6–8 May 2011; SciTePress—Science and and Technology Publications: Setúbal, Portugal, 2011; pp. 189–194. [Google Scholar] [CrossRef] [Green Version]
  25. Barron, B. When Smart Groups Fail. J. Learn. Sci. 2003, 12, 307–359. [Google Scholar] [CrossRef]
  26. Cohen, E.G.; Lotan, R.A. Designing Groupwork: Strategies for the Heterogeneous Classroom, 3rd ed.; Teachers College Press: New York, NY, USA, 2014. [Google Scholar]
  27. Lotan, R.A.; Swanson, P.E.; LeTendre, G.K. Strategies for Detracked Middle Schools: Curricular Materials, Instructional Strategies, and Access to Learning. Middle Sch. J. 1992, 24, 4–14. [Google Scholar] [CrossRef]
  28. Beecroft, D.; Duffy, G.L.; Moran, J.W. The Executive Guide to Improvement and Change; ASQ Quality Press: Milwaukee, WI, USA, 2003. [Google Scholar]
  29. O’Neil, H.F.; Chuang, S.-H.; Chung, G.K.W.K. Issues in the Computer-Based Assessment of Collaborative Problem Solving. Assess. Educ. Princ. Policy Pract. 2003, 10, 361–373. [Google Scholar] [CrossRef]
  30. Salo, J.-P. Shared Understanding of the User Experience: A Case Study of Collaboration Between Developers and Designers. Master’s Thesis, University of Helsinki, Helsinki, Finland, 2020. [Google Scholar]
  31. Chen, J.V.; Nguyen, T.T.L.; Ha, Q.-A. The Impacts of Shared Understanding and Shared Knowledge Quality on Emerging Technology Startup Team’s Performance. Knowl. Manag. Res. Pract. 2022, 20, 104–122. [Google Scholar] [CrossRef]
  32. Malone, M.K.; Lorimer, R. The Importance of Shared Understanding within Football Teams. J. Sport Psychol. Action 2020, 11, 196–210. [Google Scholar] [CrossRef]
  33. Rosenman, E.D.; Dixon, A.J.; Webb, J.M.; Brolliar, S.; Golden, S.J.; Jones, K.A.; Shah, S.; Grand, J.A.; Kozlowski, S.W.J.; Chao, G.T.; et al. A Simulation-Based Approach to Measuring Team Situational Awareness in Emergency Medicine: A Multicenter, Observational Study. Acad. Emerg. Med. 2018, 25, 196–204. [Google Scholar] [CrossRef] [PubMed] [Green Version]
  34. Bates, K.E.; Bird, G.L.; Shea, J.A.; Apkon, M.; Shaddy, R.E.; Metlay, J.P. A Tool to Measure Shared Clinical Understanding Following Handoffs to Help Evaluate Handoff Quality. J. Hosp. Med. 2014, 9, 142–147. [Google Scholar] [CrossRef] [PubMed] [Green Version]
  35. Teunissen, P.W.; Atherley, A.; Cleland, J.J.; Holmboe, E.; Hu, W.C.Y.; Durning, S.J.; Nishigori, H.; Samarasekera, D.D.; Schuwirth, L.; van Schalkwyk, S.; et al. Advancing the Science of Health Professions Education through a Shared Understanding of Terminology: A Content Analysis of Terms for “Faculty”. Perspect. Med. Educ. 2022, 11, 22–27. [Google Scholar] [CrossRef] [PubMed]
  36. Keränen, A.; Ulkuniemi, P.; Hermes, J. Facilitating Shared Understanding of Business Responsibility. In Proceedings of the 2021 International Conference on Transformations and Innovations in Business and Education (ICTIBE 2021), Nanjing, China, 19–20 June 2021; Atlantis Press: Paris, France, 2021; pp. 102–107. [Google Scholar]
  37. van der Helm, A.; Stappers, P.J. Prototyping with A Team: Acting Machines Support Shared Understanding. In Proceedings of the 22nd International Conference on Engineering and Product Design Education, Herning, Denmark, 10–11 September 2020; The Design Society: Glasgow, UK, 2020. [Google Scholar] [CrossRef]
  38. Francis, T.; Kennedy-Clark, S.; Eddles-Hirsch, K.; A’Beckett, C. Developing a Shared Understanding of a Sense of Community in Large Classes. Glob. Res. High. Educ. 2020, 3, 25–34. [Google Scholar] [CrossRef]
  39. Werner, C.; Li, Z.S.; Ernst, N.; Damian, D. The Lack of Shared Understanding of Non-Functional Requirements in Continuous Software Engineering: Accidental or Essential? In Proceedings of the 2020 IEEE 28th International Requirements Engineering Conference (RE), Zurich, Switzerland, 31 August–4 September 2020; IEEE: Piscataway, NJ, USA, 2020; pp. 90–101. [Google Scholar] [CrossRef]
  40. Werner, C. Towards a Theory of Shared Understanding of Non-Functional Requirements in Continuous Software Engineering. In Proceedings of the 2021 IEEE 29th International Requirements Engineering Conference (RE), Notre Dame, IN, USA, 20–24 September 2021; IEEE: Piscataway, NJ, USA, 2021; pp. 498–503. [Google Scholar] [CrossRef]
  41. Hummel, M.; Rosenkranz, C.; Holten, R. He Role of Shared Understanding in Distributed Scrum Development: An Empirical Analysis. In The Role of Shared Understanding in Distributed Scrum Development: An Empirical Analysis; AIS: Bruce, Australian, 2016; pp. 28–45. [Google Scholar]
  42. Dossick, C.; Osburn, L.; Astaneh Asl, B. Measuring Shared Understanding: Developing Research Methods for Empirical Research on Interdisciplinary Engineering Team Practices. In Proceedings of the 15th Engineering Project Organization Conference, Stanford, CA, USA, 5–7 June 2017; Mahalingam, A., Ed.; EPOS: Louisville, CO, USA, 2017. [Google Scholar]
  43. Jentsch, C.; Beimborn, D.; Jungnickl, C.P.; Renner, G.S. How to Measure Shared Understanding among Business and IT. Acad. Manag. Proc. 2014, 2014, 16980. [Google Scholar] [CrossRef]
  44. Kitchenham, B.; Charters, S. Guidelines for Performing Systematic Literature Reviews in Software Engineering; CiteSeer: Princeton, NJ, USA, 2007. [Google Scholar]
  45. Collazos, C.A.; Muñoz, J.; Hernández, Y. Aprendizaje Colaborativo Apoyado por Computador; Iniciativa Latinoamericana de Libros de Texto Abiertos (LATIn): Santa Fe, Argentina, 2014. [Google Scholar]
  46. Oppl, S. Supporting the Collaborative Construction of a Shared Understanding about Work with a Guided Conceptual Modeling Technique. Group Decis. Negot. 2017, 26, 247–283. [Google Scholar] [CrossRef] [Green Version]
  47. Anindi, D.D.; Rochintaniawati, D.; Agustin, R.R. Interactive Animation Construction to Measure Students’ Collaborative Problem Solving Skills in Learning Earthquake. AIP Conf. Proc. 2017, 1848, 060018. [Google Scholar] [CrossRef] [Green Version]
  48. Bondar, K.; Katzy, B.R.; Mason, R.M. Shared Understanding in Networked Organizations. In Proceedings of the 2012 18th International ICE Conference on Engineering, Technology and Innovation, Munich, Germany, 18–20 June 2012; IEEE: Piscataway, NJ, USA, 2012; pp. 1–11. [Google Scholar] [CrossRef]
  49. Arikoglu, E.S.; Blanco, E.; Pourroy, F.; Hicks, B.J. An Empirical Study to Measure the Effectiveness of Scenarios to Aid Shared Understanding of Functional Requirements. In Proceedings of the DS 60: Proceedings of DESIGN 2010, the 11th International Design Conference, Dubrovnik, Croatia, 17–20 May 2010. [Google Scholar]
  50. Humphrey, W.S. The Software Engineering Process: Definition and Scope. In Proceedings of the 4th International Software Process Workshop on Representing and Enacting the Software Process, Devon, UK, 11–13 May 1988; ACM Press: New York, NY, USA, 1988; pp. 82–83. [Google Scholar] [CrossRef]
  51. Hernández-Sampieri, R.; Mendoza Torres, C.P. Metodología de La Investigación, 6th ed.; McGraw-Hill Interamericana: New York, NY, USA, 2018. [Google Scholar]
  52. Sternberg, R.J. Allowing for Thinking Styles. Educ. Leadersh. 1994, 52, 36–40. [Google Scholar]
  53. Lescano, G.; Costaguta, R. COLLAB: Conflicts and Sentiments in Chats. In Proceedings of the XIX International Conference on Human Computer Interaction, Palma, Spain, 12–14 September 2018; ACM: New York, NY, USA, 2018; pp. 1–4. [Google Scholar] [CrossRef]
  54. Lescano, G.; Costaguta, R.; Amandi, A. Genetic Algorithm for Automatic Group Formation Considering Student’s Learning Styles. In Proceedings of the 2016 8th Euro American Conference on Telematics and Information Systems (EATIS), Cartagena, Colombia, 28–29 April 2016; IEEE: Cartagena, Colombia, 2016; pp. 1–8. [Google Scholar] [CrossRef]
  55. Agredo Delgado, V.; Ruiz, P.H.; Collazos, C.A.; Fardoun, H.M.; Noaman, A.Y. Software Tool to Support the Improvement of the Collaborative Learning Process. In Advances in Computing. CCC 2017. Communications in Computer and Information Science; Solano, A., Ordoñez, H., Eds.; Springer: Cali, Colombia, 2017; Volume 735, pp. 442–454. [Google Scholar] [CrossRef]
  56. Neave, H.R. Elementary Statistics Tables, 2nd ed.; Routledge: London, UK, 2011. [Google Scholar]
  57. Mishra, P.; Singh, U.; Pandey, C.; Mishra, P.; Pandey, G. Application of Student’s t-Test, Analysis of Variance, and Covariance. Ann. Card. Anaesth. 2019, 22, 407–411. [Google Scholar] [CrossRef]
  58. Freeman, J.V.; Julious, S.A. The Analysis of Categorical Data. Scope (Kalamazoo) 2007, 16, 18–21. [Google Scholar]
  59. Briggs, R.O.; de Vreede, G.-J.; Reinig, B.A. A Theory and Measurement of Meeting Satisfaction. In Proceedings of the 36th Annual Hawaii International Conference on System Sciences, Big Island, HI, USA, 6–9 January 2003; IEEE: Big Island, HI, USA, 2003; p. 8. [Google Scholar] [CrossRef]
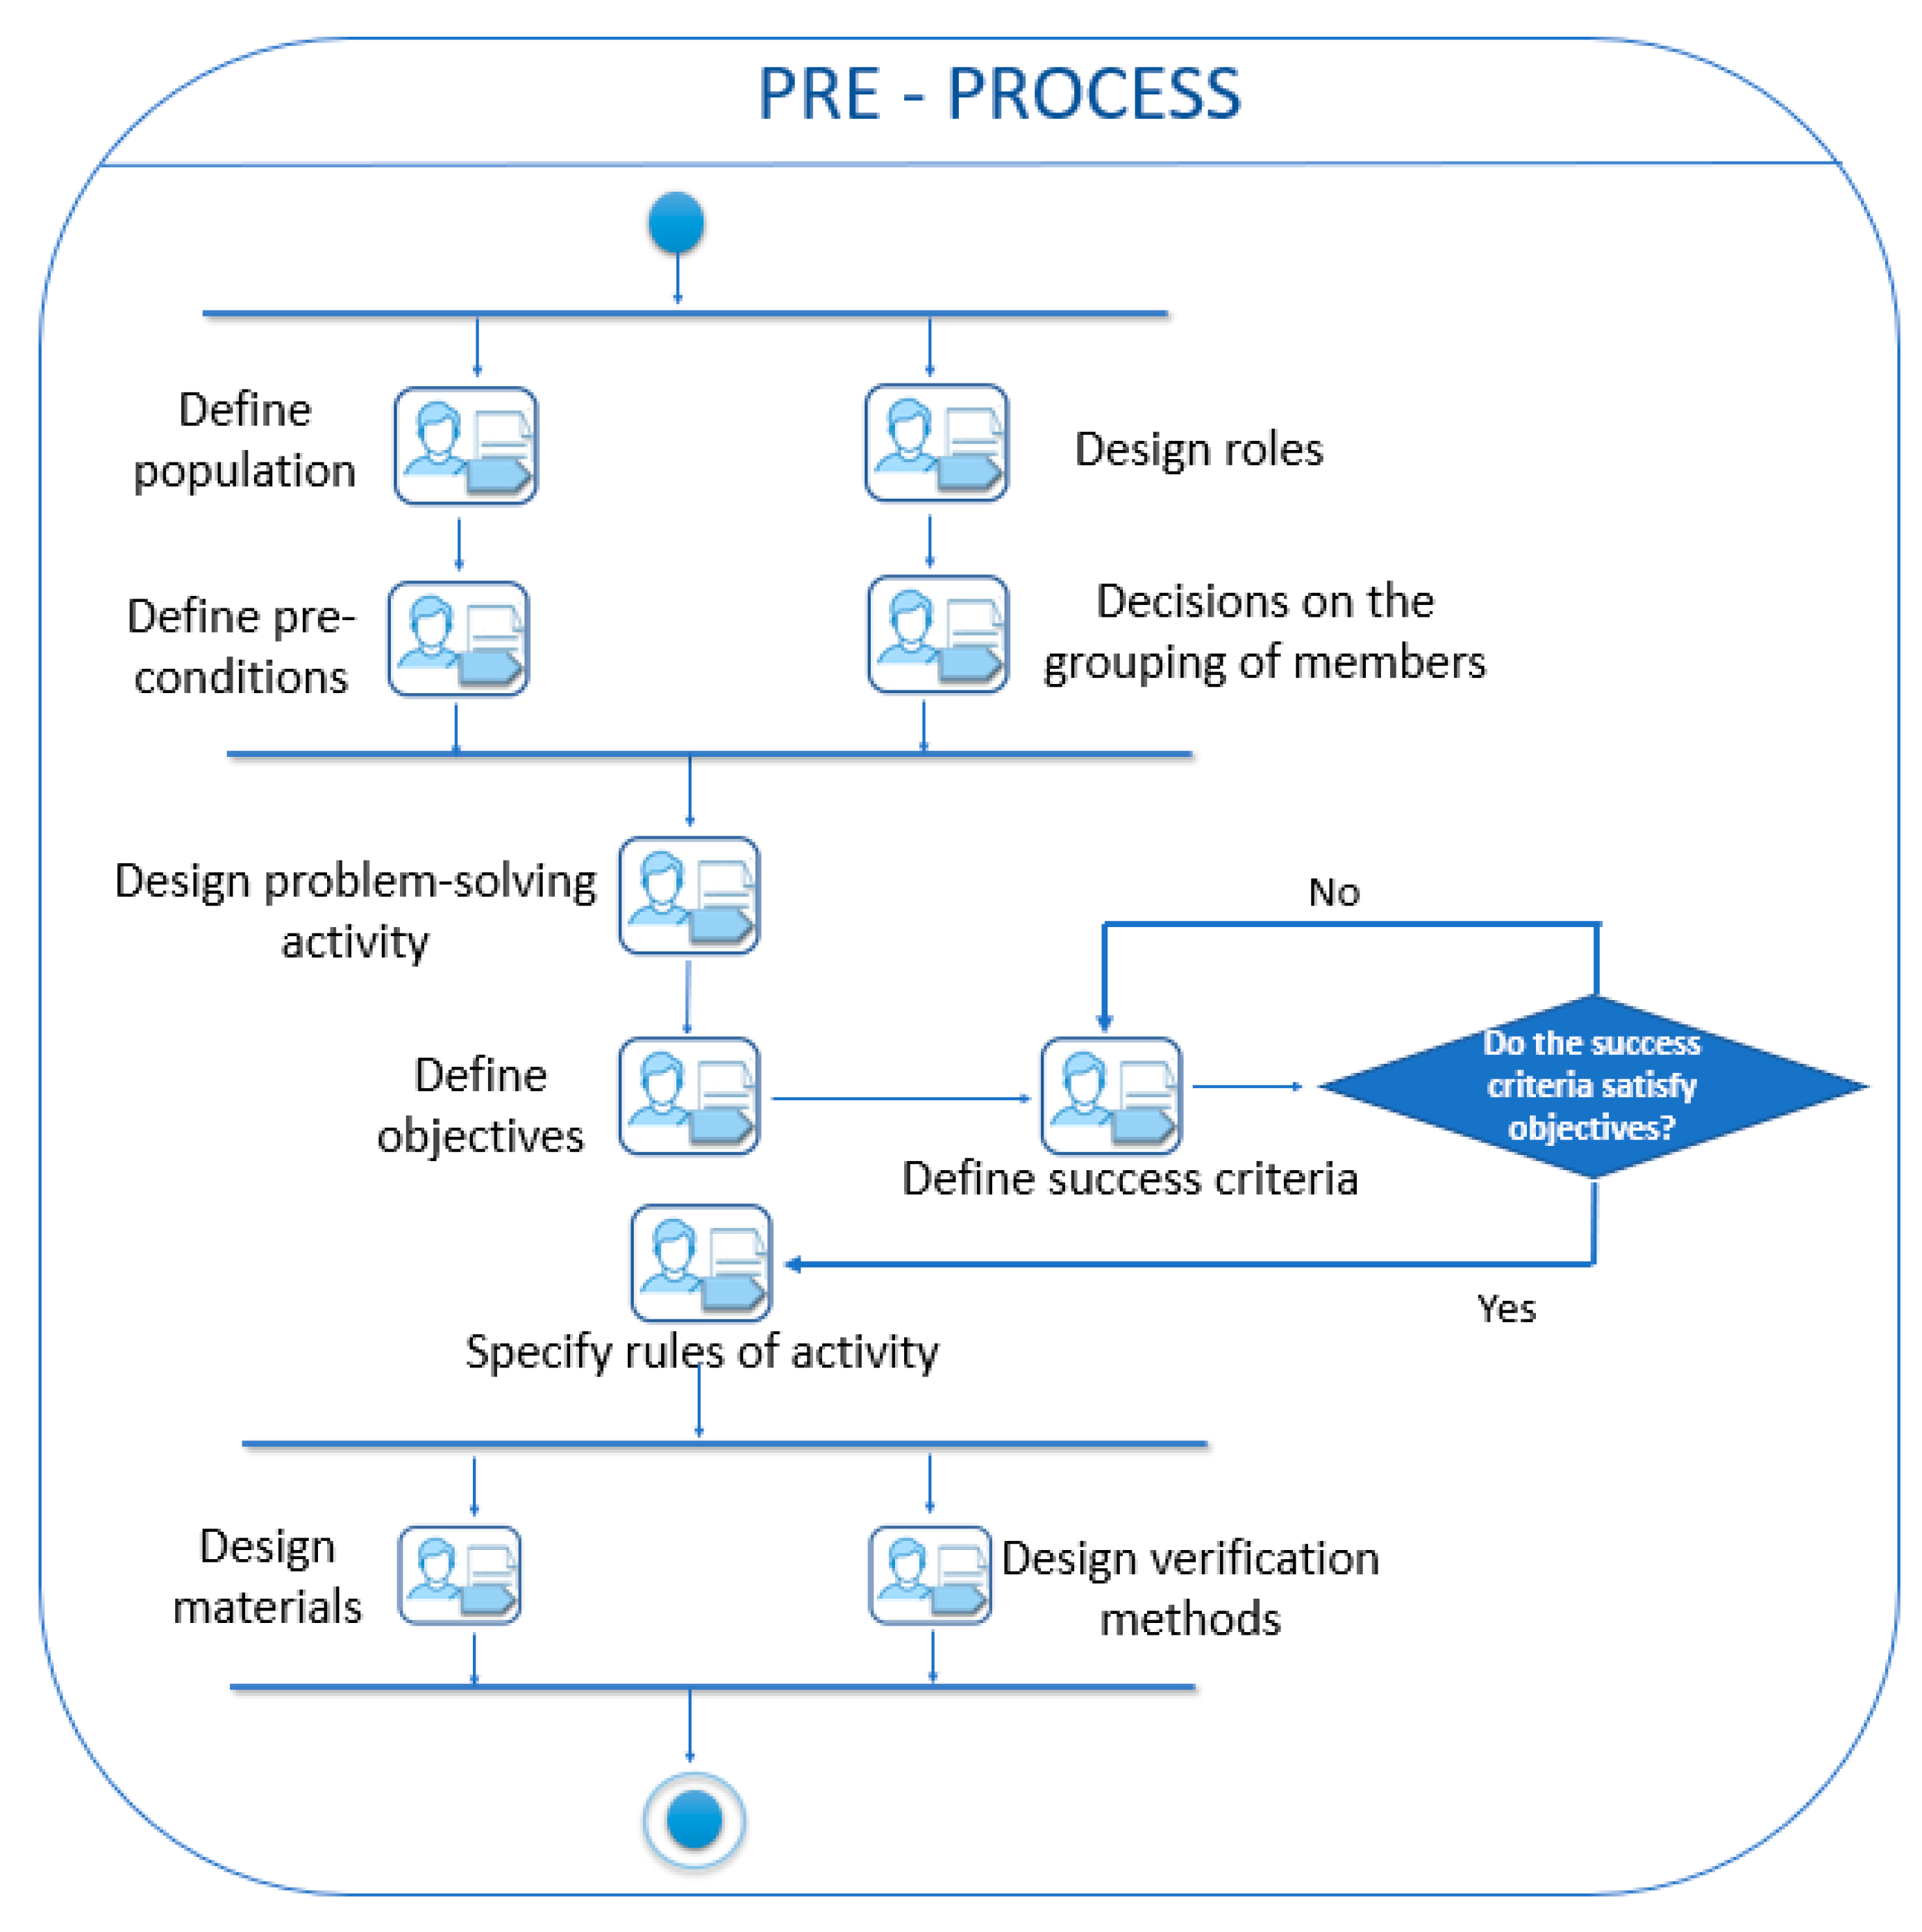
Figure 1. Differences between process versions.
Informatics 09 00039 g001
Figure 2. Workflow of pre-process activities.
Informatics 09 00039 g002
Figure 3. Workflow of process activities.
Informatics 09 00039 g003
Figure 4. Workflow of post-process activities.
Informatics 09 00039 g004
Table 1. Objective of each of the pre-process activities.
ActivityObjective
Define populationDefine the characteristics of the groups that will carry out the collaborative activity. Determine the procedures that will make it possible to identify these characteristics in each participant. Group the characteristics heterogeneously.
Design rolesDesign the role that each participant must fulfil, with the respective responsibilities and duties.
Define pre-conditionsDetermine the knowledge, skills, and abilities that the participants will need to execute the collaborative activity according to the topic and the problem to be solved.
Decisions on grouping of membersOrganize the groups that will carry out the proposed activity, defining their size, the distribution, and selection of the participants that will form them, considering the characteristics defined previously for forming heterogeneous groups. In this task, it is defined to which group each participant belongs.
Design problem-solving activityGuide and structure the design of the collaborative activity, determining each of the tasks that must be carried out to solve the problem among the participants.
Define objectivesClearly define the objectives to be achieved with the problem-solving activity and with the participation of each member of the group, in addition to determining the expected results or products.
Define success criteriaDefine criteria, conditions, or requirements that will make it possible to determine when the problem-solving activity will end successfully.
Specify rules of activityDefine the rules, restrictions, norms, and conditions that will allow controlling behaviors, communication, debates, dates, start and end of each task, and elements of the activity to promote the orderly and controlled development of the activity.
Design materialsSelect existing materials or design new ones necessary to support participants in carrying out the activity and to encourage them to work collaboratively. Define the allocation strategy for these materials.
Design verification methodsDefine the strategy, criteria, and mechanisms that will be used to verify compliance with the problem, the construction of shared understanding, and the performance of the participants.
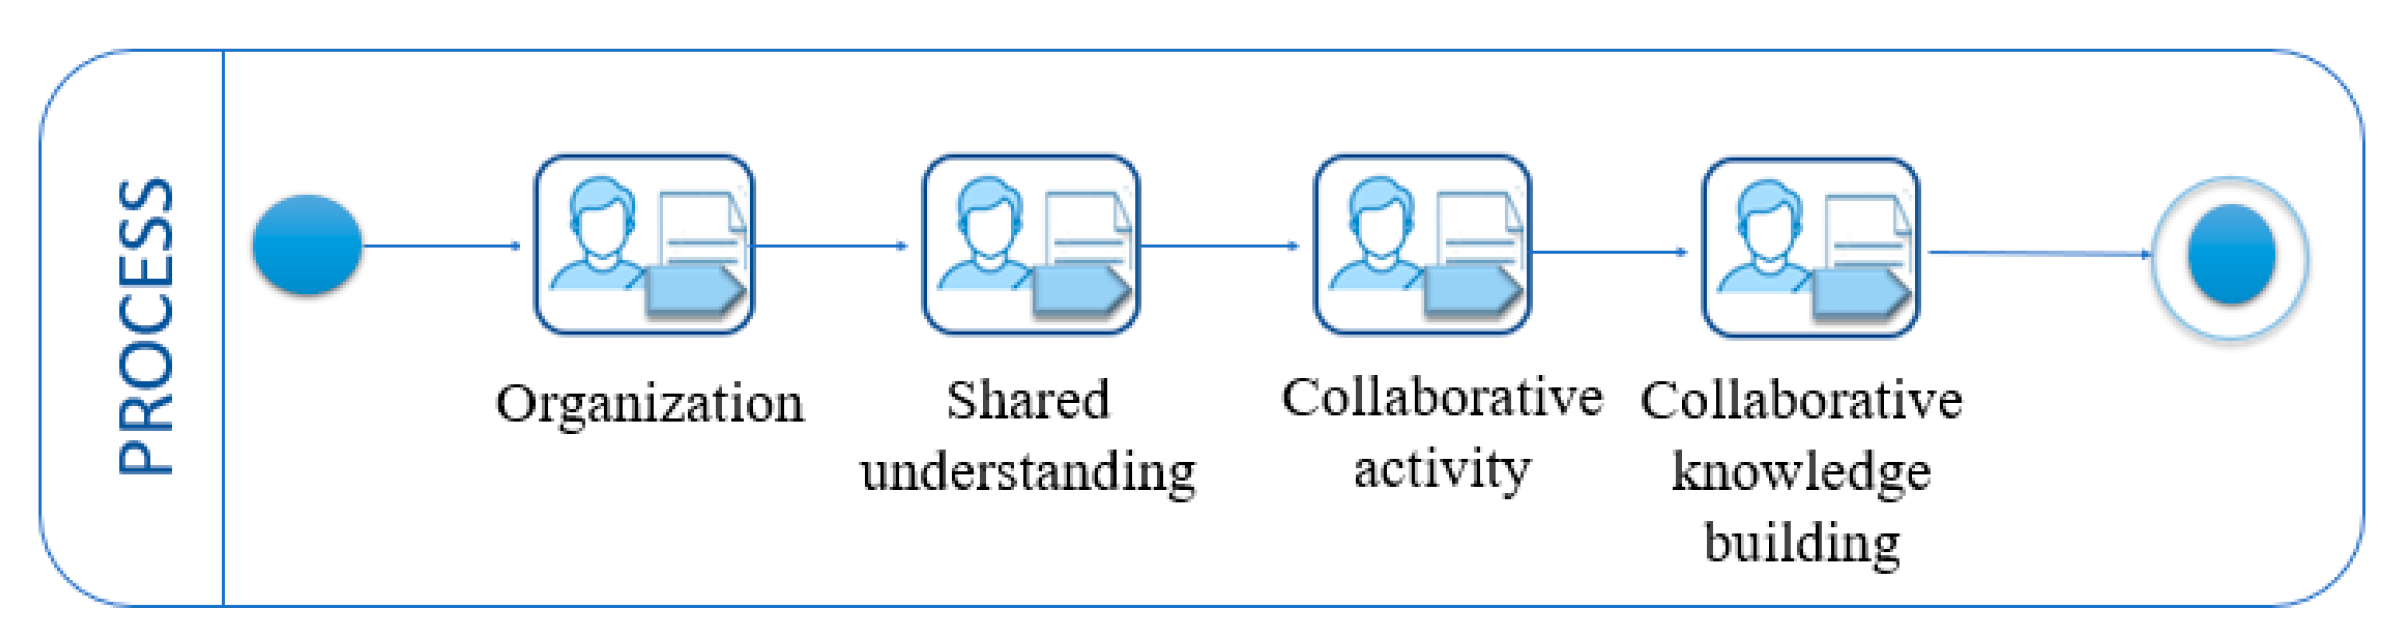
Table 2. The objective of each of the process activities.
ActivityObjective
OrganizationExecute the organization of the groups, assignment of roles, socialization of the activity with its information and assignment of material, in order to organize the necessary elements to begin carrying out the collaborative activity.
Shared understandingEnsure group members agree and understand the activity to be carried out, through individual understanding and socialization, after a debate, for a group understanding that will allow coordinated work.
Collaborative activityExecute the tasks of the collaborative activity to obtain the solution to the problem, with the support of all the members of the group.
Collaborative knowledge buildingGenerate a product (document, map, or graph) with the support of all members of the group, which will allow formalizing the implementation of the solution to the problem.
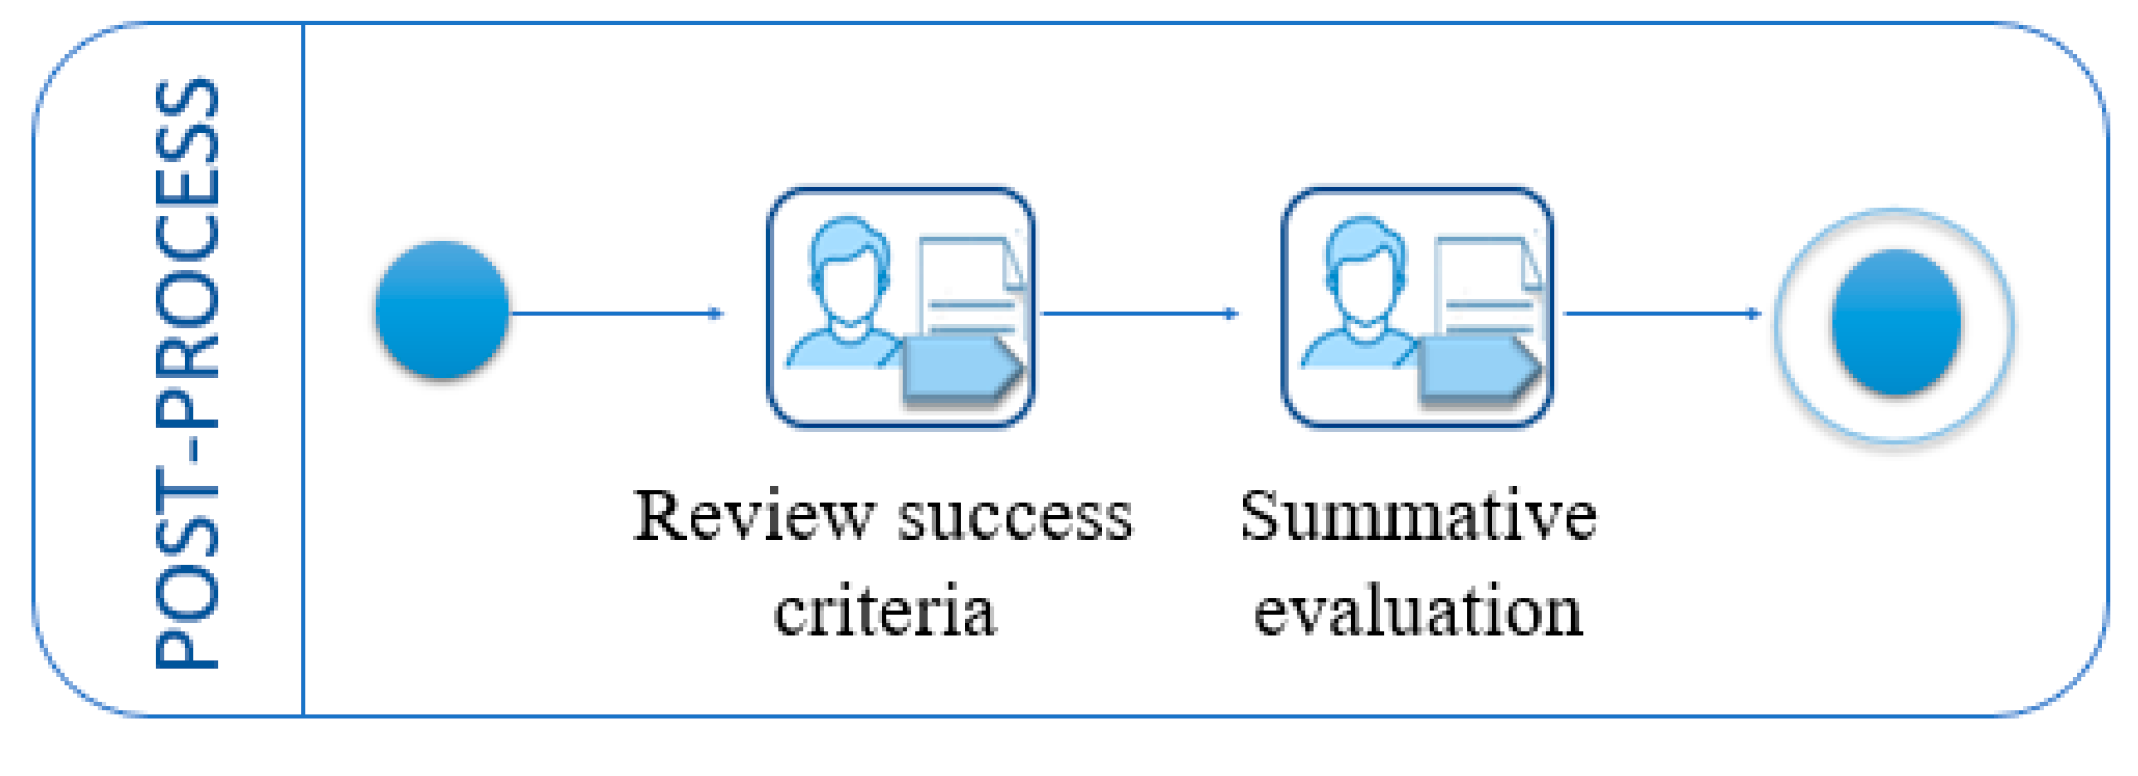
Table 3. The objective of each of the post-process activities.
ActivityObjective
Review success criteriaExecute and apply the strategy, criteria, and mechanisms to verify compliance with the problem, evaluating the achievement of the defined objectives and verifying that the problem was solved.
Summative evaluationExecute and apply the strategy and mechanisms to verify the individual and group performance of the participants to achieve the objectives of the activity and the solution of the problem within each group.
Table 4. Values used for t-tests.
t-Tests Type (a)Type (b) and (c) t-Tests
Reliability level95%95%
Significance level5%5%
Observations or cases1515 (UC), 15 (UF)
Critical value inTwo tailedTwo tailed
Degrees of freedom1428
Table 5. Individual and group scores.
Group
1
Group
2
Group
3
Group
4
Group
5
Group
6
Group
7
Group
8
Group
9
Group 10Group 11Group 12Group 13Group 14Group 15Average
Individual score22.8222.532.82.332.5322.332.52.51
Group score3.13.2232.553.8353.142.52.83.533.51
Table 6. UC and UF group scores.
Group
1
Group
2
Group
3
Group
4
Group
5
Group
6
Group
7
Group
8
Group
9
Group 10Group 11Group 12Group 13Group 14Group 15Average
UC Group score3.13.2232.553.8353.142.52.83.533.3
UF Group score32.832.421.62.523.423.521.532.62.49
Table 7. Obtained values of classifying other descriptions.
Very UnclearUnclearNeutralClearVery Clear
1.10%1.70%15.60%35.50%46.10%
Table 8. Obtained values of classifying the opinion of other descriptions.
Completely DisagreeI DisagreeNeutralI AgreeI Completely Agree
1.10%1.70%15.60%35.50%46.10%
Table 9. Measures of shared knowledge and discrepancy in knowledge.
Group 1Group 2Group 3Group 4Group 5Group 6Group 7Group 8Group 9Group 10Group 11Group 12Group 13Group 14Group 15Average
Measure 1Pre3312.833.221.62.432.31242.52.45
Post43.813.43.843.83.63.84343.54.52.53.51
Measure 2Pre1111.410.62.22.21.6121.42.2211.45
Post0.20.210.60.40.001.40.40.40.511.52320.97
Table 10. Obtained t-test values.
t-ValuepCritical Value
Measure 1−5.2330.000132.145
Measure 22.4340.0292.145
Table 11. Measures of shared knowledge and the discrepancy in knowledge in UC vs UF (post).
Group 1Group 2Group 3Group 4Group 5Group 6Group 7Group 8Group 9Group 10Group 11Group 12Group 13Group 14Group 15Average
Measure 1UF1.41.11.621.231.41.33.122.53.11.11.421.88
UC43.813.43.843.83.63.84343.54.52.53.51
Measure 2UF3.22.42.633.521.5143.23.22.621.52.62.55
UC0.20.210.60.40.001.40.40.40.511.52320.97
Table 12. Obtained t-test values.
t-ValuepCritical Value
Measure 15.6870.0000042.05
Measure 2−5.1340.0000192.05
Table 13. Tasks of the shared understanding stage for UC and UF.
Group 1Group 2Group 3Group 4Group 5Group 6Group 7Group 8Group 9Group 10Group 11Group 12Group 13Group 14Group 15Average
UCC3.6673.6003.5333.0833.4293.4173.5333.0003.1333.42933.2413.63.0683.4223.344
CoC3.6253.3003.2002.6253.2003.3753.3003.5003.1003.4513.1872.8733.6253.1283.7653.283
CC3.3753.3003.2502.6883.1503.2503.1503.0833.2003.7894.2314.6513.8753.6543.8123.497
UFC2.6913.0003.1112.5642.3143.1332.5642.1432.87333.1892.6913.1113.1332.922.834
CoC3.0002.8752.6252.4312.1222.8612.9013.1132.7301.8762.7112.5423.1652.4122.7132.672
CC2.7503.1112.6752.6542.1252.8712.6152.2433.8712.7612.2132.7611.8712.7161.7612.667
Table 14. Obtained t-test values.
t-ValuepCritical Value
Construction4.9320.0000332.048
Co-construction5.1240.0000202.048
Constructive conflict4.3790.000152.048
Table 15. UC and UF scores for the activity results.
Group 1Group 2Group 3Group 4Group 5Group 6Group 7Group 8Group 9Group 10Group 11Group 12Group 13Group 14Group 15Average
UC3.34.13.343.544.64.34.54.53.243.243.93.89
UF2.83.22.43.12.832.9332.62.142.12.122.74
Table 16. UC and UF survey answers of perception of collaboration.
Group 1Group 2Group 3Group 4Group 5Group 6Group 7Group 8Group 9Group 10Group 11Group 12Group 13Group 14Group 15Average
UCAO3.6124.1232.8313.33434.1234.8213.4154.6213.3144.1262.3563.5723.4553.1233.52
SP3.2213.7233.2403.2703.3324.3813.4523.2554.1694.1543.7613.7973.2534.1354.6813.72
SO3.5424.2642.8362.6423.7412.1352.1453.7324.4393.7614.1872.8653.6544.4213.7543.54
UFAO2.3123.4372.5412.2142.7612.2343.5423.1222.7632.5432.8712.1233.2012.6792.1342.69
SP3.2423.7613.1232.8764.2133.9873.7673.2123.7614.1233.7623.8714.3213.7673.8763.71
SO2.8543.2123.1562.5413.8664.2112.7684.3413.9764.7654.3213.8612.9673.9214.2133.66
Table 17. t-test obtained values.
t-ValuepCritical Value
Achievement of the objectives (AO)4.2760.00022.048
Satisfaction with process items (SP)0.0650.9482.048
Satisfaction with activity outcome (SO)−0.4930.6252.048
Publisher’s Note: MDPI stays neutral with regard to jurisdictional claims in published maps and institutional affiliations.

