Article

The C2G Framework to Convert Infrastructure Data from Computer-Aided Design (CAD) to Geographic Information Systems (GIS)

by
Mohamed Badhrudeen
1,*,
Eric Sergio Boria
2,
Guillemette Fonteix
1,
Michael D. Siciliano
2 and
Sybil Derrible
1
1
Department of Civil, Materials, and Environmental Engineering, University of Illinois at Chicago, Chicago, IL 60607, USA
2
College of Urban Planning and Public Affairs, University of Illinois at Chicago, Chicago, IL 60607, USA
*
Author to whom correspondence should be addressed.
Submission received: 18 March 2022 / Revised: 26 April 2022 / Accepted: 5 May 2022 / Published: 11 May 2022
(This article belongs to the Special Issue Building Smart Cities and Infrastructures for a Sustainable Future)

Abstract

:
Making smart and informed decisions often requires the integration and analysis of large amounts of data. However, integrating these data is rarely straightforward, mainly because of heterogeneities in data structure and format. In this study, we focus on two widely used data formats by municipalities to store digital maps of their infrastructure: Computer-Aided Design (CAD) and Geographic Information Systems (GIS). While most municipalities still maintain infrastructure data in CAD format, many have started converting them to GIS since GIS includes geographical coordinates. However, the inherent differences between these two formats pose challenges to accurately converting information from CAD to GIS. The main goal of this study is to develop a procedure to help municipalities to perform CAD-to-GIS conversion. To that end, potential problems in CAD-to-GIS conversion were first identified through interviews with practitioners at different U.S. municipalities and through a literature review. Taken together, we propose the C2G framework to streamline the conversion process while minimizing information loss. The framework consists of five stages, and the execution of this framework and tasks involved in each stage are explained. Moreover, we apply the framework to real-world underground stormwater infrastructure data obtained from the University of Illinois at Chicago (UIC) to illustrate the framework’s applicability. The case study explains details about the technical difficulties we encountered in the process and provides recommendations to circumvent those difficulties. The results from the case study showed that the C2G framework was able to successfully convert CAD data to GIS data. Although the framework is developed specific to the needs of CAD/GIS practitioners in the US municipalities, it can be adopted in most CAD-to-GIS conversion situations. The information learned during the interviews supports the need for a standard CAD-to-GIS conversion process. The contribution of this study is to fill this gap by developing a generalized framework to carry out CAD-to-GIS conversion which only requires basic knowledge of CAD and GIS.

1. Introduction

Access and use of accurate and reliable data play a crucial role in smart city development, enabling policymakers to identify problem areas and design appropriate policies. However, integrating data from multiple sources can prove to be difficult because of inherent differences in how the data are created, formatted, stored, and managed [1]. To address this issue, methodologies need to be created to facilitate data integration, conversation, and interoperability [2]. Traditionally, information on municipal/utility infrastructure assets has been stored in two-dimensional (2D) Computer-Aided Design (CAD) format [3,4,5]. While CAD offers many benefits and is extensively used for buildings, it also has some drawbacks when it comes to infrastructure systems. Specifically, it often does not include geographic information. This is particularly a problem for underground infrastructure whose entire networks have grown over decades if not centuries [6]. In fact, the locations of water conduits and gas pipelines are generally not documented accurately [5,7]. More broadly, Fenais et al. [8] find that 50% of the underground infrastructure in the United States (U.S.) is known only by its approximate location. The lack of knowledge on the location of underground infrastructure can generate significant problems, including in terms of operation and maintenance. As a result, many authorities and industries have started converting their 2D CAD data into Geographic Information Systems (GIS) databases that include geographical coordinates [5,9]. Furthermore, the potential use of GIS in the departments of transportation, urban planning and design, and waste management prompted many municipal governments across countries to adopt GIS applications [10]. For instance, transport modeling software including Citilabs’ CUBE and TransCAD uses a GIS interface to perform multi-modal transportation analysis [11]. The conversion of CAD and GIS data is however challenging as the two formats were initially developed for different purposes and thus have different properties. For example, CAD allows users to design and view objects in a detailed manner, whereas GIS allows users to analyze and view objects in relation to other objects with less detail [12]. CAD data rely on computer graphics techniques to process the information and show it on a 2D screen [13]. Moreover, compared to CAD, GIS allows more flexibility in managing, analyzing, updating, and processing data [14]. While CAD tools focus more on the accuracy of the object’s geometry, they do not consider topography and spatial constraints [15]. Furthermore, performing any statistical analysis on CAD data is not possible [16]. Given the inherent difference in the data models (further discussed later), converting CAD files to GIS directly creates numerous errors leading to unreliable data.
CAD primarily involves drawing objects digitally. Some advantages of CAD include the development and visualization of precise engineering drawings with precision. CAD also provides better documentation. CAD drawings include measurements and other specifications such as meta information and materials of the physical objects and scale. The specifications depend on the types of objects stored in the CAD data. For example, if the object is a pipeline, the information could include pipe diameter, pipe materials, the year it was installed, and elevation. In this study, we used AutoCAD, which is a well-known and widely used software package developed by Autodesk. Only a few studies in the literature have investigated the technical difficulties of converting CAD data to GIS. A study by He et al. [17] found that coordinate transformations and feature distortions are some of the common problems that need to be addressed during the conversion process. A similar study by Xie et al. [18] delineated the steps that would minimize the loss of information during the conversion process. The steps included pre-analysis, conversion, and adjusting. Further, attention should be given to the representations of annotations and labels from CAD data as it contains information about the design objects [19]. Moreover, in converting transport infrastructure CAD data, Wang et al. [20] identified data organization, coordinate system, topography and properties, and annotations as some of the basic problems to address. Another common difficulty in conversion is the reference system [21], particularly georeferencing. CAD data often relies on local coordinate systems and provides wrong information in relation to the object’s actual geographic position [22].
Several third-party software packages are available for the conversion and provide GIS shapefiles as output. For example, the company Guthrie CAD::GIS developed a product to convert CAD data into GIS data. Specifically, it takes files in AutoCAD formats .dwg/.dxf and converts them into ESRI shapefiles (.shp) [23]. However, these packages are prone to other problems, such as not being projected to the correct coordinate system and thus introducing feature distortions [24]. For example, Feature Manipulation Engine (FME), a third-party software, is found to have problems in geometry conversion [13]. These problems were found in converting Building Information Model (BIM) data to GIS data as well. Additionally, existing commercialized third-party software can be expensive and cost-prohibitive for some municipalities and other organizations. In contrast, protocols exist to convert GIS data into a network, but they do not address CAD-to-GIS conversion issues [25]. Overall, while tools and procedures are available to tackle the technical difficulties listed here, a comprehensive definition of the requirements and clear rules to perform those procedures are still lacking [26].
The main goal of this article is to provide a framework that help authorities and industries convert CAD data into GIS while minimizing the loss of information during the conversion process. The specific objectives are as follows:
  • Interview municipality employees to better understand the needs and difficulties they encounter;
  • Propose a framework to guide the conversion;
  • Demonstrate the framework through a case study.
The rest of the article is organized as follows. Section 2 explains the information gathered from the municipal employees through the interviews. It further discusses the motivations, challenges, and recommendations associated with CAD-to-GIS conversion. Section 3 discusses and explains the proposed framework called C2G for CAD-to-GIS framework. Section 4 applies the proposed framework through a case study. Finally, Section 5 concludes this article.

2. Materials

2.1. Municpal Employees Interviews

Our aim is to gather information about current practices and challenges encountered in CAD-to-GIS conversion and then develop a framework to streamline the conversion process. To gather information, we conducted qualitative, semi-structured interviews with GIS analysts and managers working with eleven municipalities across the U.S. We designed the questionnaire to explore what challenges practitioners experienced and how they went about resolving those issues.
We only considered municipalities in the U.S. with a population of at least 10,000 residents. The justification for this population requirement is the assumption that municipalities need a minimum population, as a proxy for the municipal budget, for example, to be able to potentially support hiring GIS personnel. A random number generator was applied to the list to generate a sample list. Out of the 40 municipalities contacted, interviews were conducted with 11. The selected municipalities also have control over managing at least one of the following infrastructures: water, sanitary sewer and/or stormwater sewer. Practitioners interviewed had some experience with converting data from CAD to GIS and working with data from water, sanitary sewer, and/or stormwater sewer systems. To understand how municipal employees convert infrastructure data from CAD to GIS, it first requires asking why such a conversion is necessary. The following interview quote indicates a reason:
“So [the engineers] go out and GPS the underground stuff, which is what they really want to know where it is. They take that and they bring it into CAD cause that’s what they’re familiar with. And then they shipped the CAD files over to us [the GIS Department] and we bring it into our GIS and also into our asset management system.”
(Interview 005, 12 July 2018)
As stated in the above quote, those who are familiar with CAD prefer to work in that format, which then requires conversion to GIS. Further, interviewees stated that certain functions, such as building design, can be conducted more easily in CAD. Municipalities often hire GIS analysts and managers and, in some cases, have created GIS departments, depending also on the available budget. Some of the reasons given for the emphasis on GIS-based data are stated in the following quotes:
“So it’s for better accessibility for everybody else who’s in the municipality to access that data.”
(Interview 004, 11 July 2018)
“The main benefit of converting [data] to GIS is you work with your asset management system. And retrieval is much easier for an online mapping.”
(Interview 005, 12 July 2018)
“I think you realized that many cities struggle, us included, in terms of how to handle all of that information. There is a component of making interactive maps that’s becoming more prevalent and it’s nice to have that for some of the field work, but we still extensively make static maps, whether that’s in paper form or creating a PDF that’s going to go out to people and being able to do that. It’s difficult to in CAD, I know they can make some maps but they just don’t have the same accessibility in terms of being able to read them and get information off of them.”
(Interview 011, 19 July 2018)
The interviews also revealed that some municipalities give more initial importance to the completeness of infrastructure than the accuracy of their locations. The reason being that engineers and other public works employees in the field primarily need to know what is supposed to be underground where they plan to dig. Then, they will use their standard practices to survey the location and find the precise locations of relevant structures. Interviewees spoke about the collective experience of those working in the field to know the details of underground structures gained through years of doing the work. In addition to the analysis and presentation of data in GIS, a common theme underlying the process of converting data to GIS is to create a process to systematically maintain, build upon, and improve the knowledge of the field, as summarized in the following quote:
“I think the short-term goal is to get all the information that is in a few of the older employees’ heads and memories into the PC [personal computer] and GIS. So that when they leave, when they retire, that we’re not going to lose all that information.”
(Interview 011, 19 July 2018)

2.2. Reported Challenges in the Conversion Process

The steps that require the most time and present the most difficulties to those interviewed were most often structuring attributes (georeferencing). Much of this data was either not converted from CAD or not collected even for the CAD drawing. Additional challenges municipal employees faced included incomplete and inaccurate data. This may arise from a difference in understanding what data are necessary to collect for decision making. For example, as evidenced in the following quote, data collection should be aligned with decision making needs:
“a lot of the prioritization comes from working with the engineering department in terms of what they have said that they want to look at in the future as well as working with our utilities department to see what attributes they’re interested in as well for maintenance and … what information is useful for them when they’re in the field.”
(Interview 011, 19 July 2018)
Even if the data existed in the original CAD files, there could have been errors in how it was originally recorded. The following description exemplifies how inaccurate data can end up in CAD and subsequently introduce errors into the GIS database:
“the old stuff, … the old pipes in the ground for a long time. When we originally collected the data, we had an intern go around with one of the older guys that [has] been there a while and he’d say, well this is a six inch and I think it’s AC and it was put in and the 60s, so it would get an install date of 1960. So, the older stuff was kind of 40, 50, 60, 70, until we really start to nail down when the actual installation day was. So that the problem was that they didn’t quite remember correctly and they say, I think it’s right here. So, we draw it in here and then they’d go to dig it up and starting digging sideways until they actually found it. So, the locations were off because the data wasn’t kept. And then … the sizes were different than what they thought they were. the pipes were occasionally different than what they thought they were also.”
(Interview 005, 12 July 2018)
Thus, the first step in the conversion process is to identify the data the municipality needs and set up a process to encourage the collection and submission of that data. GIS managers reported that their preferred solution was to send workers into the field to check the accuracy of the data and insert those verifications or updates directly into GIS. These challenges are summarized in Table 1.

2.3. Solution Recommended

We wanted to know how the reported challenges could be mitigated, particularly the actions they recommend to achieve that. The responses can be summarized into the following three types of standards: completeness of data, naming conventions, and accuracy of data. Firstly, practitioners recommended ensuring the delivery of complete data to be converted into GIS. This would apply to contractors, developers, and engineers who provide the construction data to the GIS department. One interviewee expressed this request as such:
“We would have to … push it back onto developers where they would be responsible for providing the Autocad [files] and then they would also provide shapefiles, feature classes of what we’re interested in, and we would define what those are, and then they’d be providing all of that data input already and a geodatabase template that has domain feature classes all set up with all the data that we want them to fill in.”
(Interview 011, 19 July 2018)
The second recommendation was to use standard naming conventions across departments. Information about the infrastructures is shared across many departments within a city using centralized systems. Furthermore, efforts have been made to develop data standard practices to handle the mismatch between different data formats [27], particularly for municipal infrastructure systems data [28]. In most cases, one person would be responsible for creating and updating the information, while at least more than five people would be using the information [5]. As such, implementing standard naming conventions could potentially reduce the ambiguities in understanding the information by someone from another department. Thus, improving the reliability of the locally produced GIS data. As stated by one of the interviewees below, in most cases, GIS data are preferred over CAD data:
“If other cities would ask us for data, we would definitely share with them. They’re working on a project that shares borders on our boundary. That happens often—sharing data with other developers or engineering firms. And sharing that data via GIS and shapefiles or geodatabases work best rather than through CAD.”
(Interview 011, 19 July 2018)
Other recommendations relate to the accuracy of the data. Here, the accuracy meant the location information of objects in relation to each other, i.e., topology. Although the topological problem might not be pronounced in CAD, it creates difficulties during the GIS conversion process. An example of interviewees finding solutions to conversion challenges is seen in the following description. where a manual sampling of data points was employed to resolve topology problems:
“Yes, we have had topology problems, especially when we started working with geometric networks. There’s all kinds of other issues that we’ve run into. They’ve tried a bunch of different things within CAD or engineering texts in terms of trying type network set of things and it’s just inconsistent for getting everything all linked together. So, there’s a certain amount of fixing that we will do. We’ll import that data and usually project my project so it’s not a huge extent of data. So, it will come in, we’ll ensure that it’s in the correct location. Sometimes they’ll have forgotten to correctly project the data, so we’ll have to send it back to them to get it projected in CAD and then we’ll import it to our GIS and we’ll look at it. And if it’s not hooking into our existing line networks, we’ll manually just attach it to the known networks, just to ensure that it’s kind of taking care of some of that stuff. So, it’s, inspected manually, but you know, it’s usually two or three spots where you have to connect it into existing networks.”
(Interview 011, 19 July 2018)
The issue arises if each GIS analyst or municipality uses their own, different solutions to such problems. This will result in slight differences in GIS-based maps from one municipality or organization to the next. Thus, the need arises for a standard conversion process.

3. Methods

This section details the framework we developed based on the insights derived from the interviews. We developed the proposed framework by combining the challenges and recommendations listed by the interviewees. Our aim was to develop a framework that was easier to apply and follow, mainly by the practitioners who have working knowledge of either CAD or GIS. Figure 1 shows the proposed framework.

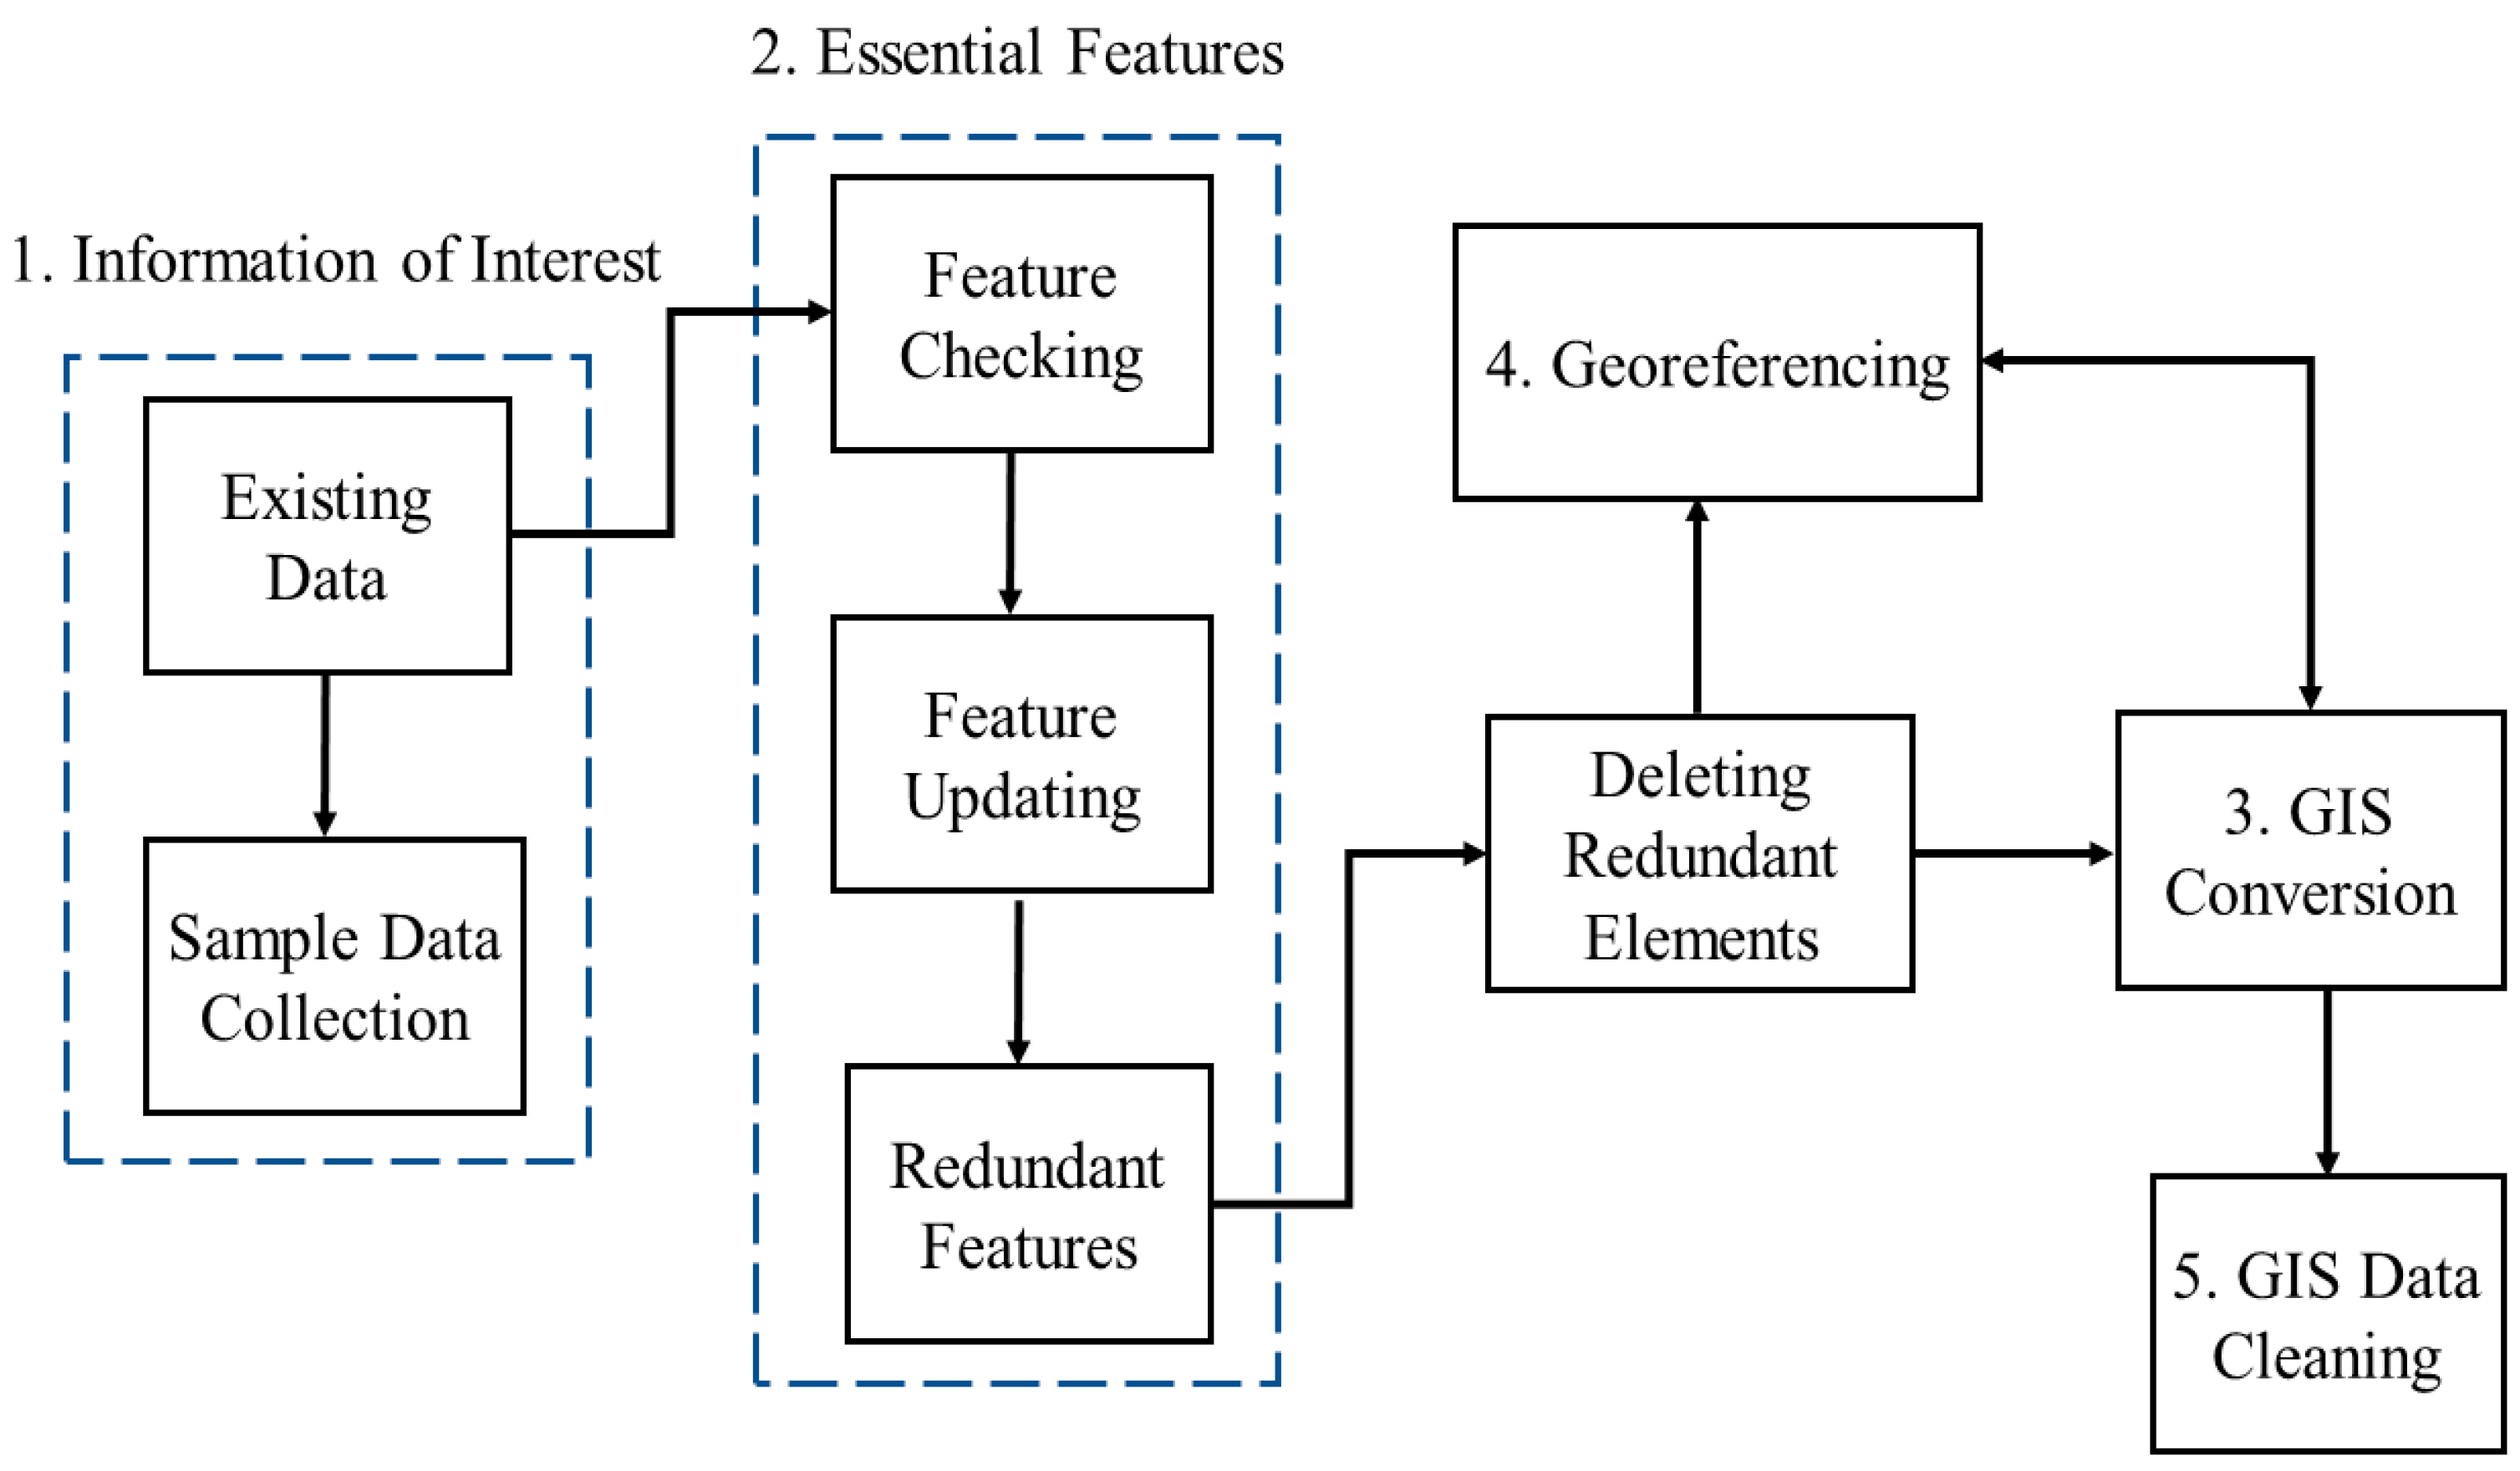
3.1. C2G Conversion Framework

3.1.1. Information of Interest

Step 1 is generally implemented through the organization of discussions between all actors to collect the information required and the final structure desired to facilitate the following four steps. For example, if the information is to be used by different departments in an organization, then the necessary information that is missing should be identified and included in its current form (e.g., geometry, age). This step addresses the two challenges pointed out by the interviewees in Section 2.1; that is, each department is interested in specific entities and incorrect specification of features’ location. It includes the collection of field data regarding natural and constructed infrastructure systems. The interviews with municipal GIS managers revealed a wide diversity of data types collected by municipalities. While some municipalities are advanced in establishing GIS departments and have procedures in place to upload data in GIS format on municipal infrastructures such as water distribution, some departments collect department-specific data and maintain the said data locally [28]. For example, the data collected for building construction projects tend to be CAD drawings (in .dwg format), as CAD is preferred by engineers who are working on building construction projects.
Step 1 also helps with the “feature checking” process in step 2. In addition, if needed, new data can also be collected and can be added to the existing CAD data. This process helps GIS managers to identify the type of utility (e.g., a sewer pipe network) and the accuracy of its location. The metadata—that is, the information that categorizes the data—need to be accurate and up to date. They indicate how, where, when, and by whom the data were collected. Metadata also compile the data assets into an inventory and provide information such as to whom they are available, their projection and coordinate system, and when they were last updated. Keeping these records will reduce duplication and will allow GIS managers to save time. For example, problems related to the misidentification of CAD features can lead to accidentally introducing errors when working in GIS. Developers and utility providers have a vested interest in assessing the accurate location of their infrastructures in relation to other public and private infrastructures that could be co-located in underground space.

3.1.2. Essential Features

The goal of step 2 is to identify and remove redundant and unnecessary feature information directly in CAD; this step can significantly facilitate the GIS cleaning process, part of step 5. For example, CAD maps may have data on sidewalks that may not be needed in GIS, and it may be preferable to remove the sidewalks directly in the CAD file. However, it should be noted here that redundant features are agreed upon in step 1 based on the information of interest. Annotations offer another good example as most CAD drawings contain information as text that is recognized as polylines in GIS, and it is, therefore, preferable to remove them directly from CAD files if possible. Nonetheless, instances also exist where annotations give important information about the features and thus should be included in GIS in some other form (e.g., pipe diameter that should be included in the attribute table in GIS).
In addition, because topology and geometry problems in CAD maps may be transferred in the conversion process, several problems could arise when performing spatial analysis in GIS. For example, a common topology error after converting CAD data is with polylines that do not meet perfectly at a point. It is cumbersome to carry out this process manually, especially in cases where the CAD drawings contain more information that splits a polyline or polygon (discussed later).

3.1.3. GIS Conversion

Step 3 tends to be a straightforward process as many GIS software packages (including ESRI’s ArcGIS and QGIS) have an option to read CAD data from their GIS platform [29]. That said, although information in CAD can be accessed on GIS platforms, the initial information is scattered over different classes based on the objects’ geometry. For example, upon transferring the CAD drawing to the GIS platform, ArcGIS divides the vector data into four layers or classes: point, polyline, polygon, and annotation. Essentially, the points, lines, and polygons are converted into shapefiles, which is a format recognized by most GIS software packages that store geospatial information as vectors. This shapefile consists of three main files: geometry information in “.shp” format, spatial index data in “.shx” format, and semantic information of features (objects) in “.dbf” format [30]. Because annotations do not occupy space, they are simply not exported as shapefiles. They can, however, be manipulated as a GIS feature class in GIS.

3.1.4. Georeferencing

While shapefiles are created for each feature—that is, the points, polylines, and polygons—they do not have a known coordinate system. This is an important part of the process, usually referred to as “georeferencing,” the fourth step of the process, in which the location of each feature is assigned.
Specifically, georeferencing is a process of adding geographic information to the data so that the GIS software package can properly locate the features geographically. Many processes exist to carry out this step, and a common process is shown in Figure 2. To carry out the georeferencing process, we need to have a shapefile (reference data) with the desired coordinate system and features such as buildings that also exist in the converted CAD-to-GIS shapefiles. Keeping the reference data as a base, the converted shapefiles are then moved until they match the reference shapefile. Finally, the same coordinate system of the reference data can be applied to the converted shapefiles. We should highlight here that it is important to ensure the geometry of the infrastructure is accurate before starting the georeferencing, hence the need to carefully carry out steps 1 and 2 first.

3.1.5. GIS Data Cleaning

Since not all the conversion issues can be addressed in CAD, some have to be addressed after the GIS conversion. This step is most often performed manually by GIS experts with knowledge of the infrastructure being converted, but some studies have attempted to develop machine learning algorithms to help with the identification of errors [31], and more work is expected in the future to help automate this process.

3.2. Common Problems

Table 2 lists the common problems encountered (or expected to be encountered) during the conversion process. While the problems listed are not exhaustive, they do represent some of the most frequent issues. For some of the common problems listed below, more details are provided in this section.

3.2.1. Texts in CAD Data

Placements of texts in CAD data can create topology problems after the conversion to GIS, as illustrated in Figure 3. Texts are used in CAD to convey some information such as pipe diameter, building name, street name, and so on.
If the CAD data are converted into GIS, as represented in Figure 3, the space where the text ‘18″’ is placed will create a topology problem. While these types of issues may be solved after the conversion, they are generally more easily solved directly in CAD. However, the amount of data in CAD plays an important role because if it is large then manually solving the topological problem would be time-consuming. In which case, cleaning them in the GIS make more sense. Moreover, GIS data can be accessed in a programming language platform such as Python, where the user can define topological rules and apply them. For example, to close the breaks introduced by the placement of texts, the user can create a rule in which all the end points of line segments are compared with each other. If the distance between end points of two line segments is within the threshold limit, the user can assume that it was created due to the text’s placement and can be joined.

3.2.2. Conversion of Annotations

Important information may be present in the form of text in CAD data that should also be included in GIS. This can be carried out by converting the text into annotations in GIS and exported as a feature class that becomes part of the geodatabase. After converting annotations into a feature class in GIS, a point feature is created and starts to serve as a proxy that specifies the location for the text, which can then be exported as a shapefile. In other words, annotations in CAD are converted into points in GIS and assigned to a specific layer and stored as an attribute. More specifically, they can be preserved by transferring them into the attribute table to the nearest point, polyline, or polygon, as shown in Figure 4.

3.2.3. Inaccurate Geometry

Problems may arise during the georeferencing step when the geometry and measurements of the buildings are inaccurate. This can create problems when trying to perfectly overlay the CAD data over the reference GIS data. For example, in Figure 5, if the building in the CAD data (green line) is not accurate, then we cannot have a perfect overlay on the reference data (solid green block), and it, therefore, becomes difficult to properly and accurately georeference the data.

3.2.4. Redundant Polygons

Blocks and lines sometimes represent single entities in CAD and therefore need to be converted to points in GIS. For example, in Figure 6, manholes are represented as circles in CAD, whereas they should be represented by points in GIS.

3.3. Input Parameters

The framework takes the CAD objects as inputs. In general, a CAD object can either be 2D or 3D. In this study, we focused only on the 2D vector formats. Although various CAD formats exist, the three most common formats are: DWG, DXF, and DWF. Among these, the DWG format is the native format of CAD. It contains information about the object(s) created in the CAD software. The other two are predominantly used for file sharing purposes. For our framework, the input file is a DWG file, which will be converted into shapefile(s) at the end of the process. The information about the CAD objects is usually stored in layers. For example, one layer may contain building information (i.e., building footprint), and another layer may contain information about roads.
After importing a DWG file into the GIS platform, the GIS software does not recognize the layers defined in CAD. Instead, it generally differentiates the objects based on geometry, such as points, lines, and polygons. Therefore, layers in GIS refer to the information based on the geometry of objects, unlike layers in CAD, which are based on the objects’ attributes.

4. Case Study

The C2G conversion framework is applied to an underground wastewater system provided by the University of Illinois at Chicago (UIC) Office of Capital Planning & Project Management (OCPPM). This system covers the UIC west campus. The main goal is to convert the CAD drawing data (.dwg) of the underground pipe network into GIS format (.shp) that contains different shapefiles for elements such as manholes, catch basins, and conduits. Figure 7 shows the CAD data used for this case study. The conduits to be converted to GIS are shown in pink and green.
The underground wastewater system consists of a main sewer conduit located on the road that is connected to smaller conduits that collect wastewater from buildings and from stormwater catch basins; Chicago has a combined sanitary and stormwater sewer system. In addition to the stormwater catch basins, manholes are present to give access to the main sewer conduit in the road. The important information to collect for this type of system is the location of manholes, catch basins, and conduits that connect the catch basins. For this project, we convert the locations of the manholes and the catch basins, as well as the location of all wastewater conduits and connect them in GIS.

4.1. Step 1: Information of Interest

For this case study, some parts of the first step were omitted since the UIC OCPPM were able to define for themselves the data they required and kept that data up to date. The relevant actors identified in the UIC OCPPM were the employees responsible for maintaining the underground wastewater system infrastructure data. UIC OCPPM was interested in the extraction of pipelines, manholes, and catch basins and in assigning geographic information to these objects. The main concern, however, in this case is the coordinate systems, which should be the same as the other GIS information maintained by the UIC OCPPM. Therefore, in this case study, we decided to use NAD83/Illinois East (feet US) projection. Since the projection’s unit of measurement is in feet, we needed to make sure the measurements in CAD were in feet (or inches) as well. Unlike UIC OCPPM, municipalities share data across departments, and therefore, people from the participating departments will need to be involved in this step. Nevertheless, for illustrative purposes, if we were to proceed with the first step in a case where there are multiple departments are involved, we would first meet with all actors who would want to use the data and discuss desired outcomes. For example, one of the outcomes could be to identify buildings vulnerable to flooding around UIC. To that end, the missing information necessary for the analysis must first be identified. If the elevation of the buildings in relation to the stormwater drainage infrastructure is found to be missing, then it needs to be collected since buildings in low-lying areas are more prone to flooding [32]. Additionally, other information such as the distance between manholes and a benchmark and the distance between two catch basins would provide us with some relevant information to assess the CAD data accuracy.

4.2. Step 2: Essential Features

Based on the outcomes identified in step 1, information not relevant to the outcomes is removed in step 2. For example, the CAD drawing contained some irrelevant information for this case study, such as the presence of sidewalks, as would have been identified in step 1. Depending on the needs of the particular authority or industry, irrelevant information can be ignored for the conversion to GIS. Most of these data can be deleted from the CAD files directly. In contrast, other information needs to be retained, such as data on roads and/or buildings that will be used for georeferencing. As identified in the previous step, UIC OCPPM was interested only in pipelines, manholes, and catch basins. Therefore, any other information was considered irrelevant. However, the CAD data did not contain any geographical information, we have kept the buildings in the data as they can be used to assign geographic information (discussed later).

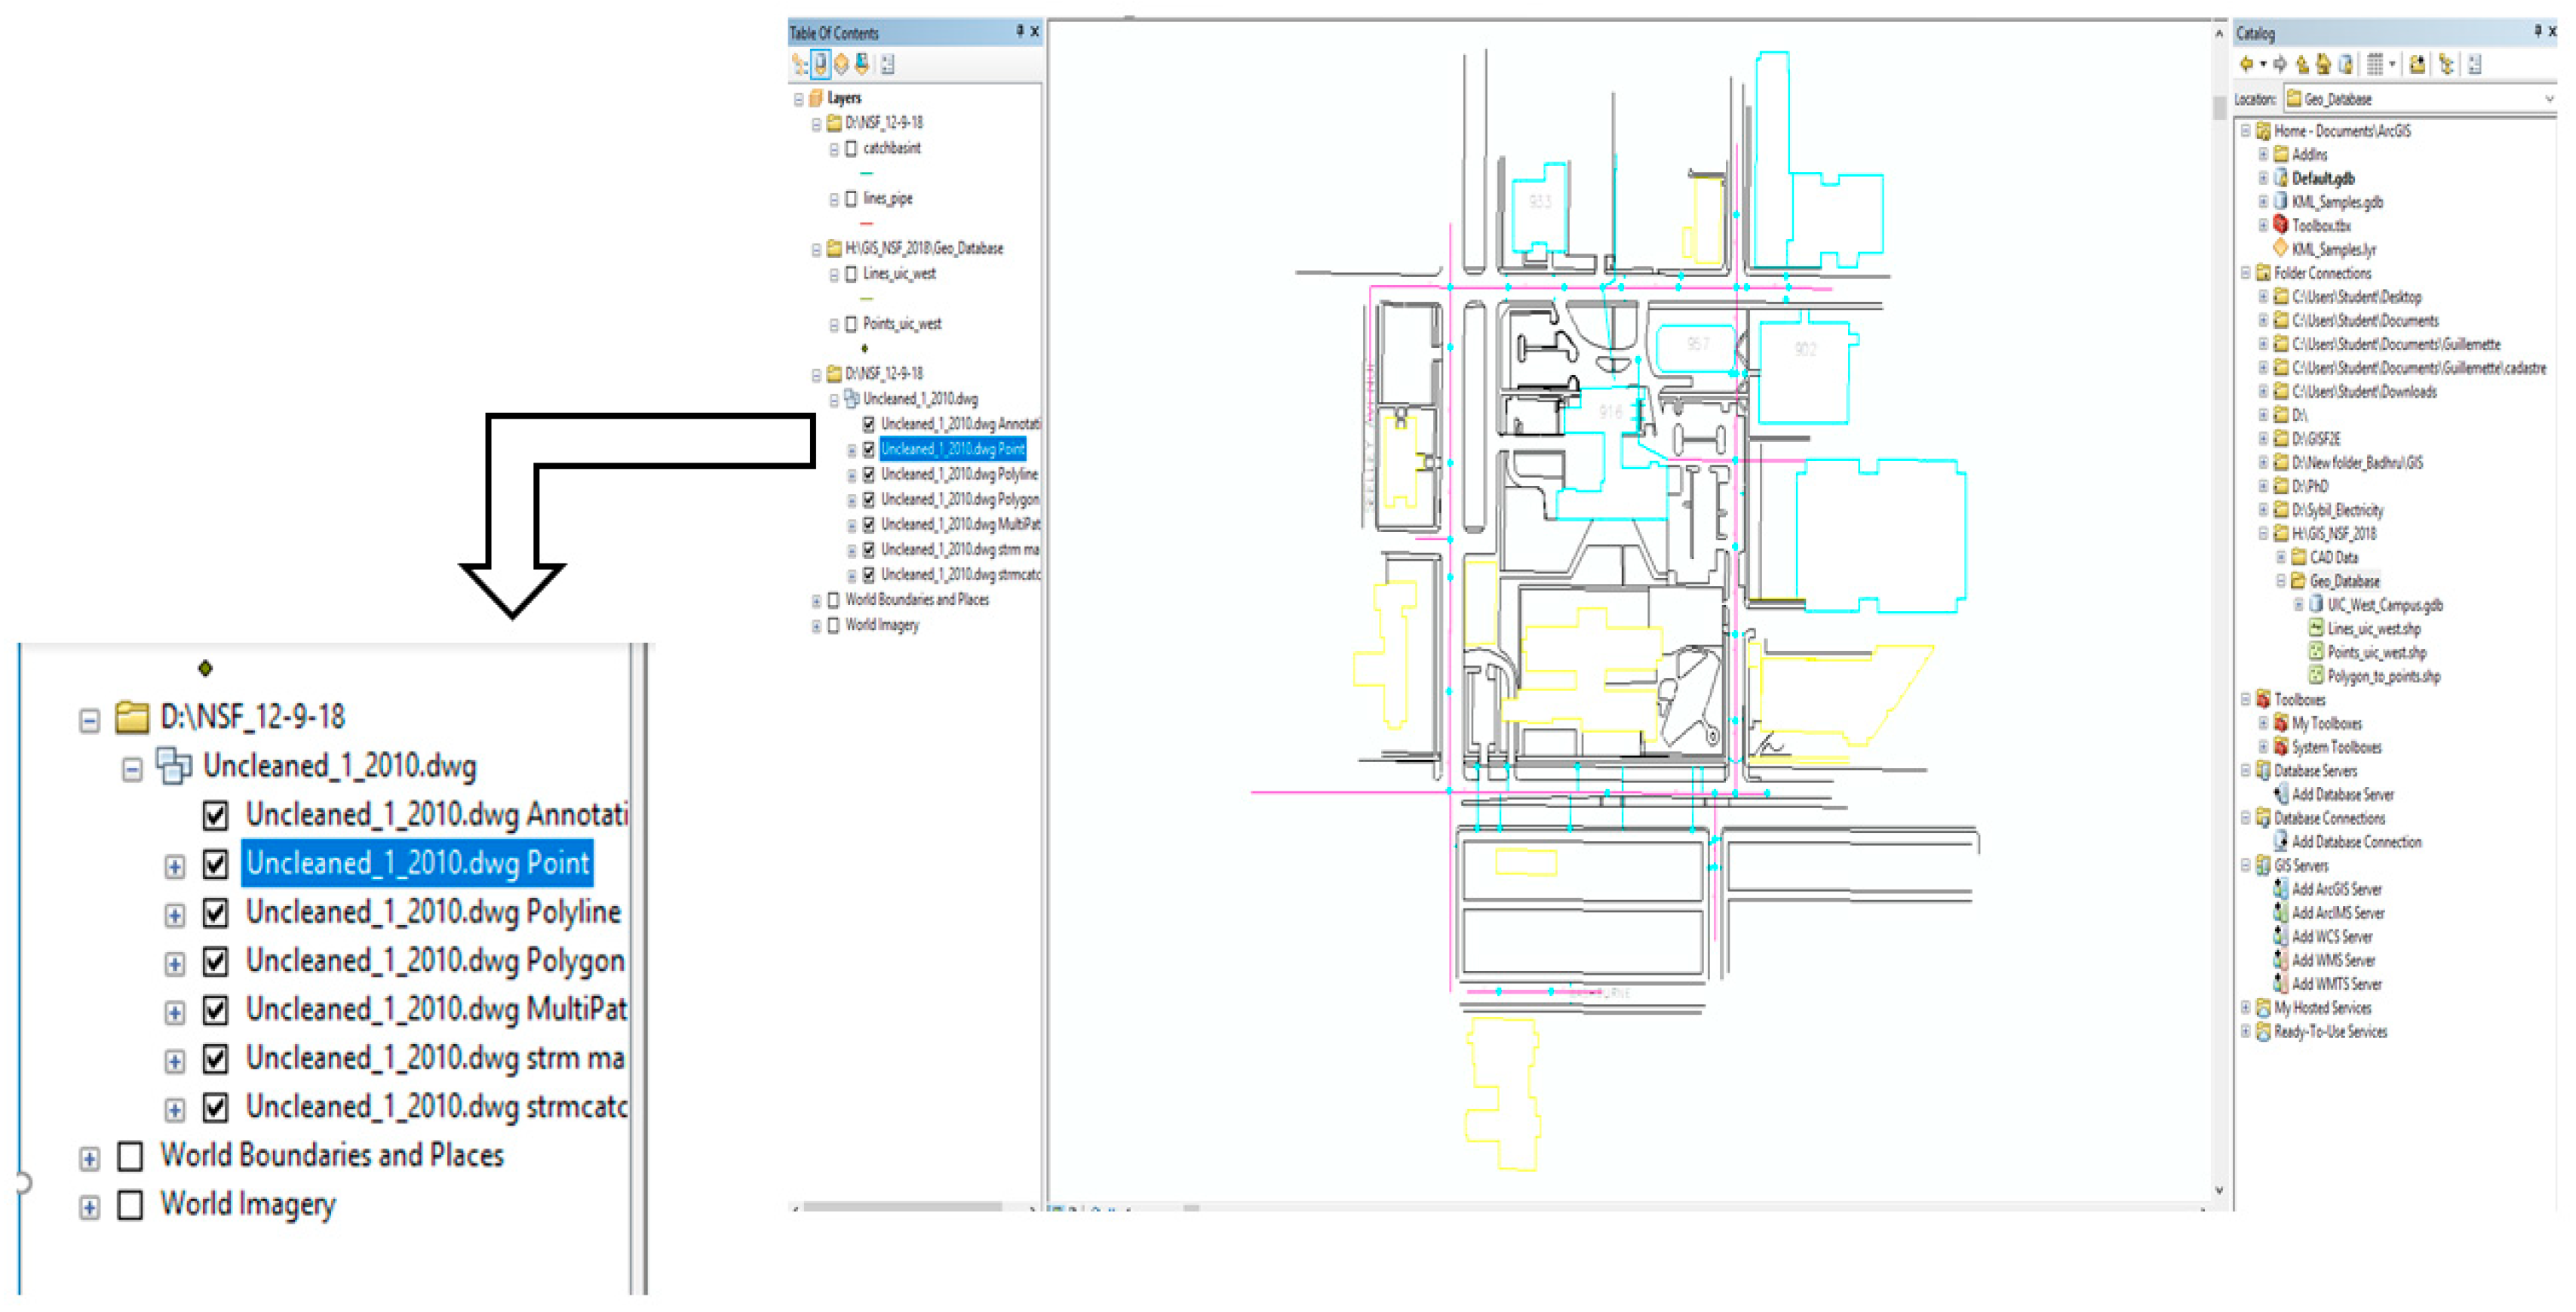
4.3. Step 3: GIS Conversion

Converting the CAD data into shapefiles is a straightforward process. ArcGIS projects the CAD data automatically even without any coordinate system. Figure 8 shows the projected CAD data in the ArcGIS platform. It should be noted that although ArcGIS was able to recognize the CAD data, it does not recognize the attributes of these objects other than the objects’ geometry.
In Figure 8, a list of feature classes is shown in the table of contents on the left-hand side, including point, polyline, polygon, multipatch, and so on. Since the necessary information that needs to be converted into shapefiles are conduits (i.e., polylines), manholes (points), and storm catch basins (polygons), they can be selected and exported as a shapefile. Nonetheless, it should first be georeferenced, which is the goal of the next step.

4.4. Step 4: Georeferencing

The toolbar in ArcGIS has a tool named “Georeferencing” that can be used to assign the geographic position information to the CAD data. Figure 9 shows the original position of the data on a world map, essentially in the Atlantic Ocean, South of West Africa, at coordinate zero for both the longitude and the latitude. During the georeferencing step, the CAD data can be manipulated, for example, by shifting, rotating, and scaling it to make it fit perfectly on the reference map. Here, we use the raster image of the world map, but any other properly georeferenced GIS data can be used. Nevertheless, despite trying a significant number of configurations, some spatial distortions in the converted data persist, and all CAD data therefore cannot fit over the world map perfectly. Figure 9b shows the georeferenced CAD data, and as it can be seen, the overlay is not perfect as the shapes of the buildings are not accurate. Once the georeferencing is completed as properly and accurately as possible, the data can be exported as shapefiles, and the shapes are converted into points, polylines, and polygons.

4.5. Step 5: GIS Data Cleaning

As mentioned above, GIS cleaning is often carried out manually. In this case, study, catch basins and manholes presented a problem because they were converted into polygons (i.e., circles). Instead, we prefer to have them converted into points. Converting polygons to points can be conducted by creating points within these polygons in ArcGIS (noting that the process is easier in ArcGIS than in CAD). In this case, study, we created the points in ArcGIS. Furthermore, it is easier to clean and manipulate GIS data than CAD data. Various ad hoc processes then need to be implemented to clean the GIS data; some of these processes can be automated, for example, by using Python scripts.

5. Conclusions

Traditionally, the information about infrastructures is stored in CAD format. Despite the advantages offered by CAD, conducting analysis in conjunction with data from other sources is difficult, in part due to data heterogeneity. To overcome this problem, many municipalities and organizations around the world are converting or aspire to convert CAD drawings to GIS because GIS allows users to conduct spatial analysis and centralized database. Although there are existing conversion processes, they either tend to be time-consuming or require users to be knowledgeable in both CAD and GIS. Moreover, municipalities have limited budgets and capacity of staff trained in GIS, which makes the time spent on the conversion process even more important. For example, exploratory interviews with municipal GIS analysts and managers across the U.S. found that this type of data conversion was typically performed by those who were proficient in either CAD or GIS. The interview revealed that municipalities and other organizations would benefit greatly from a standardized CAD-to-GIS conversion framework. In response to this need, this article presented a process for the conversion of data from CAD drawings to GIS shapefiles.
To increase the generalizability of the proposed framework, we have reviewed the literature to identify reported problems in converting CAD to GIS. Taken together with the interview, we have proposed a step-by-step process that would allow anyone with a basic knowledge of CAD and GIS to convert data in a timely manner without compromising accuracy. To recapitulate, the C2G conversion framework consists of five steps: information of interest, essential features, GIS conversion, georeferencing, and GIS data cleaning. C2G framework minimizes the loss of information by reducing the complexity of the data. To that end, step 1 and step 2 are pivotal as they help separate relevant and irrelevant features based on the organization’s needs and objectives. The complexity of data is reduced by removing the irrelevant (or redundant) features. After which, the georeferencing step is carried out where the selected coordinate system is assigned to the features. Once the coordinate system is assigned, the data can be exported as shapefiles in the GIS platform. From the literature, we identified the possibility of topological errors introduced as a result of the conversion in the GIS data. Therefore, the final step involved cleaning the errors, if any, in the GIS data either manually or through an automated process.
The C2G framework presented here was validated by its application to both the case of UIC data as well as its ability to resolve the conversion problems raised by the interviewees. These steps were demonstrated with the conversion of actual CAD data (.dwg) into GIS shapefiles (.shp). As the proposed framework targets the needs and the problems encountered by the CAD/GIS practitioners at the US municipalities, we decided to use the same software. However, the framework can be applied with open-source software such as QGIS as well. We have used AutoCAD and ArcGIS platforms to access the CAD and GIS data, respectively. The results of the case study showed that the proposed framework was able to convert the data with little to no loss of information. It could be because the data used for the case study were not complex, and the data were accurate and kept up to date. In addition, the proposed framework, although developed for the conversion of infrastructure information, could also be used in other fields such as geology and/or archaeology, where CAD and GIS are extensively used. Future research could explore the applicability of this framework to more complex datasets and could explore generalizing this process to other network systems and identifying the steps that can be automated to further reduce the time required by the conversion process. Additionally, feedback from those working on similar problems at municipalities, institutions, and organizations about the method presented here could also be explored in the future.

Author Contributions

Conceptualization, S.D. and M.D.S.; methodology, G.F., M.B., E.S.B. and S.D.; coding, M.B. and E.S.B.; validation, G.F. and M.B.; data curation, E.S.B., G.F. and M.B.; writing—original draft preparation, G.F., M.B., E.S.B. and S.D.; writing—review and editing, M.B., E.S.B., S.D. and M.D.S.; visualization, M.B.; funding acquisition, S.D. and M.D.S. All authors have read and agreed to the published version of the manuscript.

Funding

This research is supported, in part, by the National Science Foundation (NSF) CAREER Award (1551731) and CPS Award (1646395).

Institutional Review Board Statement

Not applicable for this study.

Informed Consent Statement

Not applicable.

Data Availability Statement

Restrictions apply to the availability of these data. CAD data was obtained from the University of Illinois at Chicago (UIC) Office of Capital Planning and Project Management (OCPPM) and are available with the permission of the University of Illinois at Chicago (UIC) Office of Capital Planning and Project Management (OCPPM). The interview data presented in this study are available on request from the corresponding author. The data are not publicly available due to privacy reasons.

Acknowledgments

The authors would like to thank the eleven municipalities interviewed for giving us the time and permission to interview their employees for this study. Additionally, we would like to thank the University of Illinois at Chicago (UIC) Office of Capital Planning and Project Management (OCPPM) for providing the CAD data of the UIC west campus.

Conflicts of Interest

The authors declare no conflict of interest.

References

  1. Zhu, J.; Wu, P. Towards Effective BIM/GIS Data Integration for Smart City by Integrating Computer Graphics Technique. Remote Sens. 2021, 13, 1889. [Google Scholar] [CrossRef]
  2. Baran, M.; Kłos, M.; Chodorek, M.; Marchlewska-Patyk, K. The Resilient Smart City Model–Proposal for Polish Cities. Energies 2022, 15, 1818. [Google Scholar] [CrossRef]
  3. Cheng, J.C.P.; Deng, Y. An Integrated BIM-GIS Framework for Utility Information Management and Analyses. In Proceedings of the 595 International Workshop on Computing in Civil Engineering, Austin, TX, USA, 21–23 June 2015; pp. 667–674. Available online: https://ascelibrary.org/doi/abs/10.1061/9780784479247.083 (accessed on 27 July 2021).
  4. Scholtenhuis, L.L.; Zlatanova, S.; den Duijn, X. 3D Approach for Representing Uncertainties of Underground Utility Data. In Proceedings of the International Workshop on Computing in Civil Engineering, Seattle, WA, USA, 25–27 June 2017; pp. 369–376. [Google Scholar]
  5. Crawford, D.; Hung, M.-C. Implementing a Utility Geographic Information System for Water, Sewer, and Electric: Case Study of City of Calhoun, Georgia. URISA J. 2015, 26, 25–34. [Google Scholar]
  6. Derrible, S. Urban Engineering for Sustainability; MIT Press: Cambridge, MA, USA, 2019; 656p. [Google Scholar]
  7. Metje, N.; Hojjati, A.; Beck, A.; Rogers, C.D.F. Improved underground utilities asset management—Assessing the impact of the UK utility survey standard (PAS128). Proc. Inst. Civ. Eng.-Munic. Eng. 2020, 173, 218–236. [Google Scholar] [CrossRef] [Green Version]
  8. Fenais, A.; Ariaratnam, S.T.; Ayer, S.K.; Smilovsky, N. Integrating Geographic Information Systems and Augmented Reality for Mapping Underground Utilities. Infrastructures 2019, 4, 60. [Google Scholar] [CrossRef] [Green Version]
  9. Esekhaigbe, E.; Kazan, E.; Usmen, M. Integration of Digital Technologies into Underground Utility Asset Management. Open J. Civ. Eng. 2020, 10, 403–428. [Google Scholar] [CrossRef]
  10. Lv, Z.; Li, X.; Wang, W.; Zhang, B.; Hu, J.; Feng, S. Government affairs service platform for smart city. Futur. Gener. Comput. Syst. 2018, 81, 443–451. [Google Scholar] [CrossRef]
  11. Venigalla, M.; Casey, M. Innovations in Geographic Information Systems Applications for Civil Engineering. J. Comput. Civ. Eng. 2006, 20, 375–376. [Google Scholar] [CrossRef]
  12. Akin, O. CAD/GIS Integration: Rationale and Challenges. In CAD and GIS Integration; Karimi, H.A., Akinci, B., Eds.; CRC Press: Boca Raton, FL, USA, 2010; pp. 51–71. ISBN 978-1-4200-6805-4. [Google Scholar]
  13. Zhu, J.; Wang, X.; Chen, M.; Wu, P.; Kim, M.J. Integration of BIM and GIS: IFC geometry transformation to shapefile using enhanced open-source approach. Autom. Constr. 2019, 106, 102859. [Google Scholar] [CrossRef]
  14. Balasubramani, B.S.; Badhrudeen, M.; Derrible, S.; Cruz, I. Smart Data Management of Urban Infrastructure Using Geographic Information Systems. J. Infrastruct. Syst. 2020, 26, 06020002. [Google Scholar] [CrossRef]
  15. Bansal, V.K. Integrated CAD and GIS–Based Framework to Support Construction Planning: Case Study. J. Arch. Eng. 2017, 23, 05017005. [Google Scholar] [CrossRef]
  16. Shao, W.; Zhang, H.; Liu, J.; Yang, G.; Chen, X.; Yang, Z.; Huang, H. Data Integration and its Application in the Sponge City Construction of CHINA. Procedia Eng. 2016, 154, 779–786. [Google Scholar] [CrossRef] [Green Version]
  17. He, L.; Wu, G.; Dai, D.; Chen, L.; Chen, G. Data Conversion between CAD and GIS in Land Planning. In Proceedings of the 2011 19th International Conference on Geoinformatics, Shangai, China, 24–26 June 2011; pp. 1–4. [Google Scholar]
  18. Xie, Q.; Wei, B.; Zhang, K.; Wang, Z. Format Conversion between CAD Data and GIS Data Based on ArcGIS. In International Conference on Intelligent Earth Observing and Applications 2015; International Society for Optics and Photonics: Guilin, China, 2015; Available online: https://www.spiedigitallibrary.org/conference-proceedings-of-spie/9808/980818/Format-conversion-between-CAD-data-and-GIS-data-based-on/10.1117/12.2207479.short (accessed on 4 May 2021).
  19. Gao, F.; Tang, X. Research on Computer Aided Design and GIS Conversion Method. J. Multimed. Process. Technol. 2017, 8, 5. [Google Scholar]
  20. Wang, H.W.; Kui, H.L.; Li, S.W.; Li, G. Research on CAD Data Format Conversion for Transport Infrastructure Information. Adv. Mater. Res. 2011, 305, 239–242. [Google Scholar] [CrossRef]
  21. Karan, E.P.; Irizarry, J.; Haymaker, J. BIM and GIS Integration and Interoperability Based on Semantic Web Technology. J. Comput. Civ. Eng. 2016, 30, 04015043. [Google Scholar] [CrossRef]
  22. Diakite, A.A.; Zlatanova, S. Automatic geo-referencing of BIM in GIS environments using building footprints. Comput. Environ. Urban Syst. 2019, 80, 101453. [Google Scholar] [CrossRef]
  23. Guthrie CAD/GIS. Guthrie CAD/GIS Software|Markup CAD, GIS to CAD/ KML, CAD to GIS, First Article Inspection, QA, QS, Overlay Drawings, Batch Print. 2022. Available online: https://www.guthcad.com/ (accessed on 21 November 2021).
  24. Zhen, L.; Jing, C.; Chen, X. Files’ Conversion from CAD to GIS Using Spatial Data Conversion Tools Provided by FME. In Proceedings of the 2012 International Conference on Computer Science and Service System, Nanjing, China, 11–13 August 2012; pp. 1939–1942. [Google Scholar]
  25. Karduni, A.; Kermanshah, A.; Derrible, S. A protocol to convert spatial polyline data to network formats and applications to world urban road networks. Sci. Data 2016, 3, 160046. [Google Scholar] [CrossRef]
  26. Noardo, F.; Harrie, L.; Ohori, K.A.; Biljecki, F.; Ellul, C.; Krijnen, T.; Eriksson, H.; Guler, D.; Hintz, D.; Jadidi, M.A.; et al. Tools for BIM-GIS Integration (IFC Georeferencing and Conversions): Results from the GeoBIM Benchmark 2019. ISPRS Int. J. Geo-Inf. 2020, 9, 502. [Google Scholar] [CrossRef]
  27. Xu, X.; Cai, H. Semantic approach to compliance checking of underground utilities. Autom. Constr. 2019, 109, 103006. [Google Scholar] [CrossRef]
  28. Halfawy, M.R. Municipal information models and federated software architecture for implementing integrated infrastructure management environments. Autom. Constr. 2010, 19, 433–446. [Google Scholar] [CrossRef]
  29. Demir Altıntaş, Y.; Ilal, M.E. Loose coupling of GIS and BIM data models for automated compliance checking against zoning codes. Autom. Constr. 2021, 128, 103743. [Google Scholar] [CrossRef]
  30. Dao, J.; Ng, S.T.; Yang, Y.; Zhou, S.; Xu, F.J.; Skitmore, M. Semantic framework for interdependent infrastructure resilience decision support. Autom. Constr. 2021, 130, 103852. [Google Scholar] [CrossRef]
  31. Badhrudeen, M.; Naranjo, N.; Movahedi, A.; Derrible, S. Machine learning based tool for identifying errors in CAD to GIS converted data. In Innovation for Sustainable Infrastructure; Ha-Minh, C., Dao, D.V., Benboudjema, F., Derrible, S., Huynh, D.V.K., Tang, A.M., Eds.; CIGOS 2019; Lecture Notes in Civil Engineering; Springer: Singapore, 2020; pp. 1185–1190. [Google Scholar]
  32. Yang, Y.; Ng, S.T.; Dao, J.; Zhou, S.; Xu, F.J.; Xu, X.; Zhou, Z. BIM-GIS-DCEs enabled vulnerability assessment of interdependent infrastructures—A case of stormwater drainage-building-road transport Nexus in urban flooding. Autom. Constr. 2021, 125, 103626. [Google Scholar] [CrossRef]
Figure 1. Proposed C2G conversion framework.
Informatics 09 00042 g001
Figure 2. Georeferencing process flow chart.
Informatics 09 00042 g002
Figure 3. (a) Before correction: text in the middle of the line. (b) After correction: text above the line.
Informatics 09 00042 g003
Figure 4. (a) CAD annotation (b) line (with the attribute) in GIS.
Informatics 09 00042 g004
Figure 5. Wrong building shape complicating the georeferencing of the data.
Informatics 09 00042 g005
Figure 6. Manholes from CAD feature (left) to a point feature in GIS (right).
Informatics 09 00042 g006
Figure 7. Underground stormwater system map of the UIC West campus.
Informatics 09 00042 g007
Figure 8. CAD projected in ArcGIS.
Informatics 09 00042 g008
Figure 9. Before (a) and after (b) georeferencing of the CAD data.
Informatics 09 00042 g009
Table 1. Summary of challenges interviewees reported.
Challenges with DataChallenges with Conversion
Incomplete dataAttribute structuring
Inaccurate dataTopology
Data collected does not match needInconsistent naming practices
Table 2. List of problems in CAD and GIS.
PlatformProblem DescriptionExample
CADInsufficient (or no) metadataNo information about the infrastructure network that has abandoned pipes.
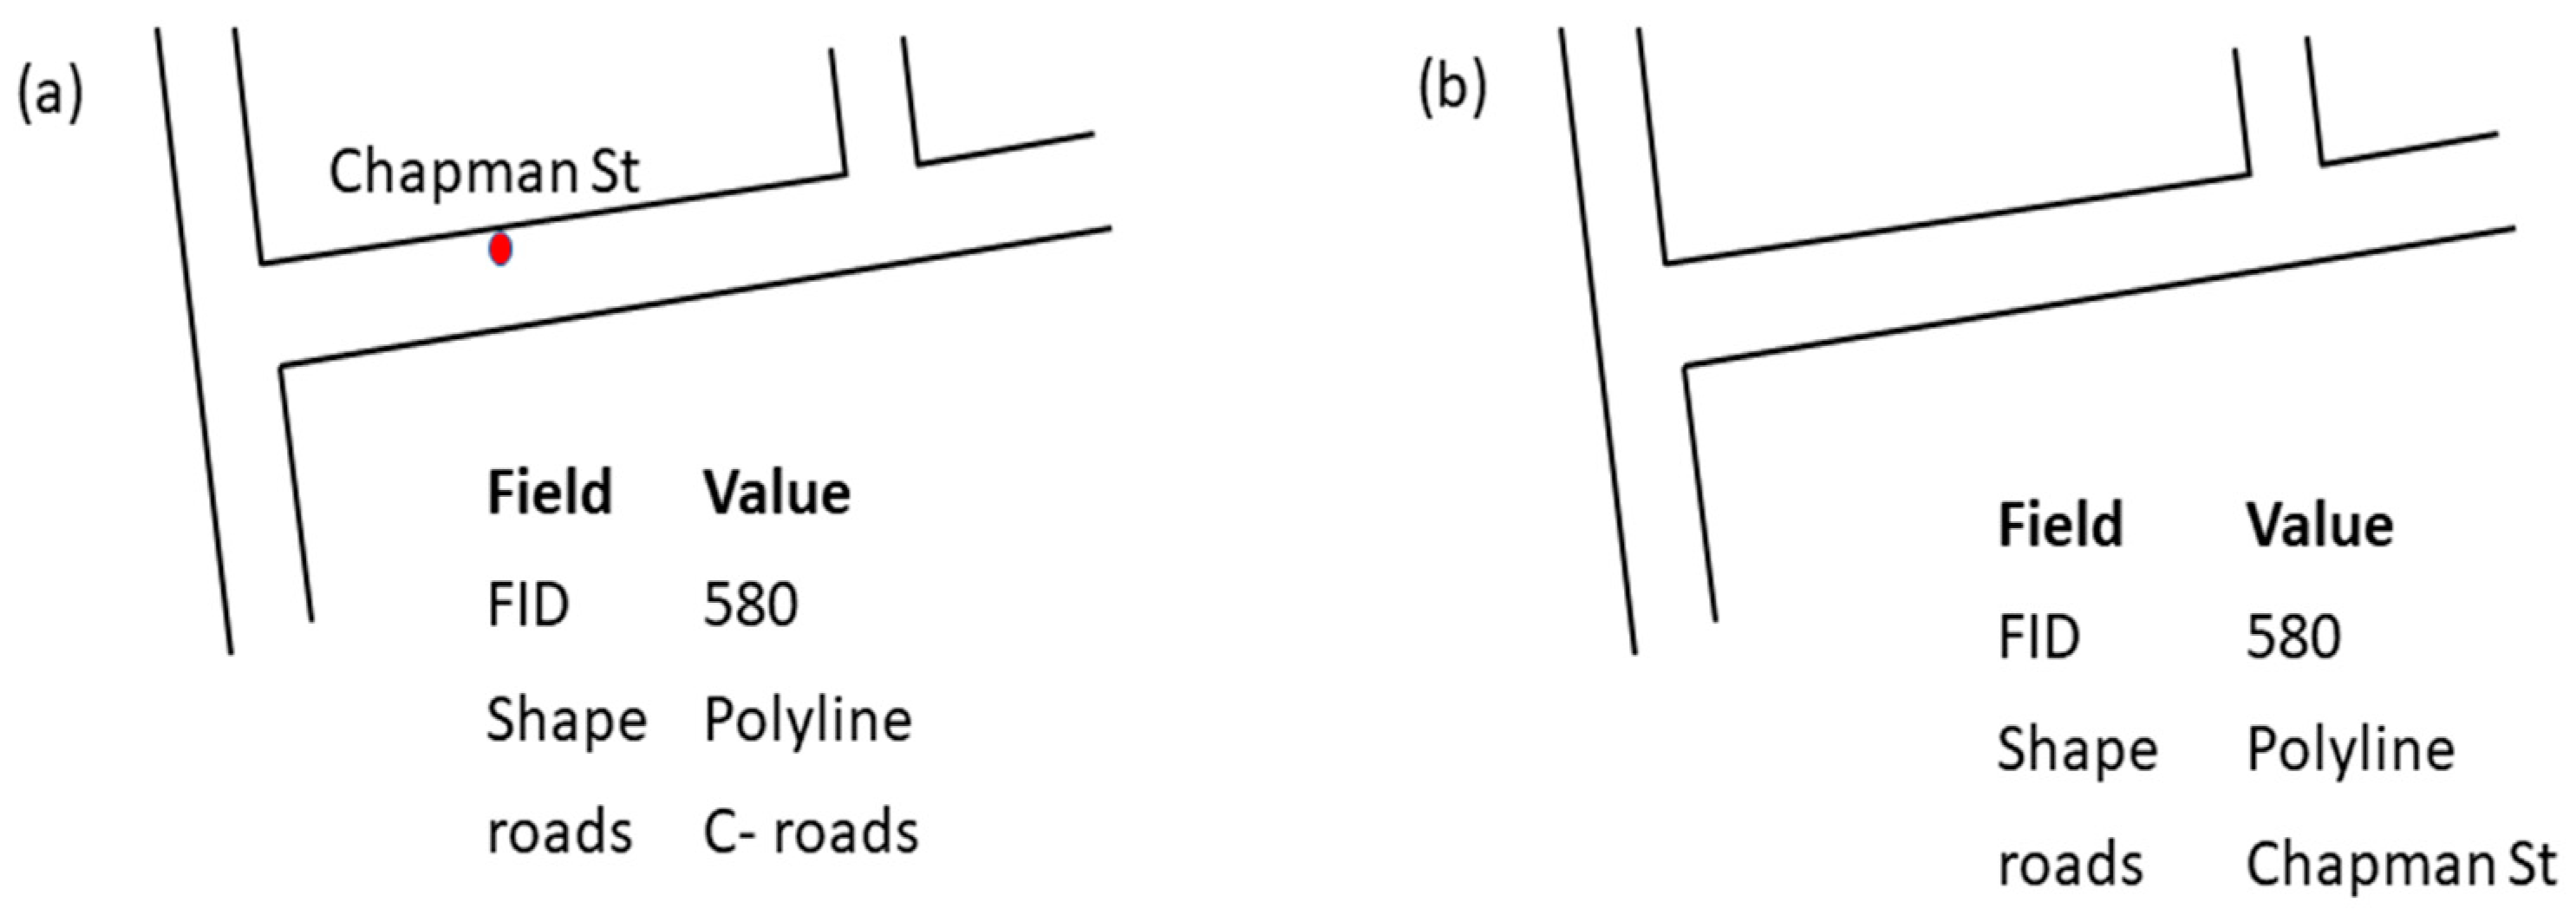
Misplacement of textPipe diameter details placed inaccurately near another pipe.
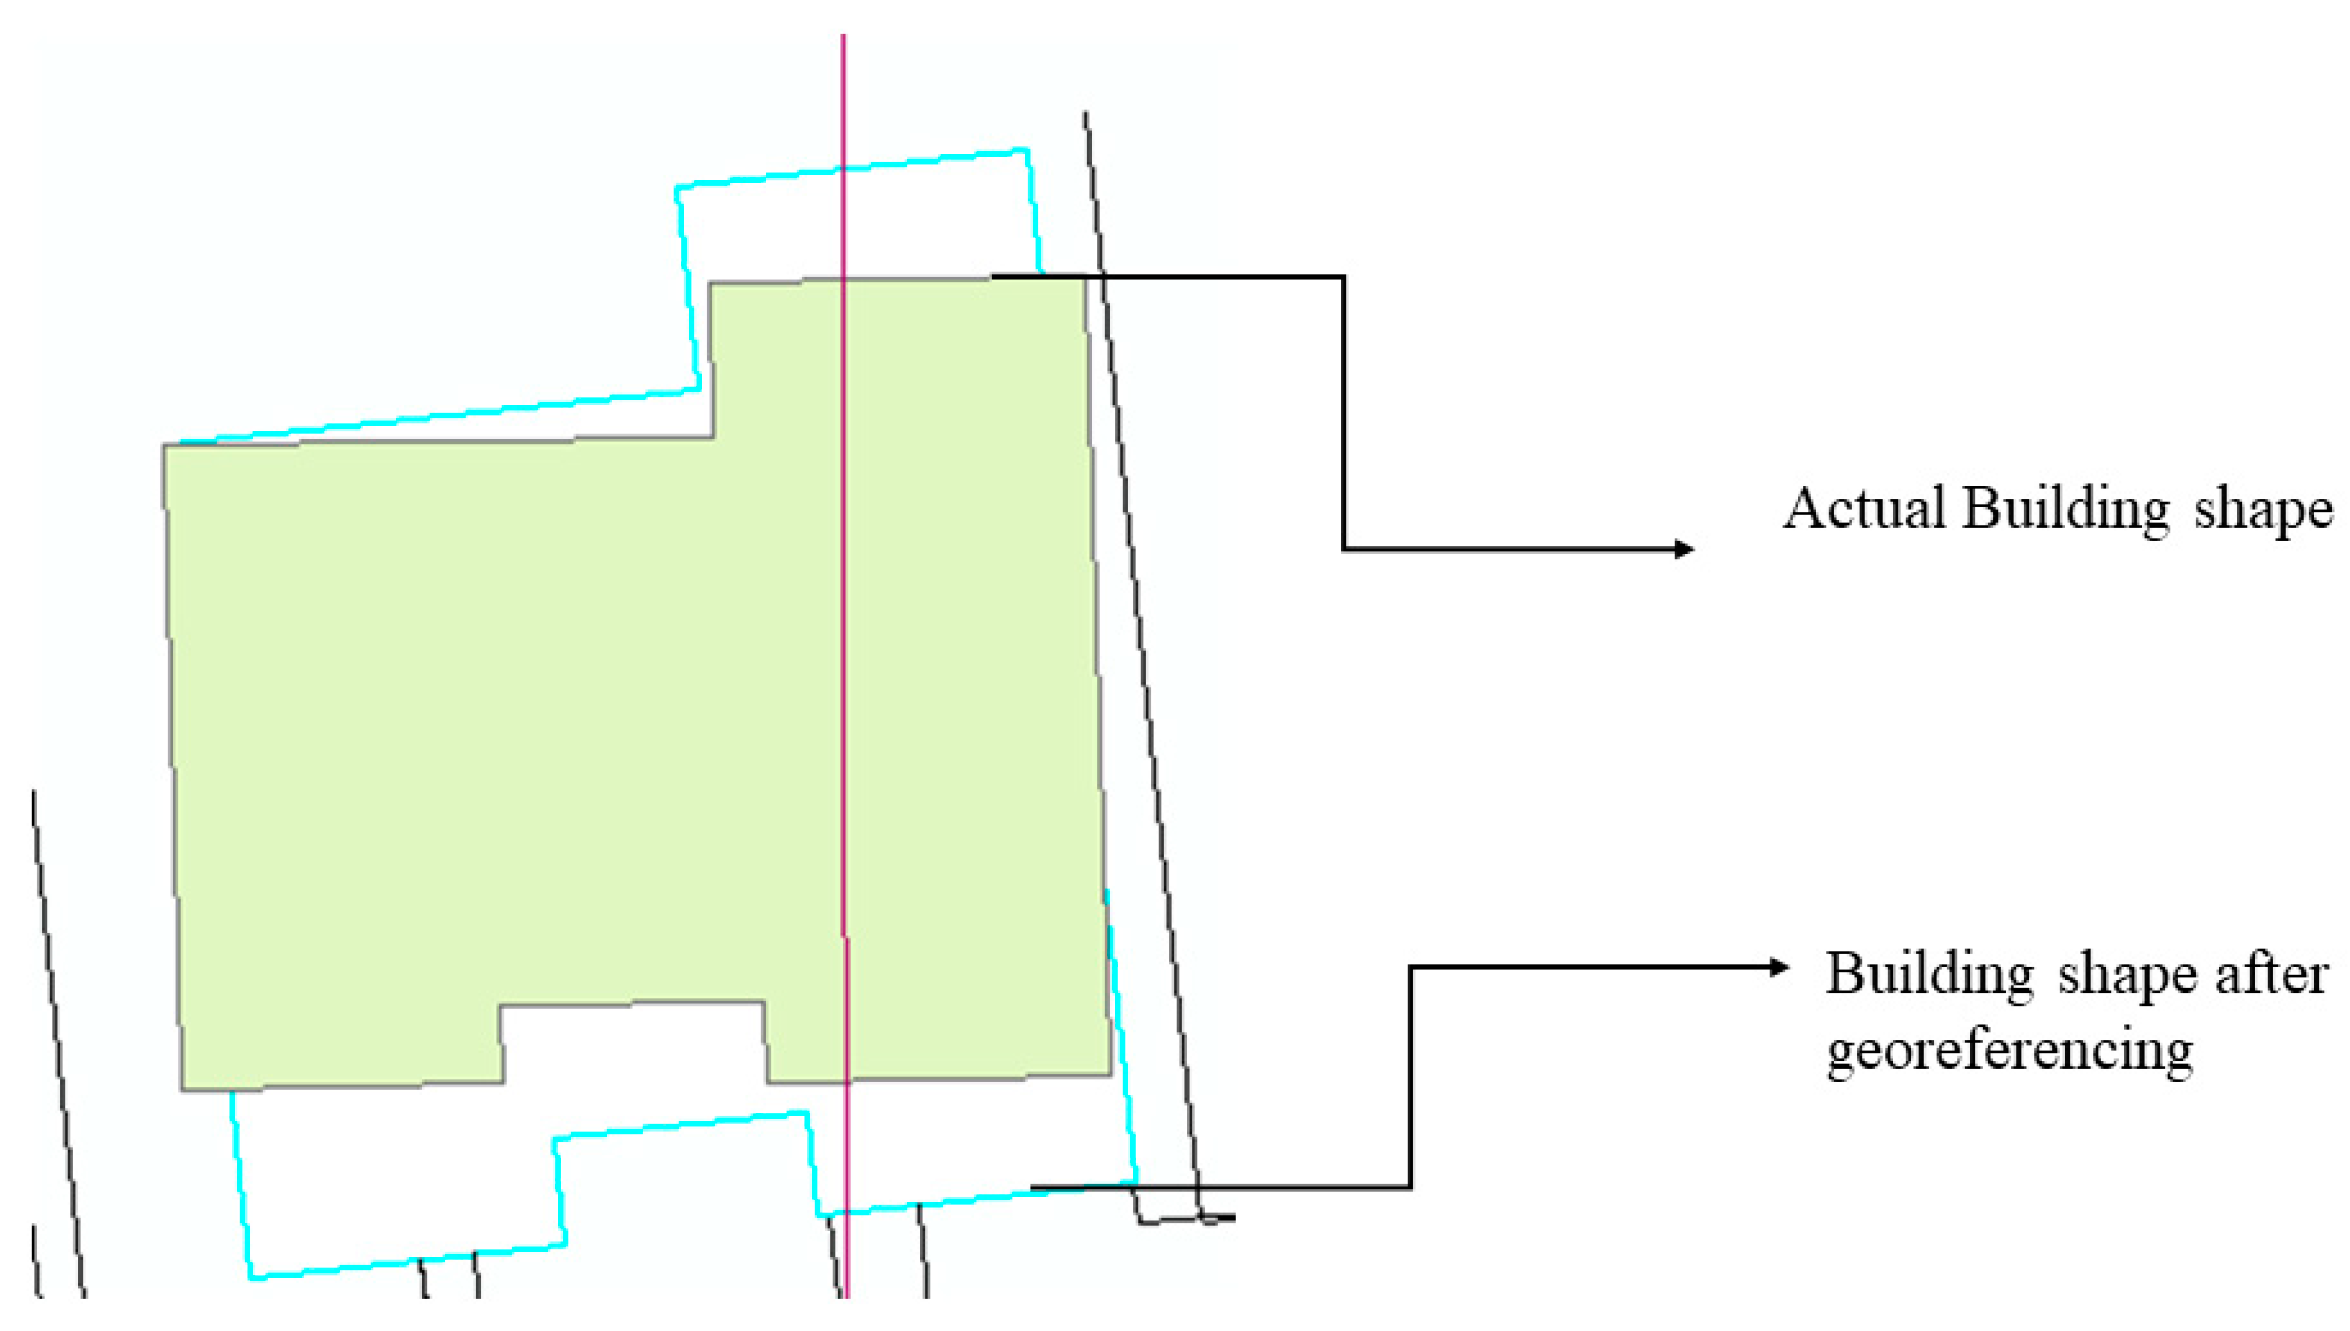
Inaccurate geometryWrong building shape (see below: Section c)
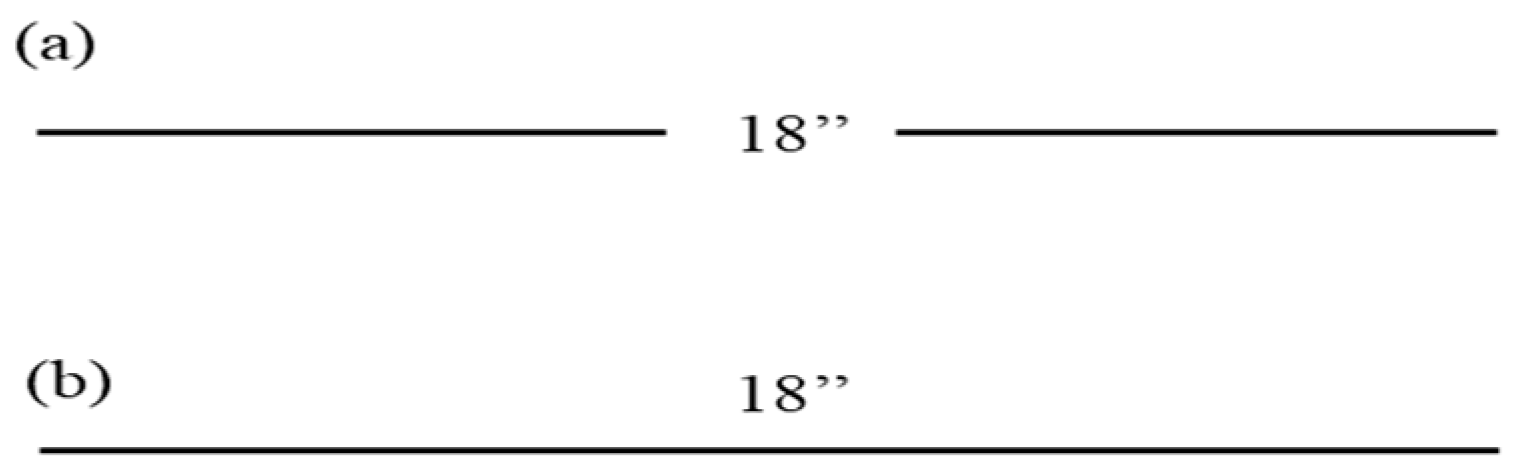
Text separating lines, thus creating gaps(see below: Section a)
GISPolygons made by continuous lines but not closedBuildings without a closed form.
Annotations(see below, Section c)
No georeferencing(see below: Section 4. d)
Redundant polygons(see below: Section d)
Publisher’s Note: MDPI stays neutral with regard to jurisdictional claims in published maps and institutional affiliations.

