
Methods for Financial Assessment of Renewable Energy Projects: A Review


1
Department of Management, Campus Darcy Ribeiro, University of Brasília, Brasília 70910-900, Brazil
2
ALGORITMI Research Center, School of Engineering, University of Minho, 4800-058 Guimarães, Portugal
*
Author to whom correspondence should be addressed.
Processes 2022, 10(2), 184; https://0-doi-org.brum.beds.ac.uk/10.3390/pr10020184
Submission received: 11 August 2021
/
Revised: 10 January 2022
/
Accepted: 11 January 2022
/
Published: 18 January 2022
(This article belongs to the Special Issue Renewable Energy Technologies and Systems: Technical, Environmental, Economic, Social, and Cultural Challenges)
Abstract
:The financial evaluation of renewable energy sources (RES) projects is well explored in the literature, but many different methods have been followed by different authors. Then, it is important to understand if and how these methods have been changing and what factors may have driven new approaches. Therefore, this article aims to explore the publications on the financial evaluation of RES projects from 2011 to 2020 and to present a critical analysis of the reviewed literature. The methods for evaluating RES projects were grouped into four categories: (i) traditional metrics based on net present value, internal rate of return, and payback period; (ii) levelized cost of electricity; (iii) return on investment approach; and (iv) real options analysis. A quantitative analysis was carried out considering aspects related to the relevance of the authors, productivity by country, and the most relevant journals for each of these groups. Then, a qualitative analysis of the main characteristics of the five most cited articles in each group was conducted. The results show that the more traditional methods are still widely used for the financial evaluation of RES projects. However, approaches based on the levelized cost and real options have been growing in importance to tackle the complex features of financial evaluation and comparison of RES projects.
1. Introduction
Despite the global increase in renewable energy sources (RES) investments associated with economic and population growth [1], few studies have presented a comprehensive evaluation mechanism for RES projects, mainly due to the multiplicity of variables capable of influencing the viability of these endeavors. Therefore, building models that allow an efficient and holistic measurement is a difficult task [2].
The development of tools for valuing renewable energy-generation projects is essential to encourage the undertaking of these initiatives. The study of RES represents a relevant field of research not only because of the foreseen technical developments but also because of the multidisciplinary approach needed to assess these projects from the social, environmental, and financial perspectives. The doubts about the feasibility of continuous investments in energy infrastructure based on fossil fuels have contributed to stimulating new frontiers for studies related to renewable energy projects [3].
Most large RES projects are financed in the Project Finance category and have a high demand for long-term capital. The main characteristics of this type of financing structure is the use of the project’s own cash flow and the creation of a specific and legally independent company, the Special Purpose Vehicle (SPV), to carry out the project [4]. Several methods can be used to measure the financial performance of a project, such as its cash flow analysis, revenue evolution, market share growth, among others. However, the option for project finance to finance large projects in renewable energy generates additional transaction costs due to the complexity of its formatting. This reality requires an additional effort for identifying methods capable of efficiently measuring its performance [5].
Despite the existence of important research focused on the theory of evaluating RES projects [6,7], the literature does not fully explore a combined analysis of quantitative and qualitative elements or discuss the methodologies most used by a given technology or in a specific region. In addition, there are a few studies that focus on critical reviews on the evaluation of RES projects [8,9], but the complementarity of the evaluation approaches and their relation to RES development still require further analysis. Thus, this work will contribute to a better understanding of the methods and indicators directed towards the financial assessment of RES projects. Namely, it contributes to RES project practitioners to identify the most used evaluation methods and those most suitable for their particular case. Moreover, the analysis contributes to a better understanding of the development of these methods over time and in different regions of the world showing also how these evaluation techniques are interconnected and being used in different projects. By doing this, we aim not only to present the state of art in what concerns the financial appraisal of RES projects but also to show how these methods are affected by the RES development and devise some possible paths for future research.
To contribute to filling this gap, this paper seeks to answer the following research question:
Is it possible to discern a change in the use of financial methods to assess the viability of RES investment projects over the last decade?
Although the focus of this study is the evaluation of RES projects, the reviewed indicators are widely used to evaluate projects in other areas [10,11], for example, use the LCOE to assess the cost-effectiveness of improving energy efficiency, portraying the costs and impacts of energy efficiency policies to support decision-making, policy analysts, and energy program managers. Other examples of cost-related indicators include the minimum fuel selling price (MFSP) commonly used for measuring the economic viability of biorefineries [12]. However, given its specificity for the biofuel sector, the MFSP will not be included in the review.
The remainder of the paper is organized as follows. Section 2 presents the main project evaluation techniques used in this review. Section 3 describes the research methodology used to obtain the paper database and its analysis. Section 4 presents the results of the quantitative and qualitative analyses. These results are then discussed in Section 5. Finally, Section 6 draws the main conclusions of the paper and gives directions for further research.
2. Project Evaluation Techniques
To help decision-makers invest in RES technologies, it is essential to have reliable indicators capable of measuring a project’s total performance, comparing it with the feasibility of other alternatives. Several tools are used to measure the feasibility of RES projects. For example, Ramadan et al. [13] applied net present value (NPV) combined with an annual Return on Investment (ROI). NPV can also be used as a standalone tool or combined with the Internal Rate of Return (IRR) [14]. Carneiro and Ferreira [15] also explored the use of NPV associated with IRR and Payback Period (PBP) while Talavera et al. [16] applied NPV with IRR and Levelized Cost of Electricity (LCOE).
Although most of the current studies on the feasibility of RES projects are based on the use of more than one indicator, the classic NPV has been the most popular indicator for evaluating investments in general [17,18]. However, the long-term investment characteristic of RES projects can compromise the reliable application of traditional indicators to measure viability [19,20]. The NPV represents the total value of the project at the current value, considering a discount rate that reflects the risk at which the investor demands to be remunerated [21]. NPV is considered the most theoretically reliable tool from a financial perspective since it measures value creation [17].
Another indicator widely used in RES projects is the IRR, expressed by the interest rate for which the project’s NPV is zero. When the future cash flows of a project are discounted using the IRR, the present value of cash outflows equals the present value of cash inflows [22]. IRR is generally used with the NPV in the evaluation of projects [23]. Ref. [24] discussed the IRR and argues that joint with NPV, it represents the second measure of the project profitability. It is based on a non-dimensional scale while NPV represents a monetary quantity.
The Payback Period (PBP) is an indicator that aims at expressing the time to recover the investment in a project. The PBP is the number of years or months necessary for the gross value of the inputs and outputs to be equal [16]. PBP can be used with or without considering the time value of money. When this is taken into account, the method is called the Discounted Payback Period, otherwise is frequently called Simple Payback Period. Despite its easy understanding and usability, PBP disregards existing cash flows after the investment is recovered, and is a very limited tool for decision making [25].
Another approach to measuring the feasibility of RES projects is based on cost analysis. In this approach, it is possible to identify the concepts of Cost of Electricity, also called Cost of Energy (COE) [26] or Levelized COE (LCOE) [27], defined as the average cost ($) per kWh of energy produced by the system [28]. Aussel et al. [29] claimed that the LCOE indicator is widely used for energy projects, and Siddaiah and Saini [30] highlighted LCOE as the preferred indicator for minimizing the lifecycle cost of a project. Although several studies are adopting the present value view of project costs, [31] demonstrated that LCOE represents not a discounted metric but rather an undiscounted metric. Moreover, the author argues that the present value approach of costs excessively penalizes projects with a longer life cycle. However, the LCOE remains a fundamental metric widely disseminated among the energy industry, academics, and organizations (see, for example, [32,33,34,35].
The ROI, defined as the annual cost saving over the invested capital [28] or as the annual average net profit over the invested capital [36], is also a common criterion used for analyzing the economic viability of RES projects [28]. Although ROI is strongly linked to NPV in investment valuation [17], some studies use these two indicators as complementary metrics [36]. Other papers highlight that the ROI parameters may not incorporate the time value of money [37], and, for this reason, the metric could be used as an independent financial parameter. A variation of ROI is the Energy ROI (EROI), defined as the proportion of the plant’s usable energy over the energy invested in the plant [38], which will not be considered in this paper.
Given the need to value the managerial flexibility of projects in light of a future of uncertainty and change, some tools can be explored. Real options analysis (ROA), which seeks to price the future uncertainty of these projects, can be used as an indicator that complements traditional metrics based on a deterministic cash flow [39]. The real options theory has been applied with increasing frequency to the evaluation of RES projects [40,41,42]. Decisions are assumed to be fixed in the traditional analysis of investments through discounted cash flow, not allowing managers to expand or retract investments beyond the initial project estimate [39]. The term real options is used to express the options that are embedded in investment opportunities, such as suspending, postponing, or abandoning the investment, and reducing or expanding the scale of operations [43]. ROA can be considered a complementary tool in the analysis of project feasibility. Ref. [41] compared the traditional NPV method to the expanded NPV method that considers the flexibilities of a specific project. The authors concluded, as expected, that the value of NPV using ROA is greater than the traditional calculation since a real option can give flexibility and then add value to the project.
Table 1 summarizes these project evaluation techniques including the simplified equations for their calculation and some of the main related concepts/ideas. Although different categorizations of the financial evaluation methods have been proposed in the literature [9,29,44,45], in this paper those methods are grouped in four categories, for the qualitative analysis purpose: (i) Traditional Project Evaluation Methods (TPEM), expressed by metrics that evaluate the viability of projects by discounting cash flows: NPV, IRR and Payback period; (ii) Cost analysis approach, represented by the Levelized Cost of Energy (LCOE); (iii) Return on Investment (ROI); and (iv) Real Options Analysis (ROA) that takes into account in the decision-making process the managerial flexibility associated with the investment decision.
3. Materials and Methods
According to Haddaway and Macura [47], a literature review needs to generate some relevant scientific evidence, which goes beyond the collection of studies and their respective syntheses. In this sense, this study brings elements capable of assisting decision-makers in the valuation of RES projects, highlighting the main uses and limitations on the methodologies used in this field and where they would more suitably be applied.
Some limitations may be assigned to a literature review study, such as (i) lack of detailed methods enabling reproducibility, (ii) inclusion of studies based on authors’ familiarity, and (iii) different decisions based on the individual options of the reviewers, among others [47]. This work seeks to overcome these limitations by presenting a detailed research method based on four specific steps using a systematic and replicable approach.
3.1. Quantitative Analysis
The quantitative analysis of the articles follows a bibliometric approach. There are at least two main procedures in building a bibliometric analysis. The first, performance analysis, seeks to evaluate groups of authors and the impact of their activities. The second, scientific mapping, aims to express the cognitive structure of a study, presenting its structural and dynamic aspects [48,49].
The most influential authors in a research area can be identified using indicators that measure their influence on a given theme from the number of published works [50]. The h-index proposed by Hirsch [51] is defined by the largest number h of papers by an author that received at least h citations. The h-index considers both the number of publications and their impact on individual authors’ performance measurement, summarizing citations and publications into a single reference number [51,52].
However, the difficulties in capturing the contribution of authors with common names, the existence of differences between research fields in the typical values of h, and their insensitivity in situations where articles are cited rarely or very frequently have contributed to the proposal of new alternative metrics [53]. For instance, the g-index proposed by Egghe [53] and the hg-index proposed by Alonso et al. [54] sought to improve the performance measurement of the authors in publications of a particular field of research.
The g-index is an indicator that expresses the most cited articles by an author in a rank of articles arranged in descending order with the most cited g-articles having at least g2 citations altogether [53]. However, these indicators focused on the authors’ performance analysis, besides their relations in a certain thematic field, have little analytical scope in terms of the performance of the research fields themselves, in a conceptual way [49]. The thematic analysis requires, then, the identification of keywords that express the structure of relationships among the researched themes.
In addition, Lotka’s law, which indicates an inverse exponential scale of the number of articles per author, can be used to further measure scientific productivity. Few authors tend to publish a large number of articles in a given area of knowledge while most authors publish a small number of papers [50]. Potter [55] pointed out that, when there is a coverage period of 10 years or more, Lotka’s law can be a useful metric.
3.2. Qualitative Analysis
For the qualitative content review, the five most cited studies from each of the four categories previously analyzed were addressed. A higher number of citations should express the higher paper diffusion and recognition in the scientific community. However, we acknowledge that this option might bias the analysis since papers published at a longer period of time tend to have a higher number of citations, ceteris paribus. As only papers published in the last 10 years were included in the review, we assume that the time bias can be mitigated.
The discussion presents the main sources of RES studied in the most relevant studies of each group. It will also discuss a regional view, indicating the main authors’ affiliation, as well as a temporal approach, addressing the years in which these works were published.
Following the example used by Geng et al. [56], the frequency of keywords in each group was analyzed. With this, it was possible to identify the most important topics in the field of the financial evaluation of RES projects. It was also possible to identify the focus of the most relevant papers in what concerns the most used methodologies and even the RES cases/technologies addressed. For the four groups of methods, a critical analysis of the five most relevant works, selected as those with a higher number of citations, was undertaken to better understand the use of financial project appraisal methods and the combination of these methods. The geographical coverage of the studies and their technical focuses were also analyzed to discuss the alignment of scientific studies with market conditions.
3.3. Research Method
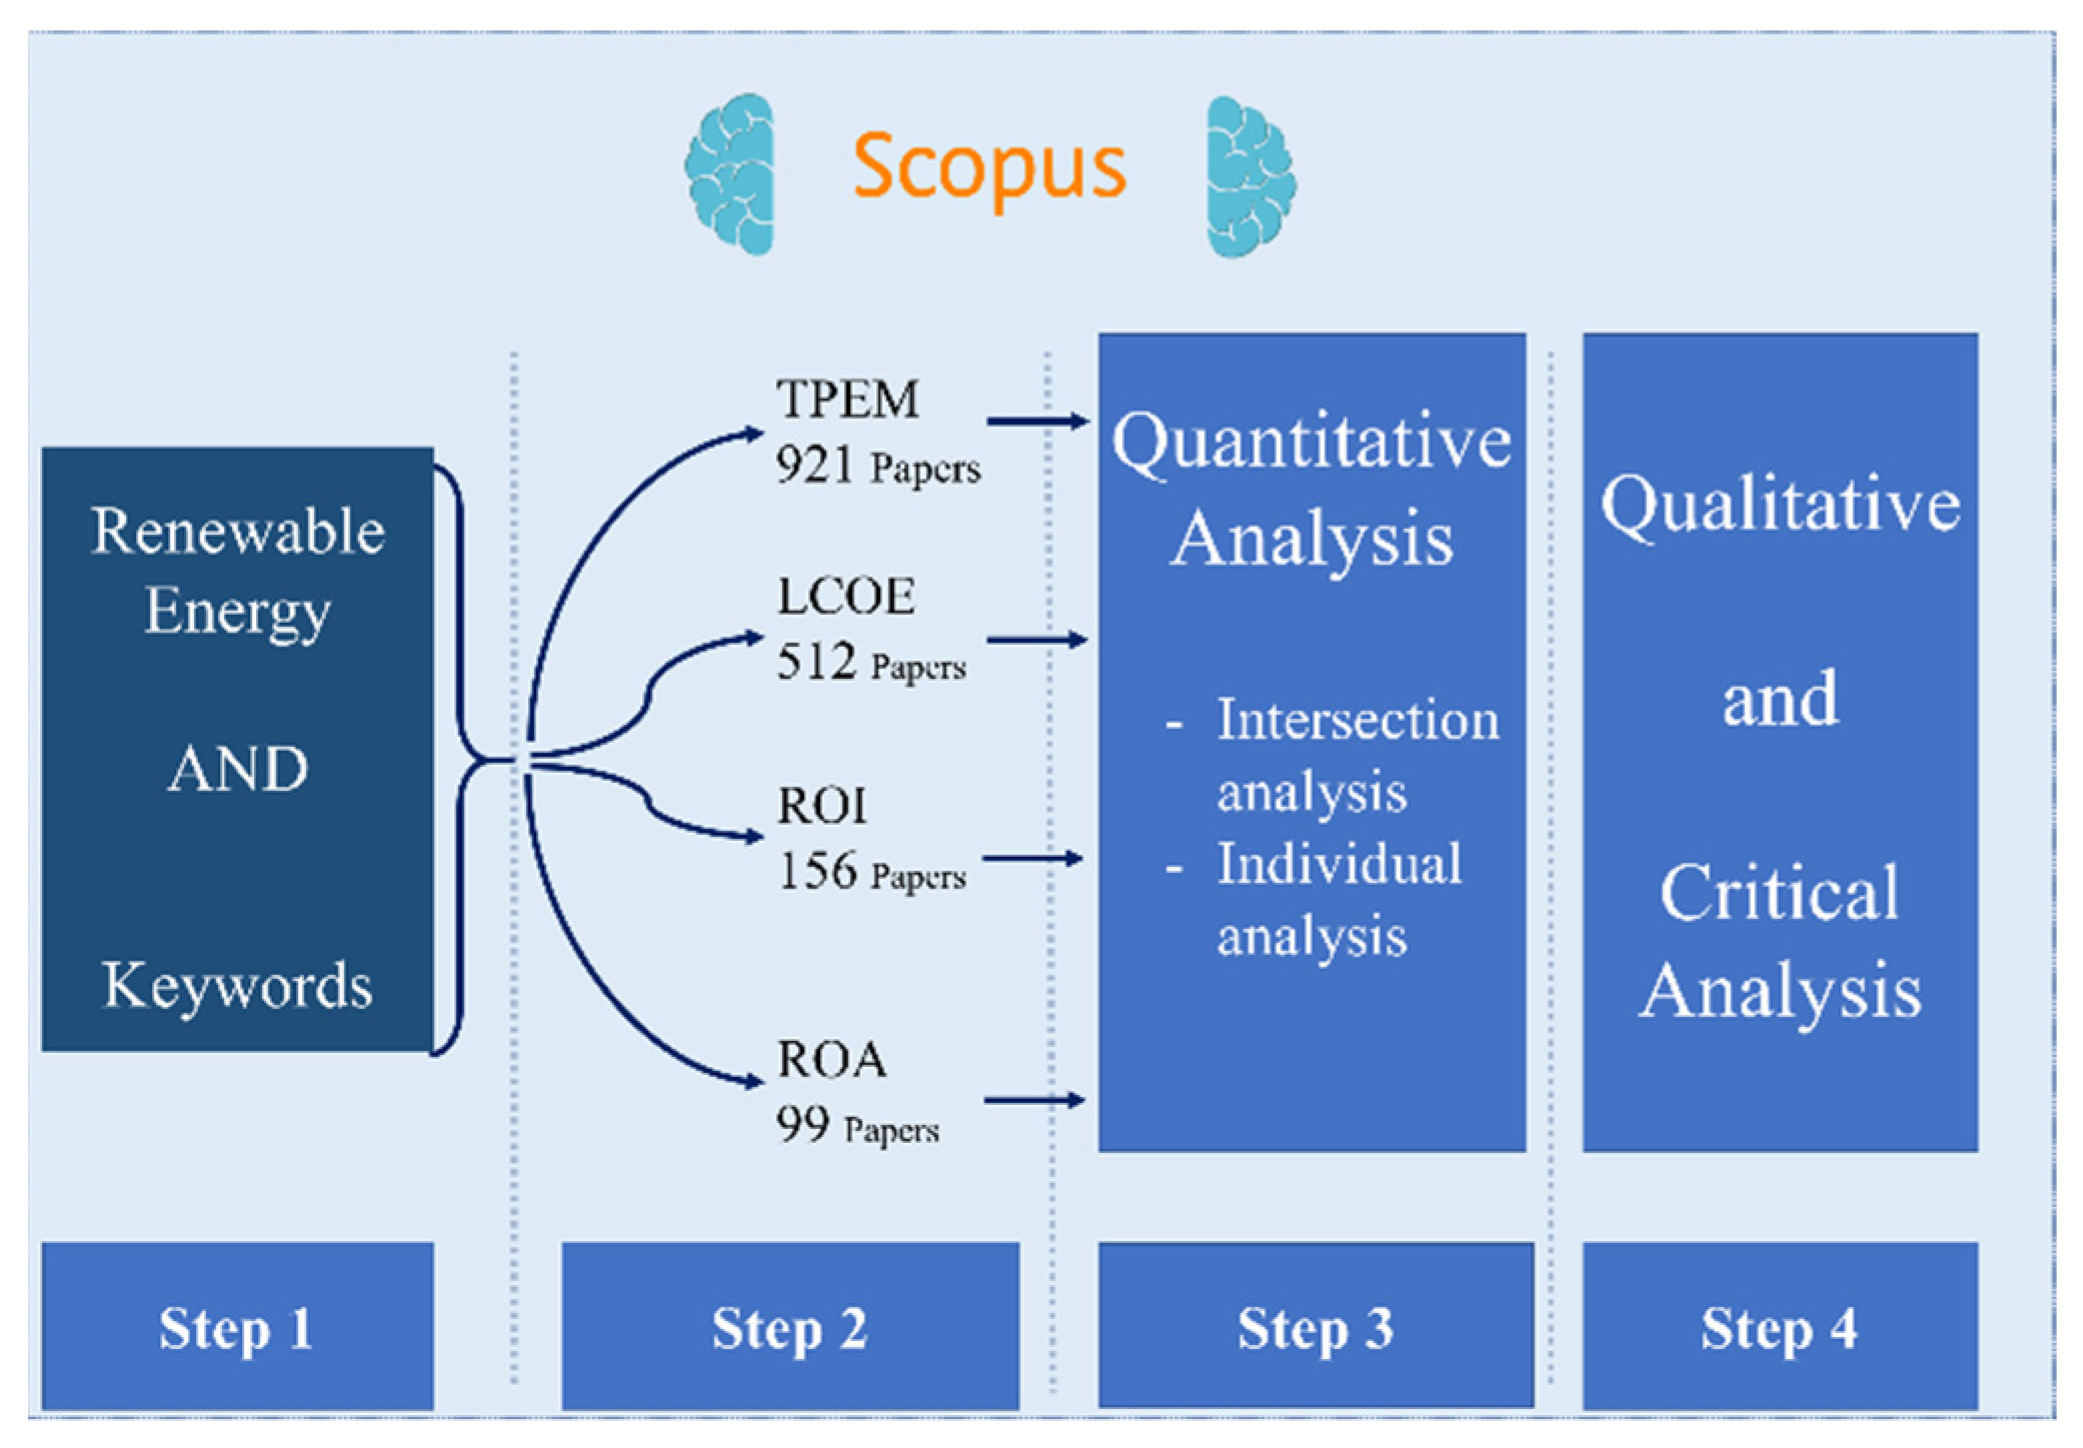
The data for this research was collected in July 2020 using a four-step approach:
Step 1: Search conducted in the Scopus database with the keyword “Renewable Energy”, its plural variation, and the keywords chosen as selection criteria for this research, detailed in Table 2.
Step 2: Only articles in the English language, finalized, published in journals, in the period from 2011 to 2020 (July) were chosen.
Step 3: Quantitative bibliometric analysis of the articles in each researched group.
Step 4: The five most relevant articles were analyzed based on the most cited papers for a qualitative and critical analysis of their content.
The operational procedures are summarized in Figure 1.
These operational procedures ensure then that this study is transparent, in the sense that all activities are reported, it may be reproducible, the reviewed papers were included according to their relevance for the field of study, and the eligibility choices are based on a prior protocol from the definition of keywords selected according to a previous analysis of the literature.
4. Results
Following the proposed research methodology, this section presents first the main results of the quantitative analysis and then the results of the qualitative analysis.
4.1. Quantitative Analysis
This includes the analysis of the intersections of articles included in the four categories of financial evaluation methods for RES projects and the individual analysis of the papers included in each category. For the individual study, the annual rate of publication, the most preeminent authors, countries, and journals in terms of publications and citations were analyzed.
4.1.1. Intersection Analysis
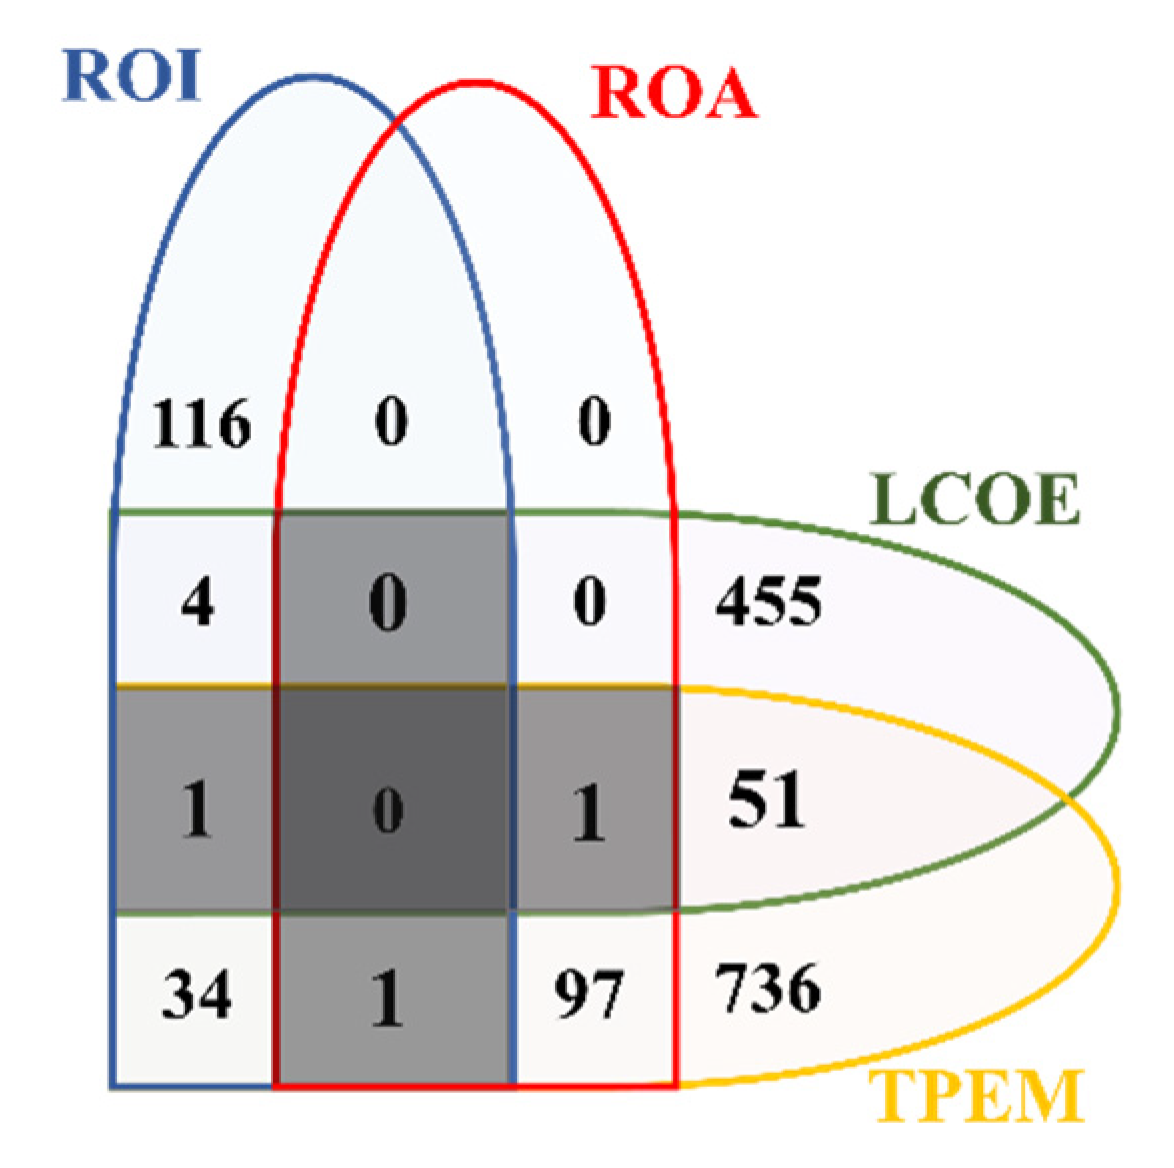
The analysis was carried out without excluding any articles from each group. Therefore, due to their scope, articles may appear in different groups, as shown in Figure 2.
Figure 1 and Figure 2 show that LCOE and TPEM represent the two most important categories of papers including close to 85% of the papers included in step 2. Figure 2 highlights the intersection of different groups, which may be seen as a proxy for the complementarity assessment of the different methods. The following points can be highlighted from the intersection analysis:
- ROI is frequently used independently of other methods. The initial search identified 156 papers using ROI for RES evaluation, and, of those, only one was combined with TPEM, four were combined with LCOE, one included both LCOE and TPEM, and one included both ROA and TPEM.
- The initial search identified 512 papers for LCOE. Of those, 455 did not include other methods for financial evaluation, but 51 were combined with TPEM, four with ROI, one with both ROA and TPEM, and one with both ROI and TPEM.
- The initial search identified 921 papers for the TPEM, but, of these, 185 combined these methods with ROA (97), LCOE (51), ROI (34), both ROA and LCOE (1), both ROI and LCOE (1), or both ROI and ROA (1).
- ROA is never used independently. All papers are always combined with TPEM either alone (97) or with both TPEM and LCOE (1) and with both TPEM and ROI (1).
Figure 1 and Figure 2 demonstrate the importance of TPEM as independent metrics or as metrics that support other analyses. In particular, and as expected, the articles in the ROA and TPEM group should have a certain type of intersection. In this case, all articles in the ROA group were also inserted in the TPEM group; this is explained by the fact that the theory of real options can be seen as a complementary (or extended) approach to the traditional NPV. The results show that the methods tend to be interlinked and changes in the evaluation techniques have been mostly incremental with the expansion of the traditional techniques (such as ROA) or the combined use of more than one technique.
4.1.2. Individual Analysis
Traditional Project Evaluation Methods
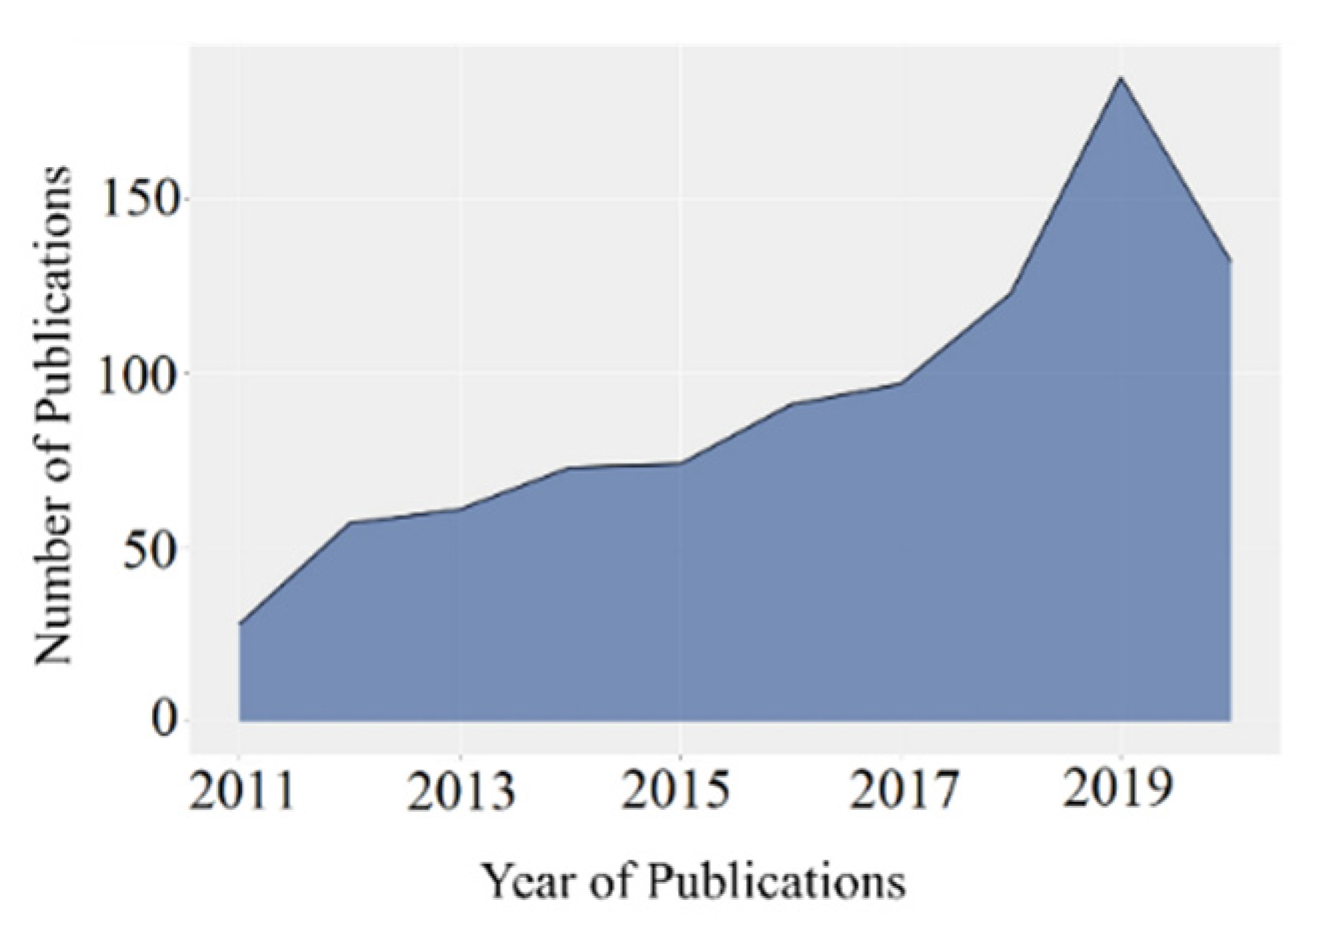
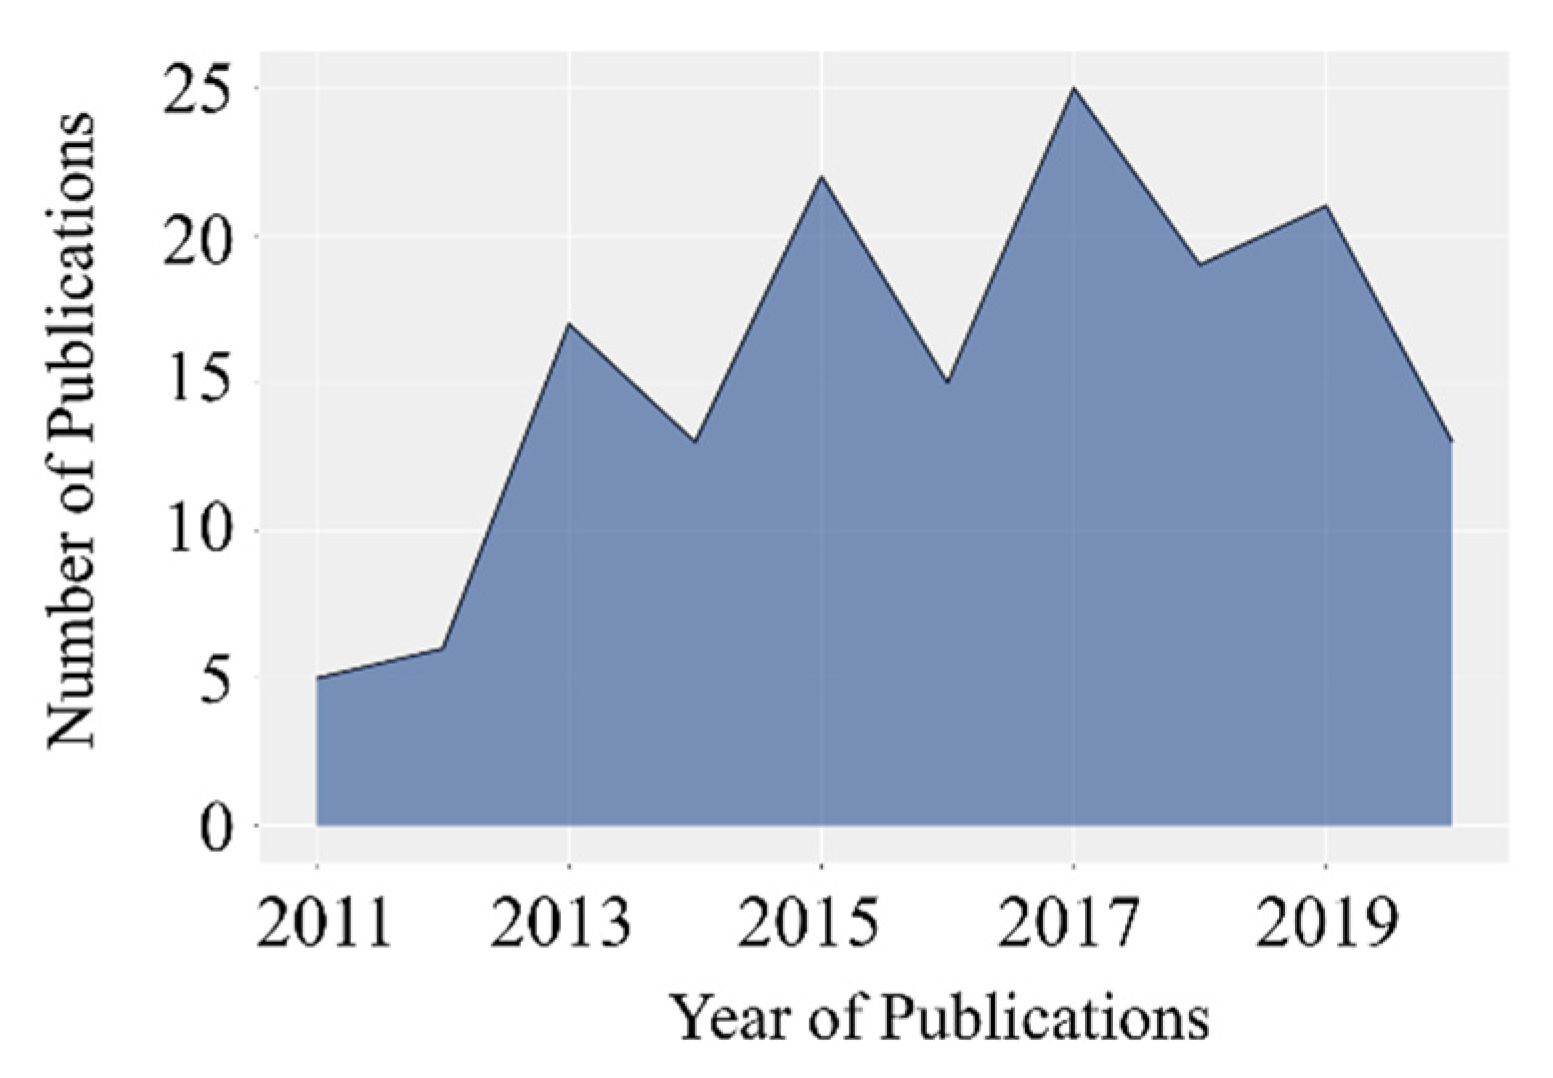
The annual production of this category of articles had an annual growth rate of 18.8% in the analyzed period. In 2019, the total number of articles published was 185. The fall in publications in 2020 is explained by the fact that the gathering of papers was performed in July 2020 as mentioned before. Figure 3 shows, then, that although being based on traditional and well-recognized methods, the use of DCF approaches on scientific papers addressing RES project evaluation has not declined or even slowed down during these 10 years.
Table 3 identifies the 10 most relevant authors in the TPEM category. The list of authors was ordered based on the h-index; however, it is possible to verify that the g-index also tracks the relevance of authorship in the researched field and presents a similar trend.
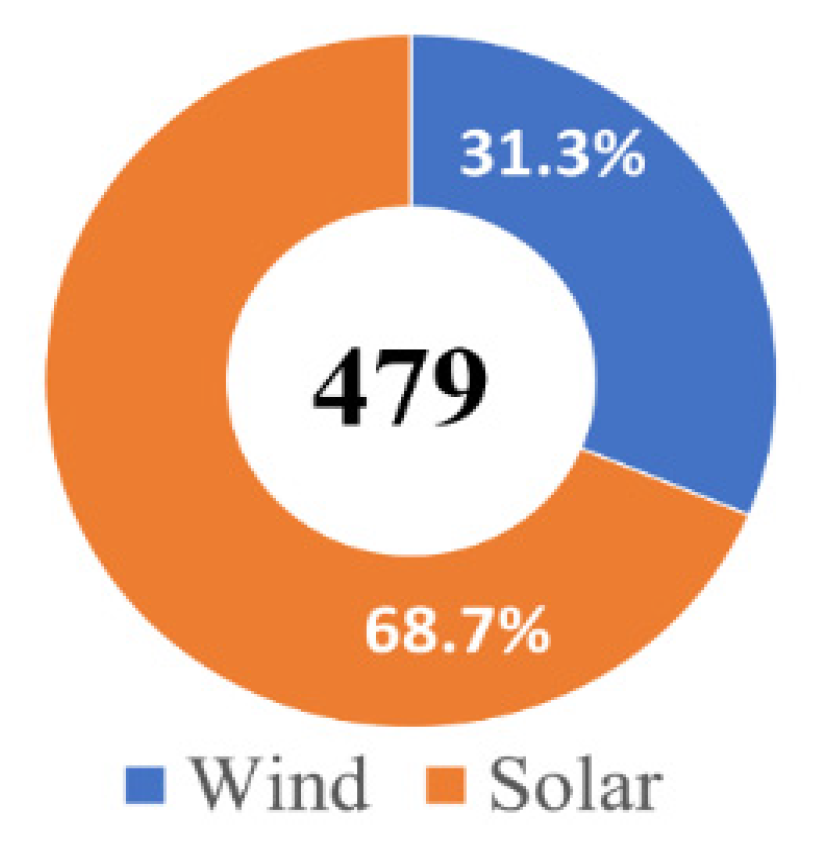
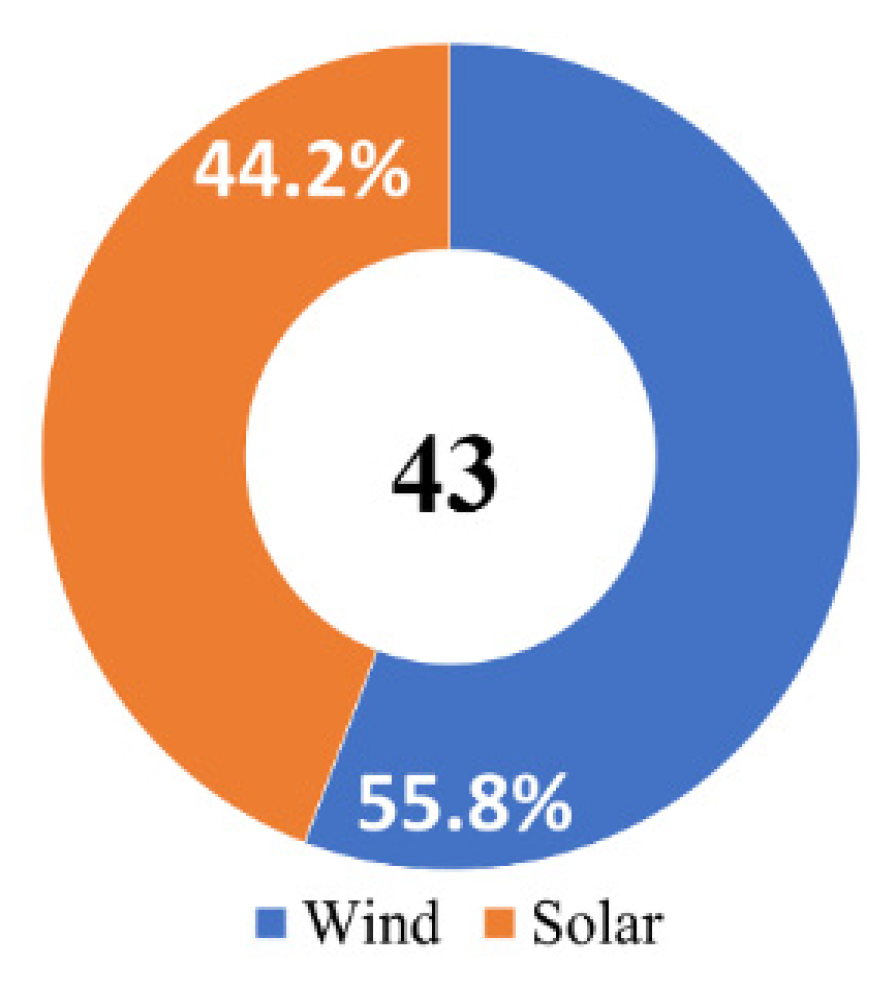
Among the articles in this category, various common words were found. Considering the 15 most frequent words, an analysis was carried out focusing on referred energy sources. Words related to solar energy are more frequent than those related to wind energy. These two sources of energy were the only ones found in the set of the 15 most frequent words. It is worth mentioning that words related to the same source (e.g., solar energy, photovoltaic, etc., were grouped into the word solar). In the set of the 15 most frequent words, words related to both solar and wind energy appeared 479 times as shown in Figure 4.
Regarding the most cited articles in the data set, only two of the 10 most cited publications were not published between 2011 and 2015, which was to be expected, since the probability of an article to be cited tends to increase as the article has been published at a longer period of time, ceteris paribus. Table 4 lists these most cited articles.
Regarding the most relevant publication outlets, Table 5 reveals that among the 10 main journals, Renewable Energy, Energy, Applied Energy, Energies, and Energy Policy comprise 30.5% of all papers in the sample of 921 papers.
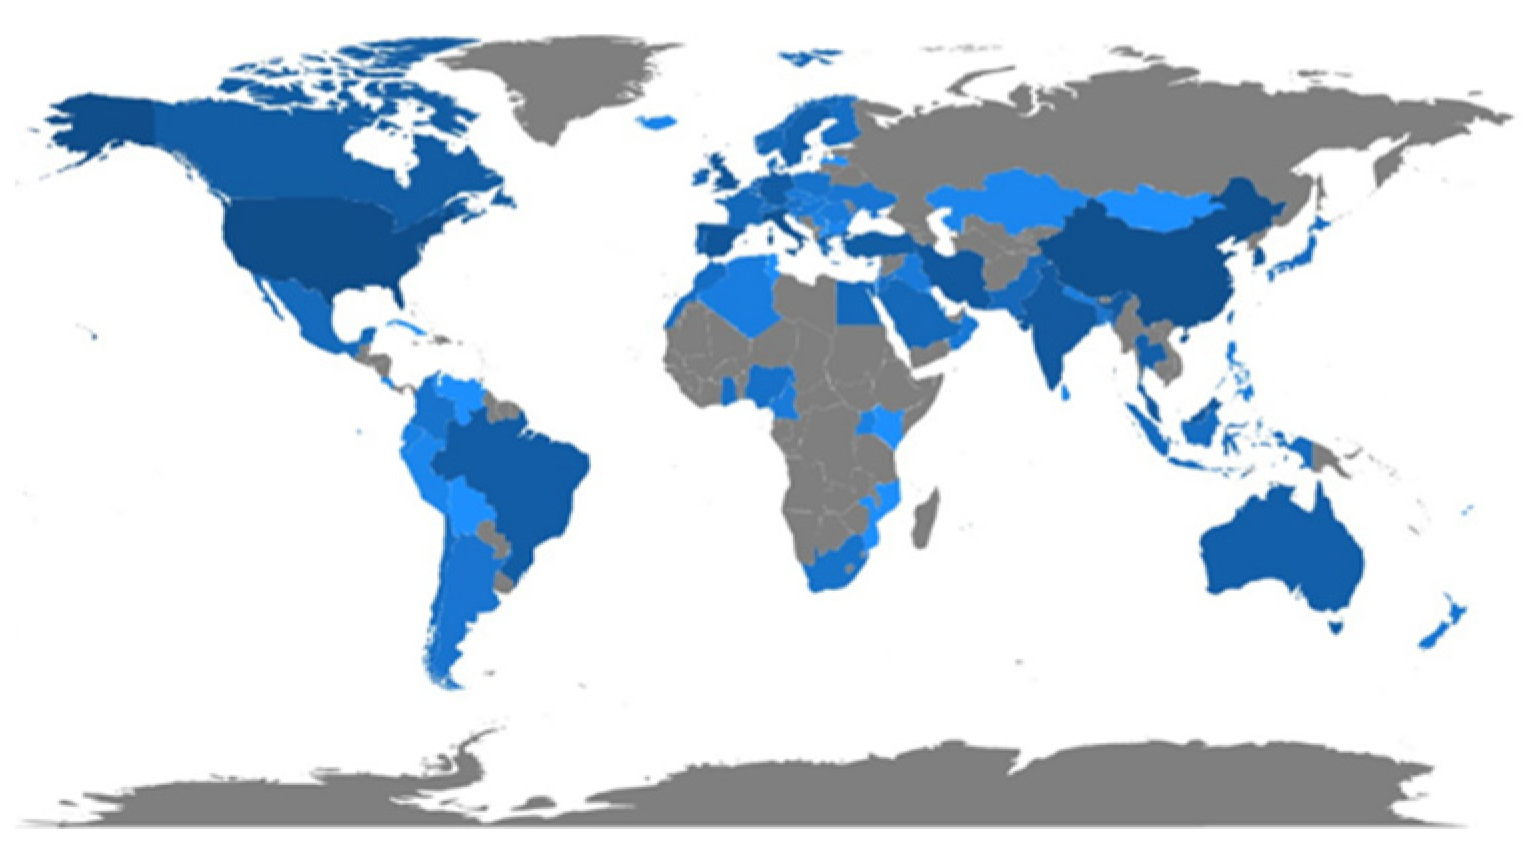
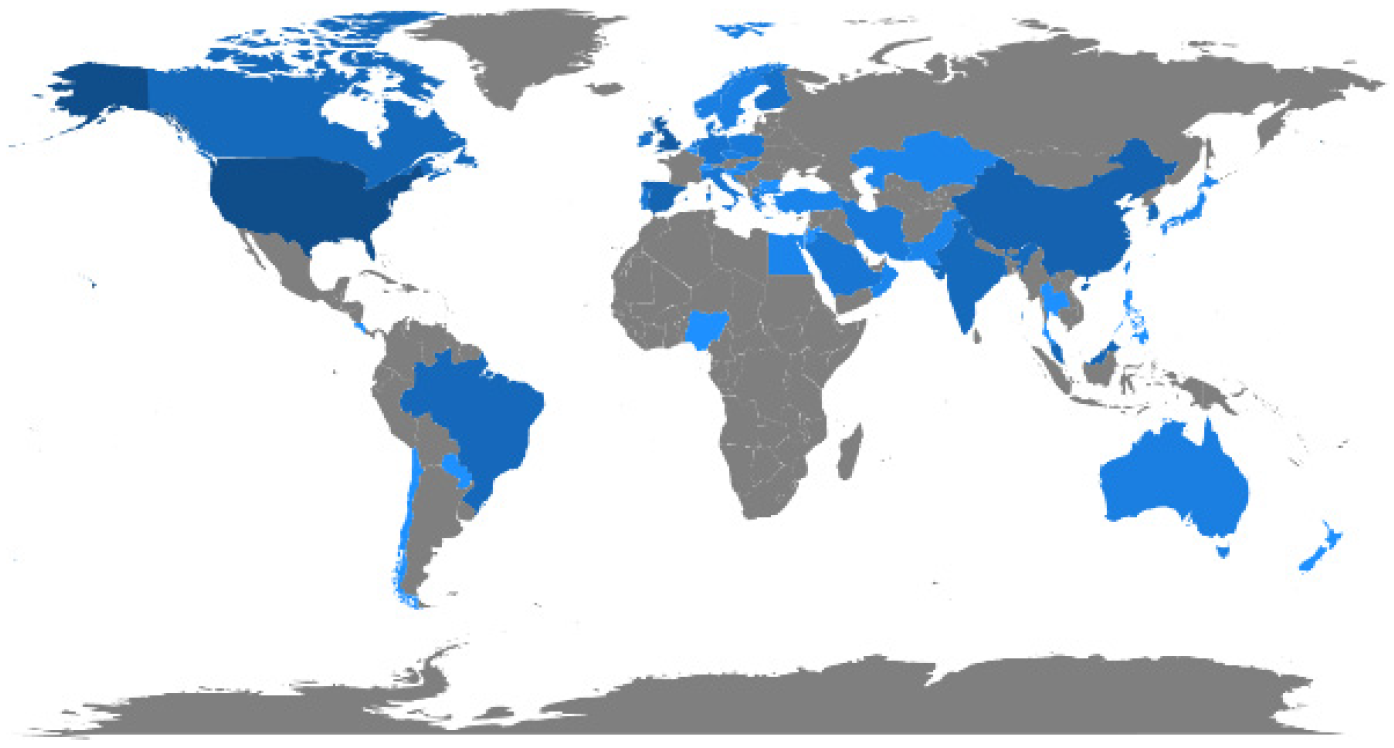
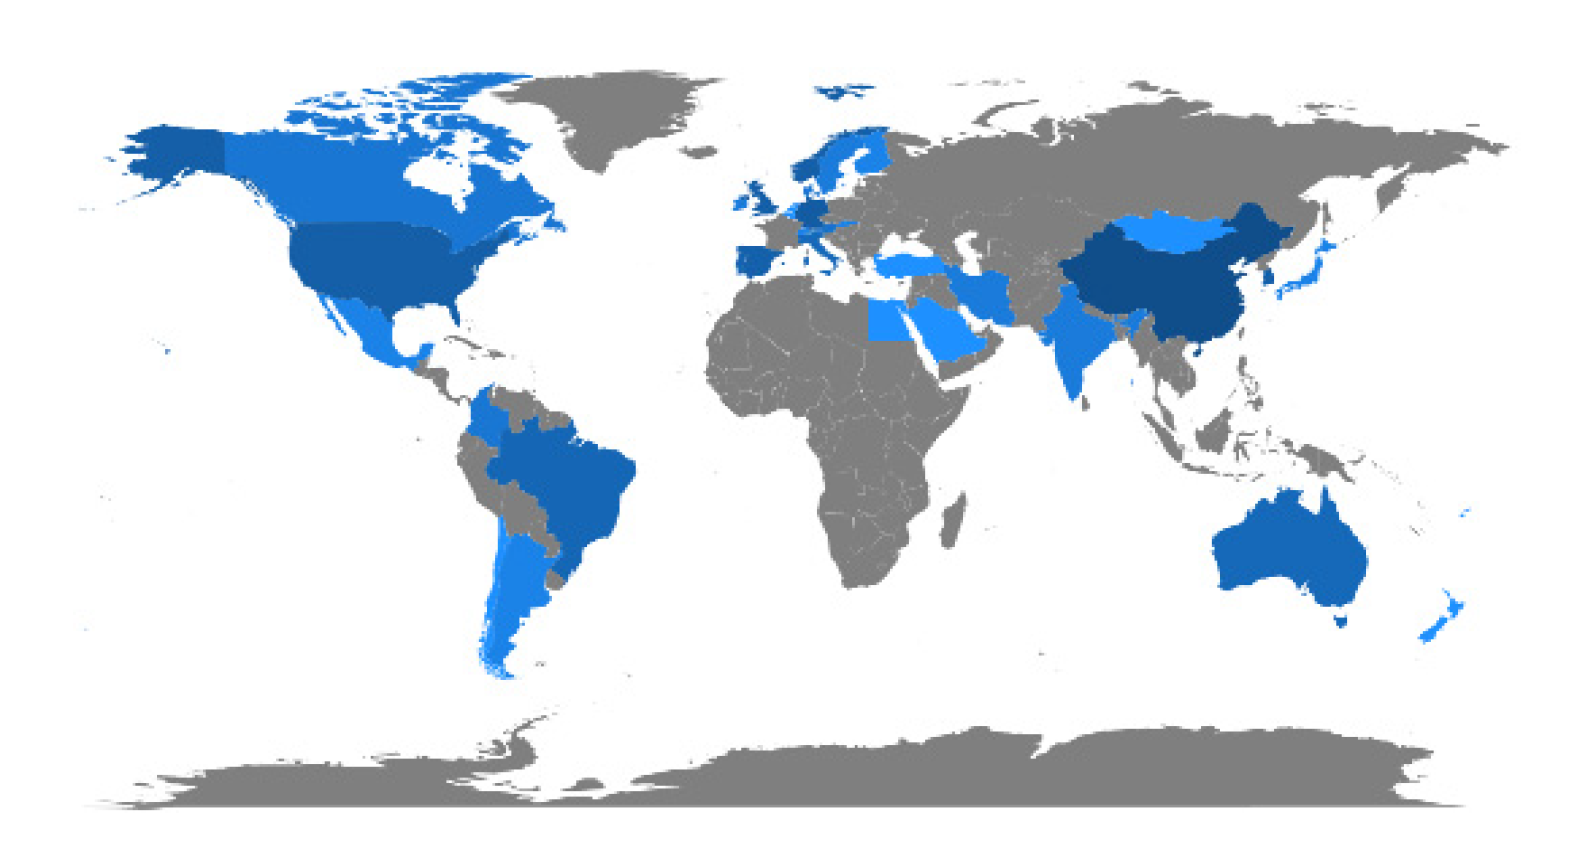
Figure 5 depicts the geographical distribution of the scientific production in this group, defined by the first author’s affiliation country, where the color scale is oriented so dark blue represents a higher number of publications. Considering the group of the 15 most relevant countries, the leader is the USA, with 15.6% of scientific production, followed by China, 12.6%, Italy, 8.6%, UK, with 7.4%, and Spain, with 7.0%. Altogether, these five countries accounted for half of the total scientific production of the 15 countries.
Levelized Cost of Electricity
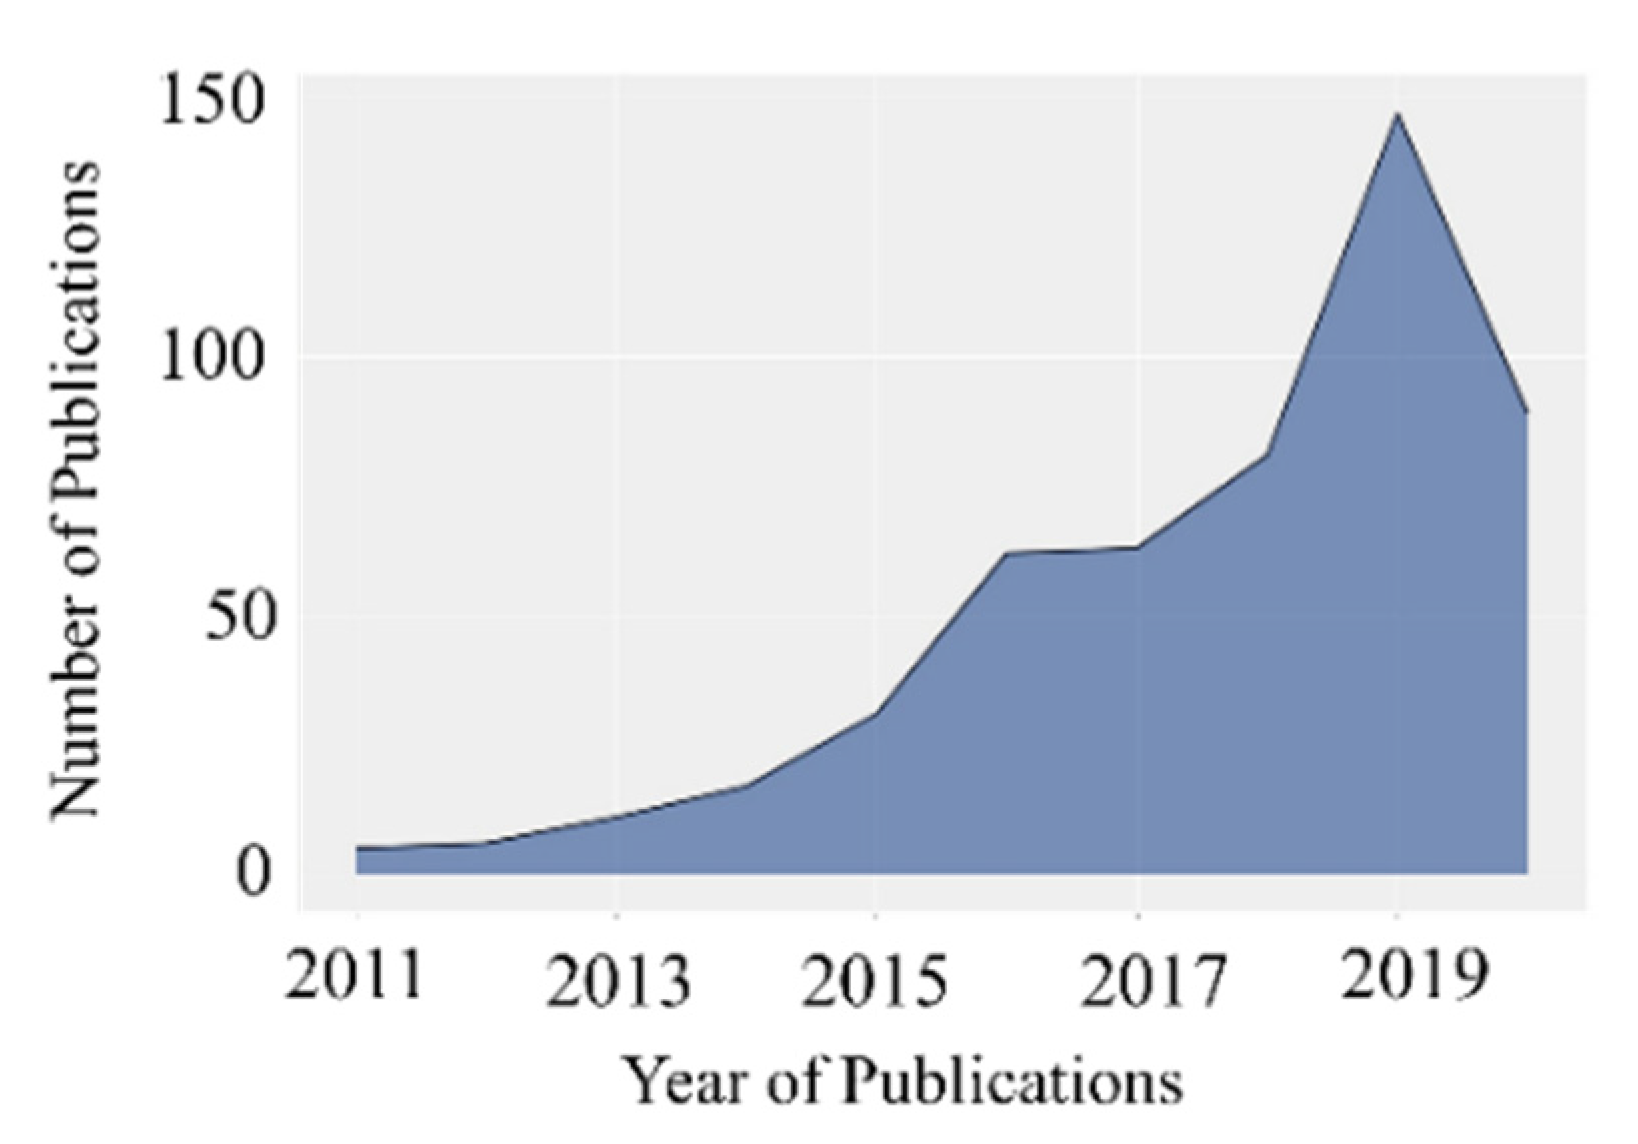
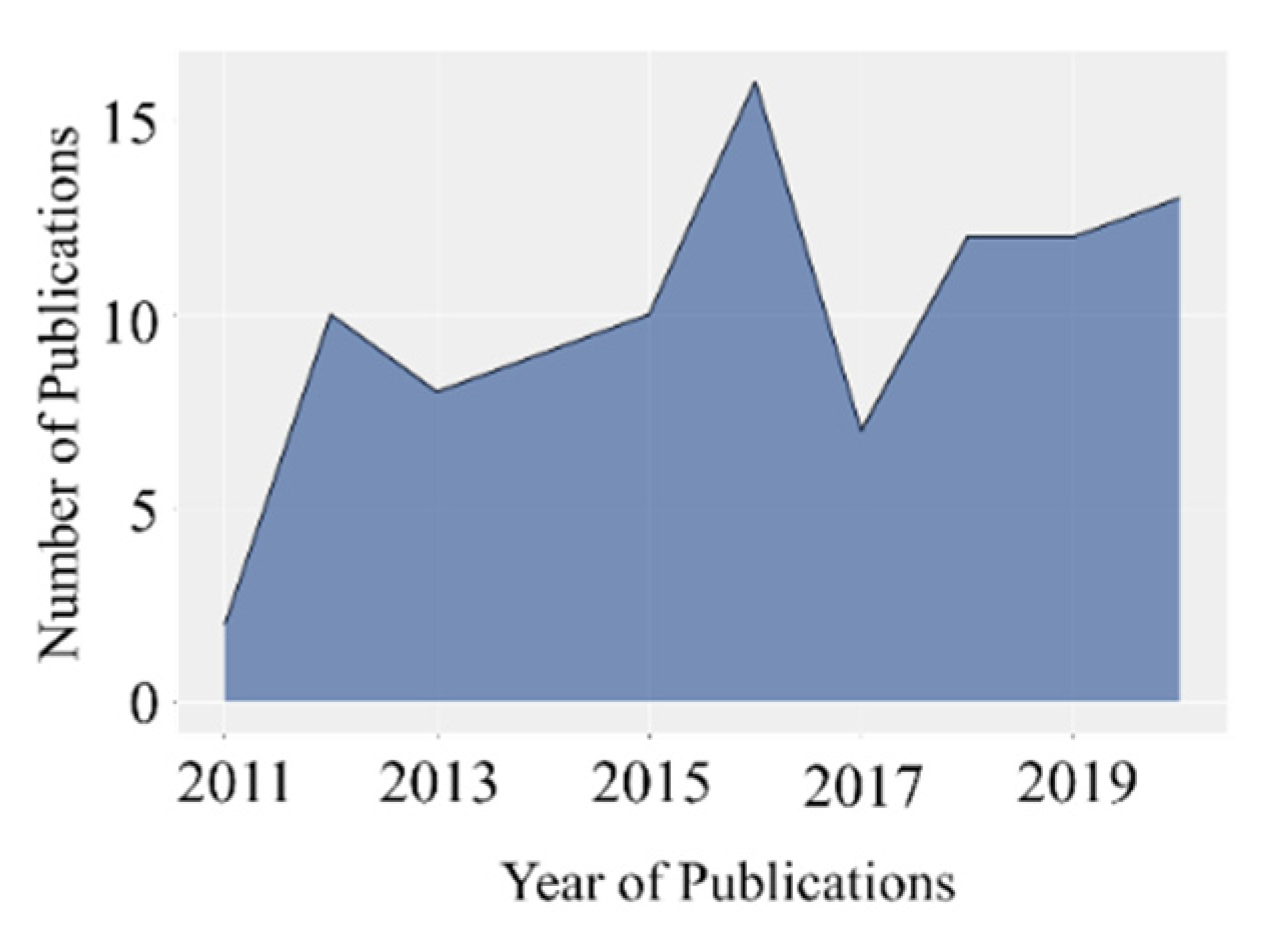
In the LCOE category, the annual production of articles had an annual growth rate of 37.7% in the period under analysis (Figure 6). In 2019, the total number of articles published was 147. The significant growth in the literature on LCOE reflects the very low number of articles at the beginning of the analyzed period and a remarkable number of publications in 2019.
The most influential authors in this category are listed in Table 6. Results show that 60% of the most relevant authors published their first paper on the topic in 2017 or 2015. This evidence reflects another difference when comparing the LCOE category with the TPEM category, with this last one showing that for most authors the first publication included in this analysis dated from 2014 or before.
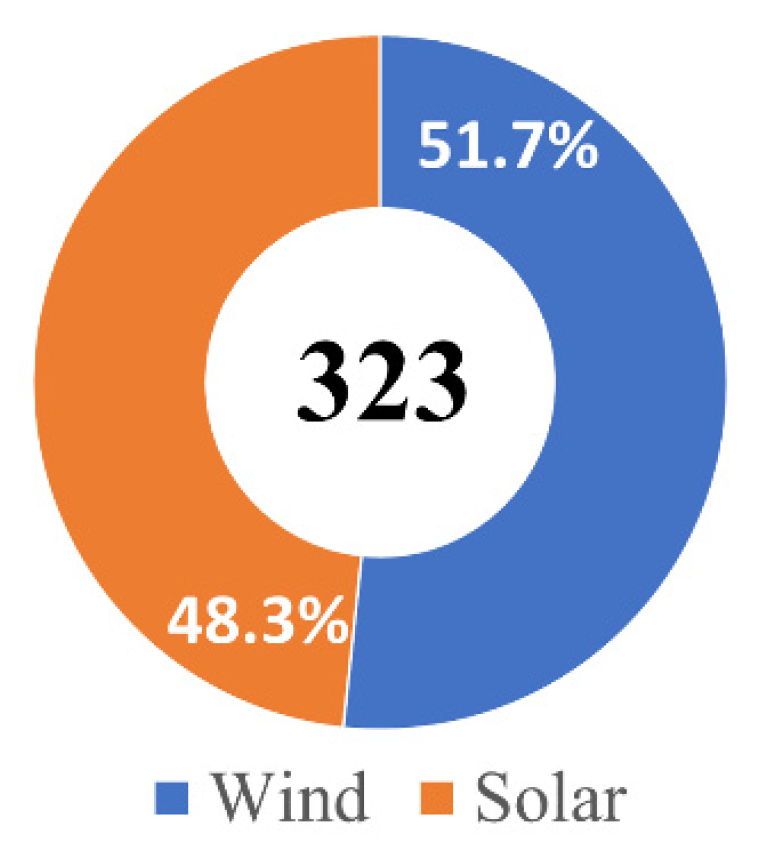
In the group of 512 articles included in the LCOE category, common words that represented the intersection of interests, such as renewable energy resources, renewable energies, economic analysis, electricity generation, were also identified. When the 15 most frequent words were analyzed, wind and solar energy were also identified with 323 occurrences as detailed in Figure 7. Within this group, no other source of energy has been identified.
Table 7 shows the list of articles most cited in the LCOE set. Again, this highlights that these publications tend to be more recent than the ones included in the TPEM category. For this category, the years of publication of the works were distributed throughout the analysis, while in the LCOE category, most of the highly cited papers were published between 2014 and 2017.
Regarding the most relevant publication sources, Table 8 reveals that, among the 15 main journals, Energy, Renewable Energy, Applied Energy, Energy Conversion and Management and Energies represent 39.1% of the 512 papers.
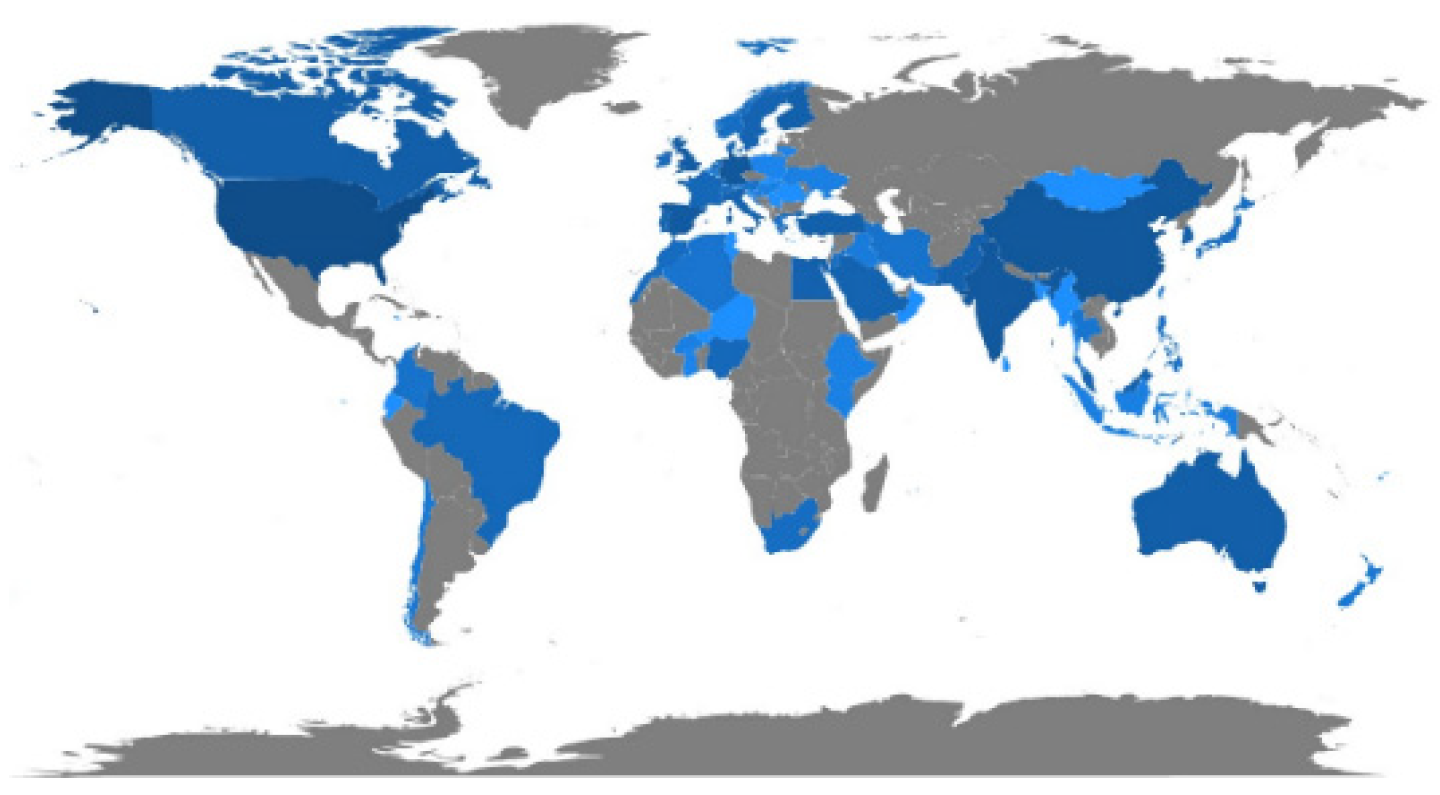
Figure 8 presents the scientific production by country, considering the first authors’ affiliation. The leader is the USA, with 20.6% of the scientific production of the 15 most relevant countries, followed by China, with 9.6%, Germany, 8.9%, India 8.6%, and Spain, with 7.1%. Altogether, these five countries accounted for 54.8% of the scientific production of these 15 most relevant countries.
Return on Investment
In the ROI category, the annual publication of articles had an annual growth rate of 11.2% in the period (Figure 9). In 2019, the total number of articles published was 21. Unlike the TPEM and LCOE categories, the ROI category showed a floating trend throughout the years.
The most influential authors in this category are listed in Table 9. The results show that 53.4% of the authors in the sample of 10 of the most relevant authors published their first papers in 2014 or 2017, in equal shares.
In the ROI category, words that represented the intersection of interests, such as renewable energy resources, renewable energies, economic analysis, electricity generation, were also identified. Within the group of the 15 most frequent words, the only expressions related to energy sources were “wind power”, with 24 references, and “Photovoltaic Cells”, with 19 words (Figure 10). However, despite being in the 15th position among the most cited words, the group of expressions: “Photovoltaic Cells”, “Solar Power Generation”, and “Solar Energy”, when added together result in a total of 50 references.
The 10 most cited papers for the ROI category are listed in Table 10. In the analysis, 60% of these 10 most cited articles were published in 2013 or 2015.
The 10 most relevant publication outlets can be seen in Table 11. In this list, the five top journals represent 30.8% of all the 156 papers of the sample.
The most productive countries in terms of the first authors’ affiliation are listed in Figure 11. The leader is USA, with 29.5% of the scientific production in the sample of the 15 most productive countries, followed by the UK, with 12.9%. As for China, it represents 7.6%. Altogether, these three countries accounted for 50% of the publication of these top 15 countries.
Real Option Analysis
The annual production of articles in the ROA category presented an average yearly growth of 23.12% in the period (Figure 12). Unlike all other categories, the number of papers published in this category in 2020 is already higher than the number of papers published in each of the three preceding years, which seems to indicate an increasing interest in this method.
Considering the more influential authors, the most frequent year of the first publications on the topic was 2014, with 33.3% of the publications indicated in Table 12.
The analysis of the most frequent words in the ROA category also demonstrated that wind energy was the only source with occurrences among the 15 main keywords, with 25 occurrences.
The most cited papers included in the ROA category are listed in Table 13.
Table 14 shows the list of most relevant journals for this set of articles. The five main journals concentrate more than 47% of the publications of all 99 works in the sample.
Figure 13 describes the scientific production for the top 15 publishing countries. The authors affiliated with Chinese institutions account for 21% of these publications. Germany lies in second with 9.1%, followed by Norway, South Korea, and the UK all of them representing 8.1% of these publications.
Table 15 shows that China is also a relevant country when it comes to articles cited by authors linked to their institutions. In this group, the USA has no leadership either in the production of articles or in citations.
4.2. Qualitative Analysis
For the qualitative content review, the five most cited studies from each of the four categories previously analyzed were addressed.
4.2.1. Traditional Project Evaluation Methods
In the most cited articles in the TPEM category (Table 4), Espinosa et al. [57] combined the energy PBP with LCOE to evaluate simplified photovoltaic cells. The authors proposed a polymer solar cell technology capable of generating very low-cost solar energy, capable of being paid for during a day of use. The energy PBP derives from the traditional PBP metrics adapted to assess the period required for an energy system to generate the same amount of energy that was used to produce the system. The authors highlight the scalability factor as a preponderant to guarantee a scale production to the point that the generation is sufficiently compensable to this one-day payback.
Şengül et al. [58] used PBP as a criterion for the classification of renewable energy supply systems in Turkey. However, the use of the traditional PBP method is only peripheral and is set as one of the economic criteria included in the proposed MCDM approach. It is worth mentioning that, although relevant enough to be considered, technical and environmental aspects prevail for the selection of renewable energy sources.
Bradbury et al. [59] applied the IRR indicator to assess the economic viability of implanting different energy-storage systems responsible for the greater stability and efficiency of the renewable energy system. The authors concluded that, among the storage systems compared in the study, the most viable are pumped hydro storage, Sodium Nickel Chloride batteries, and compressed air energy storage. The authors used the IRR to analyze the effect of device parameters on revenue and compare technologies across market conditions.
Boomsma [60] examined the sources of uncertainty related to the choice of support schemes, namely, feed-in tariffs, and negotiation of renewable energy certificates. Although addressing TPEM, the focus of this paper is related to real option analysis, and it mainly cites NPV as a starting point. Moreover, the authors discuss the limitations of traditional NPV under uncertain market conditions.
Schelly [61] presented an empirical study to identify the factors that motivate the residents of Wisconsin (USA) to adopt residential solar electric technology. The author pointed out that PBP, considered a popular way of referring to ROI, is an important economic calculation tool capable of contributing to decision-making by investing in residential photovoltaic energy projects. The authors argue that the PBP is a standard economic calculation provided by solar installation companies and helps to link short-term decisions to long-term returns.
An important outcome of the works most cited in this TPEM category is the presence of studies combining two or more tools for economic evaluation. This finding seems to be more related to the nature of the evaluation techniques than to the nature of the RES projects. Since the evaluation techniques included in the TPEM category are very closely related, there is the tendency to use those techniques simultaneously [94]. Moreover, although these evaluation techniques have been widely discussed in the academic literature, there has been no consensus about the best one to use in practice [95]. Therefore, practitioners tend to use more than one evaluation technique as complements to take a more reliable decision. For example, Espinosa et al. [57] combined the LCOE and PBP methodologies to price the manufacture of simplified photovoltaic cells. In this case, LCOE was mostly related to the evaluation of the project while the PBP demonstrated that the scalability of the photovoltaic cell production line can support its energetic viability. Also remarkable is the use of these metrics as part of MCDM studies showing the importance of TPEM individually but also as part of more integrated approaches for project evaluation or energy planning. Of the five analyzed papers, only one of them (Bradbury et al. [59]) applied IRR for direct supporting decision making and another one (Boomsma [60]) used NPV although supporting the ROA study. Regardless of the criticisms surrounding PBP, it seems that it remains an important indicator that can derive from its simplicity and ability to be adapted to different approaches (e.g., energy PBP) and to communicate with the final technology user.
4.2.2. Levelized Cost of Electricity
In the LCOE category (Table 7), it is possible to identify that the tool is also widely used for the economic valuation of RES projects. However, Ueckerdt et al. [67] highlighted some weaknesses in this methodology. According to the authors, LCOE does not capture the variability and integration between energy sources, which are common in the field of renewable energy. Therefore, Ueckerdt et al. [67] proposed a new cost metric, System LCOE, to handle variability and account for the integration of costs related to extra investments and operations costs that may emerge for accommodating wind and solar power in the system.
Darling et al. [68] also emphasized the misuse of LCOE as a method of comparing electricity-generation technologies. According to the authors, the use of LCOE as a deterministic parameter can reveal an unfounded and potentially misleading sense of certainty. Instead, the authors proposed considering input parameter distributions based on available data so that an LCOE distribution can more accurately reflect the cost uncertainty associated with renewable-energy projects. However, LCOE remains a popular technique and its application for the economic evaluation of RES projects can also be found in the most cited articles of the LCOE category.
Zamalloa [69] combined the use of LCOE with other traditional valuation methods and proposed a lower-cost alternative to produce energy using microalgae as a raw material. Li et al. [70] carried out a techno-economic viability study of a hybrid and autonomous energy system combining wind and photovoltaic sources with an energy storage system in a residence in Urumqi, China. For the case study, the authors concluded that the autonomous hybrid system is economically more interesting than systems that use only one of the sources associated with storage. Dalla Rosa and Christensen [71] also used LCOE as a methodology for calculating energy efficiency applied to homes. Given the high demand for electricity for heating systems in regions in northern Europe, the authors demonstrated that heating systems based on RES are reliable in supply security for users in Denmark. LCOE was used to show that investment costs represent up to three-quarters of total expenditure over a 30-year period.
The use of LCOE is recurrent for the viability analysis of domestic renewable energy systems for both electricity and heat generation. This factor may be related to the use of software specialized in this type of approach and which includes LCOE as an indicator of the viability of the projects (see, for example, [96]). The simplicity of the method allied to the industrial acceptance to compare energy technologies must be underlined. Regardless of the criticisms, the reviewed papers demonstrated the relevance of the method and opened routes for possible extensions and improvements.
4.2.3. Return on Investment
In the most cited articles in the ROI category (Table 10), Jenner et al. [77] used ROI as a dependent variable in a panel data model to confirm that policies to support renewable energy are important tools to drive capacity development in this sector in Europe. The authors found that incentive policies drive RES investments via the effect on the expected ROI.
The work of Schelly [61] addressed ROI in general terms for assessing the rationale and economic impacts of residential solar electricity adoption, although clearly relating it to the PBP metric. Eriksson and Gray [97] reviewed the transition to electricity for transportation including battery and fuel cell electric vehicles. The authors’ critical analysis is focused on the integration between hydrogen energy technologies and hybrid energy systems. When referring to ROI, the authors encompassed several economic metrics with the main objective of showing the need to evolve and give way to more comprehensive mechanisms with a holistic view including environmental and social considerations.
Cherrington et al. [78] analyzed the impact of the revisions of solar photovoltaic tariffs in the UK. They applied a financial analysis for two installations to identify the impact of these tariff cuts on the ROI and simple PBP of the photovoltaic system. The authors concluded that, even with a lower tariff, micro-installations for photovoltaic power generation can still be viable. However, they highlighted the need for these investments to focus on more efficient modules while considering the costs related to the disposal of materials at the end of their useful lives.
Likewise, Muhammad-Sukki et al. [81] also analyzed the deployment of electric power photovoltaic systems for both domestic and non-domestic uses in Japan and computed ROI and the simple PBP. The authors also considered the impacts of the implementation of a new tariff model in the country, which includes specific prices for solar photovoltaic installations. The authors concluded that, given the new model of renewable energy incentive tariffs, any nonresidential installation with a size of 100 KW in Japan could have an ROI of 7.43% per year, exceeding the return on value in European countries.
The studies addressing the ROI method showed that the term is frequently used under a broader view to assessing the economic viability of an investment. As for the studies applying ROI metrics, the simplicity of the approach should be highlighted, as most of them rely on non-discounted approaches frequently based on accounting profit metrics and metrics combined with simple PBP.
4.2.4. ROA
In the most cited articles of the ROA category (Table 13), it is possible to identify examples of applying real options to support the investment decision-making process. As mentioned before, Boomsma et al. [60] analyzed the investment in renewable energy in the face of tariff support and renewable energy certificates. Given the sources of uncertainty existing in these investments, the authors focused their analysis on a Nordic case study based on wind energy and concluded that, as the investment is made, the trade in renewable energy certificates creates incentives for larger projects.
Fuss et al. [86] highlighted the role of uncertainties in the decision-making process for investments based on renewable energy. Considering the probability of the occurrence of certain events, the authors used the real options model to improve the decisions for these investments considering different socio-economic scenarios.
Reuter et al. [87] used the theory of real options to analyze the decisions of an electric energy producer to invest in a new generation capacity. This mechanism was used based on the uncertainty related to future energy prices and environmental variables. The authors pointed out that the uncertainties existing in this type of project affect the distribution of profits and demand mechanisms such as incentive rates to make investments viable and enable the entry of new investors.
Zhang et al. [88] used the concept of real options to evaluate an investment in renewable energy considering the existence of uncertainty in factors such as the price of CO2, the cost of non-renewable energy, the market price of electricity, and the cost of investment. The authors applied the ROA to a photovoltaic solar power generation project in China and concluded that the high volatility of electricity and CO2 prices makes the country’s market unfeasible to attract immediate investments in these projects. The authors also pointed out that greater subsidies and greater market stability are factors that can overcome these barriers.
Finally, Wesseh and Lin [89] used the concept of real options to evaluate an investment in renewable energy considering the existence of uncertainty in factors such as the price of CO2, the cost of nonrenewable energy, the market price of electricity, and the cost of investment. The authors applied the ROA to a photovoltaic solar power-generation project in China and concluded that the high volatility of electricity and CO2 prices makes the country’s market unfeasible to attract immediate investments in these projects. The authors also pointed out that greater subsidies and greater market stability are factors that can overcome these barriers.
The works using the ROA method confirm the close relation of this approach with TPEM as it can be seen as an important extension of the traditional discounted cash-flow methods. ROA can support the risk analysis of the RES projects in light of the market changes and technological advancements and can help assess and quantify the managerial flexibility of these projects. However, it is also obvious that this is still considered a complex approach that requires more data and more sophisticated mathematical models. If, on one hand, this poses important challenges for industrial acceptance, on the other hand, it also shows the promising potential of applied academic studies.
5. Discussion
The geographical coverage of the papers shows the dominant role of publications from the USA, China, and Europe. This is not an unexpected outcome and also reflects the development of RES in these countries/regions, which altogether represented 63% of the total installed RES power in the world in 2019 [33,98]. Particularly remarkable is the case of China, which represented 30% of the total installed RES power in the world in 2019 against 19% 10 years ago [99]. This somehow justifies the increasing number of papers coming from China and the number of citations particularly evident for LCOE and ROA categories. One of the reasons for this result may be related to the Asian country’s efforts to develop rural electrification, with incentive policies to stimulate the private sector [100]. As mentioned before, distributed generation systems can easily use LCOE as a feasibility assessment method. As for the USA, although showing a growth rate of almost 7% per year, it still lags behind China and Europe in installed RES power. Nevertheless, the number of papers and citations shows a promising interest from the USA scientific community in the topic of RES project evaluation.
Regarding technology concerns, wind and solar are still the main paper targets. Once more, this may be explained by the increased adoption rate of these technologies globally between 2011 and 2019, reaching more than 13% per year for wind power and more than 30% for solar power [99]. The growth in China must be highlighted with almost 70% per year for solar power. In fact, solar power has been growing significantly for all countries, and the low initial values (with 2011 as a reference year) justify this high growth rate, especially in China, the USA, and Canada. Both LCOE and TPEM categories address both technologies, but it is still wind that captures most attention of the reviewed papers for ROA. This may be due to the perceived variability of the wind power output and of the market conditions that call for further studies allowing the integration of uncertainties on the financial project appraisal.
China assumes a more influential position in both scientific production and citations on ROA. This may be linked to concerns about the uncertainties related to the expansion of the electricity system based on RES, the increasing interest of the academy in dealing with risk and managerial flexibility in project evaluation, and increasing importance of RES for Chinese investors in different countries. China made a bold commitment to reduce the emission of greenhouse gases at the Copenhagen conference in December 2009 [101]. Since then, the country has made significant investments in RES. The recent National Energy Administration (NEA) provided guidance to reach 40% RES in electricity generation in 2030 against 29.5% in 2020 [102] and achieve carbon neutrality before 2060 with significant additions of both solar and wind power plants [103]. The accelerated pace of economic growth in China, in addition to the heavy dependence on fossil fuels, are elements that can bring more uncertainty to the energy transition process in the Asian country than in other experiences in more developed countries. Moreover, the increasing importance of China in scientific production for different topics is well evident as debated in [104] and the case energy is no exception.
In summary, some critical points can be highlighted based on the study and should contribute to answering the research question:
- The scientific studies seem to be well aligned with the RES growth with the reviewed papers reflecting a high interest in well-established RES technologies and in countries or regions with high RES share.
- Traditional models based on DCF still play a dominant role in the scientific community. Although a large number of financial evaluation techniques can be found in the literature, see for example [105,106], the most used to determine whether an investment project should be accepted or not are the NPV, IRR, and PBP [107]. Since project finance is a form of funding that relies on the forecast profitability of the project, not on the creditworthiness of the company [108], the characteristics of using the project’s cash flow for its valuation help explain this dominance. Although the studies recognize the limitations and discuss, in particular, the importance of the assumed discount rate, the use of NPV, PBP, and IRR still seem to guide most investment decisions. Simple PBP methods are rarely used as a single approach and in most cases, they are included as one decision criterion among others or as a starting point for the development of other metrics.
- As for LCOE, although being extensively criticized in the literature, still represents a remarkable method to be used for example for benchmarking different technologies. This interest might be justified because it is intuitively clear and allows the comparison of the relative costs of different energy types [109]. The viability analysis of residential projects focused on distributed generation is a good example of the extensive LCOE application, and specialized software in these studies contributed to the high popularity of this indicator.
- As for ROA, the results suggest that this methodology is yet not as popular as might be expected for authors in USA institutions. However, its popularization among authors from institutions located in Europe, where renewable energy systems are more developed, as well as among authors from institutions located in China, where there is a great potential for the development of this sector, can demonstrate its usefulness as a tool to analyze the viability of projects, albeit in a complementary way. The ROA does not replace the NPV but, rather, improved it by explicitly accounting for risk and managerial flexibility. ROA is increasingly recognized as an important approach but its complexity severely undermines its wide utilization. In particular, when communication with the final user is required or when energy planning and policies need to be clearly justified these simpler measures take a dominant role.
- Both LCOE and ROA papers demonstrate the need to bring together industrial practitioners and the academic community by turning simpler methods into scientifically robust ones and disentangling complex approaches to respond to industrial needs.
Regarding the research methodology, the use of a revision based on previously established categories allowed for a better understanding of the investment decision methods and how they relate to different countries and technologies. The proposed intersection analysis also showed how different methods are related and may complement each other, which is also evident in the reduced set of journals that concentrate most of the publications. As for this last aspect, it is important to highlight that this revision included only articles that illustrated the application of financial evaluation methods for RES projects, and, as such, review articles were excluded, which may have limited the inclusion of papers from journals dedicated to reviews.
6. Conclusions
This article contributes to a better understanding of tools that support the economic evaluation of RES projects by presenting the results of a review based on scientific production on the subject. The study identified that, in the context of scientific papers, the most widespread RES projects are related to wind and solar energy.
The most traditional tools used to evaluate RES projects are more popular in solar energy than wind energy while more complex mechanisms such as ROA are more widespread in studies related to wind energy. The dissemination of instruments and techniques to measure the uncertainties related to the incidence of winds can explain this empirical evidence.
From a geographical point of view, looking at author affiliations, the most traditional techniques are more common in publications from countries such as the USA, Italy, Spain, and Germany, while Asian countries, such as China and South Korea, have higher scientific production involving the technique based on real options.
The critical analysis provided some future research directions. Future research could analyze how these RES evaluation techniques vary and how they can be associated with other techniques to build more reliable and effective performance indicators. In fact, only about 23% of the reviewed studies seem to show some interlinkage between each other somehow overlooking the complementarities of these indicators. In particular, the use of TPEM with ROA is well established, but LCOE is still frequently used as an independent method that could benefit from integration in more holistic studies, for example addressing uncertainties of the energy markets and technology development.
Although the linkage between financial studies and well-established RES technologies is evident, additional research is required to address promising new RES technologies or emerging enabling technologies. For these innovative projects, risk and flexibility-related approaches are particularly relevant, and ROA can bring important insights. However, the use of ROA is still limited, which may derive from the perceived complexity of application and interpretation, particularly for lay people/investors. As such, future studies should focus on identifying factors that prevent greater dissemination and usability of more complex investment appraisal methods and even promote a “user-friendly” approach to these methods.
Author Contributions
Conceptualization, V.D.-S., P.F., J.C. and H.K.; methodology, V.D.-S.; software, V.D.-S.; validation, V.D.-S., P.F., J.C. and H.K.; formal analysis, V.D.-S.; investigation, V.D.-S., P.F., J.C. and H.K.; data curation, V.D.-S.; writing—original draft preparation, V.D.-S.; writing—review and editing, V.D.-S., P.F., J.C. and H.K. All authors have read and agreed to the published version of the manuscript.
Funding
This research received no external funding.
Institutional Review Board Statement
Not applicable.
Informed Consent Statement
Not applicable.
Data Availability Statement
The data used in the study were selected from the SCOPUS database: https://0-www-scopus-com.brum.beds.ac.uk/ (accessed on 15 July 2020).
Conflicts of Interest
The authors declare no conflict of interest.
References
- Ellabban, O.; Alassi, A. Integrated Economic Adoption Model for residential grid-connected photovoltaic systems: An Australian case study. Energy Rep. 2019, 5, 310–326. [Google Scholar] [CrossRef]
- Liu, G.; Li, M.; Zhou, B.; Chen, Y.; Liao, S. General indicator for techno-economic assessment of renewable energy resources. Energy Convers. Manag. 2018, 156, 416–426. [Google Scholar] [CrossRef]
- Detert, N.; Kotani, K. Real options approach to renewable energy investments in Mongolia. Energy Policy 2013, 56, 136–150. [Google Scholar] [CrossRef] [Green Version]
- Firouzi, A.; Meshkani, A. Risk-based optimization of the debt service schedule in renewable energy project finance. Util. Policy 2021, 70, 101197. [Google Scholar] [CrossRef]
- Steffen, B. The importance of project finance for renewable energy projects. Energy Econ. 2018, 69, 280–294. [Google Scholar] [CrossRef] [Green Version]
- Schachter, J.A.; Mancarella, P. A critical review of Real Options thinking for valuing investment flexibility in Smart Grids and low carbon energy systems. Renew. Sustain. Energy Rev. 2016, 56, 261–271. [Google Scholar] [CrossRef]
- Jeon, C.; Shin, J. Long-term renewable energy technology valuation using system dynamics and Monte Carlo simulation: Photovoltaic technology case. Energy 2014, 66, 447–457. [Google Scholar] [CrossRef]
- Colla, M.; Ioannou, A.; Falcone, G. Critical review of competitiveness indicators for energy projects. Renew. Sustain. Energy Rev. 2020, 125, 109794. [Google Scholar] [CrossRef]
- Dranka, G.G.; Cunha, J.; de Lima, J.D.; Ferreira, P. Projects, Economic evaluation methodologies for renewable energy. AIMS Energy 2020, 8, 339–364. [Google Scholar] [CrossRef]
- Wang, Y.; Brown, M.A. Policy drivers for improving electricity end-use efficiency in the USA: An economic–engineering analysis. Energy Effic. 2014, 7, 517–546. [Google Scholar] [CrossRef]
- Brown, M.A.; Wang, Y. Green Savings: How Policies and Markets Drive Energy Efficiency; ABC-CLIO: Santa Barbara, CA, USA, 2015; ISBN 1440831211. [Google Scholar]
- Aui, A.; Wang, Y.; Mba-Wright, M. Evaluating the economic feasibility of cellulosic ethanol: A meta-analysis of techno-economic analysis studies. Renew. Sustain. Energy Rev. 2021, 145, 111098. [Google Scholar] [CrossRef]
- Ramadan, O.; Omer, S.; Ding, Y.; Jarimi, H.; Chen, X.; Riffat, S. Economic evaluation of installation of standalone wind farm and wind + CAES system for the new regulating tariffs for renewables in Egypt. Therm. Sci. Eng. Prog. 2018, 7, 311–325. [Google Scholar] [CrossRef]
- Delapedra-Silva, V.A.; Ferreira, P.; Cunha, J.; Kimura, H. Economic Evaluation of Wind Power Projects in a Mix of Free and Regulated Market Environments in Brazil. Energies 2021, 14, 3325. [Google Scholar] [CrossRef]
- Carneiro, P.; Ferreira, P. The economic, environmental and strategic value of biomass. Renew. Energy 2012, 44, 17–22. [Google Scholar] [CrossRef] [Green Version]
- Talavera, D.L.; Nofuentes, G.; Aguilera, J.; Fuentes, M. Tables for the estimation of the internal rate of return of photovoltaic grid-connected systems. Renew. Sustain. Energy Rev. 2007, 11, 447–466. [Google Scholar] [CrossRef]
- Marchioni, A.; Magni, C.A. Investment decisions and sensitivity analysis: NPV-consistency of rates of return. Eur. J. Oper. Res. 2018, 268, 361–372. [Google Scholar] [CrossRef] [Green Version]
- Shimbar, A.; Ebrahimi, S.B. Political risk and valuation of renewable energy investments in developing countries. Renew. Energy 2020, 145, 1325–1333. [Google Scholar] [CrossRef]
- Shimbar, A.; Ebrahimi, S.B. Modified-decoupled net present value: The intersection of valuation and time scaling of risk in energy sector. Environ. Energy Econ. Res. 2017, 1, 347–362. [Google Scholar]
- Espinoza, R.D. Separating project risk from the time value of money: A step toward integration of risk management and valuation of infrastructure investments. Int. J. Proj. Manag. 2014, 32, 1056–1072. [Google Scholar] [CrossRef]
- Žižlavský, O. Net present value approach: Method for economic assessment of innovation projects. Procedia-Social Behav. Sci. 2014, 156, 506–512. [Google Scholar] [CrossRef]
- McAllister, E.W. Pipeline Rules of Thumb Handbook: A Manual of Quick, Accurate Solutions to Everyday Pipeline Engineering Problems, 7th ed.; Gulf Professional Publishing: Houston, TX, USA, 2013. [Google Scholar]
- Arranz-Piera, P.; Kemausuor, F.; Darkwah, L.; Edjekumhene, I.; Cortés, J.; Velo, E. Mini-grid electricity service based on local agricultural residues: Feasibility study in rural Ghana. Energy 2018, 153, 443–454. [Google Scholar] [CrossRef]
- Mellichamp, D.A. Internal rate of return: Good and bad features, and a new way of interpreting the historic measure. Comput. Chem. Eng. 2017, 106, 396–406. [Google Scholar] [CrossRef]
- Cucchiella, F.; D’Adamo, I.; Gastaldi, M.; Miliacca, M. A profitability analysis of small-scale plants for biomethane injection into the gas grid. J. Clean. Prod. 2018, 184, 179–187. [Google Scholar] [CrossRef]
- Upadhyay, S.; Sharma, M.P. Selection of a suitable energy management strategy for a hybrid energy system in a remote rural area of India. Energy 2016, 94, 352–366. [Google Scholar] [CrossRef]
- Bahrami, A.; Teimourian, A.; Okoye, C.O.; Khosravi, N. Assessing the feasibility of wind energy as a power source in Turkmenistan; a major opportunity for Central Asia’s energy market. Energy 2019, 183, 415–427. [Google Scholar] [CrossRef]
- Elkadeem, M.R.; Wang, S.; Sharshir, S.W.; Atia, E.G. Feasibility analysis and techno-economic design of grid-isolated hybrid renewable energy system for electrification of agriculture and irrigation area: A case study in Dongola, Sudan. Energy Convers. Manag. 2019, 196, 1453–1478. [Google Scholar] [CrossRef]
- Aussel, D.; Neveu, P.; Tsuanyo, D.; Azoumah, Y. On the equivalence and comparison of economic criteria for energy projects: Application on PV/diesel hybrid system optimal design. Energy Convers. Manag. 2018, 163, 493–506. [Google Scholar] [CrossRef]
- Siddaiah, R.; Saini, R.P. A review on planning, configurations, modeling and optimization techniques of hybrid renewable energy systems for off grid applications. Renew. Sustain. Energy Rev. 2016, 58, 376–396. [Google Scholar] [CrossRef]
- Loewen, J. LCOE is an undiscounted metric that distorts comparative analyses of energy costs. Electr. J. 2019, 32, 40–42. [Google Scholar] [CrossRef]
- IRENA. Renewable Energy Capacity Statistics 2020. Available online: https://www.irena.org/-/media/Files/IRENA/Agency/Publication/2020/Mar/IRENA_RE_Capacity_Statistics_2020.pdf (accessed on 21 May 2021).
- IRENA. Renewable Capacity Statistics 2020. Available online: https://www.irena.org/publications/2020/Mar/Renewable-Capacity-Statistics-2020 (accessed on 10 August 2021).
- IEA. Market Analysis and Forecast from 2019 to 2024. Available online: https://www.iea.org/reports/renewables-2019 (accessed on 10 August 2021).
- Fraunhofer, I.S.E. Levelized Cost of Electricity Renewable Energy Technologies. Available online: https://www.ise.fraunhofer.de/content/dam/ise/en/documents/publications/studies/EN2018_Fraunhofer-ISE_LCOE_Renewable_Energy_Technologies.pdf (accessed on 8 June 2021).
- Do, T.X.; Lim, Y.; Yeo, H.; Lee, U.; Choi, Y.; Song, J. Techno-economic analysis of power plant via circulating fluidized-bed gasification from woodchips. Energy 2014, 70, 547–560. [Google Scholar] [CrossRef]
- Jana, K.; De, S. Techno-economic evaluation of a polygeneration using agricultural residue—A case study for an Indian district. Bioresour. Technol. 2015, 181, 163–173. [Google Scholar] [CrossRef]
- Weißbach, D.; Ruprecht, G.; Huke, A.; Czerski, K.; Gottlieb, S.; Hussein, A. Energy intensities, EROIs (energy returned on invested), and energy payback times of electricity generating power plants. Energy 2013, 52, 210–221. [Google Scholar] [CrossRef]
- Kozlova, M. Real option valuation in renewable energy literature: Research focus, trends and design. Renew. Sustain. Energy Rev. 2017, 80, 180–196. [Google Scholar] [CrossRef]
- Martín-Barrera, G.; Zamora-Ramírez, C.; González-González, J.M. Application of real options valuation for analysing the impact of public R&D financing on renewable energy projects: A company′s perspective. Renew. Sustain. Energy Rev. 2016, 63, 292–301. [Google Scholar] [CrossRef]
- Santos, L.; Soares, I.; Mendes, C.; Ferreira, P. Real Options versus Traditional Methods to assess Renewable Energy Projects. Renew. Energy 2014, 68, 588–594. [Google Scholar] [CrossRef]
- Fernandes, B.; Cunha, J.; Ferreira, P. The use of real options approach in energy sector investments. Renew. Sustain. Energy Rev. 2011, 15, 4491–4497. [Google Scholar] [CrossRef] [Green Version]
- Lambrecht, B.M. Real options in finance. J. Bank. Financ. 2017, 81, 166–171. [Google Scholar] [CrossRef]
- Siziba, S.; Hall, J.H. The evolution of the application of capital budgeting techniques in enterprises. Glob. Financ. J. 2019, 47, 100504. [Google Scholar] [CrossRef]
- Wu, Z.; Sun, H. Behavior of Chinese enterprises in evaluating wind power projects: A review based on survey. Renew. Sustain. Energy Rev. 2015, 43, 133–142. [Google Scholar] [CrossRef]
- IEA. Projected Costs of Generating Electricity. 2020. Available online: https://iea.blob.core.windows.net/assets/ae17da3d-e8a5-4163-a3ec-2e6fb0b5677d/Projected-Costs-of-Generating-Electricity-2020.pdf (accessed on 10 August 2021).
- Haddaway, N.R.; Macura, B. The role of reporting standards in producing robust literature reviews. Nat. Clim. Chang. 2018, 8, 444–447. [Google Scholar] [CrossRef]
- Zupic, I.; Čater, T. Bibliometric Methods in Management and Organization. Organ. Res. Methods 2015, 18, 429–472. [Google Scholar] [CrossRef]
- Cobo, M.J.; López-Herrera, A.G.; Herrera-Viedma, E.; Herrera, F. An approach for detecting, quantifying, and visualizing the evolution of a research field: A practical application to the Fuzzy Sets Theory field. J. Informetr. 2011, 5, 146–166. [Google Scholar] [CrossRef]
- Henrique, B.M.; Sobreiro, V.A.; Kimura, H. Contracting in Brazilian public administration: A machine learning approach. Expert Syst. 2020, 37, e12550. [Google Scholar] [CrossRef]
- Alonso, S.; Cabrerizo, F.J.; Herrera-Viedma, E.; Herrera, F. h-Index: A review focused in its variants, computation and standardization for different scientific fields. J. Informetr. 2009, 3, 273–289. [Google Scholar] [CrossRef] [Green Version]
- Schreiber, M. Revisiting the g-index: The average number of citations in the g-core. J. Am. Soc. Inf. Sci. Technol. 2010, 61, 169–174. [Google Scholar] [CrossRef]
- Egghe, L. Theory and practise of the g-index. Scientometrics 2006, 69, 131–152. [Google Scholar] [CrossRef]
- Alonso, S.; Cabrerizo, F.J.; Herrera-Viedma, E.; Herrera, F. hg-index: A new index to characterize the scientific output of researchers based on the h-and g-indices. Scientometrics 2010, 82, 391–400. [Google Scholar] [CrossRef] [Green Version]
- Potter, W.G. Lotka’s Law Revisited. Libr. Trends. 1981, 30, 21–40. [Google Scholar]
- Geng, S.; Wang, Y.; Zuo, J.; Zhou, Z.; Du, H.; Mao, G. Building life cycle assessment research: A review by bibliometric analysis. Renew. Sustain. Energy Rev. 2017, 76, 176–184. [Google Scholar] [CrossRef]
- Espinosa, N.; Hösel, M.; Angmo, D.; Krebs, F.C. Solar cells with one-day energy payback for the factories of the future. R. Soc. Chem. 2012, 5, 5117–5132. [Google Scholar] [CrossRef]
- Şengül, Ü.; Eren, M.; Eslamian Shiraz, S.; Gezder, V.; Şengül, A.B. Fuzzy TOPSIS method for ranking renewable energy supply systems in Turkey. Renew. Energy 2015, 75, 617–625. [Google Scholar] [CrossRef]
- Bradbury, K.; Pratson, L.; Patiño-Echeverri, D. Economic viability of energy storage systems based on price arbitrage potential in real-time U.S. electricity markets. Appl. Energy 2014, 114, 512–519. [Google Scholar] [CrossRef]
- Boomsma, T.K.; Meade, N.; Fleten, S.-E. Renewable energy investments under different support schemes: A real options approach. Eur. J. Oper. Res. 2012, 220, 225–237. [Google Scholar] [CrossRef]
- Schelly, C. Residential solar electricity adoption: What motivates, and what matters? A case study of early adopters. Energy Res. Soc. Sci. 2014, 2, 183–191. [Google Scholar] [CrossRef]
- Jouny, M.; Luc, W.; Jiao, F. General Techno-Economic Analysis of CO2 Electrolysis Systems. Ind. Eng. Chem. Res. 2018, 57, 2165–2177. [Google Scholar] [CrossRef]
- Beal, C.M.; Gerber, L.N.; Sills, D.L.; Huntley, M.E.; Machesky, S.C.; Walsh, M.J.; Tester, J.W.; Archibald, I.; Granados, J.; Greene, C.H. Algal biofuel production for fuels and feed in a 100-ha facility: A comprehensive techno-economic analysis and life cycle assessment. Algal Res. 2015, 10, 266–279. [Google Scholar] [CrossRef] [Green Version]
- Dincer, I.; Zamfirescu, C. Renewable-energy-based multigeneration systems. Int. J. Energy Res. 2012, 36, 1403–1415. [Google Scholar] [CrossRef]
- Blum, P.; Campillo, G.; Kölbel, T. Techno-economic and spatial analysis of vertical ground source heat pump systems in Germany. Energy 2011, 36, 3002–3011. [Google Scholar] [CrossRef]
- Ju, L.; Tan, Z.; Li, H.; Tan, Q.; Yu, X.; Song, X. Multi-objective operation optimization and evaluation model for CCHP and renewable energy based hybrid energy system driven by distributed energy resources in China. Energy 2016, 111, 322–340. [Google Scholar] [CrossRef] [Green Version]
- Ueckerdt, F.; Hirth, L.; Luderer, G.; Edenhofer, O. System LCOE: What are the costs of variable renewables? Energy 2013, 63, 61–75. [Google Scholar] [CrossRef]
- Darling, S.B.; You, F.; Veselka, T.; Velosa, A. Assumptions and the levelized cost of energy for photovoltaics. Energy Environ. Sci. 2011, 4, 3133–3139. [Google Scholar] [CrossRef]
- Zamalloa, C.; Vulsteke, E.; Albrecht, J.; Verstraete, W. The techno-economic potential of renewable energy through the anaerobic digestion of microalgae. Bioresour. Technol. 2011, 102, 1149–1158. [Google Scholar] [CrossRef]
- Li, C.; Ge, X.; Zheng, Y.; Xu, C.; Ren, Y.; Song, C.; Yang, C. Techno-economic feasibility study of autonomous hybrid wind/PV/battery power system for a household in Urumqi, China. Energy 2013, 55, 263–272. [Google Scholar] [CrossRef]
- Dalla Rosa, A.; Christensen, J.E. Low-energy district heating in energy-efficient building areas. Energy 2011, 36, 6890–6899. [Google Scholar] [CrossRef] [Green Version]
- Ouyang, X.; Lin, B. Levelized cost of electricity (LCOE) of renewable energies and required subsidies in China. Energy Policy 2014, 70, 64–73. [Google Scholar] [CrossRef]
- Adaramola, M.S.; Paul, S.S.; Oyewola, O.M. Assessment of decentralized hybrid PV solar-diesel power system for applications in Northern part of Nigeria. Energy Sustain. Dev. 2014, 19, 72–82. [Google Scholar] [CrossRef]
- Halabi, L.M.; Mekhilef, S.; Olatomiwa, L.; Hazelton, J. Performance analysis of hybrid PV/diesel/battery system using HOMER: A case study Sabah, Malaysia. Energy Convers. Manag. 2017, 144, 322–339. [Google Scholar] [CrossRef]
- Maheri, A. Multi-objective design optimisation of standalone hybrid wind-PV-diesel systems under uncertainties. Renew. Energy 2014, 66, 650–661. [Google Scholar] [CrossRef] [Green Version]
- Malheiro, A.; Castro, P.M.; Lima, R.M.; Estanqueiro, A. Integrated sizing and scheduling of wind/PV/diesel/battery isolated systems. Renew. Energy 2015, 83, 646–657. [Google Scholar] [CrossRef] [Green Version]
- Jenner, S.; Groba, F.; Indvik, J. Assessing the strength and effectiveness of renewable electricity feed-in tariffs in European Union countries. Energy Policy 2013, 52, 385–401. [Google Scholar] [CrossRef] [Green Version]
- Cherrington, R.; Goodship, V.; Longfield, A.; Kirwan, K. The feed-in tariff in the UK: A case study focus on domestic photovoltaic systems. Renew. Energy 2013, 50, 421–426. [Google Scholar] [CrossRef]
- Muhammad-Sukki, F.; Ramirez-Iniguez, R.; Abu-Bakar, S.H.; McMeekin, S.G.; Stewart, B.G. An evaluation of the installation of solar photovoltaic in residential houses in Malaysia: Past, present, and future. Energy Policy 2011, 39, 7975–7987. [Google Scholar] [CrossRef]
- Kim, H.; Cha, K.; Fthenakis, V.M.; Sinha, P.; Hur, T. Life cycle assessment of cadmium telluride photovoltaic (CdTe PV) systems. Sol. Energy 2014, 103, 78–88. [Google Scholar] [CrossRef]
- Muhammad-Sukki, F.; Abu-Bakar, S.H.; Munir, A.B.; Mohd Yasin, S.H.; Ramirez-Iniguez, R.; McMeekin, S.G.; Stewart, B.G.; Sarmah, N.; Mallick, T.K.; Abdul Rahim, R.; et al. Feed-in tariff for solar photovoltaic: The rise of Japan. Renew. Energy 2014, 68, 636–643. [Google Scholar] [CrossRef]
- Jacobs, D.; Marzolf, N.; Paredes, J.R.; Rickerson, W.; Flynn, H.; Becker-Birck, C.; Solano-Peralta, M. Analysis of renewable energy incentives in the Latin America and Caribbean region: The feed-in tariff case. Energy Policy 2013, 60, 601–610. [Google Scholar] [CrossRef]
- Niemelä, T.; Kosonen, R.; Jokisalo, J. Cost-effectiveness of energy performance renovation measures in Finnish brick apartment buildings. Energy Build. 2017, 137, 60–75. [Google Scholar] [CrossRef] [Green Version]
- Hou, P.; Enevoldsen, P.; Eichman, J.; Hu, W.; Jacobson, M.Z.; Chen, Z. Optimizing investments in coupled offshore wind -electrolytic hydrogen storage systems in Denmark. J. Power Sources 2017, 359, 186–197. [Google Scholar] [CrossRef]
- Tokunaga, K.; Tamaru, C.; Ako, H.; Leung, P. Economics of Small-scale Commercial Aquaponics in Hawai‘i. J. World Aquac. Soc. 2015, 46, 20–32. [Google Scholar] [CrossRef]
- Fuss, S.; Szolgayová, J.; Khabarov, N.; Obersteiner, M. Renewables and climate change mitigation: Irreversible energy investment under uncertainty and portfolio effects. Energy Policy 2012, 40, 59–68. [Google Scholar] [CrossRef]
- Reuter, W.H.; Szolgayová, J.; Fuss, S.; Obersteiner, M. Renewable energy investment: Policy and market impacts. Appl. Energy 2012, 97, 249–254. [Google Scholar] [CrossRef]
- Zhang, M.M.; Zhou, P.; Zhou, D.Q. A real options model for renewable energy investment with application to solar photovoltaic power generation in China. Energy Econ. 2016, 59, 213–226. [Google Scholar] [CrossRef]
- Wesseh, P.K., Jr.; Lin, B. A real options valuation of Chinese wind energy technologies for power generation: Do benefits from the feed-in tariffs outweigh costs? J. Clean. Prod. 2016, 112, 1591–1599. [Google Scholar] [CrossRef]
- Ritzenhofen, I.; Spinler, S. Optimal design of feed-in-tariffs to stimulate renewable energy investments under regulatory uncertainty—A real options analysis. Energy Econ. 2016, 53, 76–89. [Google Scholar] [CrossRef]
- Monjas-Barroso, M.; Balibrea-Iniesta, J. Valuation of projects for power generation with renewable energy: A comparative study based on real regulatory options. Energy Policy 2013, 55, 335–352. [Google Scholar] [CrossRef]
- Jeon, C.; Lee, J.; Shin, J. Optimal subsidy estimation method using system dynamics and the real option model: Photovoltaic technology case. Appl. Energy 2015, 142, 33–43. [Google Scholar] [CrossRef]
- Zhang, M.M.; Zhou, D.Q.; Zhou, P.; Liu, G.Q. Optimal feed-in tariff for solar photovoltaic power generation in China: A real options analysis. Energy Policy 2016, 97, 181–192. [Google Scholar] [CrossRef]
- Pawlak, M.; Rapacewicz, A.; Zarzecki, D. Investment Appraisal Practice in the Biggest Companies in Poland. Eur. Res. Stud. 2020, 23, 137–147. [Google Scholar] [CrossRef]
- Lefley, F. Dispelling the Myth Around the Financial Appraisal of Capital Projects. IEEE Eng. Manag. Rev. 2018, 46, 47–51. [Google Scholar] [CrossRef]
- Sen, R.; Bhattacharyya, S.C. Off-grid electricity generation with renewable energy technologies in India: An application of HOMER. Renew. Energy 2014, 62, 388–398. [Google Scholar] [CrossRef]
- Eriksson, E.L.V.; Gray, E.M. Optimization and integration of hybrid renewable energy hydrogen fuel cell energy systems—A critical review. Appl. Energy 2017, 202, 348–364. [Google Scholar] [CrossRef]
- IRENA. Renewable Energy Statistics 2020. Available online: https://www.irena.org/publications/2020/Jul/Renewable-energy-statistics-2020 (accessed on 10 August 2021).
- BP. Statistical Review of World Energy. 2019. Available online: https://www.bp.com/content/dam/bp/business-sites/en/global/corporate/pdfs/energy-economics/statistical-review/bp-stats-review-2019-full-report.pdf (accessed on 10 August 2021).
- Come Zebra, E.I.; van der Windt, H.J.; Nhumaio, G.; Faaij, A.P.C. A review of hybrid renewable energy systems in mini-grids for off-grid electrification in developing countries. Renew. Sustain. Energy Rev. 2021, 144, 111036. [Google Scholar] [CrossRef]
- Li, Y.; Wu, M.; Li, Z. A real options analysis for renewable energy investment decisions under China carbon trading market. Energies 2018, 11, 1817. [Google Scholar] [CrossRef] [Green Version]
- Anders, H.; Qian Wenyun, Z.K.; Philipp Geres, L.Y. China Energy Transition Status Report 2021. Beijing, 2021. Available online: https://www.energypartnership.cn/fileadmin/user_upload/china/media_elements/publications/2021/China_Energy_Transition_Status_Report_2021.pdf (accessed on 10 August 2021).
- IEA. An Energy Sector Roadmap to Carbon Neutrality in China. 2021. Available online: https://iea.blob.core.windows.net/assets/6689062e-43fc-40c8-9659-01cf96150318/AnenergysectorroadmaptocarbonneutralityinChina.pdf (accessed on 10 August 2021).
- Nature INDEX. Superpowered science: Charting China’s research rise. Nature 2021, 593, S4–S5. Available online: https://0-www-nature-com.brum.beds.ac.uk/articles/d41586-021-01403-2 (accessed on 10 August 2021).
- Remer, D.S.; Nieto, A.P. A compendium and comparison of 25 project evaluation techniques. Part 1: Net present value and rate of return methods. Int. J. Prod. Econ. 1995, 42, 79–96. [Google Scholar] [CrossRef]
- Remer, D.S.; Nieto, A.P. A compendium and comparison of 25 project evaluation techniques. Part 2: Ratio, payback, and accounting methods. Int. J. Prod. Econ. 1995, 42, 101–129. [Google Scholar] [CrossRef]
- Biezma, M.V.; San Cristobal, J.R. Investment criteria for the selection of cogeneration plants—A state of the art review. Appl. Therm. Eng. 2006, 26, 583–588. [Google Scholar] [CrossRef]
- Crundwell, F. Finance for Engineers: Evaluation and Funding of Capital Projects; Springer Science and Business Media: Berlin/Heidelberg, Germany, 2008; ISBN 1848000332. [Google Scholar]
- Loewen, J. LCOE is an undiscounted metric that inaccurately disfavors renewable energy resources. Electr. J. 2020, 33, 106769. [Google Scholar] [CrossRef]
Figure 1.
Operational procedures.

Figure 2.
Intersections of articles in different groups.

Figure 3.
Annual Scientific Production.

Figure 4.
Occurrence of “wind” and “solar” references in most frequent words (TPEM).

Figure 5.
Country Scientific Production.

Figure 6.
Annual Scientific Production (LCOE).

Figure 7.
Occurrence of “wind” and “solar” references in most frequent words (LCOE).

Figure 8.
Country Scientific Production (LCOE).

Figure 9.
Annual Scientific Production (ROI).

Figure 10.
Occurrence of “wind” and “solar” references in most frequent words (ROI).

Figure 11.
Country Scientific Production (ROI).

Figure 12.
Annual Scientific Production (ROA).

Figure 13.
Country Scientific Production (ROA).


Table 1.
Project Valuation Techniques.
| Categories | Technique | Equation | Nomenclature | Key Concepts |
|---|---|---|---|---|
| Traditional Project Evaluation Methods (TPEM) | Net Present Value (NPV) | CF = Cash Flow in the year i; N = Project lifetime, in years; k = Annual discount rate. | Based on the discounted cash flow approach. Depends on a predefined discount rate. Measures value creation in monetary terms. Deterministic reject/accept decision (accept if NPV > 0). | |
| Internal Rate of Return (IRR) | = Cash Flow in the year i; k = Annual discount rate; N = Project lifetime, in years. | Based on the discounted cash flow approach. Expressed by the interest rate for which the project’s NPV is zero. Measures value creation as a rate of return (%). Deterministic reject/accept decision (accept if IRR > pre-defined hurdle rate). | ||
| Discounted Payback Period (PBP) | I = Initial investment; = Cash Flow in the year i; k = Annual discount rate; Np = Number of years until the investment is recovered. | Based on the discounted cash flow approach. Expressed by the time (usually years) required to recover the investment. It can be used as a simplified proxy for risk. Deterministic reject/accept decision (accept if PBP < pre-defined value). | ||
| Levelized Cost of Electricity (LCOE) [46] | Levelized Cost of Electricity (LCOE) | N = Project lifetime, in years; k = Annual discount rate; MWh = Amount of electricity produced annually in MWh; Capitali = Total capital construction costs in the year i; O&Mi = Operation and maintenance costs in the year i; Fueli = Fuel costs in year i; Carboni = Carbon costs in the year i; Di = Decommissioning and waste management costs in the year i | Identifies the unit cost of energy over the life of the project. Computed by dividing all costs generated by the energy system by the amount of energy produced by that system. Frequently used to compare technologies /projects. | |
| Return on Investment (ROI) | Return on Investment (ROI) | Computed as percentage ratio between the annual net profit (net cash flow) over the life of the project and the total capital investment in the project. | ||
| Real Options Analysis (ROA) | Real Options Analysis (ROA) | NPV_expanded = NPV_Deterministic + NPV_Flexibility | Tradicional NPV Uncertain cash flow value to be added, due to the existence of a real option embedded in the project. | Express the options that are embedded in investment opportunities. Incorporates uncertainty/risk in the analysis. Options may include suspending, postponing, abandoning, reducing, or expanding the investment. |
Table 2.
Group of Keywords.
| Categories | Keywords |
|---|---|
| TPEM | “Net Present Value” OR “Internal Rate of Return” OR “Payback” OR “NPV” OR “IRR” OR “PBP” |
| LCOE | “Levelized Cost of Energy” OR “Levelised Cost of Energy” OR “levelized Cost of Electricity” OR “Levelised Cost of Electricity” |
| ROI | “Return on Investment” OR “ROI” AND NOT “EROI” AND NOT “Energy Return on Investment” |
| ROA | “Real Option” |
Table 3.
Authors Impact (TPEM).
| Author | h_Index | g_Index | NC | Year * |
|---|---|---|---|---|
| Cucchiella F. | 9 | 11 | 305 | 2014 |
| Gastaldi M. | 6 | 8 | 123 | 2015 |
| Zhang X. | 5 | 8 | 103 | 2012 |
| Gheewala H. | 5 | 5 | 77 | 2013 |
| Manan A. | 5 | 5 | 53 | 2012 |
| Li J. | 4 | 6 | 54 | 2013 |
| Li X. | 4 | 6 | 38 | 2014 |
| Fleten S. | 4 | 5 | 218 | 2012 |
| Kleme J. | 4 | 4 | 44 | 2015 |
| LI H. | 4 | 4 | 115 | 2016 |
NC = Number of Citations, values from July (2020). * = Year of the first publication on the topic.
Table 4.
Most Cited Papers (TPEM).
| Author | Year | Citations |
|---|---|---|
| Espinosa et al. [57] | 2012 | 345 |
| Şengül et al. [58] | 2015 | 182 |
| Bradbury et al. [59] | 2014 | 168 |
| Boomsma et al. [60] | 2012 | 157 |
| Schelly [61] | 2014 | 122 |
| Jouny et al. [62] | 2018 | 110 |
| Beal et al. [63] | 2015 | 114 |
| Dincer and Zamfirescu [64] | 2012 | 104 |
| Blum et al. [65] | 2011 | 98 |
| Ju et al. [66] | 2016 | 92 |
Table 5.
Papers by Source (TPEM).
| Sources | Articles |
|---|---|
| Renewable Energy | 75 |
| Energy | 67 |
| Applied Energy | 52 |
| Energies | 45 |
| Energy Policy | 42 |
| Journal of Cleaner Production | 40 |
| Energy Conversion and Management | 36 |
| International Journal of Renewable Energy Research | 22 |
| Solar Energy | 19 |
| Energy and Buildings | 18 |
Table 6.
Authors Impact (LCOE).
| Author | h_Index | g_Index | NC | Year * |
|---|---|---|---|---|
| Breyer C. | 15 | 23 | 537 | 2015 |
| Bogdanov D. | 14 | 20 | 500 | 2015 |
| Aghahosseini A. | 7 | 13 | 218 | 2017 |
| Gulagi A. | 5 | 6 | 191 | 2017 |
| Adaramola MS. | 4 | 4 | 233 | 2014 |
| Goel S. | 4 | 4 | 33 | 2016 |
| Ghenai C. | 3 | 4 | 60 | 2018 |
| Zhang X. | 3 | 4 | 57 | 2015 |
| Caldera U. | 3 | 4 | 56 | 2017 |
| Taylan O. | 3 | 4 | 39 | 2017 |
NC = Number of Citations, values from July (2020). * = Year of the first publication on the topic.
Table 7.
Most Cited Papers (LCOE).
| Author | Year | Citations |
|---|---|---|
| Ueckerdt et al. [67] | 2013 | 209 |
| Darling et al. [68] | 2011 | 188 |
| Zamalloa et al. [69] | 2011 | 182 |
| Li et al. [70] | 2013 | 138 |
| Dalla Rosa and Christensen [71] | 2011 | 127 |
| Ouyang and Lin [72] | 2014 | 124 |
| Adaramola et al. [73] | 2014 | 102 |
| Halabi et al. [74] | 2017 | 95 |
| Maheri [75] | 2014 | 88 |
| Malheiro et al. [76] | 2015 | 86 |
Table 8.
Papers by Source (LCOE).
| Sources | Articles |
|---|---|
| Energy | 51 |
| Renewable Energy | 50 |
| Applied Energy | 38 |
| Energy Conversion and Management | 32 |
| Energies | 29 |
| Energy Policy | 21 |
| International Journal of Renewable Energy Research | 14 |
| Renewable and Sustainable Energy Reviews | 13 |
| Solar Energy | 11 |
| International Journal of Hydrogen Energy | 10 |
| Journal of Cleaner Production | 10 |
| Sustainability (Switzerland) | 10 |
| Energy Strategy Reviews | 8 |
| Environmental Progress and Sustainable Energy | 6 |
| Applied Thermal engineering | 5 |
Table 9.
Authors Impact (ROI).
| Author | h_Index | g_Index | NC | Year * |
|---|---|---|---|---|
| Do, T. X. | 3 | 3 | 56 | 2014 |
| Lim, Y. I. | 3 | 3 | 56 | 2014 |
| AL Shariff S | 2 | 2 | 15 | 2013 |
| McMeekin S. G. | 2 | 2 | 115 | 2011 |
| Stewart B. G. | 2 | 2 | 115 | 2011 |
| Li Y. | 2 | 2 | 58 | 2017 |
| Jokisalo J. | 2 | 2 | 57 | 2017 |
| Kosonen R. | 2 | 2 | 57 | 2017 |
| Niemelä T. | 2 | 2 | 57 | 2017 |
| Yeo H. | 2 | 2 | 40 | 2014 |
NC = Number of Citations, values from July (2020). * = Year of the first publication on the topic.
Table 10.
Most Cited Papers (ROI).
| Author | Year | Citations |
|---|---|---|
| Jenner et al. [77] | 2013 | 156 |
| Schelly [61] | 2014 | 128 |
| Cherrington et al. [78] | 2013 | 83 |
| Muhammad-Sukki et al. [79] | 2011 | 66 |
| Kim et al. [80] | 2014 | 49 |
| Muhammad-Sukki et al. [81] | 2014 | 49 |
| Jacobs et al. [82] | 2013 | 42 |
| Niemelä et al. [83] | 2017 | 37 |
| Hou et al. [84] | 2017 | 36 |
| Tokunaga et al. [85] | 2015 | 36 |
Table 11.
Papers by Source (ROI).
| Sources | Articles |
|---|---|
| Energy Policy | 11 |
| Energies | 10 |
| Renewable and Sustainable Energy Reviews | 10 |
| Renewable Energy | 10 |
| Energy Conversion and Management | 7 |
| Journal of Cleaner Production | 6 |
| Energy | 5 |
| Sustainable Cities and Society | 5 |
| Applied Energy | 4 |
| Solar Energy | 4 |
Table 12.
Authors Impact (ROA).
| Author | h_Index | g_Index | NC | * Year |
|---|---|---|---|---|
| Fleten S. E. | 4 | 5 | 218 | 2012 |
| Hagspiel V. | 3 | 4 | 19 | 2018 |
| Madlener R. | 3 | 5 | 25 | 2014 |
| Boomsma T. K. | 3 | 3 | 205 | 2012 |
| Zhang M. M. | 3 | 3 | 107 | 2016 |
| Linnerud K. | 3 | 3 | 85 | 2014 |
| Di Corato L. | 3 | 3 | 35 | 2011 |
| Ferreira P. | 2 | 3 | 64 | 2014 |
| Fuss S. | 2 | 2 | 135 | 2012 |
| Bartolini F. | 2 | 2 | 40 | 2012 |
NC = Number of Citations, values from July (2020). * = Year of the first publication on the topic.
Table 13.
Most Cited Papers (ROA).
| Author | Year | Citations |
|---|---|---|
| Boomsma et al. [60] | 2012 | 157 |
| Fuss et al. [86] | 2012 | 68 |
| Reuter et al. [87] | 2012 | 67 |
| Zhang et al. [88] | 2016 | 54 |
| Wesseh and Lin [89] | 2016 | 53 |
| Ritzenhofen and Spinler [90] | 2016 | 53 |
| Santos et al. [41] | 2014 | 49 |
| Monjas-Barroso and Balibrea-Iniesta [91] | 2013 | 48 |
| Jeon et al. [92] | 2015 | 45 |
| Zhang et al. (b) [93] | 2016 | 43 |
Table 14.
Papers by Source (ROA).
| Sources | Articles |
|---|---|
| Energy Policy | 11 |
| Applied Energy | 10 |
| Energy Economics | 10 |
| Energies | 8 |
| Energy | 8 |
| Renewable Energy | 5 |
| European Journal of Operational Research | 3 |
| Journal of Cleaner Production | 3 |
| International Journal of Greenhouse Gas Control | 2 |
| Journal of Construction Engineering and Management | 2 |
Table 15.
Most Cited Countries (ROA).
| Country | Total Citations |
|---|---|
| UK | 296 |
| China | 168 |
| Austria | 143 |
| Germany | 140 |
| Korea | 130 |
| Spain | 101 |
| USA | 80 |
| Portugal | 49 |
| Brazil | 40 |
| Italy | 40 |
Publisher’s Note: MDPI stays neutral with regard to jurisdictional claims in published maps and institutional affiliations. |
© 2022 by the authors. Licensee MDPI, Basel, Switzerland. This article is an open access article distributed under the terms and conditions of the Creative Commons Attribution (CC BY) license (https://creativecommons.org/licenses/by/4.0/).
Share and Cite
MDPI and ACS Style
Delapedra-Silva, V.; Ferreira, P.; Cunha, J.; Kimura, H. Methods for Financial Assessment of Renewable Energy Projects: A Review. Processes 2022, 10, 184. https://0-doi-org.brum.beds.ac.uk/10.3390/pr10020184
AMA Style
Delapedra-Silva V, Ferreira P, Cunha J, Kimura H. Methods for Financial Assessment of Renewable Energy Projects: A Review. Processes. 2022; 10(2):184. https://0-doi-org.brum.beds.ac.uk/10.3390/pr10020184
Chicago/Turabian StyleDelapedra-Silva, Vanderson, Paula Ferreira, Jorge Cunha, and Herbert Kimura. 2022. "Methods for Financial Assessment of Renewable Energy Projects: A Review" Processes 10, no. 2: 184. https://0-doi-org.brum.beds.ac.uk/10.3390/pr10020184
Note that from the first issue of 2016, this journal uses article numbers instead of page numbers. See further details here.