Article

Effect of Fouling Layer (Acid–Ash Reaction) on Low-Temperature Corrosion Covering Heating Surface in Coal-Fired Flue Gas

1
School of Energy and Power Engineering, Qilu University of Technology (Shandong Academy of Sciences), Jinan 250353, China
2
Energy Research Institute, Qilu University of Technology (Shandong Academy of Sciences), Jinan 250013, China
*
Authors to whom correspondence should be addressed.
Submission received: 29 December 2021 / Revised: 24 January 2022 / Accepted: 24 January 2022 / Published: 26 January 2022

Abstract

:
Improving the efficiency of coal-fired boiler is beneficial for greenhouse gas control, mainly for carbon dioxide (CO2). The low-temperature corrosion covering heating surfaces is a frequent threat for coal-fired thermal equipment. The corrosion is induced by a fouling layer, where the ash deposition and condensed acid in coal-fired flue gas react mutually. The corrosion experiments were designed to investigate the reactions of representative acid solution between basic oxides, non-basic oxides, and fly ash particles covering metal surfaces. Scanning electron microscope (SEM) equipped with energy-dispersive X-ray spectroscopy (EDS), X-ray fluorescence (XRF) and X-ray diffraction (XRD) were used to analyze the reaction particles and metal samples collected from experiments. The corrosion rates of 316L steel, 20# steel, Corten steel and ND (09CrCuSb) steel by the sulfuric solution of different concentrations with and without particles were obtained. The results showed that corrosion rate could be reduced by reacted particles, followed as: basic oxides particles > fly ash particles > non-basic oxides particles. Meanwhile, the deposited ash particles with smaller sizes contribute to a deeper acid–ash reactions due to more alkaline oxides accumulated. Thus, the metal surfaces will be covered by denser attachments, playing a function of corrosion resistance. The effect of fouling layer on low-temperature corrosion was obtained, guiding a safe and efficient operation of heat equipment in coal-fired flue gas.

1. Introduction

To address the urgent global warming accelerated by excessive carbon dioxide (CO2) emissions, mainly from fossil fuels, it is imperative to reshape the energy supply system by increasing the share of renewable energy, such as wind and solar energy [1]. Due to the intermittent nature of the aforementioned renewable energy, some stable backups such as coal-fired plants are necessary to provide a constant power output for consumers. As a mature technology to utilize before solving the intermittent of renewable energy, fossil fuels still play an irreplaceable role. To improve the efficiency of coal-fired boilers, a series of reconstructions such as the ultra-low emissions, energy-saving as well as flexibility modification has been carried out. Consequently, a significant temperature drop in flue gas is inevitable. The flue gas with a lower temperature further leads to many operational problems, including bed agglomeration, deposit formation, corrosion and fly ash during the combustion of coal [2].
Among these problems, corrosion is the most crucial risk along with the flue gas of boilers for thermal equipment, such as pre-heaters, emission control equipment and flue gas duct parts. There are mainly two types of corrosion, i.e., high-temperature corrosion and low-temperature corrosion. For high-temperature corrosion in pre-heaters, corrosive deposits are mainly composed of inorganic elements including Na, K, S, and Cl, especially the low melting-point salts from flue gases or fly ash [3,4,5]. Researchers proposed several different protective coatings applied on the surfaces of boiler tubes to minimize the failures caused by high-temperature corrosion [6,7,8]. Screening laboratory tests were conducted to study the anti-corrosion behaviors of different protective coatings based on the corrosive deposition-forming mechanism and the fly ash composition [9,10,11]. In terms of low-temperature corrosion, it usually occurs in the emission control equipment and flue gas duct parts, lowering the heat transfer efficiency and increasing the operational risk of the thermal equipment [12,13]. Certain researchers have focused on the corrosive products covering the low-temperature heating surfaces. Wang et al. [14] experimentally investigated the coupling effects between dew point corrosion and ash deposition happening at the rear of the boiler between the electrostatic precipitator and the desulfurization tower. Nevertheless, only the coupling mechanism of the fouling layers on surfaces with lower temperatures, i.e., 30, 40, and 50 °C, were discussed. Chen et al. [15,16,17] observed the corrosion and ash deposition process on low-temperature heating surfaces before and after the precipitator of boilers via field experiments. The results indicated that more severe viscous ash deposition and low-temperature corrosion occurred after the precipitator rather than before the precipitator. In addition, the coupling effects between the ash deposition and acid condensation played an important role in low-temperature corrosion and viscous ash deposition. Pan et al. [18,19,20] carried out in-plant corrosion tests to evaluate the desulfurized flue gas corrosion coupled with deposits after the flue gas desulfurization (FGD) unit. The results revealed that the entrainment of corrosive droplets by the wet flue gas was the major contribution to corrosion, and the rate of corrosion was positively correlated with the deposition rate. Previous research has indicated that low-temperature corrosion occurred at the same time as the formation of viscous fouling layers. The formation of the fouling layer, which covers the heating surface, has significant impacts on the corrosion. Therefore, it is crucial to explore the forming mechanism of ash deposition with consideration of acid condensation. Several field tests were proposed by Wei et al. [21,22,23], figuring out the properties of a typical fouling layer (dry-loose ash deposits, adhering ash deposits, and viscous ash deposits). The fouling properties depended on the coupling effects of ash deposition and acid condensation. Specifically, the fly ash particles could react with the condensed acid solution via the alkali oxide and porous structure of fly ash to a certain extent. With the drop in heating temperature, the heat transfer efficiency was mainly determined by the turning point of the fouling layer from dry ash deposition to acid–ash coupling deposition. Consequently, the potential reaction between ash particles and the condensed acid solution (acid–ash reaction mechanism) related to the surface temperature of the tube has to be considered when the fouling layer and low-temperature corrosion of heat exchangers are studied.
In light of the literature review, the characteristics of low-temperature corrosion and the viscous fouling layer were mainly studied by both field experiments and sampling analysis. The corrosion of different metal materials under a corrosive environment of a coal-fired boiler was unpredictable via lab simulations. The effects of the fouling layer on corrosion were ignored, which was not in line with the practical engineering application. Hence, laboratory experiments were carried out in this paper to qualitatively analyze the acid–ash reaction mechanism of the fouling layer where low-temperature corrosion happened in the field experiments. The effects of the acid–ash reaction on metal corrosion were conducted by considering the fouling layer as a whole in order to simplify the ash deposition and acid condensation processes. The metal corrosion results will be helpful for providing useful guidance for the safe and efficient operation of heat transfer equipment for CO2 emission reduction of coal-fired power plants.

2. Experimental Set Ups

2.1. Design Consideration

The fouling layer and low-temperature corrosion are the interacting results of both acid condensation and ash deposition. It is difficult to simulate the complex formation process under laboratory conditions, as the process is sensitive to the distribution of thermal fluid around heating surfaces, as well as the complexity and instantaneity of flue gas compositions. In [24,25,26], the formation of a dry ash layer was proven to be related to the deposition and exfoliation of fly ash particles. The characteristics of the fouling layer were mainly related to the size distribution of fly ash particles, characteristic parameters of heating surfaces and flow distribution of flue gas. In addition, ash particles with finer sizes tended to deposit on the heating surface more easily than those with larger sizes [27]. The amount of ash particles deposited on the heating surface was found to be constant for the dry ash deposition layer [28]. Thus, the mass of different particles ready for experimental reaction were assumed to be equivalent under the testing conditions. Our previous work proved that acid condensation was decided by the wall temperature, acid vapor and water vapor content in the flue gas, among which the wall temperature was the most crucial factor [29]. Although the temperature change of the flue gas affected the wall temperature of the heat exchanger, it merely impacted the acid condensation at a certain wall temperature [28,30]. Hence, in this study, only the difference in H2SO4 concentration caused by fixed temperatures was considered, while the mass of the H2SO4 solution was assumed to be unchanged throughout the experiments.

2.2. Experimental Methodologies

Previous conclusions have indicated that the H2SO4 condensation in coal-fired boilers is a crucial factor, which induced the viscous fouling layer and low-temperature corrosion of thermal equipment. In practice, the general volume factions of sulfuric acid vapor and water vapor in the flue gas of coal-fired boilers are 5~50 ppm and 6~15%, respectively [31]. To better explain the average acid condensation characteristics, the acid solution concentrations in experiments under different reaction temperatures were theoretically obtained on the premise of 20 ppm sulfuric acid vapor content and 10% water vapor content [29]. The sulfuric acid concentrations were 80.83%, 70.93%, 60.30%, 56.00% and 44.81%, with corresponding reaction temperatures at 140, 105, 80, 73 and 60 °C, respectively.
The field tests proved that low-temperature corrosion and the viscous fouling layer occurred simultaneously, caused by the reaction of ash particles and condensed acid solution [16,18,21,22,32,33]. As a typical fouling layer with obvious corrosion usually tended to be wet and viscous, the ash particles were assumed to fully react with the condensed acid solution. However, the fouling layer in practice was not always the case to be wet, and it sometimes changed with the operational conditions of boilers [21,22,23]. Therefore, two different scenarios, i.e., “solid-to-liquid ratio < 1” and “solid-to-liquid ratio > 1”, were considered in this study, which separately represented the dry and wet viscous fouling layer. Moreover, in order to explore the influence of chemical compositions of ash particles on the metal corrosion, three different kinds of particles were selected. First, the fly ash samples from the flue gas before air pre-heated were captured before the reaction with acid condensation happened. Second, SiO2 particles were employed, representing the non-basic oxides with the highest content in ash particles. Third, CaO/MgO particles were representative of basic oxides.
ND (09CrCuSb) steel, Corten steel, 316L steel and 20# steel are widely used materials in the thermal equipment of boilers (Figure 1). To study the corrosion nature of these metal samples under simulated reaction conditions, the metal samples were scrubbed with alcohol, cleaned with anhydrous ethanol and ultrasonic wave, and weighed after drying. Since the heat transfer between flue gas and heating surface was ignored, the process of acid condensation could be simplified. The experiments of low-temperature corrosion were conducted under the reaction temperatures at 140, 105, 80, 73 and 60 °C, with the corresponding H2SO4 solution at 80%, 70%, 60%, 56% and 45%, respectively. The test system was enclosed within a thermostat in the reaction vessel, where the reactions proceeded under three different conditions, i.e., “pure acid solution”, “solid-to-liquid ratio < 1” (SiO2 particles, MgO/CaO particles, fly ash particles) and “solid-to-liquid ratio > 1” (SiO2 particles, MgO/CaO particles, fly ash particles). After the reaction process lasted 8~24 h, the metal surface would be covered by the reaction products of either H2SO4 solution and SiO2, H2SO4 solution and fly ash, or H2SO4 solution and MgO/CaO particles (as shown in Figure 2).

2.3. Samples and Analysis Methods

The final products of reaction were weighed, and the particles at the bottom of the beaker were collected for pH, conductivity and SO42- mass fraction tests. They were mixed with pure water to generate a 0.1 mg/mL solution. After 10 min, the suspensions were filtered by 0.45 μm filter papers. The filtrates were tested of pH, conductivity and SO42- mass fraction by using SG78 multi-parameter measuring instruments and ion chromatography. The SO42- mass fraction of the final reaction products could be calculated by the following differential equation.
ω S O 4 2 - = ω S O 4 2 - × ρ c × 100 % = 0.1 × ω S O 4 2 - %
where ω S O 4 2 is the SO42- mass fraction of the final reaction products, %; ω S O 4 2 represents SO42- mass fraction of filtrate, ppm (μg/g); ρ means the density of filtrate, calculated as 1 g/mL; c stands for the concentration of filtrate, calculated as 0.1 mg/mL.
The corrosion rates of different tested metals were evaluated by weighing the final products under the three conditions above. The corrosion rate was expressed by the weight loss of tested samples as follows:
v c = w 0 w 1 S × τ
where vc is the corrosion rate, mg/(cm2·h); w0 represents the initial weight of tested materials, mg; w1 stands for the weight of tested materials after corrosion by cleaning the covering attachments, mg; S means the area of tested materials, cm2; τ represents the corrosion time, h.
Scanning electron microscope (SEM) equipped with the energy-dispersive X-ray spectroscopy (EDS), X-ray diffraction (XRD) and X-ray fluorescence (XRF) were used to record the continuous development of particles and metal samples during the tests. SEM–EDS were used for the micro-morphology and elemental compositions of different areas, XRD for major compounds and components, and XRF for elemental determination.

3. Results and Discussion

3.1. Reaction Mechanism between acid Solution and Particles

As described in [16,18,21,22,32,33], the low-temperature corrosion occurred with viscous fouling layer simultaneously. The extent of reaction between the condensed acid solution and ash particles of the viscous fouling layer on the metal surface influenced the metal corrosion significantly. Hence, the reaction mechanism between the H2SO4 solution and particles is discussed to understand the acid–ash reaction progress of the viscous fouling layer. The innermost fouling layer was tightly attached to the heating surface and could only be removed by water washing. In the characterization tests, the deformation of small ash particles and the formation of large cotton-shaped aggregate were obviously observed. Meanwhile, the contents of S, Cl, F increased greatly. The acid–ash reaction of these dense ash particles was most thorough. In the laboratory experiments, the particles, which completely reacted with the H2SO4 solution at the bottom of the beaker, were collected to mimic the dense ash particles attached to the heating metal surface in practice.

3.1.1. Acid–Ash Reaction Degree Tested for Reaction Products

The values of pH, conductivity and SO42- mass fraction of products after reaction were measured to illustrate the acid–ash reaction extent of the viscous fouling layer attached to the metal surface. The filtrate pH values of fully reacted particles of SiO2, fly ash and CaO/MgO at the bottom of beaker reacted under specific temperatures (140 °C, 105 °C, 80 °C, 73 °C and 60 °C) with different concentrations of H2SO4 solution (80%, 70%, 60%, 56% and 45%), which are listed in Table 1, and their conductivity values in Table 2. The pH values of the final products after reaction increased, but the conductivity decreased with the reduction of H2SO4 solution concentration. Compared with the reaction of MgO/CaO particles with H2SO4 solution, the H2SO4 solutions reacting with both SiO2 and fly ash particles remained acidic, and the corresponding pH values changed slightly under different H2SO4 concentrations. For H2SO4 with the same concentration, the pH value of H2SO4 solution reacting with fly ash particles was similar with that reacting with SiO2 particles but was much lower than that with MgO/CaO particles. Meanwhile, the conductivity of the H2SO4 solution reacting with fly ash particles was much lower than that reacting with SiO2 particles, but higher than that with MgO/CaO particles. It is inferred that for the reaction between H2SO4 solution and SiO2 particles, the physical absorption was dominant rather than a chemical reaction. By contrast, for MgO/CaO particles, it was dominated by chemical absorption. Accordingly, the amount of acid solution by chemical reaction with alkaline oxide in ash particles was much less in comparison with the amounts by physical adsorption. Furthermore, the decrease in pH value and ion content is owed to the formation of insoluble or slightly dissolved sulfate during the acid–ash reaction process. This will be further explained by analyzing the observations of microtopography, mineralogy and elemental reacted ash samples in the following discussion.
Since an evident fouling layer and low-temperature corrosion were observed under an 80 °C heating surface in field experiments, the final products after reaction with a 60% H2SO4 solution were chosen for SO42- mass fraction measurement by ion chromatography to further reveal the acid–Ash reaction mechanisms.
The chromatography on final products indicated a peak value of the SO42- mass fraction after the reaction between the 60% H2SO4 solution and the three different particles, i.e., SiO2, fly ash, and MgO/CaO particles. The SO42- mass fractions after three different reactions were 18.65%, 17.09%, 13.71%, respectively. The SO42- mass fraction by the reaction between the acid solution and fly ash particles was close to that by the reaction between the acid solution and SiO2 particles, which is consistent with the pH and conductivity results. The decrease in SO42- mass fraction was mainly caused by the formation of insoluble or slightly dissolved sulfate by the reaction between the alkaline oxides in ash particles and H2SO4 solution. Thus, for fully reacted ash particles, the acid solution rarely reacted with ash particles chemically.

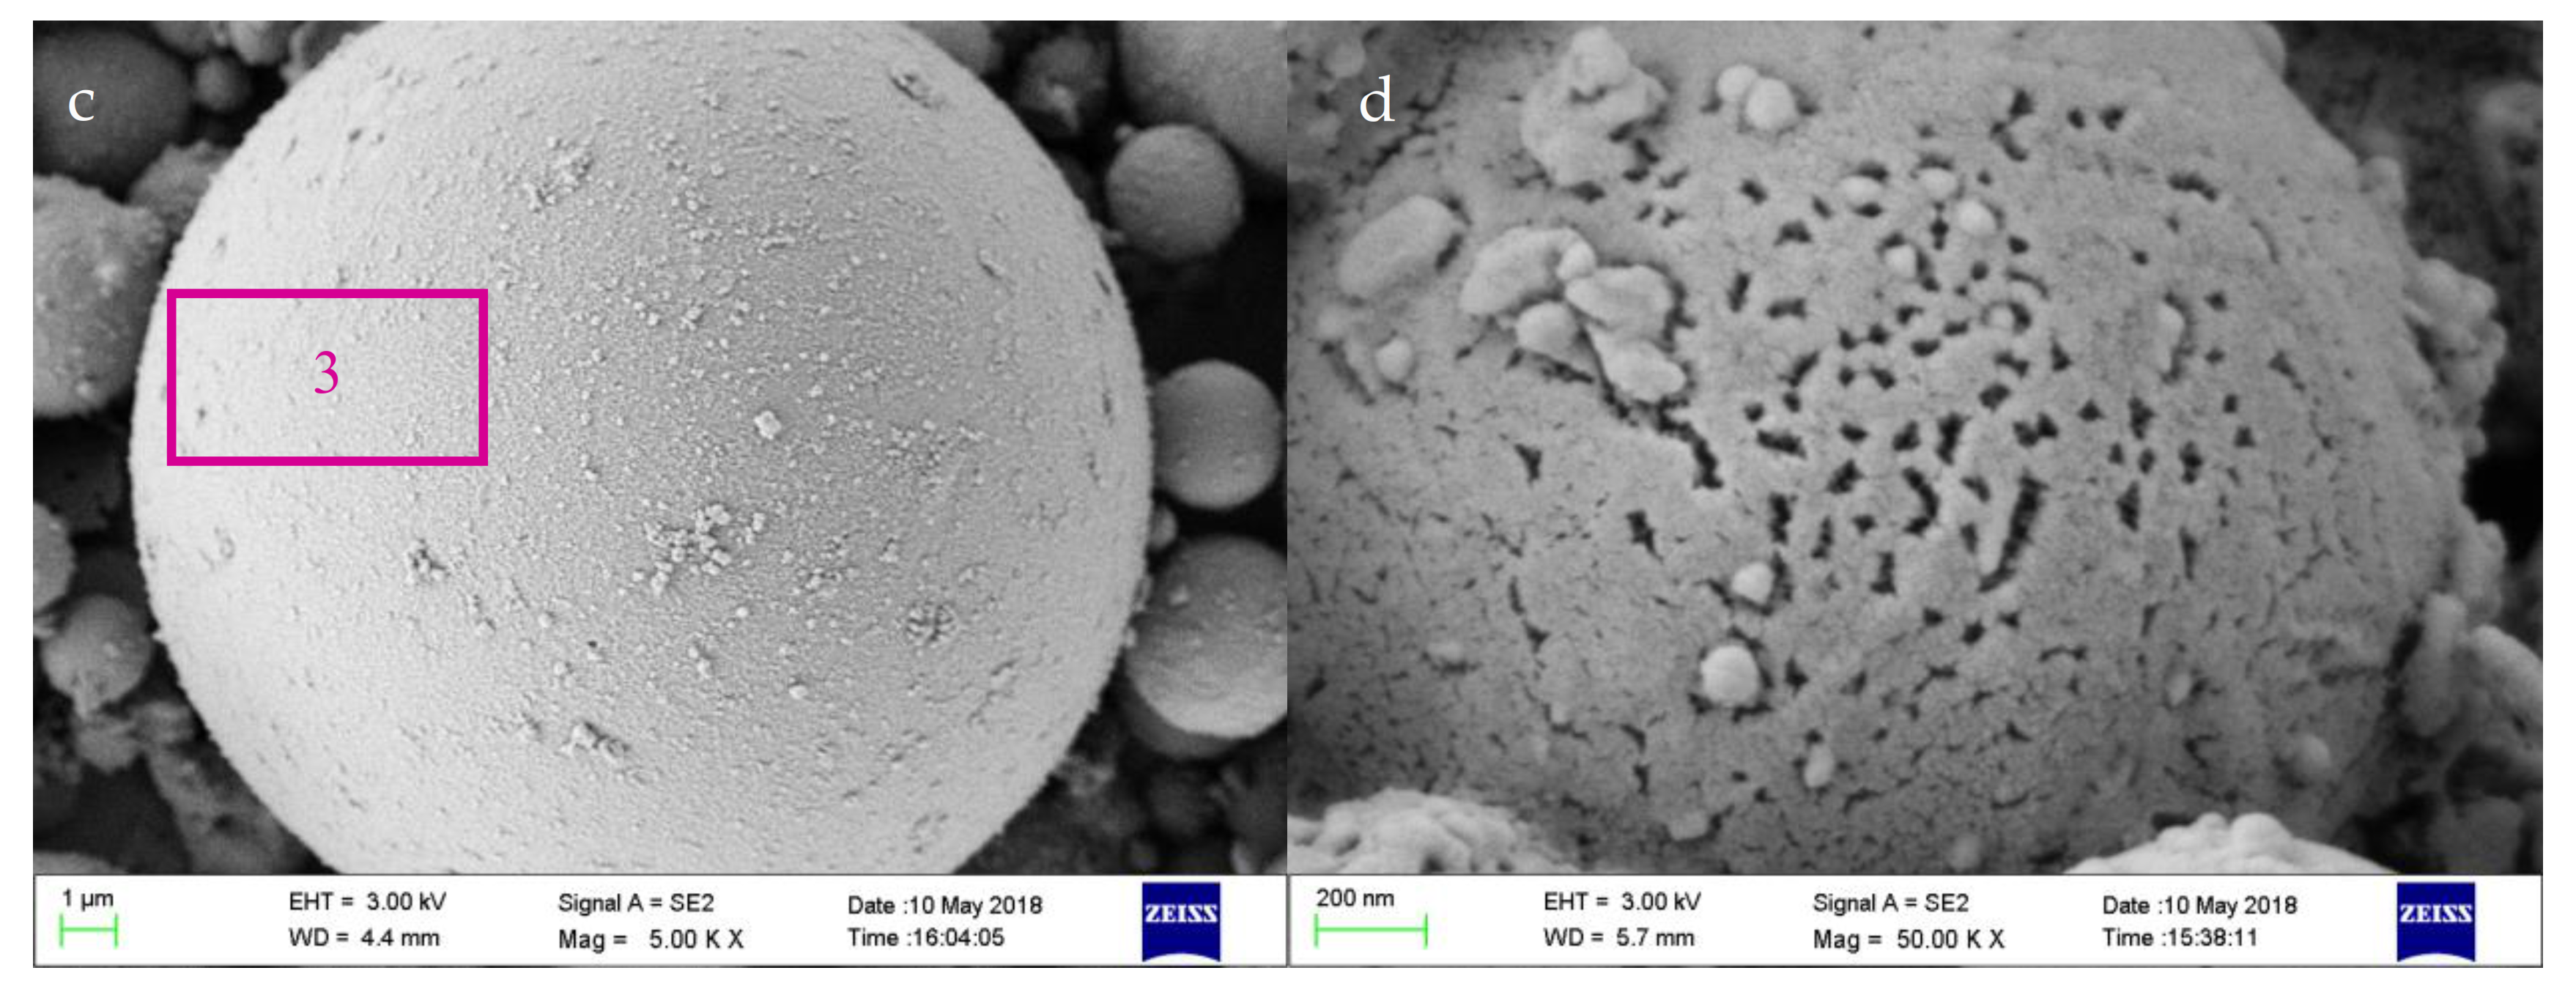
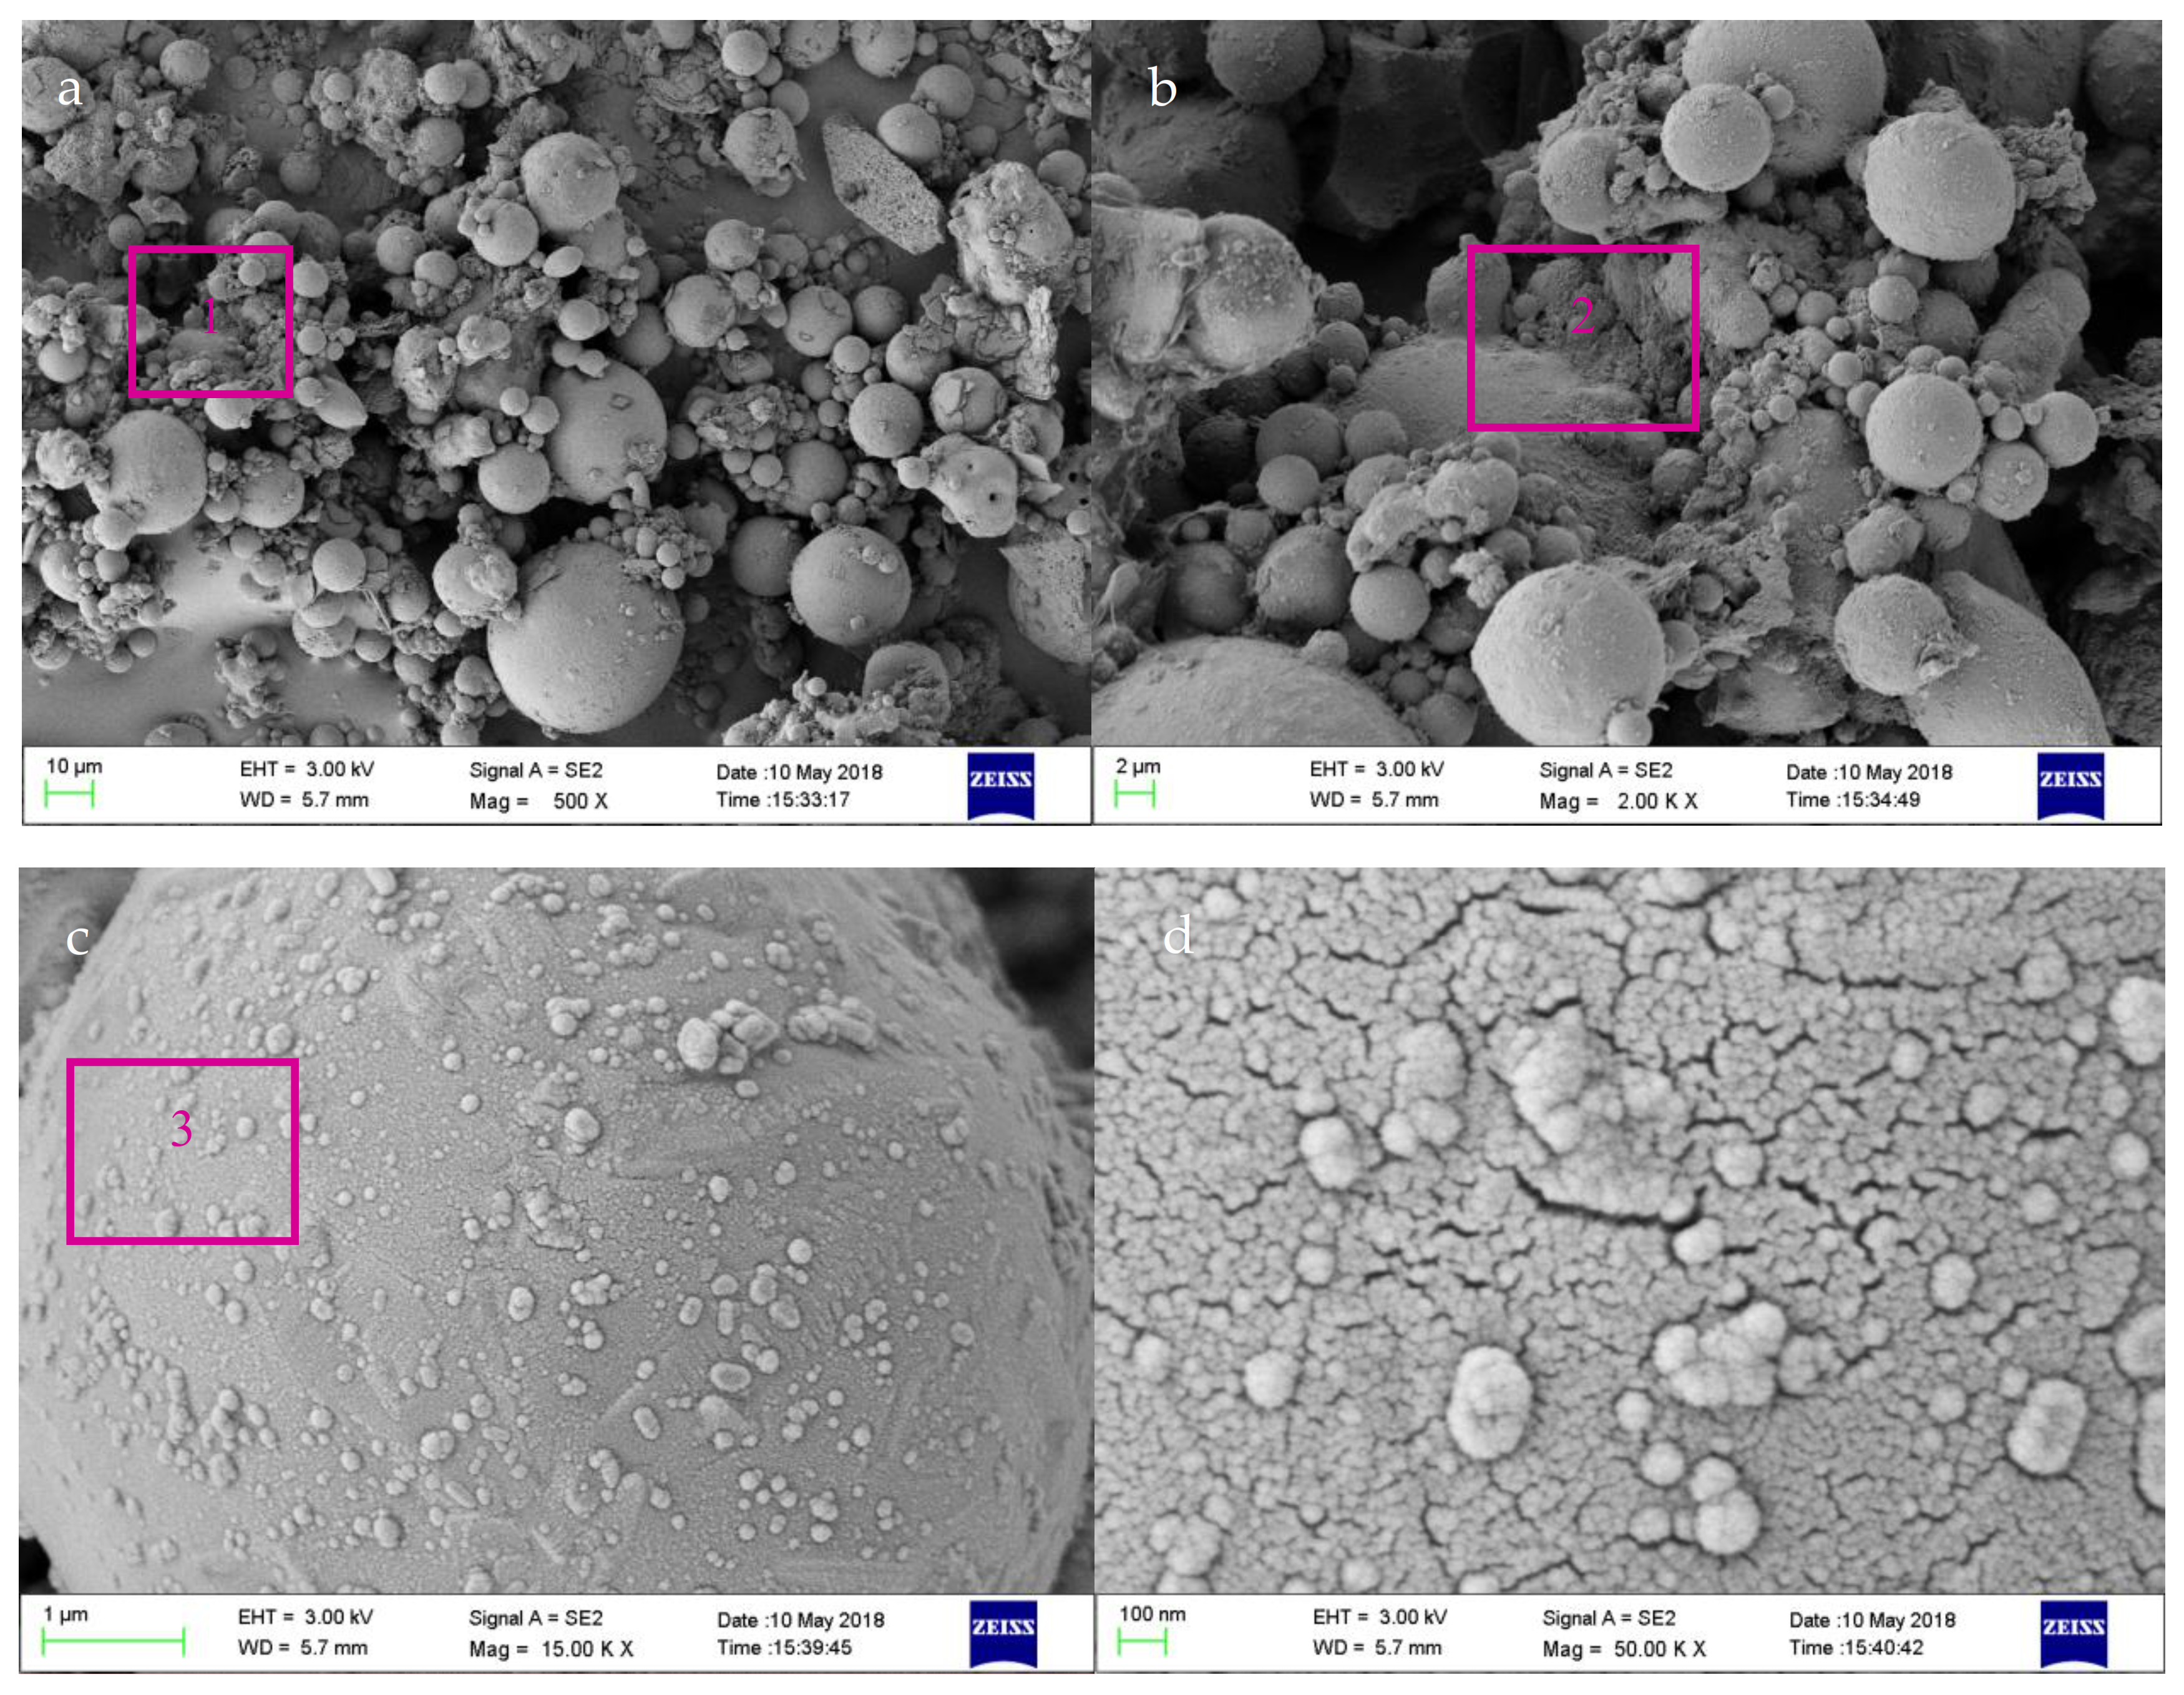
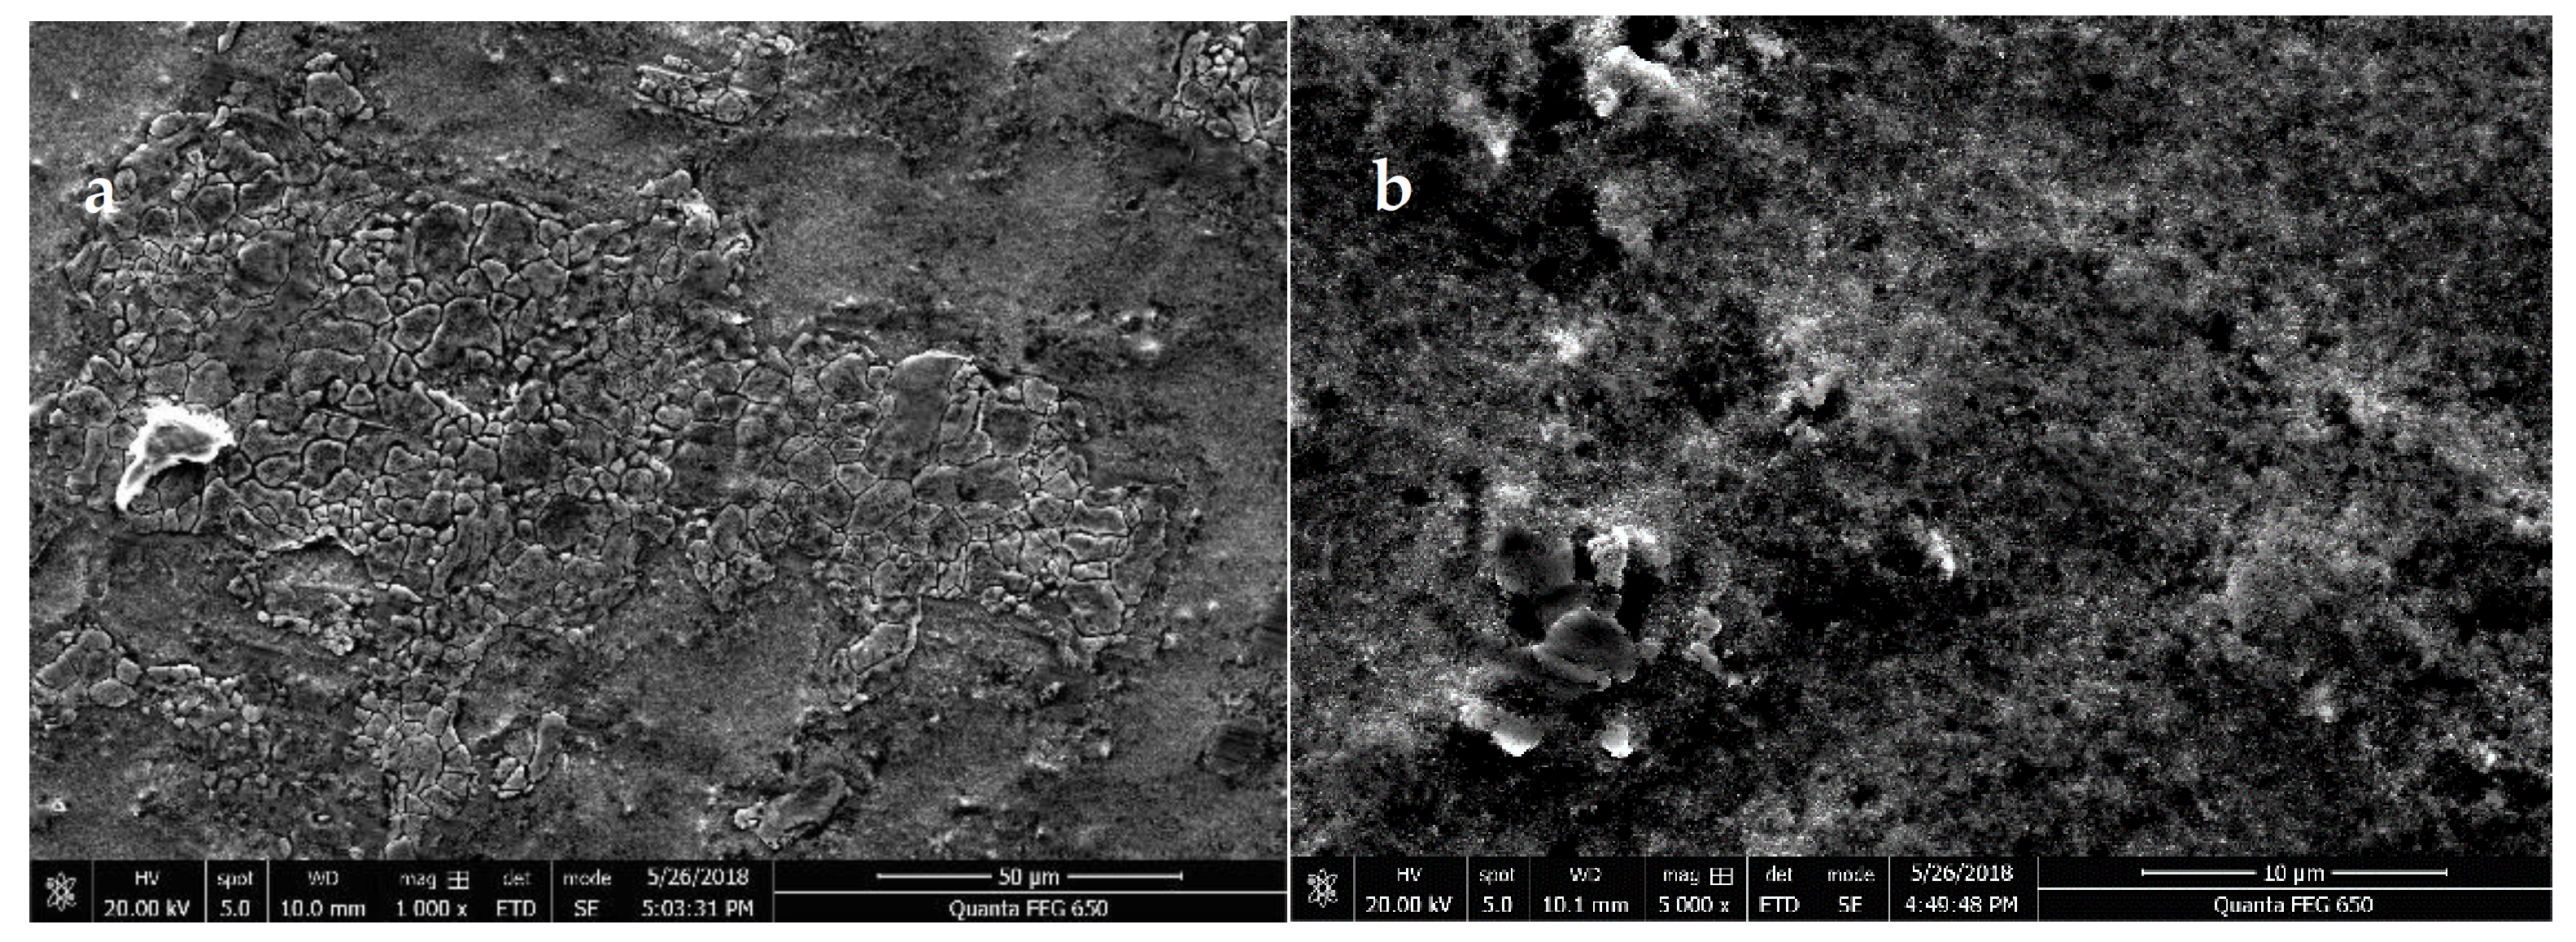
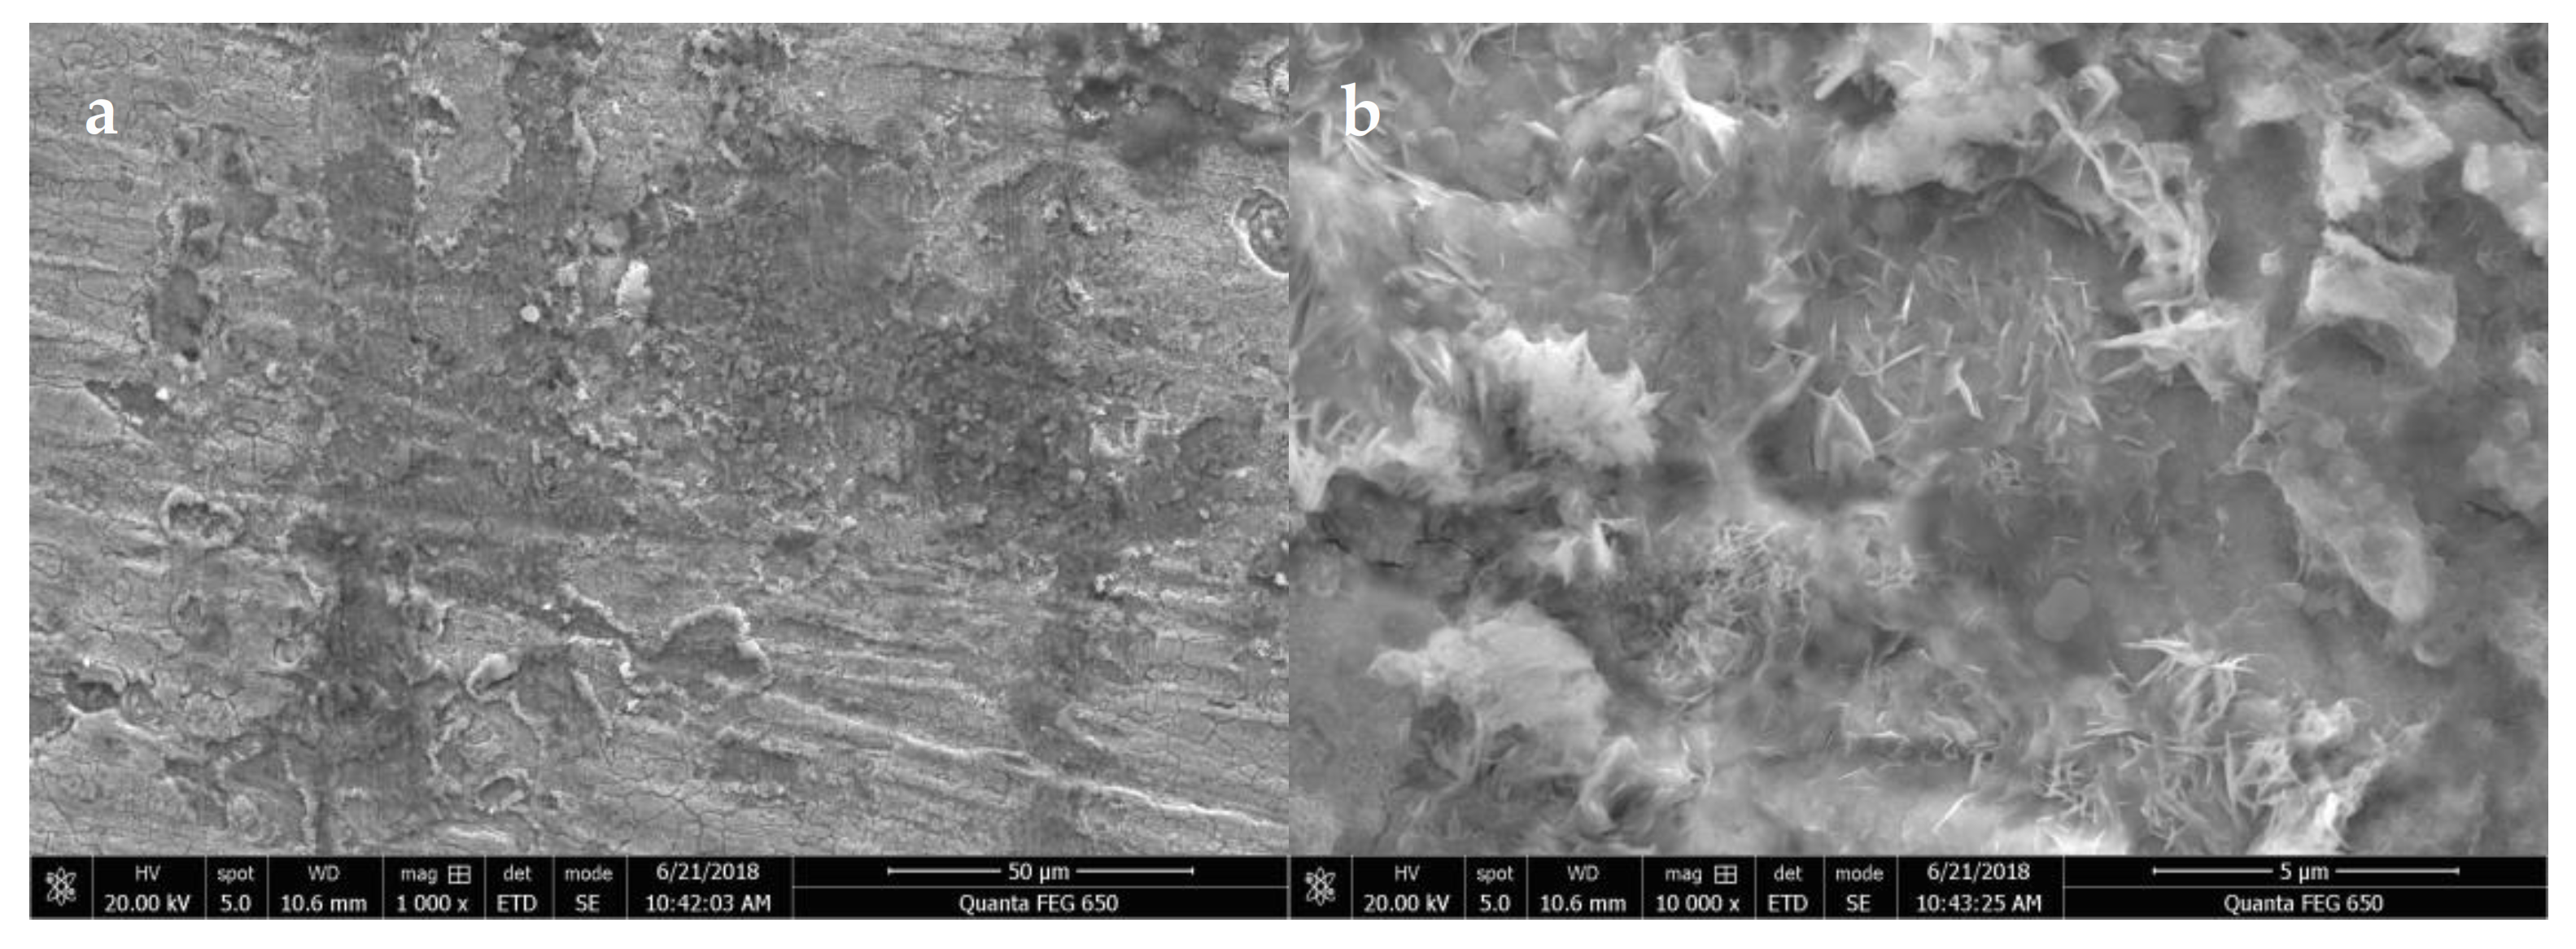
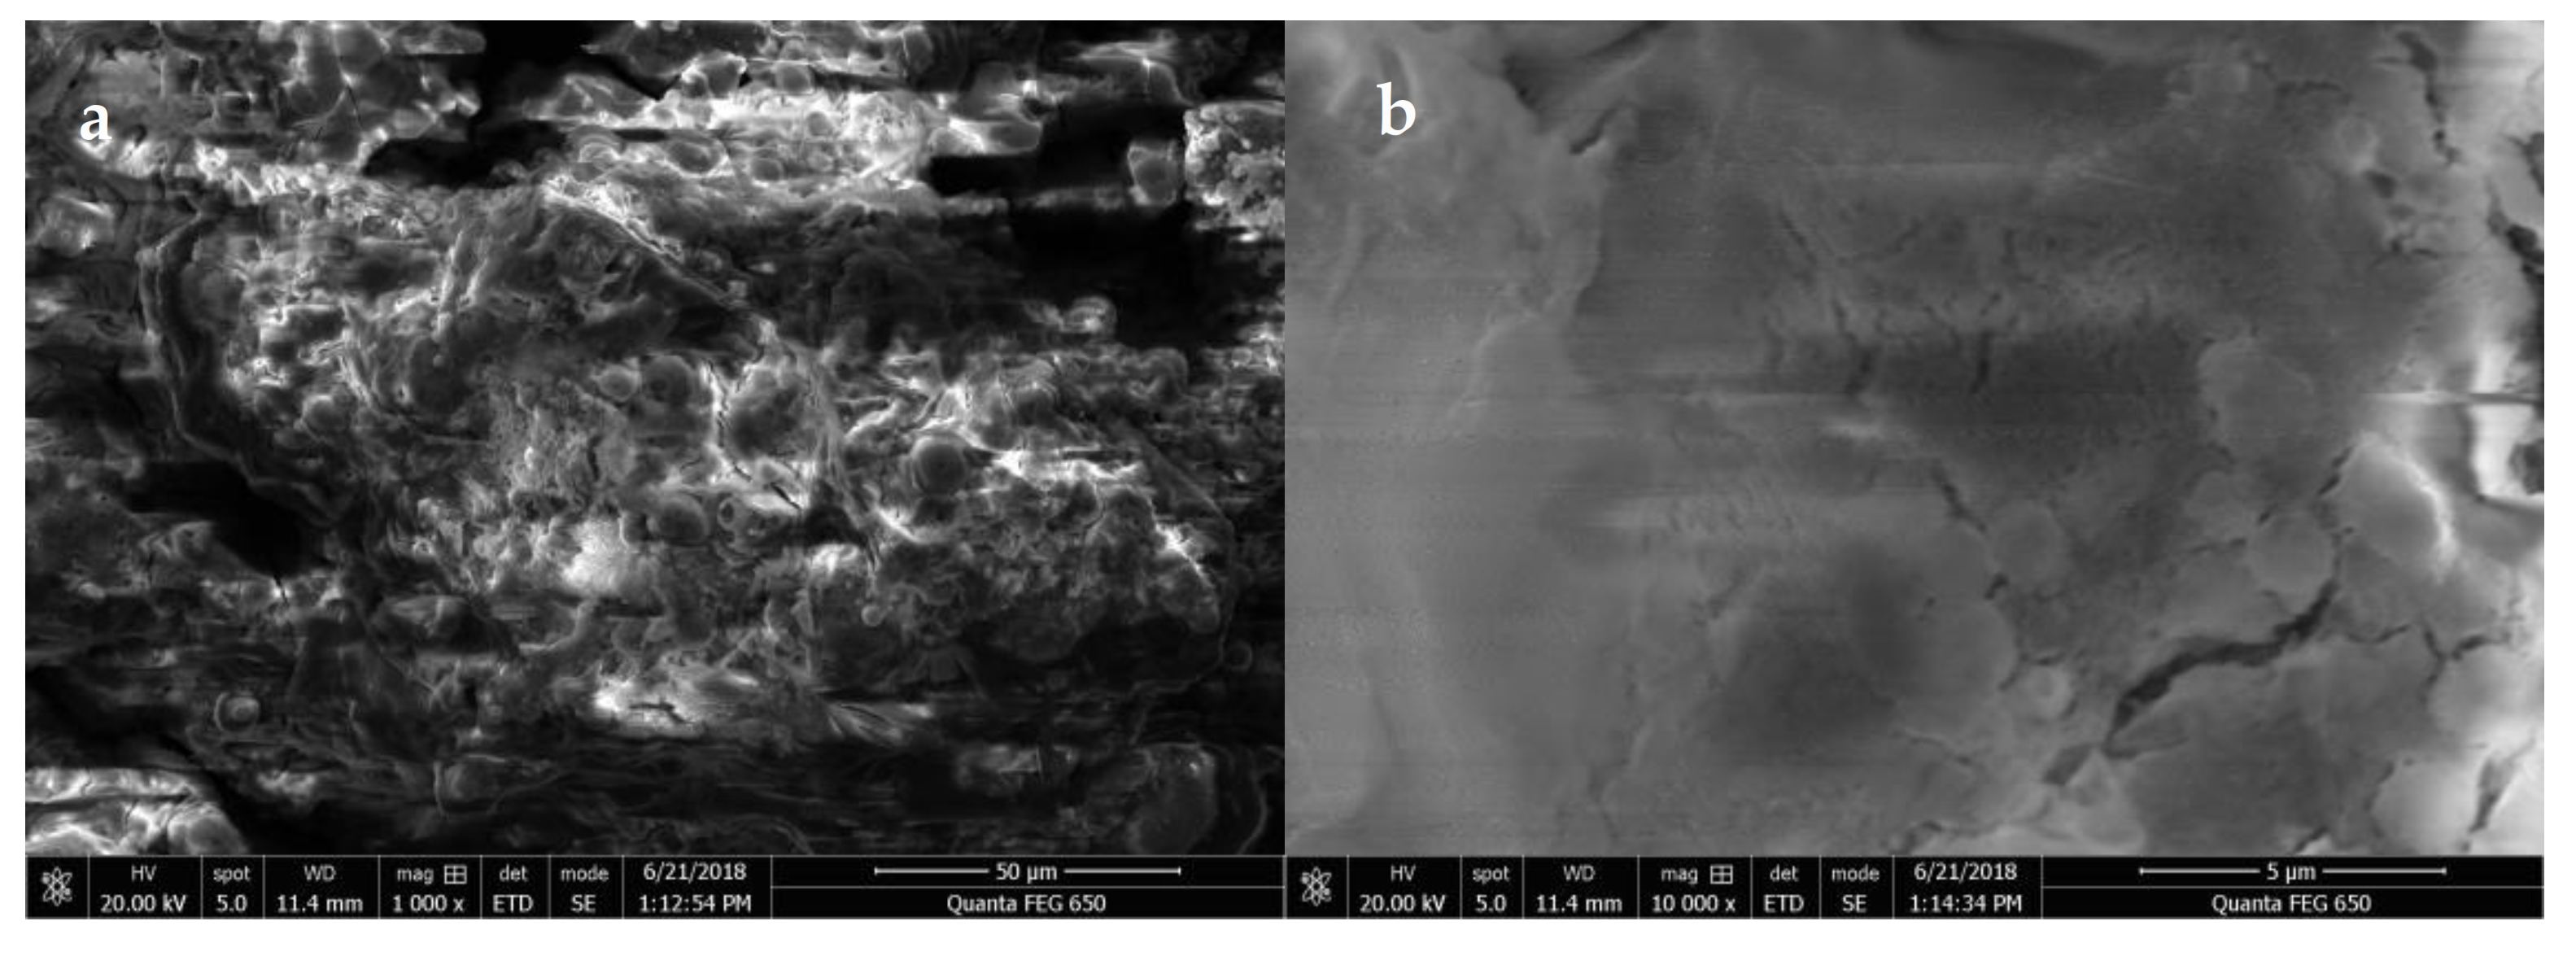
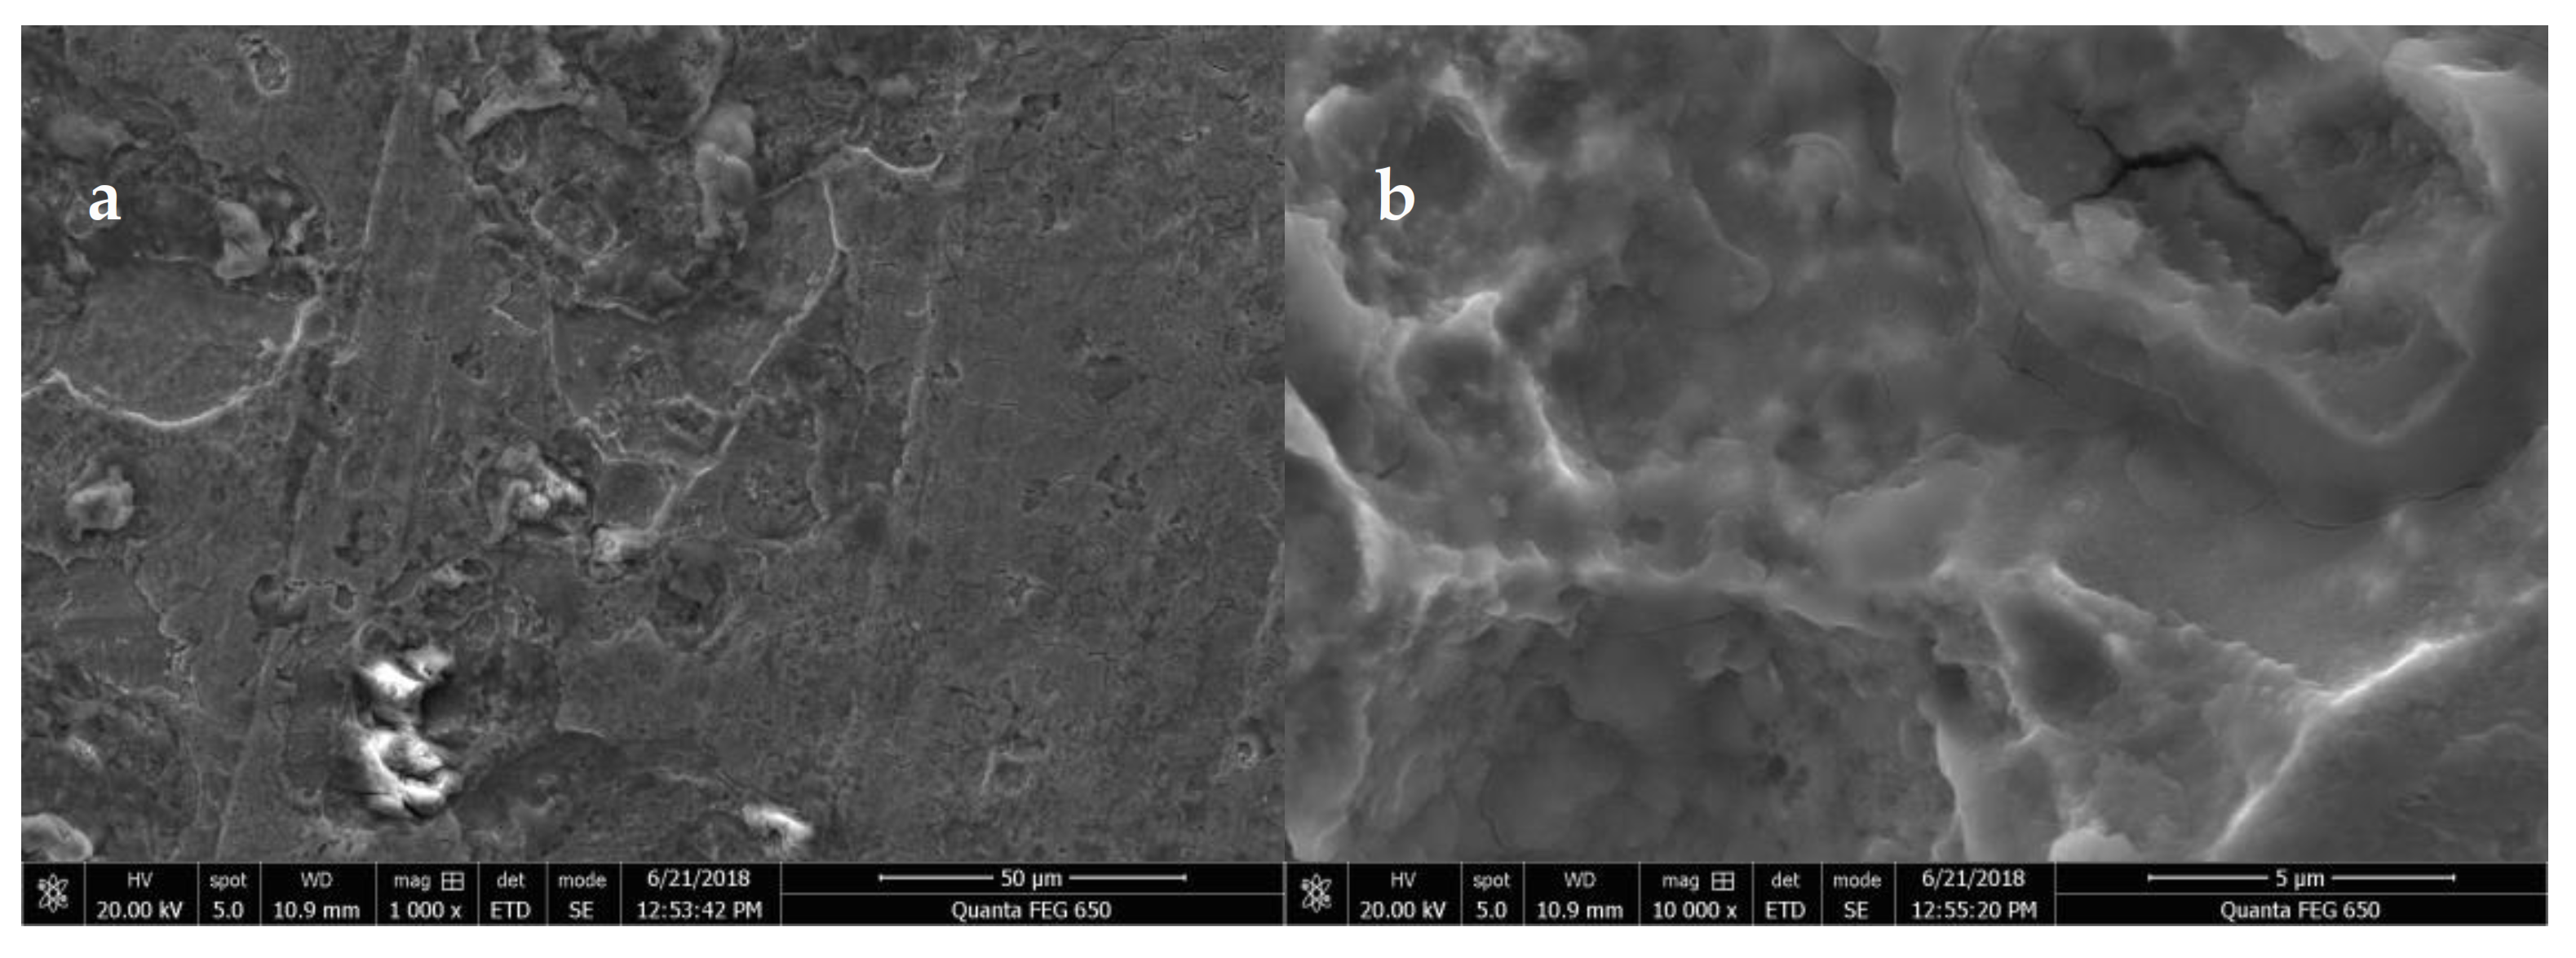
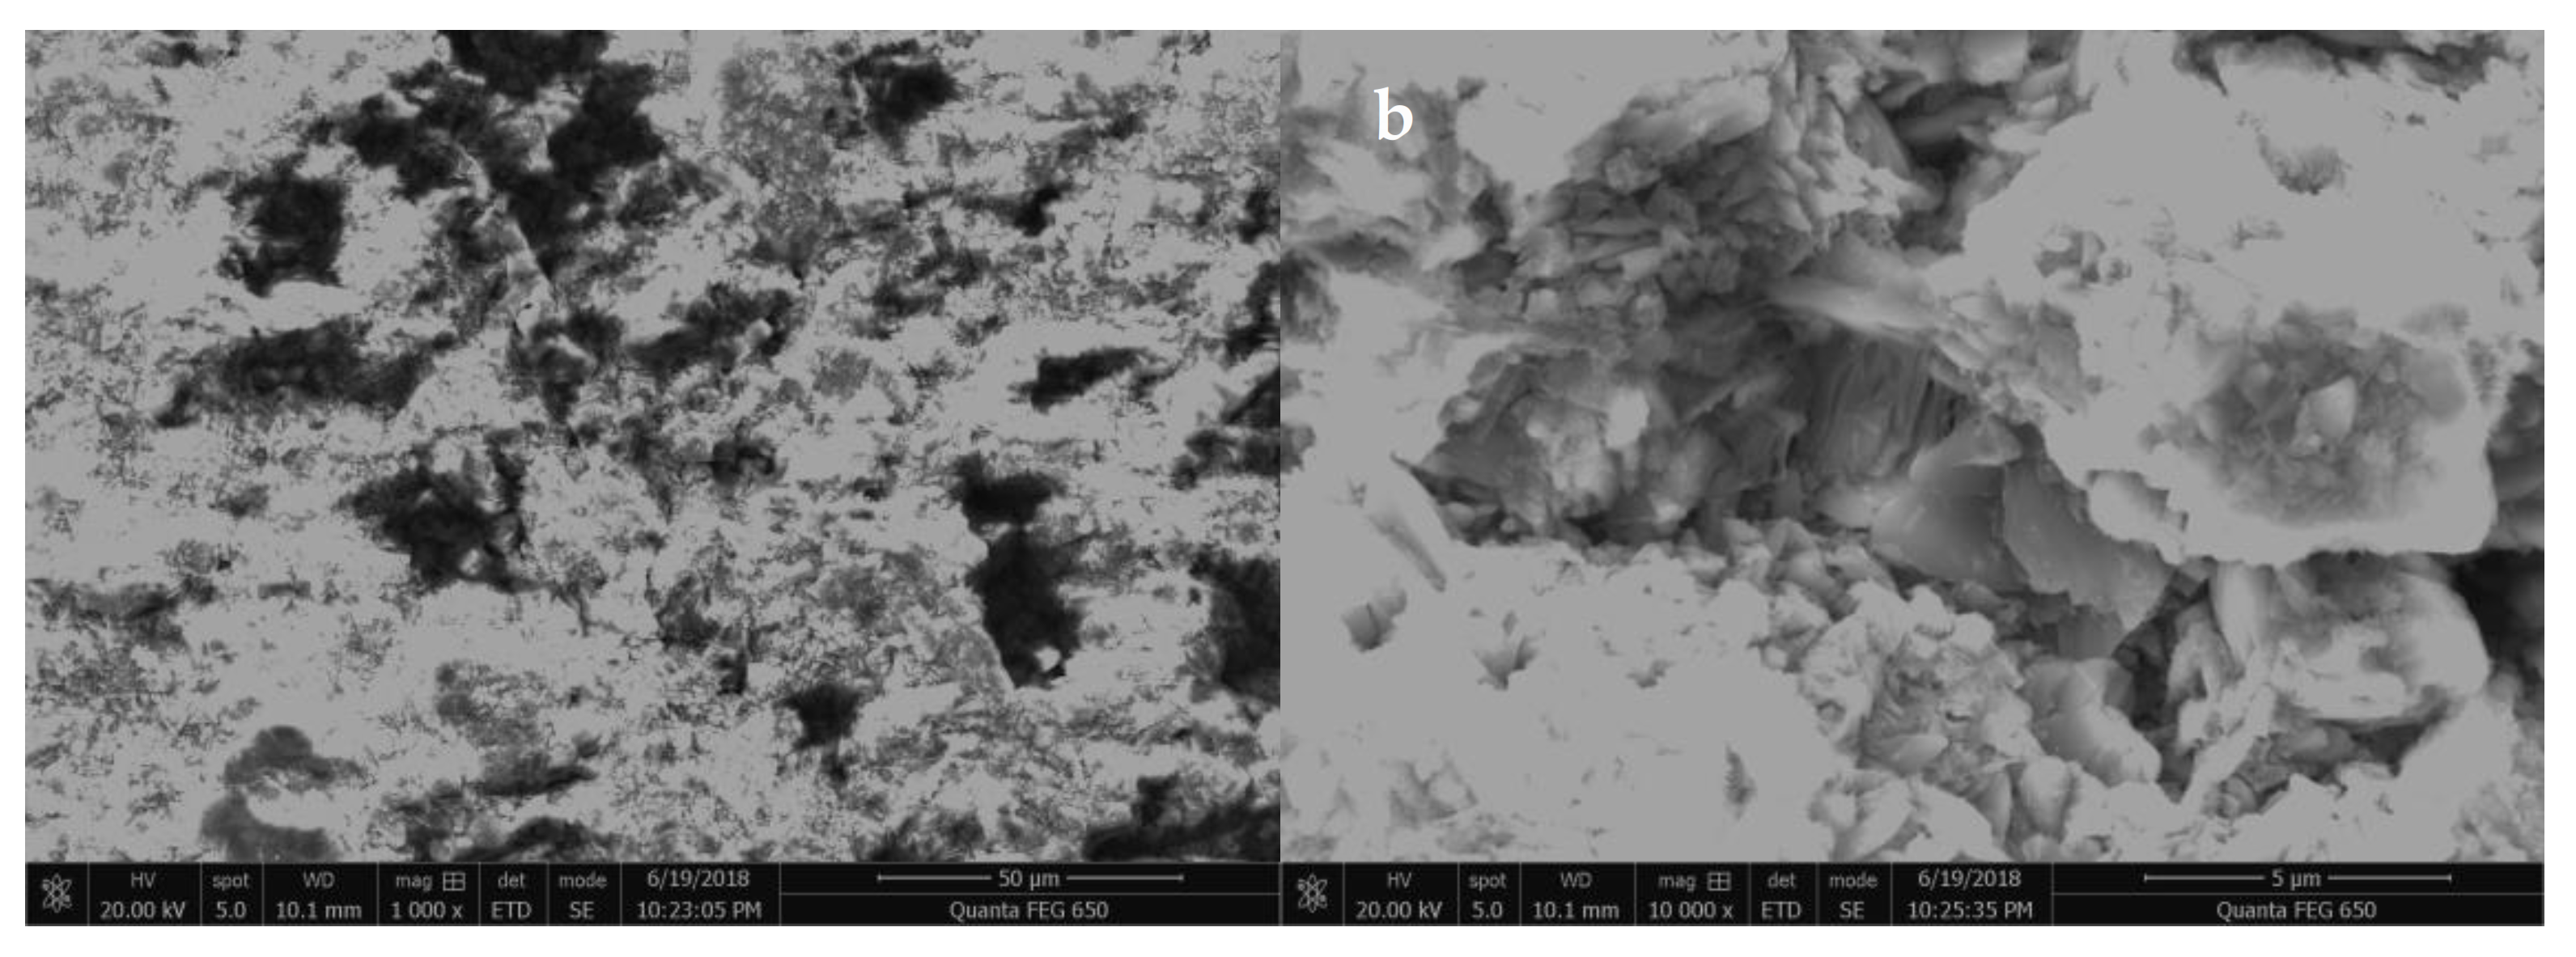
3.1.2. Micro-Topography
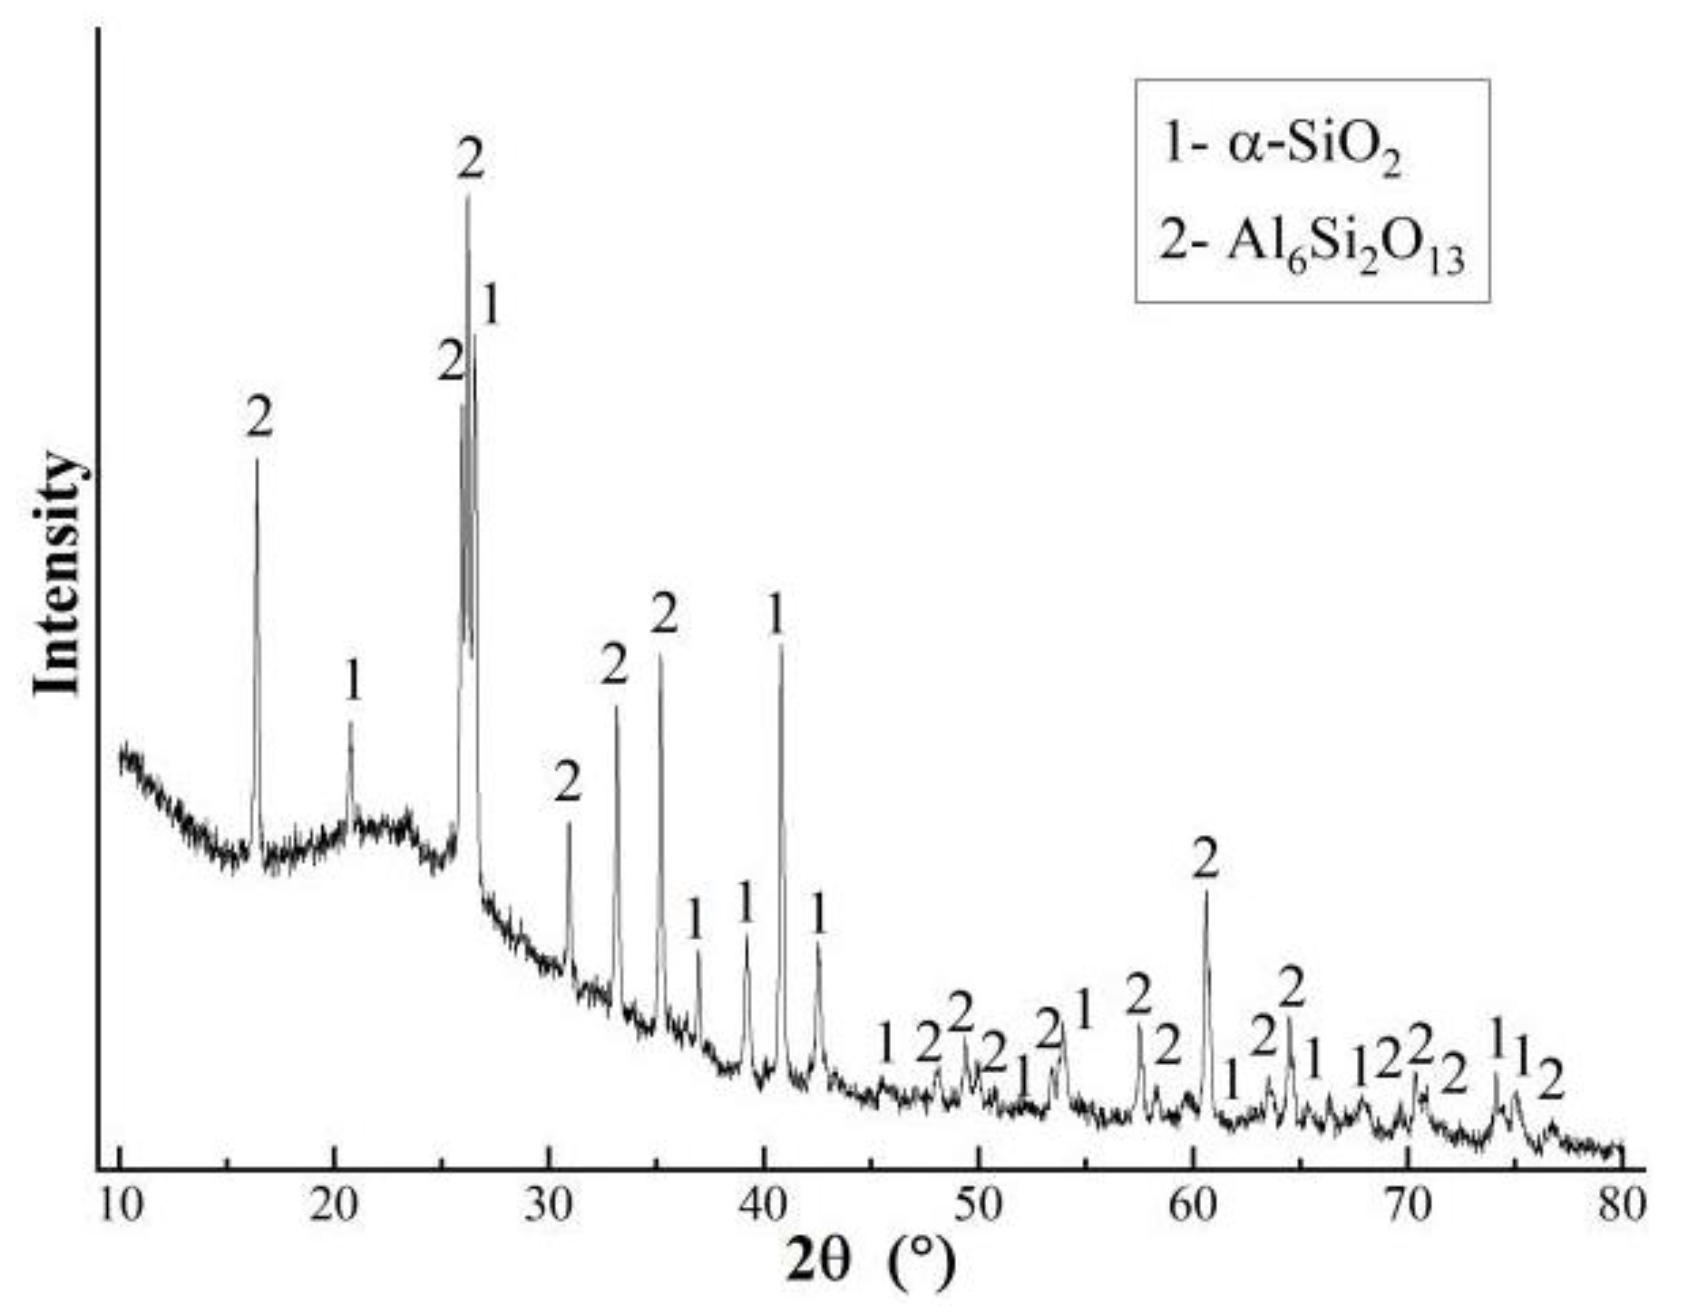
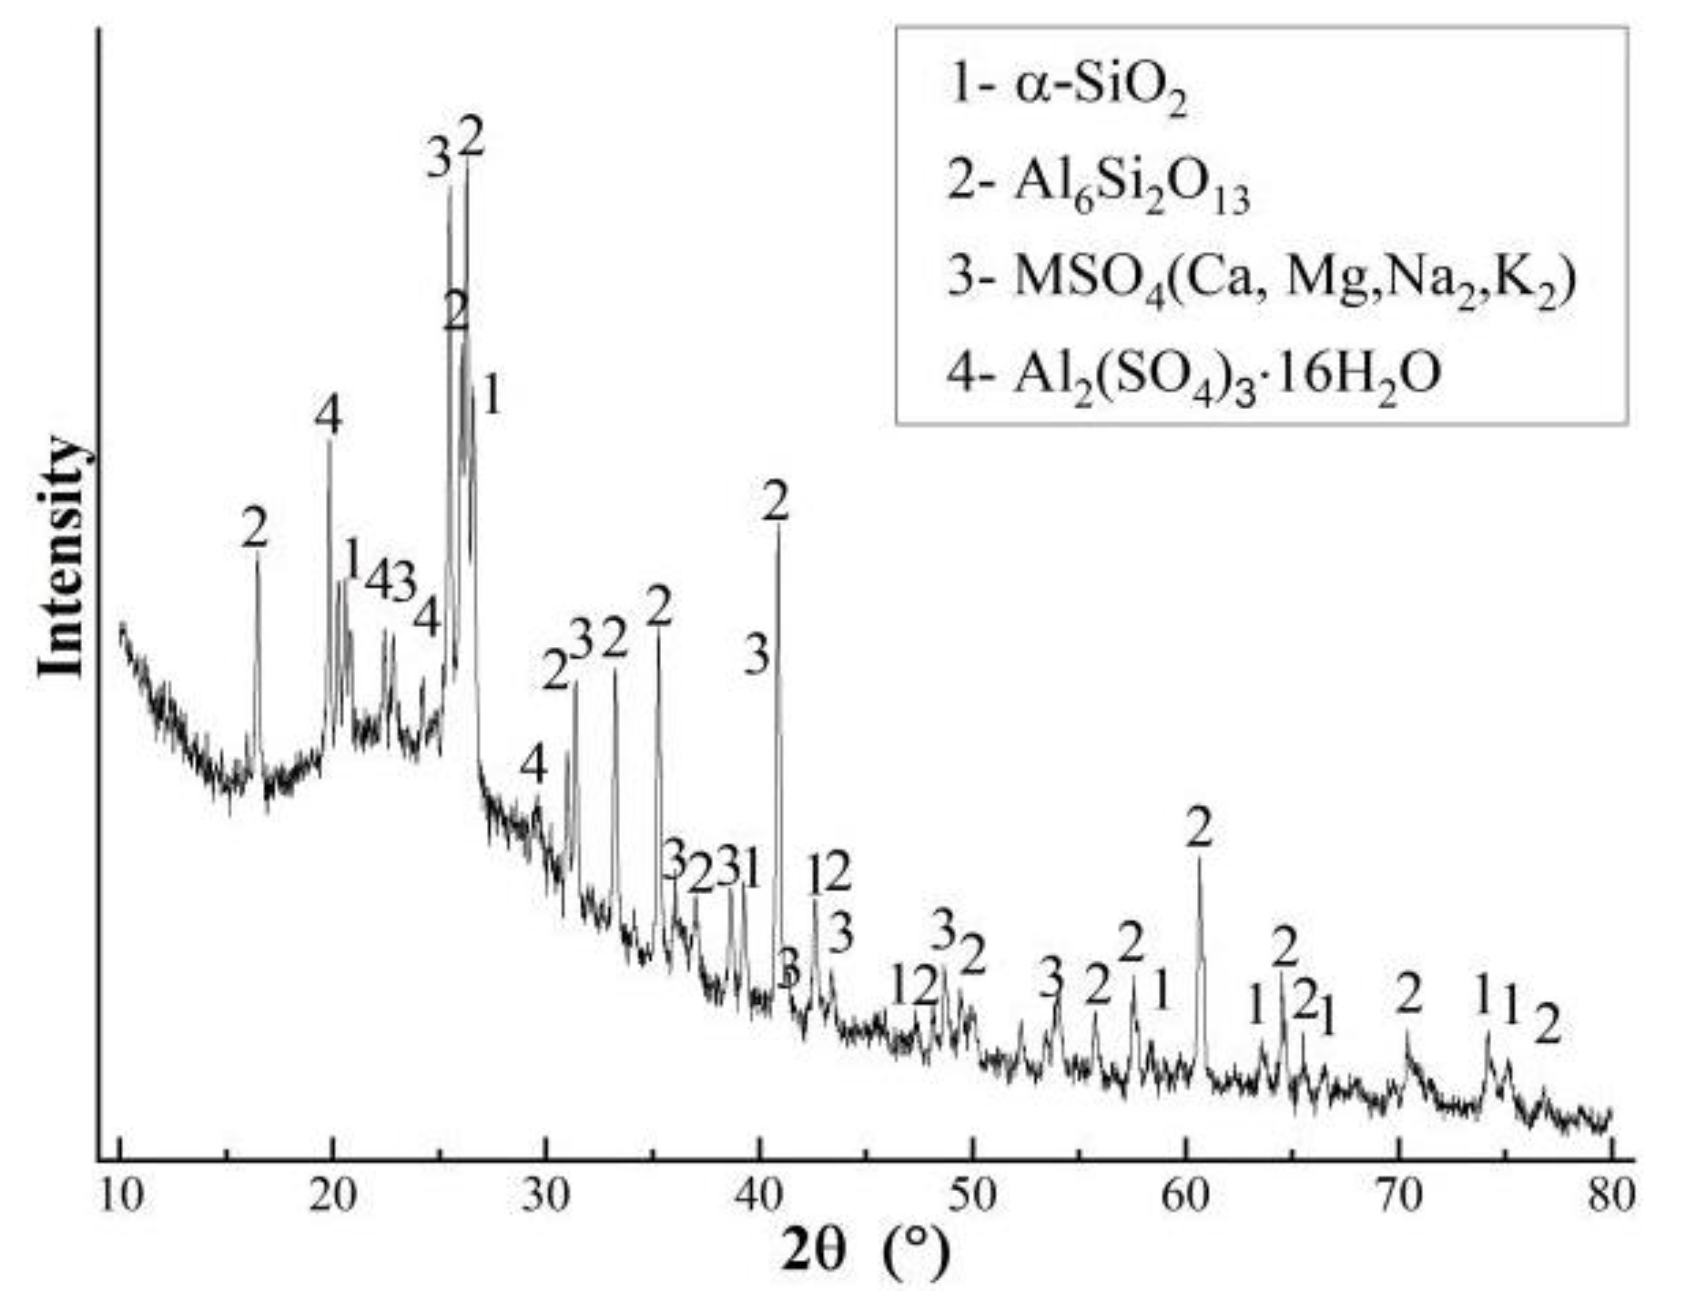
The SEM images of non-reacted and reacted ash samples are separately shown in Figure 3 and Figure 4. It can be seen that most of the non-reacted ash particles were spherical and accompanied by some irregular shapes. The appearance of the sub-micron non-reacted particles attached to the surface of larger particles can be clearly described, as well as the pore structure on the surface with a diameter of less than 1 μm. By contrast, almost all the reacted ash particles were gathered together, and several smaller ash particles were reunited and formed large particles, leading to an obvious aggregation. The finer ash particles were dissolved, while the shape of the sub-micron particles stuck to larger particles was already deformed and attached to the surface in a flat shape. The results of the reacted ash particle are consistent our previous findings [21,22,23]. The original appearance of ash particles was destroyed by the chemical reaction between the acid solution and ash particles. The dissolved and deformed ash particles as well as the obvious aggregation led to a serious decrease in pore structure and a further drop in physical adsorption amount. The maximum amount of fly ash particles reacting with H2SO4 solution kept stable in the end.
The elemental compositions of the micro-zones for both non-reacted particles and reacted ash particles are presented in Table 3. The results revealed that all the ash samples contained O, Na, Mg, Al, Si, S, K, Ca, Ti, Cr, Mn, Fe, among which Al and Si hold a higher proportion. The fraction of S in the reacted ash particle was as large as 8.59% to 9.63%, which is higher than that in the non-reacted ash particle. Different from the field experimental results, S was mainly concentrated near the aggregation area of dissolved sub-micron particles [22], and the S distributions of reacted ash particles were distributed evenly. Moreover, the fraction of S in the reacted ash particles observed in laboratory experiments was much larger than that in field experiments. This was attributed to a more thorough acid–ash reaction by a larger amount of acid solution employed in laboratory experiments than that in field experiments. The increment of S was mainly brought on by the physical adsorption for ash particles.

3.1.3. Mineralogy

The main compounds of non-reacted ash particles and reacted ash particles detected by XRD are illustrated in Figure 5 and Figure 6. On the basis of the JCPDS standard PDF card #89-1961 and #15-0776, obvious diffraction peaks of crystal phases such as Quartz low, dauphine-twinned SiO2 and Mullite, syn—Al6Si2O13 (3Al2O3∙2SiO2) were found in both ash samples. According to the XRD analysis, there are few minor crystalline phases and trace phases; thus, only major crystalline phases were calculated for their amounts. For the main crystalline phases of non-reacted ash particles, the mass fractions of α-SiO2, Al6Si2O13 (3Al2O3∙2SiO2), and glassy amorphous substances were 25%, 50% and 25%, respectively. For the reacted ash particles, the main crystalline phases were α-SiO2 and Al6Si2O13 (3Al2O3∙2SiO2), MSO4(Ca, Mg, Na2, K2), Al2(SO4)3∙16H2O and glassy amorphous substances, with the corresponding mass fractions of 15%, 30%, 23%, 10% and 22%, respectively. Although Al6Si2O13 (3Al2O3∙2SiO2) reacts with H2SO4 forming Al2(SO4)3∙16H2O, the mass fraction was too low in the viscous ash deposits to be collected by field experiments [21,22,23]. This was due to the thorough acid–ash reaction that happened with a larger amount of acid solution in the lab experiments than that in field experiments. The formation of MSO4 (Ca, Mg, Na2, K2) indicates that the alkaline oxide, which was not in the main crystalline phases of the original ash particles, which reacted with the H2SO4 solution, contributing to an increase in sulphate. A similar conclusion was drawn by EDS.

3.1.4. Elemental Analysis

As presented in Table 4, both the non-reacted and reacted ash samples contained Si, Al, Fe, Ca, K, Mg, Ti, Na, etc. The major elemental compositions of the non-reacted and reacted ash samples were SiO2, Al2O3 and some alkaline oxides such as Fe2O3, CaO, MgO and Na2O. Small amounts of S were detected in the original ash sample (~0.94%), while the mass fraction of S increased by 20 times in the reacted ash sample, i.e., 19.23%. This was concluded in Section 3.1.2.
Consequently, the amount of H2SO4 solution consumed by alkaline oxides in ash particles via chemical reaction was smaller than that consumed by physical adsorption in the lab experiments. The appearance of non-reacted ash particles was destroyed, and the main compositions were changed by the chemical reaction. The dissolved and deformed ash particles leading to a significant decrease in spaces basically makes the reaction stable between fly ash particles and the H2SO4 solution. The changes caused by the chemical reaction was in accordance with the results of collected viscous ash particles from the field experiments.

3.2. Effect of Typical Fouling Layer on the Low-Temperature Corrosion of Metal Surface

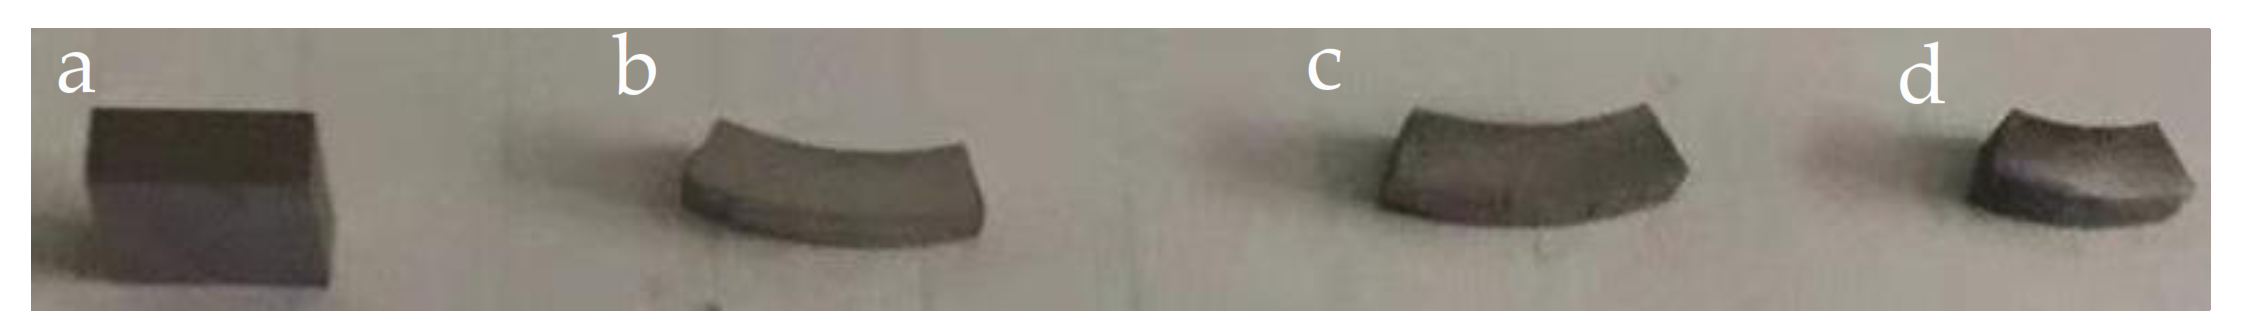
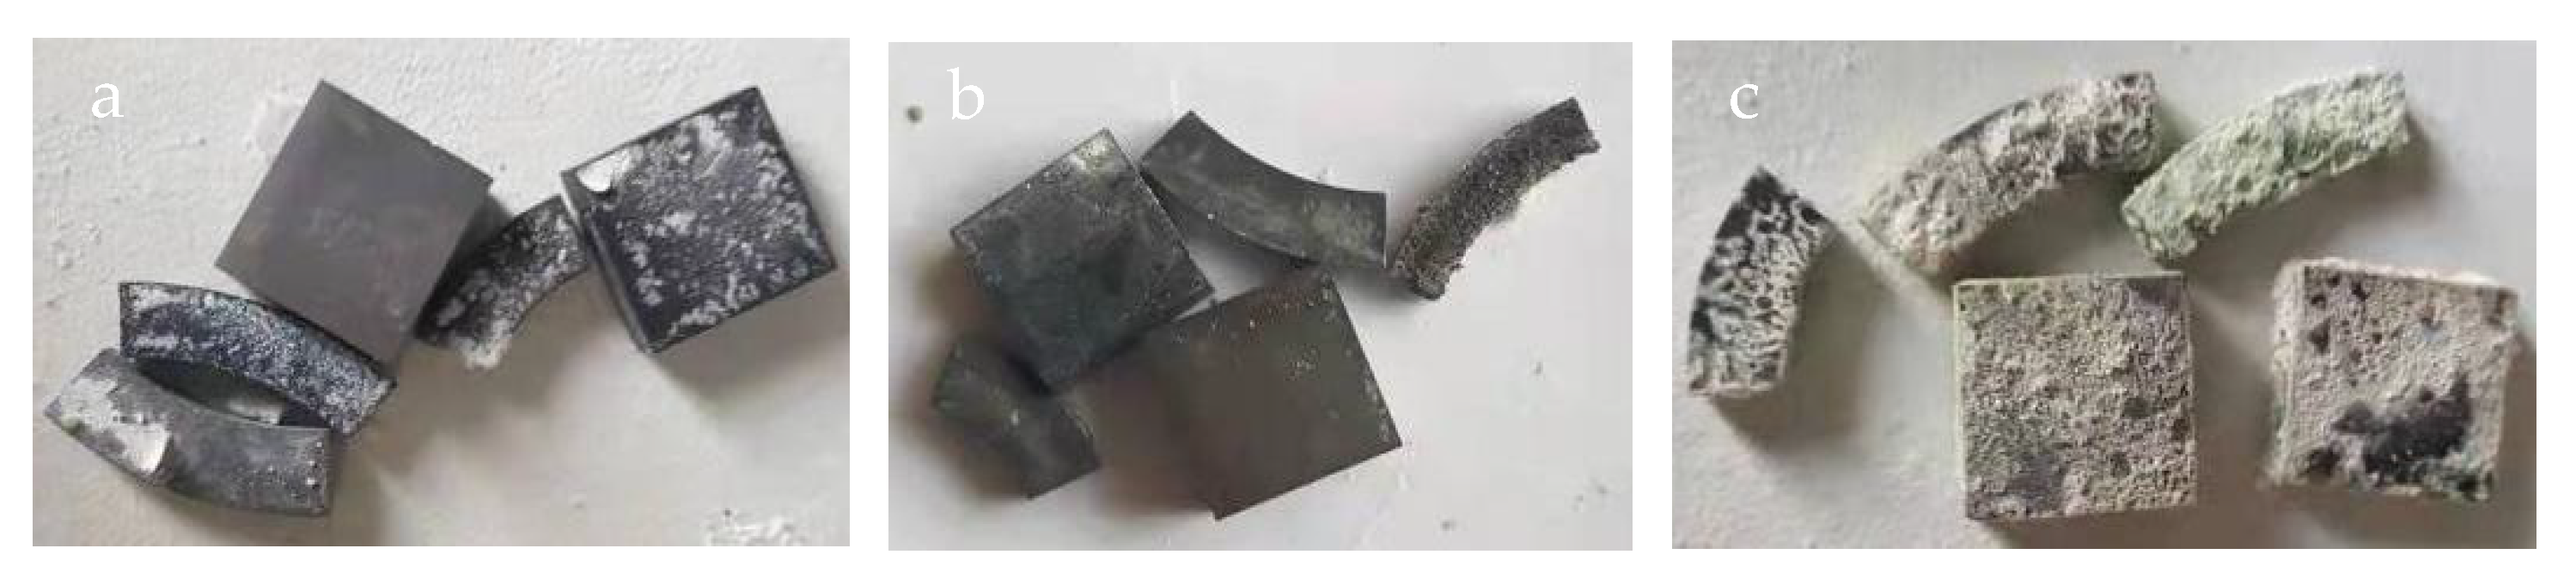
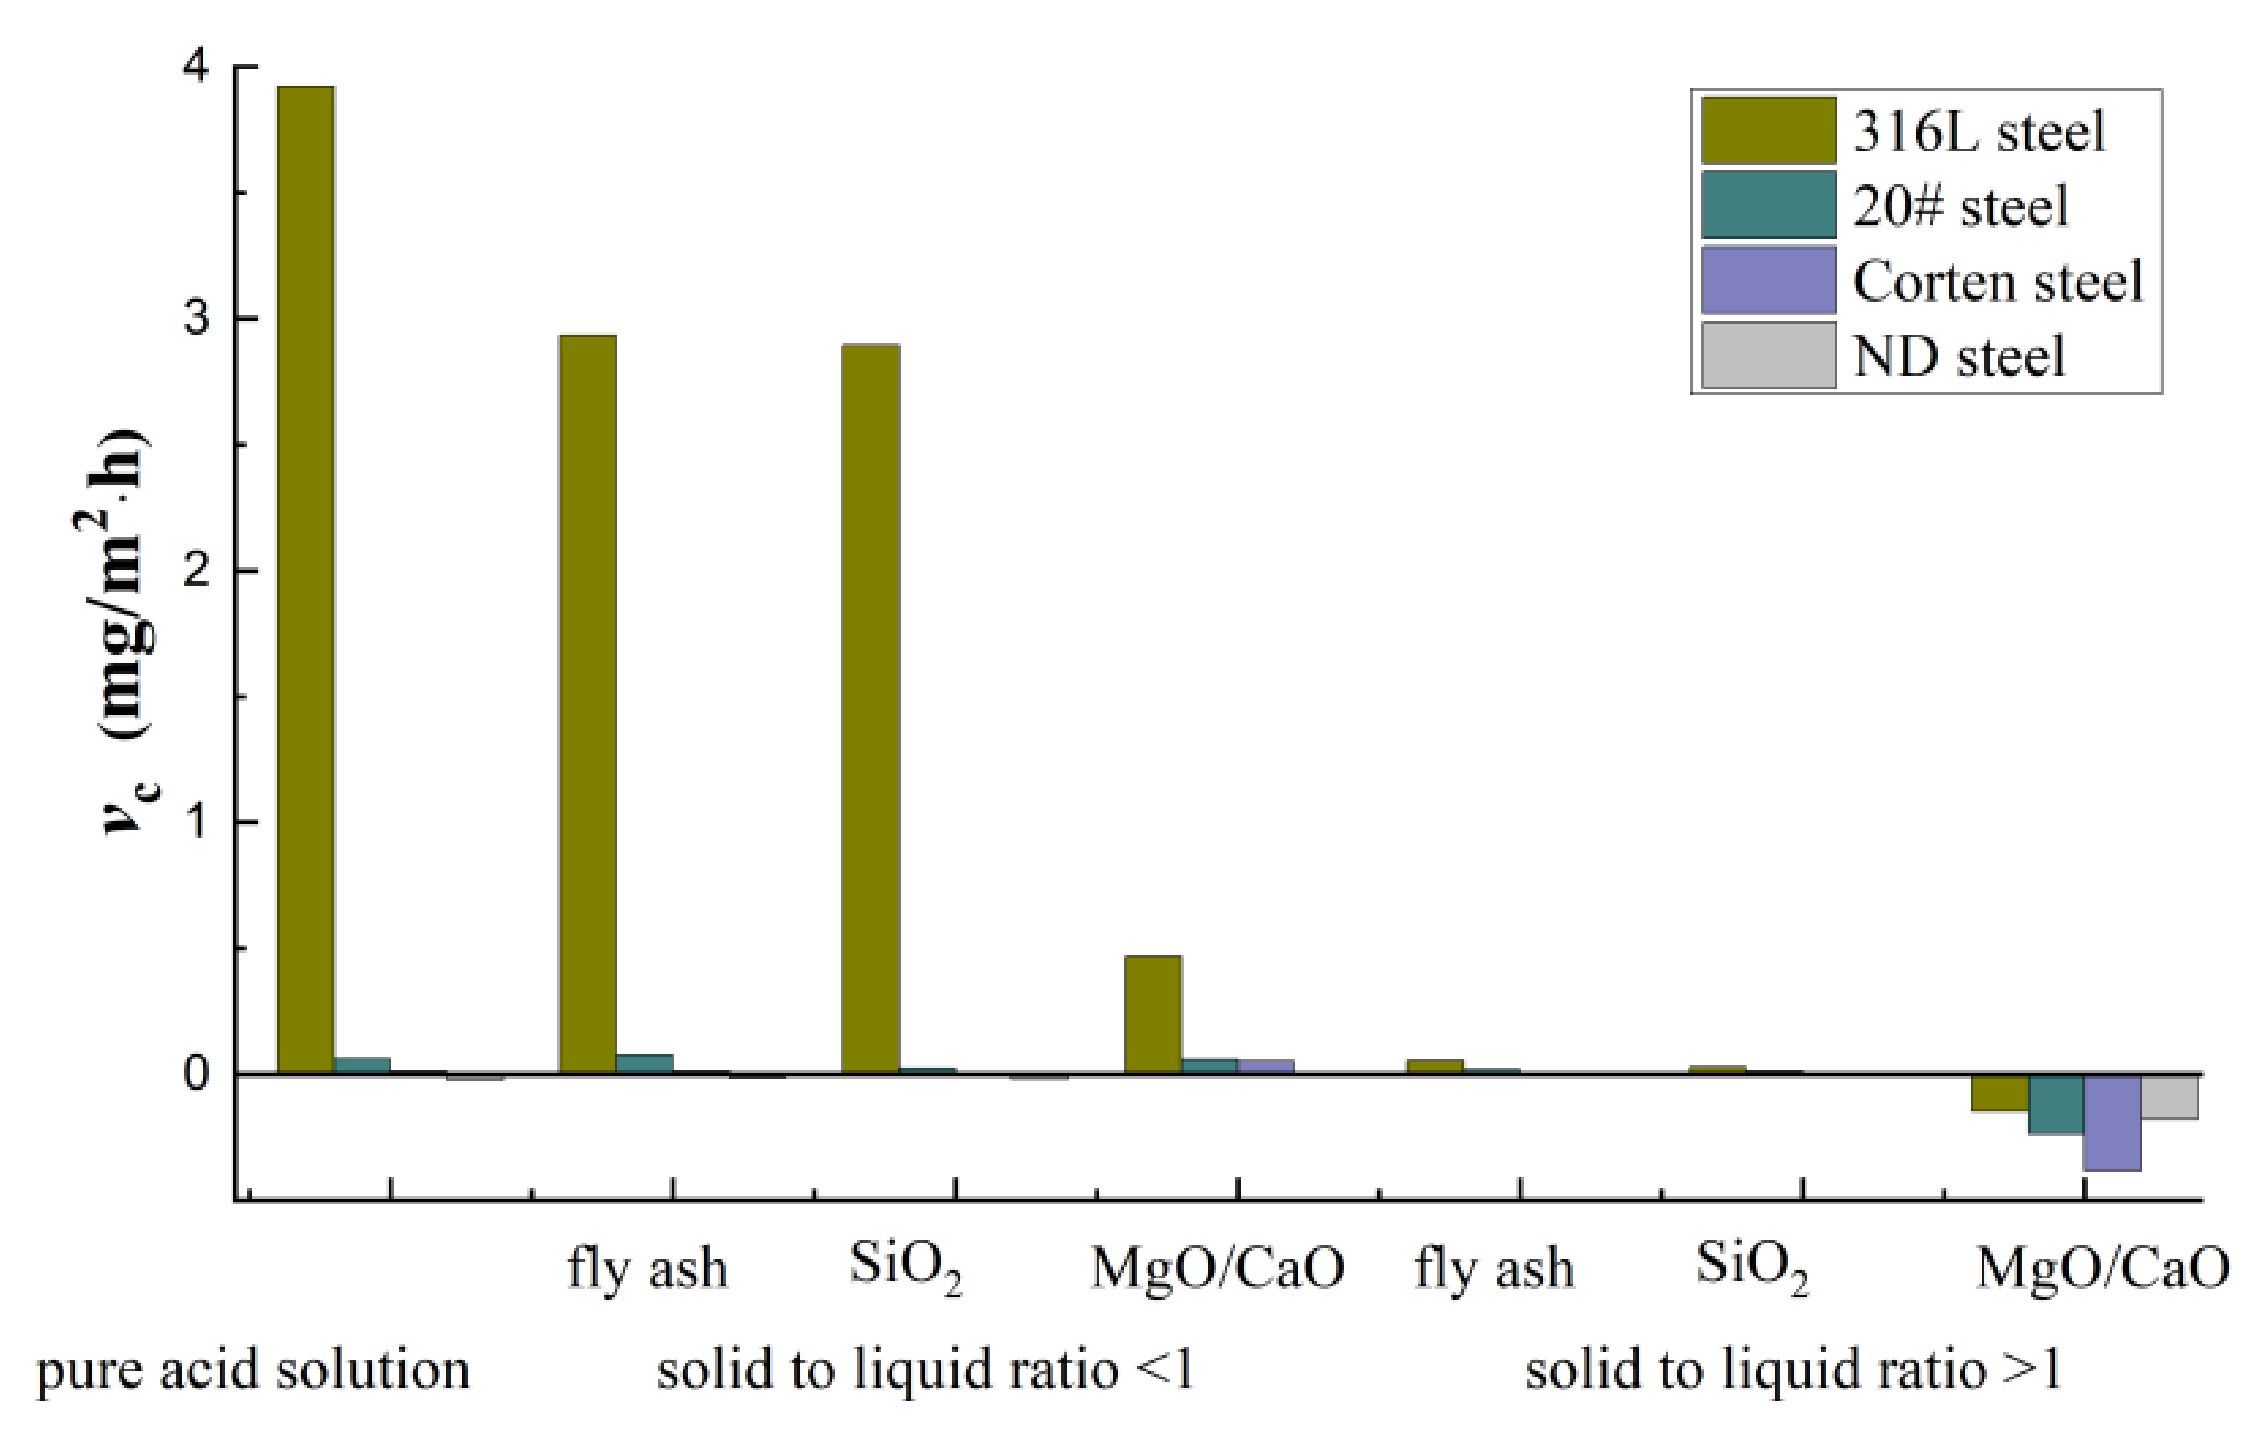
3.2.1. Corrosion Rates of Different Materials Considering Different Reaction Products

As indicated by the field experiments, the viscous fouling layer and low-temperature corrosion tended to occur on an 80 °C heating surface with a 60% H2SO4 solution. Therefore, the corrosion rates of ND steel, Corten steel, 316L steel and 20# carbon steel were recorded after they separately reacted with the 60% H2SO4 solution and three different types of particles, including SiO2 particles, MgO/CaO particles and fly ash particles. The results were obtained under conditions of “pure acid solution”, “solid-to-liquid ratio < 1”, and “solid-to-liquid ratio > 1” in Figure 7. Obviously, the corrosion rate of 316L steel was the highest under the pure acid condition [34], while the other three stayed at a low corrosive rate. This could be well explained by the dense and tight attachment to the steel surface, as seen in the microtopography of reacted steels in Figure 8, Figure 9, Figure 10, Figure 11 and Figure 12. It was also consistent with the results of the analysis of the innermost dense layer of viscous ash deposits collected from the field experiment [21].
Compared with the condition of “solid-to-liquid ratio > 1”, the corrosion rates under the condition of “solid-to-liquid ratio < 1” were much higher, while the corrosion rates under pure acid condition without particles were the highest. This agrees with the results of the fouling layer and low-temperature corrosion from field experiments. The transformation from dry loose ash to viscosity ash was vital for drastic reduction of the heat transfer efficiency and low-temperature corrosion [16,17,19,21,22,23,35,36]. When the reaction happened under a condition of “solid-to-liquid ratio > 1”, much denser or tighter attachments to the steel surface were found: the higher the alkaline fraction, the much denser the attachments to the steel surface. Especially for the reactions between the acid solution and MgO/CaO particles, the corrosion rates for tested metals were negative. This is because the attachments were hardly washed. This dense attachment prevented acid to penetrate into the metal surface, creating corrosion resistance on the metal surface. The results for ash particles are similar with those for SiO2 particles, because of the limited alkaline oxides in the ash particles. For the tested steel with significant corrosion, it was driven by the acid solution permeation through the ash particles: the higher the fraction of alkaline in ash particles, the denser the attachments to the steel surface, and the lower the corrosion rate of the metal steel.

3.2.2. Effects of Acid–Ash Reaction Products on Metal Corrosion

The mechanism of metal corrosion changes under different H2SO4 solution concentrations. For a H2SO4 solution of higher concentration, the oxidizing is dominant, leaving a passivated metal surface without obvious corrosion, while for the H2SO4 solution of lower concentration, the corrosion rate is related to the concentration [37]. In addition, the ash particles deposited on the metal surface would react with the condensed acid solution as well, lowering the reacting chance of acid solution with the metal surface. It not only mitigates the acid corrosion, but also promotes the formation of a dense ash layer by attaching the acid–ash reaction products to the metal surface. To understand the effect of acid–ash reactions on metal corrosion, the lab experiments of low-temperature corrosion were conducted with different H2SO4 solution concentrations. The SEM images of reacted steels are presented in Figure 8, Figure 9, Figure 10, Figure 11 and Figure 12 when the ash particles reacted with the H2SO4 solution of different concentrations (80%, 70%, 60%, 56% and 45%). For the reaction between ash particles and 80% H2SO4 solution, the attachment on steels is rare. The attachments on steels via an acid–ash reaction with both 70% and 60% H2SO4 solution were similar and were formed by the agglomeration of small particles and the spherical shape of large particles. For the acid–ash reaction with 56% H2SO4 solution, the attachment mainly consisted of ash particles with destroyed appearances stacked on the steel surface. For the acid–ash reaction with 45% H2SO4 solution, the attachment was bumpy and was basically a cotton-shaped aggregate, not spherical shaped. This proves that the lower the H2SO4 solution concentration, the easier the dissolved and deformed particles can bond together with the steel surface. This is also in line with the analysis of the innermost dense layer of viscous ash deposits collected from the field experiments [21].

3.3. Theory of Screening Laboratory Tests

Most findings by the lab experiments are consistent with those of the field experiments, except for the S content in reacted ash particles, which was much higher than what was collected from the field experiments. The amount of H2SO4 solution reacted with ash particles in the lab experiments was more than that of the condensed acid solution in field experiments. This finding indicates that the acid–ash reaction or corrosion in practice was milder than that of the lab experiment. As determined in [22], the sulfuric acid was condensed around the superfine ash particles first, causing these ash particles to dissolve and be sticky. These sticky ash particles can serve as an “adhesion agent”, bonding other ash particles with various sizes/shapes to form agglomerates. In this way, the fouling layer in practice contains many ash particles bonded by reacted sticky ash particles without a reaction with the acid solution.
The corrosion behavior of steel materials can be quickly tested via screening laboratory tests with excessive acid–ash reaction products covering steel surfaces. The results of the lab experiments can qualitatively explain the effects of acid–ash reactions on the fouling layer and low-temperature corrosion. To conclude, the condensed acid solution reacts with the ash particles deposited on the heating surface when the temperature is lower than the acid dew point. When the amount of condensed acid solution exceeds the reaction amount of the ash deposition, further low-temperature corrosion occurs between the viscous fouling layer and the metal surface. Meanwhile, much denser adhesives can be formed by the reaction of alkaline oxides in deposited ash particles with condensed acid solution on metal surfaces, which brings the corrosion resistance.

4. Conclusions

A fast prediction method for steel materials in corrosive conditions, as is usually the case in the boiler’s cold-end, was conducted in lab experiments. The reaction mechanism between representative particles and H2SO4 solution of different concentrations were illustrated by values of pH, conductivity, SO42- mass fraction, SEM–EDS, XRD and XRF. Simultaneously, in order to explore the effects of the viscous fouling layer on low-temperature corrosion, several selected materials including 316L steel, 20# carbon steel, Corten steel and ND steel were used. The extent of corrosion was reduced, with particles changing from MgO/CaO particles to fly ash particles and finally to SiO2 particles. Besides, the corrosion of the tested steel was mainly caused by the acid solution permeating through the particles. Meanwhile, the more alkaline oxides contained in the deposited ash particles, the deeper the acid–ash reaction, and the much denser the attachment covering the steel surface.

Author Contributions

Conceptualization, W.W., B.Z. and S.C.; methodology, W.W. and H.Y.; software, W.W. and C.G.; validation, H.Y. and G.L.; formal analysis, W.W. and X.Z.; investigation, W.W. and H.Y.; resources, G.L. and X.Z.; data curation, W.W. and C.G.; writing—original draft preparation, W.W.; writing—review and editing, W.W. and B.Z.; visualization, X.Z.; supervision, S.C.; project administration, W. W. and B.Z.; funding acquisition, B.Z. All authors have read and agreed to the published version of the manuscript.

Funding

This research was funded by Qilu University of Technology (Shandong Academy of Sciences) Young Doctors Cooperative Fund [No. 2019BSHZ022], Natural Science Foundation of Shandong Province [ZR2020QE210], Natural Science Foundation of Shandong Province [NO. ZR2021QE066] and Natural Science Foundation of Shandong Province [ZR2021QE055].

Data Availability Statement

The data that supports the findings of this study are available within the article.

Acknowledgments

The authors would like to sincerely appreciate Peixin Dong for all valuable suggestions and proofreading.

Conflicts of Interest

The authors declare no conflict of interest.

References

  1. Smith, J.S.; Safferman, S.I.; Saffron, C.M. Development and application of a decision support tool for biomass co-firing in existing coal-fired power plants. J. Clean. Prod. 2019, 236, 117375. [Google Scholar] [CrossRef]
  2. Babcock, W.C. Steam: Its Generation and Use; Kessinger Publishing: Whitefish, MT, USA, 2005. [Google Scholar]
  3. Guo, H.; Fan, W.; Liu, Y.; Zhang, X.; Liu, S.; Wu, X.; Chen, J.; Liu, Z.; Wang, X.; Ma, R. Dynamic simulation on high-temperature corrosion behaviour of tube surface with fouling in utility boiler fired by high-chlorine coal. J. Energy Inst. 2021, 95, 120–131. [Google Scholar] [CrossRef]
  4. Song, G.; Qi, X.; Yang, S.; Yang, Z. Investigation of ash deposition and corrosion during circulating fluidized bed combustion of high-sodium, high-chlorine Xinjiang lignite. Fuel 2018, 214, 207–214. [Google Scholar] [CrossRef]
  5. Xiong, X.; Liu, X.; Tan, H.; Deng, S. Investigation on high temperature corrosion of water-cooled wall tubes at a 300 MW boiler. J. Energy Inst. 2020, 93, 377–386. [Google Scholar] [CrossRef]
  6. Skrifvars, B.J.; Westén-Karlsson, M.; Hupa, M.; Salmenoja, K. Corrosion of super-heater steel materials under alkali salt deposits. Part 2: SEM analyses of different steel materials. Corros. Sci. 2010, 52, 1011–1019. [Google Scholar] [CrossRef]
  7. Kinnunen, H.; Hedman, M.; Engblom, M.; Lindberg, D.; Uusitalo, M.; Enestam, S.; Yrjas, P. The influence of flue gas temperature on lead chloride induced high temperature corrosion. Fuel 2017, 196, 241–251. [Google Scholar] [CrossRef]
  8. Sadeghi, E.; Joshi, S. Chlorine-induced high-temperature corrosion and erosion-corrosion of HVAF and HVOF-sprayed amorphous Fe-based coatings. Surf. Coat. Technol. 2019, 371, 20–35. [Google Scholar] [CrossRef]
  9. Mahajan, S.; Chhibber, R. Hot corrosion studies of boiler steels exposed to different molten salt mixtures at 950 °C. Eng. Fail. Anal. 2019, 99, 210–224. [Google Scholar] [CrossRef]
  10. Abu-Warda, N.; López, A.; Pedraza, F.; Utrilla, M. Fireside corrosion on T24 steel pipes and HVOF NiCr coatings exposed to different salt mixtures. Corros. Sci. 2020, 173, 108747. [Google Scholar] [CrossRef]
  11. Fu, C.; Li, Y.; Wang, Y. Microstructure and corrosion resistance of ERNiCrMo-13 and NiCrBSi coatings in simulated coal-fired boiler conditions: The effect of fly-ash composition. Surf. Coat. Technol. 2020, 399, 126134. [Google Scholar] [CrossRef]
  12. Li, M.-J.; Tang, S.-Z.; Wang, F.-L.; Zhao, Q.-X.; Tao, W.-Q. Gas-side fouling, erosion and corrosion of heat exchangers for middle/low temperature waste heat utilization: A review on simulation and experiment. Appl. Therm. Eng. 2017, 126, 737–761. [Google Scholar] [CrossRef]
  13. Wang, F.; Tang, S.; Tao, W.; He, Y.; Zhao, Q. Gas-side fouling, erosion and corrosion of heat exchanger for middle and low temperature flue gas waste heat recovery. Chin. Sci. Bull. 2016, 61, 1858–1876. [Google Scholar] [CrossRef] [Green Version]
  14. Wang, Y.-G.; Zhao, Q.-X.; Zhang, Z.-X.; Tao, W.-Q. Mechanism research on coupling effect between dew point corrosion and ash deposition. Appl. Therm. Eng. 2013, 54, 102–110. [Google Scholar] [CrossRef]
  15. Chen, H.; Pan, P.; Jiao, J.; Wang, Y.; Zhao, Q. Low-temperature ash deposition and dewpoint corrosion of a coal-fired travelling grate boiler. Appl. Therm. Eng. 2017, 117, 752–761. [Google Scholar] [CrossRef]
  16. Chen, H.; Pan, P.; Wang, Y.; Zhao, Q. Field study on the corrosion and ash deposition of low-temperature heating surface in a large-scale coal-fired power plant. Fuel 2017, 208, 149–159. [Google Scholar] [CrossRef]
  17. Chen, H.; Pan, P.; Shao, H.; Wang, Y.; Zhao, Q. Corrosion and viscous ash deposition of a rotary air preheater in a coal-fired power plant. Appl. Therm. Eng. 2017, 113, 373–385. [Google Scholar] [CrossRef]
  18. Pan, P.; Chen, H.; Liang, Z.; Zhao, Q. Desulfurized flue gas corrosion coupled with deposits in a heating boiler. Corros. Sci. 2018, 131, 126–136. [Google Scholar] [CrossRef]
  19. Pan, P.; Chen, H.; Liang, Z.; Zhao, Q. Deposition and corrosion characteristics of liquid-solid droplets on tubular corrosion probes in desulfurized flue gas. Eng. Fail. Anal. 2018, 90, 129–140. [Google Scholar] [CrossRef]
  20. Pan, P.; Chen, H.; Liang, Z.; Zhao, Q. Experimental study on corrosion of steels for flue gas reheaters in a coal-fired power plant. Appl. Therm. Eng. 2017, 115, 267–279. [Google Scholar] [CrossRef]
  21. Wei, W.; Cheng, S.; Sun, F. Research on formation mechanism of typical low-temperature fouling layers in coal-fired boilers. Fuel 2019, 261, 116215. [Google Scholar] [CrossRef]
  22. Wei, W.; Sun, F.; Ma, L. Effect of fine ash particles on formation mechanism of fouling covering heat exchangers in coal-fired power plants. Appl. Therm. Eng. 2018, 142, 269–277. [Google Scholar] [CrossRef]
  23. Wei, W.; Sun, F.; Shi, Y.; Ma, L. Experimental research of fouling layer and prediction of acid condensation outside heat exchanger used in coal-fired boiler. Appl. Therm. Eng. 2018, 131, 486–496. [Google Scholar] [CrossRef]
  24. Shimogori, M.; Mine, T.; Ohyatsu, N.; Takarayama, N.; Matsumura, Y. Effects of fine ash particles and alkali metals on ash deposition characteristics at the initial stage of ash deposition determined in 1.5MWth pilot plant tests. Fuel 2012, 97, 233–240. [Google Scholar] [CrossRef]
  25. Henry, C.; Minier, J.-P.; Lefèvre, G. Towards a description of particulate fouling: From single particle deposition to clogging. Adv. Colloid Interface Sci. 2012, 185–186, 34–76. [Google Scholar] [CrossRef]
  26. Wang, Y.; Hu, C.; Hui, S.; Zhao, Q.; Zhou, Q. Deposition of Cement Kiln Ash on the Tubes of Waste Heat Recovery Boiler. In Proceedings of the 2011 Asia-Pacific Power and Energy Engineering Conference, Wuhan, China, 25–28 March 2011; IEEE: Piscataway, NJ, USA, 2011; pp. 1–4. [Google Scholar]
  27. Wang, F.-L.; He, Y.-L.; Tong, Z.-X.; Tang, S.-Z. Real-time fouling characteristics of a typical heat exchanger used in the waste heat recovery systems. Int. J. Heat Mass Transf. 2017, 104, 774–786. [Google Scholar] [CrossRef]
  28. Han, H.; He, Y.-L.; Tao, W.-Q.; Li, Y. A parameter study of tube bundle heat exchangers for fouling rate reduction. Int. J. Heat Mass Transf. 2014, 72, 210–221. [Google Scholar] [CrossRef]
  29. Wei, W.; Sun, F.; Shi, Y.; Ma, L. Theoretical prediction of acid dew point and safe operating temperature of heat exchangers for coal-fired power plants. Appl. Therm. Eng. 2017, 123, 782–790. [Google Scholar] [CrossRef]
  30. Wang, Y.; Tang, G. Numerical investigation on the coupling of ash deposition and acid vapor condensation on the H-type fin tube bank. Appl. Therm. Eng. 2018, 139, 524–534. [Google Scholar] [CrossRef]
  31. Qin, K.; Fan, J.; Chi, Z.; Shen, L. Boiler and Heat Exchanger Fouling, Slagging, Abrasion and Corrosion Prevention Principles and Calculation; Science Press: Beijing, China, 1994. (In Chinese) [Google Scholar]
  32. Wang, Y.; Tan, H.; Dong, K.; Liu, H.; Xiao, J.; Zhang, J. Study of ash fouling on the blade of induced fan in a 330 MW coal-fired power plant with ultra-low pollutant emission. Appl. Therm. Eng. 2017, 118, 283–291. [Google Scholar] [CrossRef]
  33. Vuthaluru, H.B.; French, D.H. Investigations into the air heater ash deposit formation in large scale pulverised coal fired boiler. Fuel 2015, 140, 27–33. [Google Scholar] [CrossRef] [Green Version]
  34. Zhou, A. Experimental Study on the Coupling Mechanism between Dew Pint Corrosion and Ash Deposition of the Low-Temperature Heat Exchagner System; Zhejiang University: Zhejiang, China, 2015. [Google Scholar]
  35. Chen, X.; Zhao, Q.; Liang, Z. Investigations on the Ash Deposit Formation of Tubular Air Preheater in a Coal-Fired Traveling Grate Boiler. Energy Fuels 2017, 31, 13215–13220. [Google Scholar] [CrossRef]
  36. Liang, Z.Y.; Zhao, Q.X.; Wang, Y.G.; Li, Y.X.; Zhang, Z.C. Coupling mechanism of dew point corrosion and viscous ash deposits. Mater. Corros. 2013, 65, 797–802. [Google Scholar] [CrossRef]
  37. Feng, J.; Shen, Y.; Yang, R. Principle and Calculation of Boiler[M]; Science Press: Beijing, China, 2003. (In Chinese) [Google Scholar]
Figure 1. Metal samples prepared for lab experiments (a): Corton steel; (b): 316L steel; (c): 20# stee; (d): ND steel.
Processes 10 00241 g001
Figure 2. Metal samples after typical reactions of H2SO4 solution with different particles (a): SiO2 particles; (b): fly ash particles; (c): MgO/CaO particles.
Processes 10 00241 g002
Figure 3. SEM images of original ash deposit samples (a) = 0.5 KX; (b) = 6 KX; (c) = 5 KX; )d) = 50 KX.
Processes 10 00241 g003aProcesses 10 00241 g003b
Figure 4. SEM images of ash deposit samples after reaction (a) = 0.5 KX; (b) = 2 KX; (c) = 15 KX; (d) = 50 KX.
Processes 10 00241 g004
Figure 5. Powder XRD patterns of original ash samples.
Processes 10 00241 g005
Figure 6. Powder XRD patterns of ash samples after reaction.
Processes 10 00241 g006
Figure 7. Corrosion rates of different steels after reacting with different particles.
Processes 10 00241 g007
Figure 8. SEM images of steel samples related to 80% H2SO4 solution (a) = 1 KX; (b) = 5 KX.
Processes 10 00241 g008
Figure 9. SEM images of steel sample related to 70% H2SO4 solution (a) = 1 KX; (b) = 10 KX.
Processes 10 00241 g009
Figure 10. SEM images of steel sample related to 60% H2SO4 solution (a) = 1 KX; (b) = 10 KX.
Processes 10 00241 g010
Figure 11. SEM images of steel sample related to 56% H2SO4 solution (a) = 1 KX; (b) = 10 KX.
Processes 10 00241 g011
Figure 12. SEM images of steel sample related to 45% H2SO4 solution (a) = 1 KX; (b) = 10 KX.
Processes 10 00241 g012
Table 1. pH values of reaction products of different H2SO4 solutions and particles.
Reaction ProductsSiO2 ParticlesFly Ash ParticlesMgo/Cao Particles
H2SO4 Concentration
80%2.342.697.26
70%2.382.959.15
60%2.483.099.39
56%2.583.29.63
45%2.713.579.91
Table 2. Conductivity values of reaction products of different H2SO4 solutions and particles (μS/cm).
Reaction ProductsSiO2 ParticlesFly Ash ParticlesMgo/Cao Particles
H2SO4 Concentration
80%21201015731
70%1811979652
60%1568811504
56%1153497399
45%931357341
Table 3. EDS analysis data of detected micro-zones of ash particles before and after reaction.
Ash SamplesAreaCONaMgAlSiSKCaTiFe
Original ash particles1-40.760.750.512.6838.59-2.36-0.673.71
20.7543.98--14.9928.23--5.275.061.71
3-56.251.1-8.2130.57-1.540.87-1.46
Reacted ash particles1-46.28-0.5114.9819.039.630.973.130.844.63
2-49.740.410.4611.1918.148.640.864.512.673.38
3-48.620.460.3912.9720.448.590.912.830.923.87
Note: three characteristic areas are selected from each ash sample in Figure 3 and Figure 4.
Table 4. XRF analysis results of ash samples before and after reaction.
Original Ash ParticlesReacted Ash Particles
Compoundm/m%Compoundm/m%
SiO244.04SiO237.02
Al2O341.66Al2O333.48
Fe2O33.85SO319.23
CaO3.78Fe2O33.83
MgO1.98CaO1.75
Na2O1.29MgO1.51
TiO21.11TiO21.13
SO30.94P2O50.95
K2O0.77K2O0.69
P2O50.26SrO0.11
SrO0.08ZrO20.07
V2O50.05Co3O40.05
Co3O40.05V2O50.05
ZrO20.05MnO0.03
MnO0.02Cr2O30.02
Publisher’s Note: MDPI stays neutral with regard to jurisdictional claims in published maps and institutional affiliations.

