3.1. Results of the Adsorbent Characterization
Particle apparent density of the porous adsorbent was determined according to the method proposed by Abrahamsen and Geldart (1980) and explained comprehensively in previous works [
35,
38]. In this case, siliceous sand of density
ρ = 2660 kg/m
3, used as a reference, was loaded into a graduated cylinder and compacted until a value of minimum voidage of 0.457. This value applied to three functionalized samples resulted in higher values of particle density, as indicated in
Table 1.
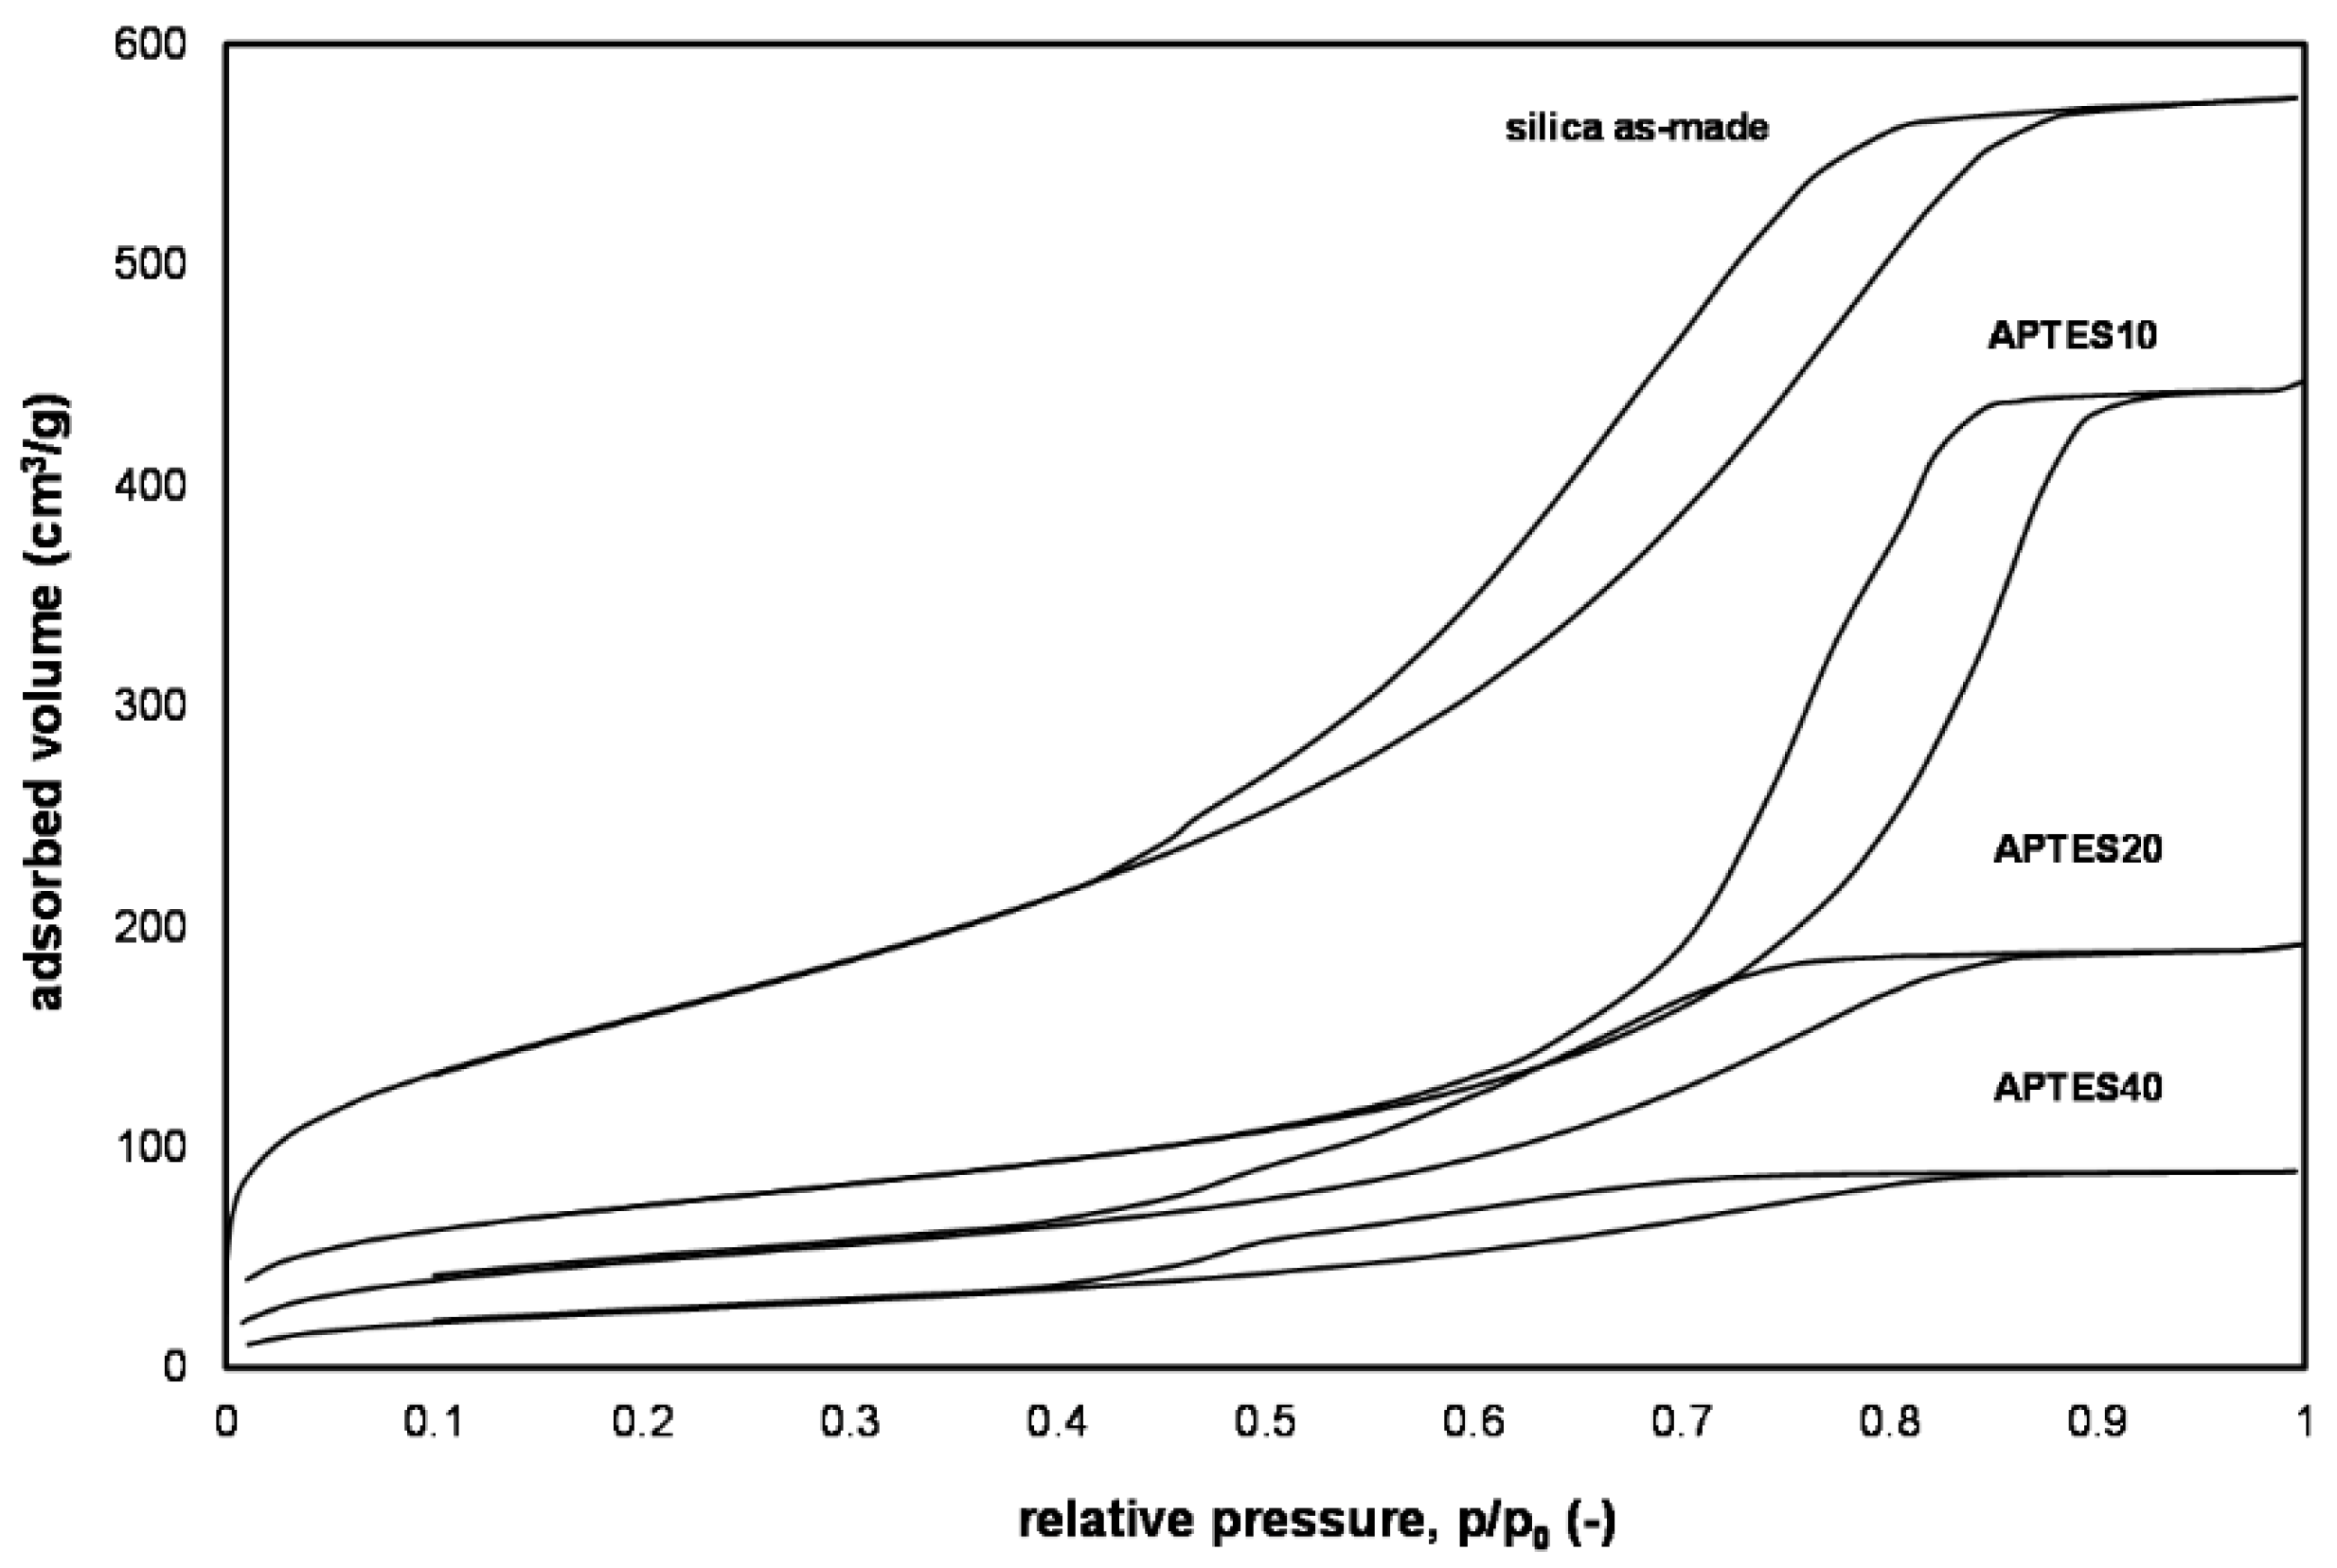
The N
2 adsorption/desorption isotherms at 77 K of as-made silica, APTES20, APTES40 [
35], and APTES10 (
Figure 2) are of type IV(a), according to the IUPAC classification [
39]. The as-made silica has a BET surface area of 584 m
2/g and a BJH pore volume of 0.89 cm
3/g (
Table 1), which make it an ideal support for grafting with APTES. The amount of adsorbed N
2 and the pore volume in functionalized samples (APTES10/20/40) decreased with the increase in the APTES concentrations used.
As-made silica showed a pore size distribution from 3 to 20 nm; instead, the mesopores of the functionalized samples progressively occluded at increasing concentrations of the APTES solution [
35].
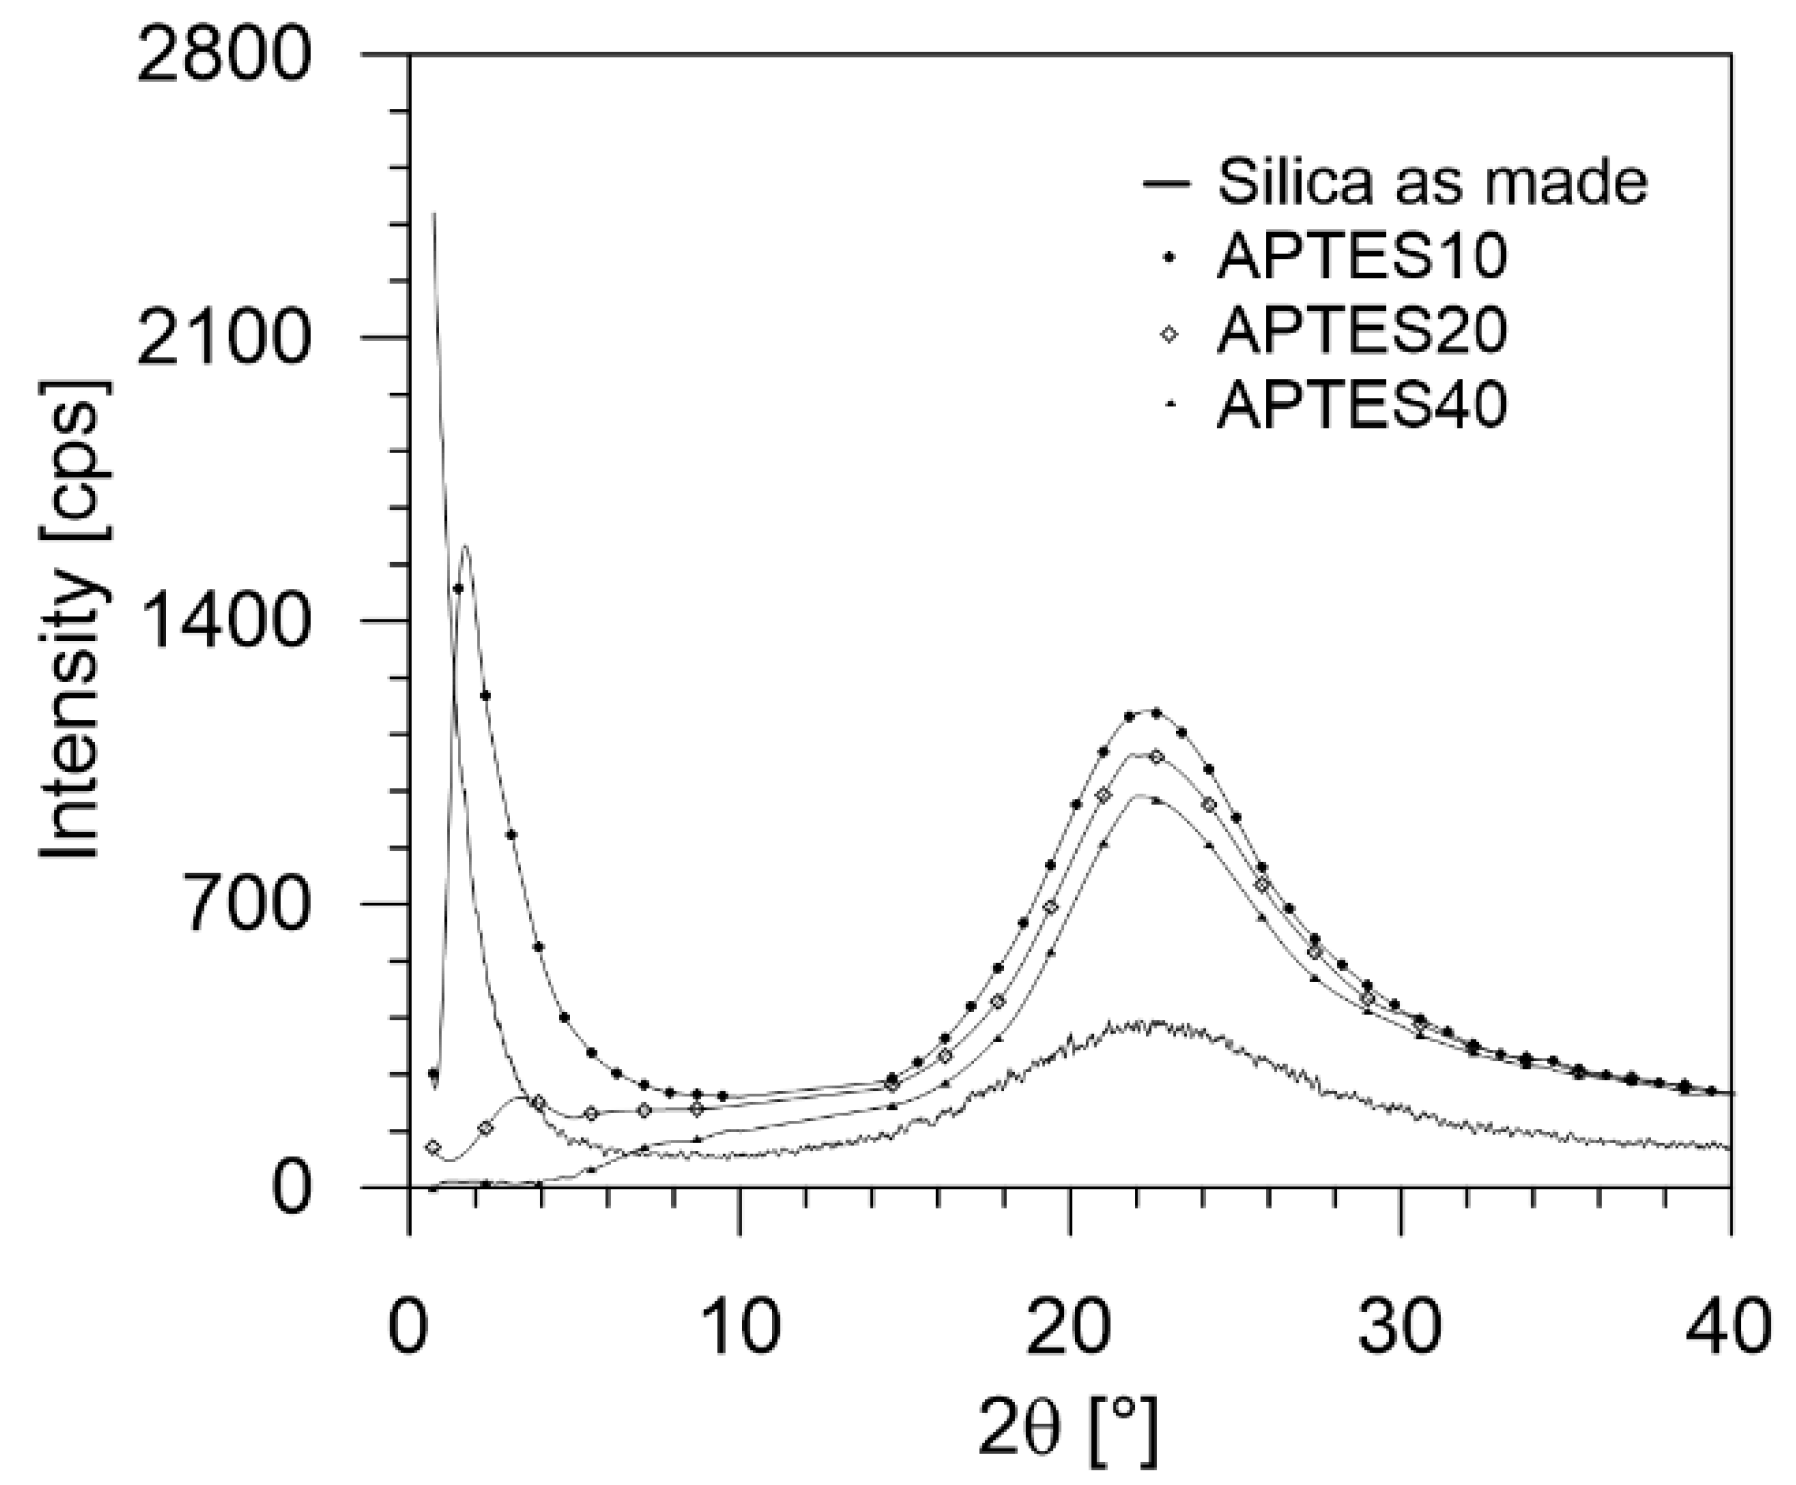
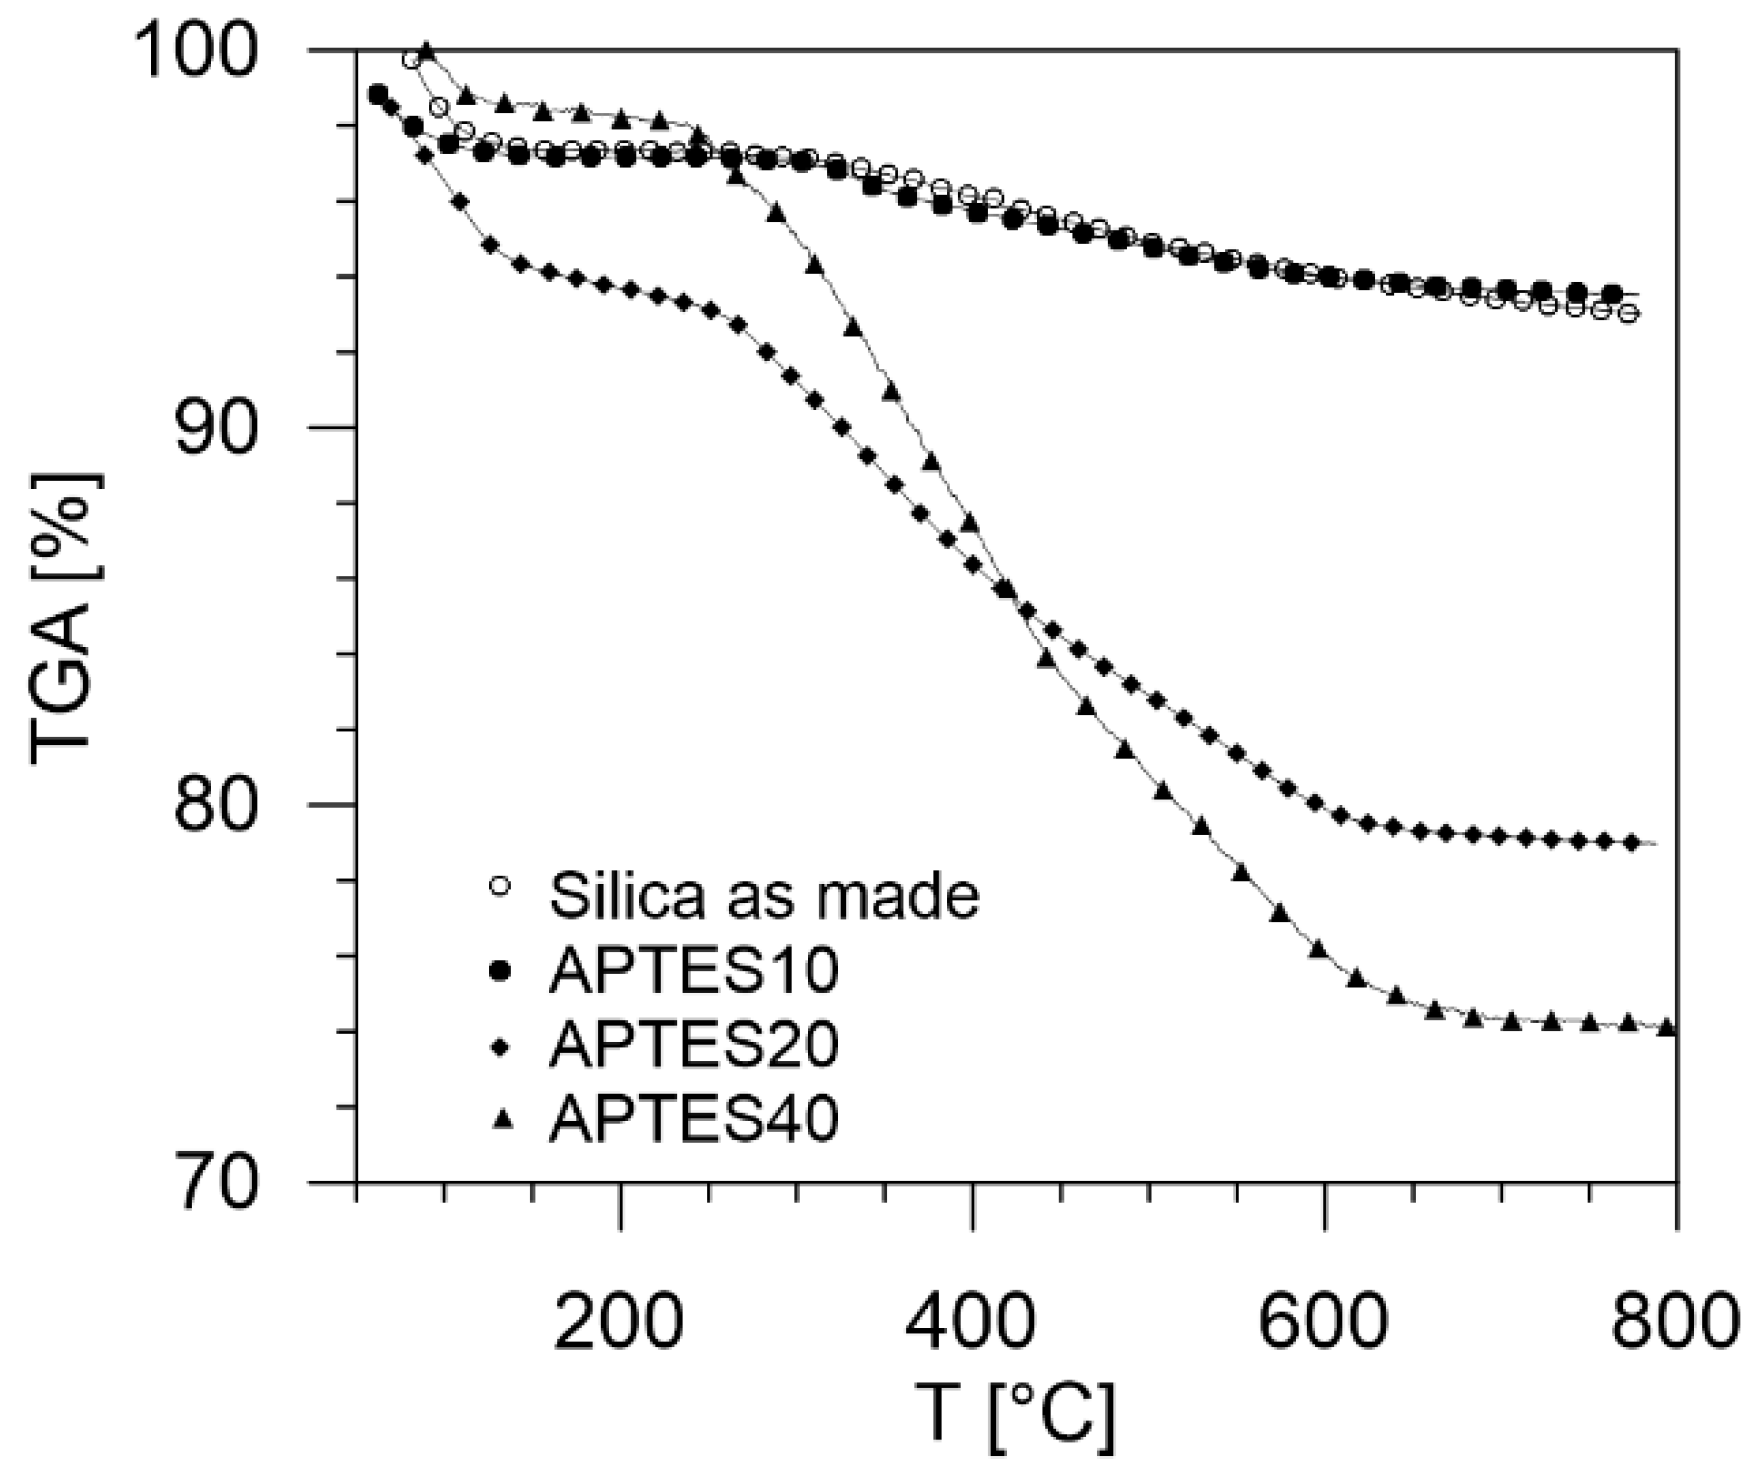
The XRD diagram and the TGA analysis, shown in
Figure 3 and
Figure 4, respectively, confirm this observation. APTES10 and APTES20 XRD spectra show a low angle peak due to the mesoscopic order of the silica support enhanced by the presence of the organosilica in the pores that increases the contrast with the amorphous silica (hump at angle 23 2θ). When APTES is absent or too concentrated, this effect is lost, and no peak at a low angle is found.
As-made silica underwent a limited mass loss up to 150 °C, attributed to the desorption of water. A similar pattern was observed for APTES10. It seems the APTES molecules are directly linked to the surface silica and, for this reason, stable up to 750 °C. On the contrary, APTES20 and APTES40 exhibited the main mass loss between ca 300 and 600 °C, due to the degradation of the organic moieties not interacting with the silica surface. From these data, it was possible to determine the amount of the organic moieties present in each sample, as reported in
Table 2.
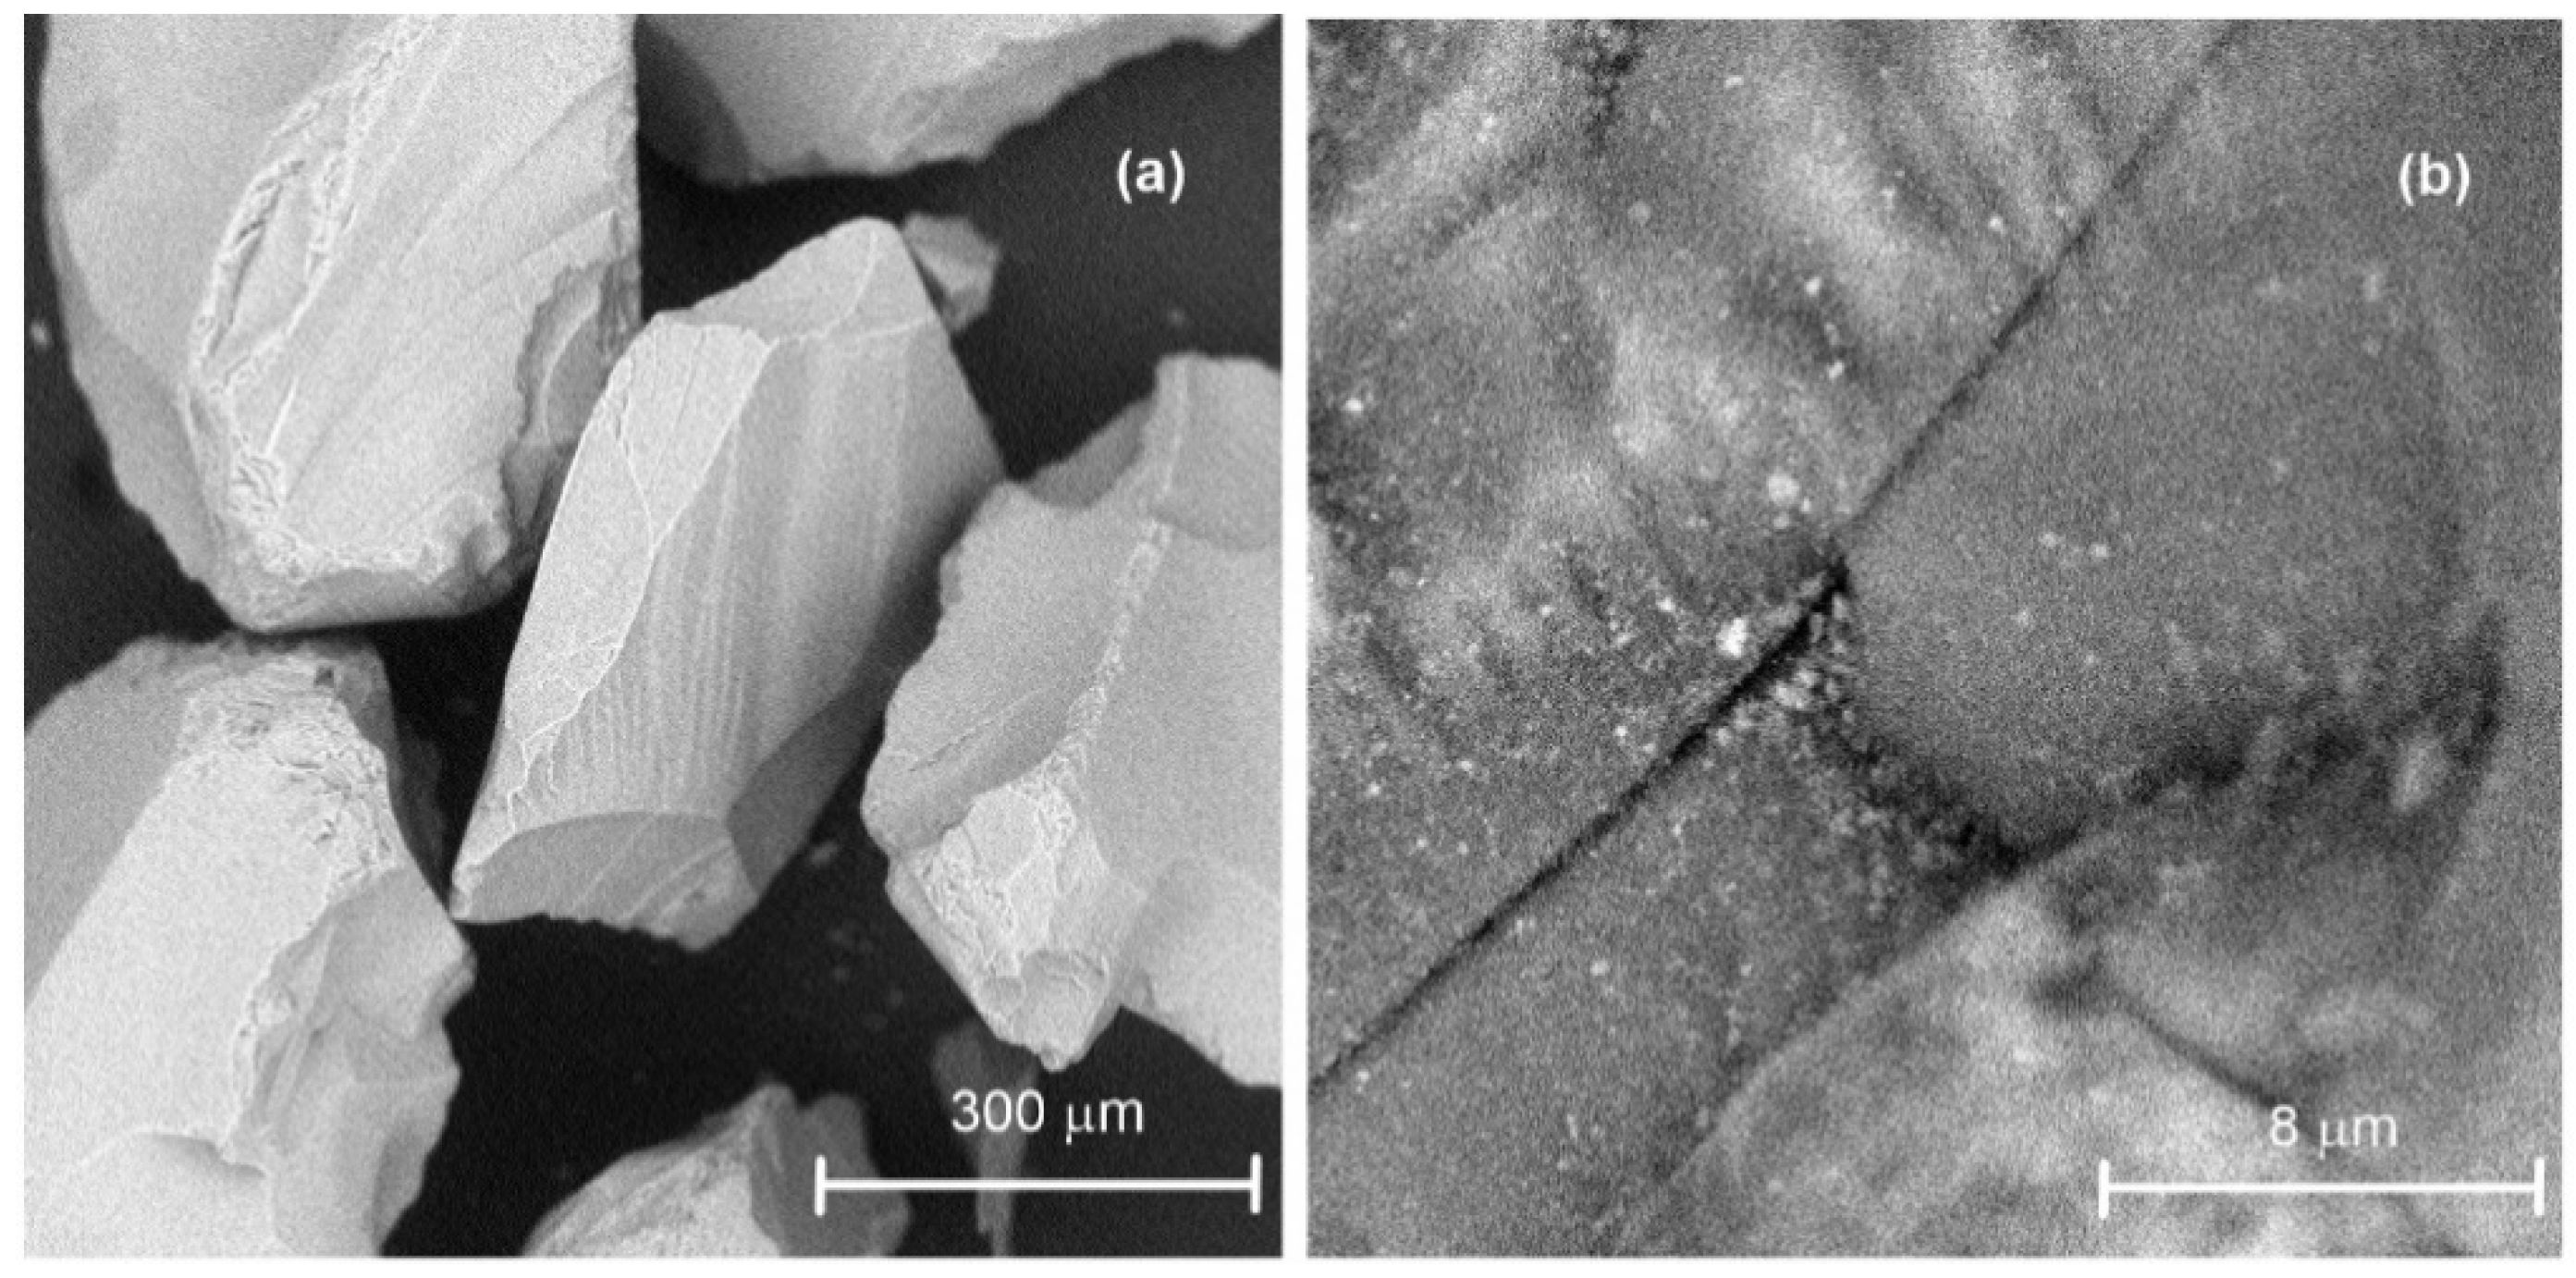
SEM micrographs of the APTES10 sample are also reported. APTES10 (
Figure 5a) particles are similar to the as-made analog (micrograph not reported), so not influenced by the grafting procedure. Higher magnification of the particles (
Figure 5b) highlights the presence of rare, small aggregates of aminated organosilica formed by hydrolysis and condensation of APTES.
A fluid-dynamic characterization was conducted both in a conventional layout, i.e., without packing, and in a confined one, with a packing of glass beads (
dp = 11 mm and
ρp = 2480 kg/m
3). The fluidization of the fine sorbent into the interstitial voidage (equal to
εp = 0.44) created by the packing avoids the occurrence of a bubbling regime and improves the efficiency of mass and heat exchange [
37,
40]. Since experimental investigation aimed to quantify how the suppression of the bubble phase improves the performance of the adsorption process, both types of experiments were carried out and compared. All tests were performed at ambient temperature and pressure.
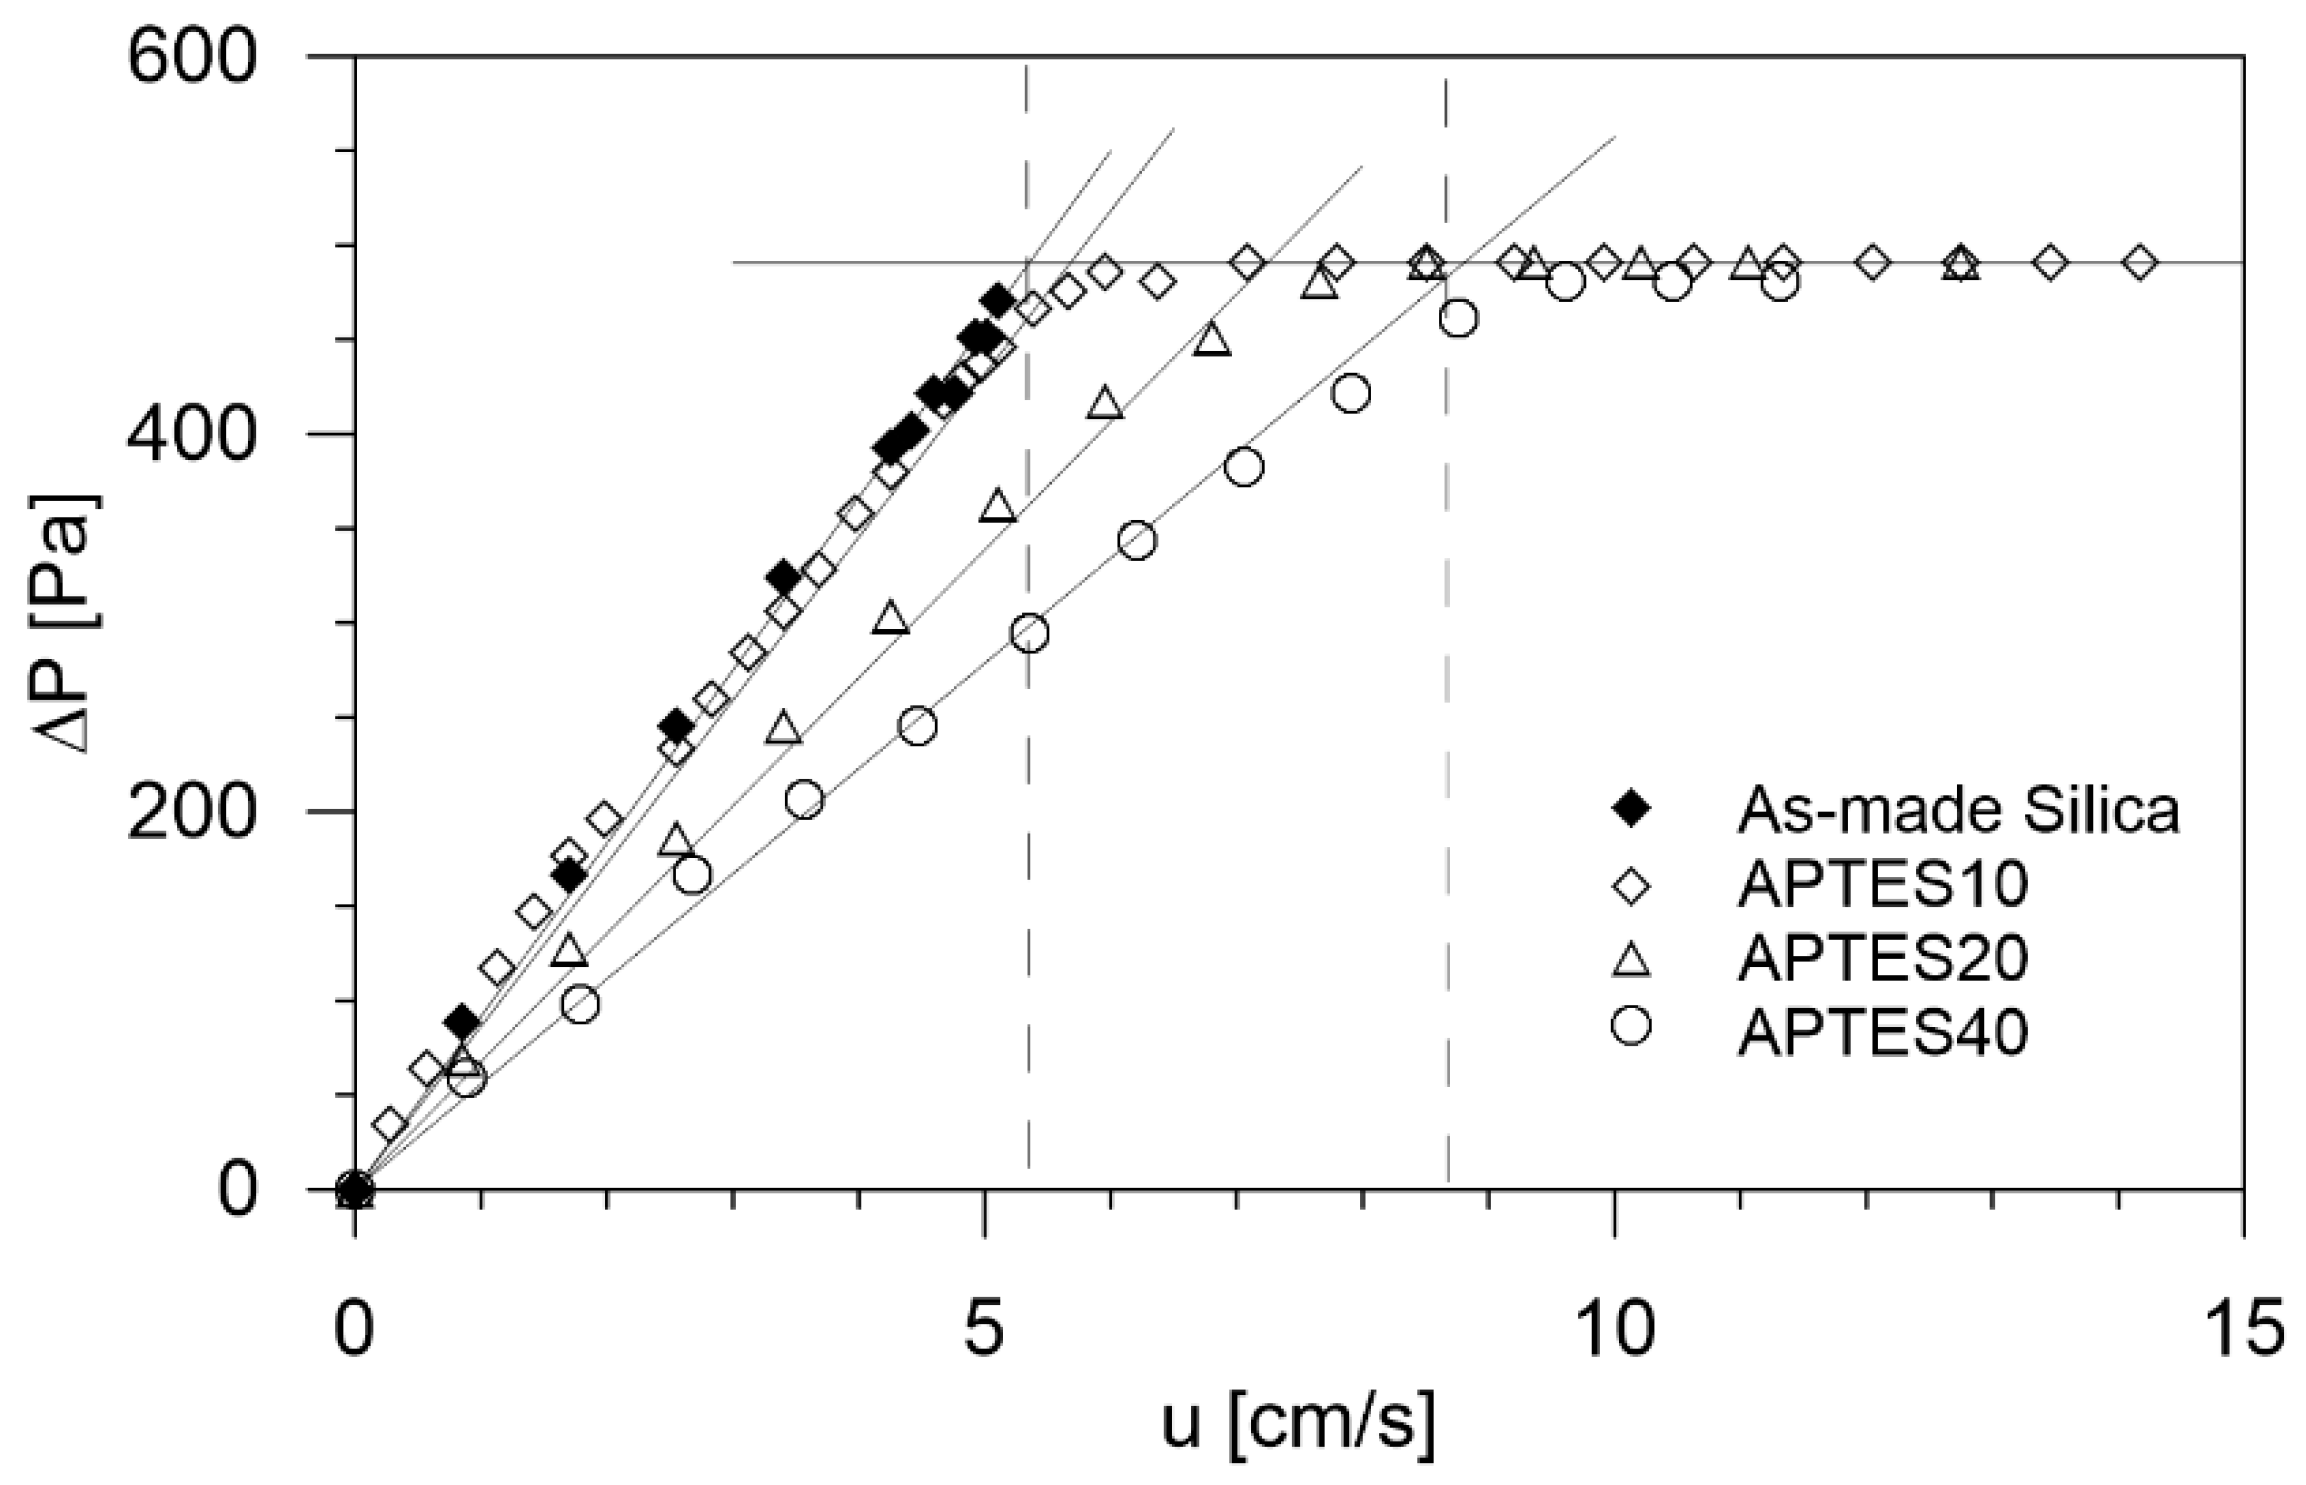
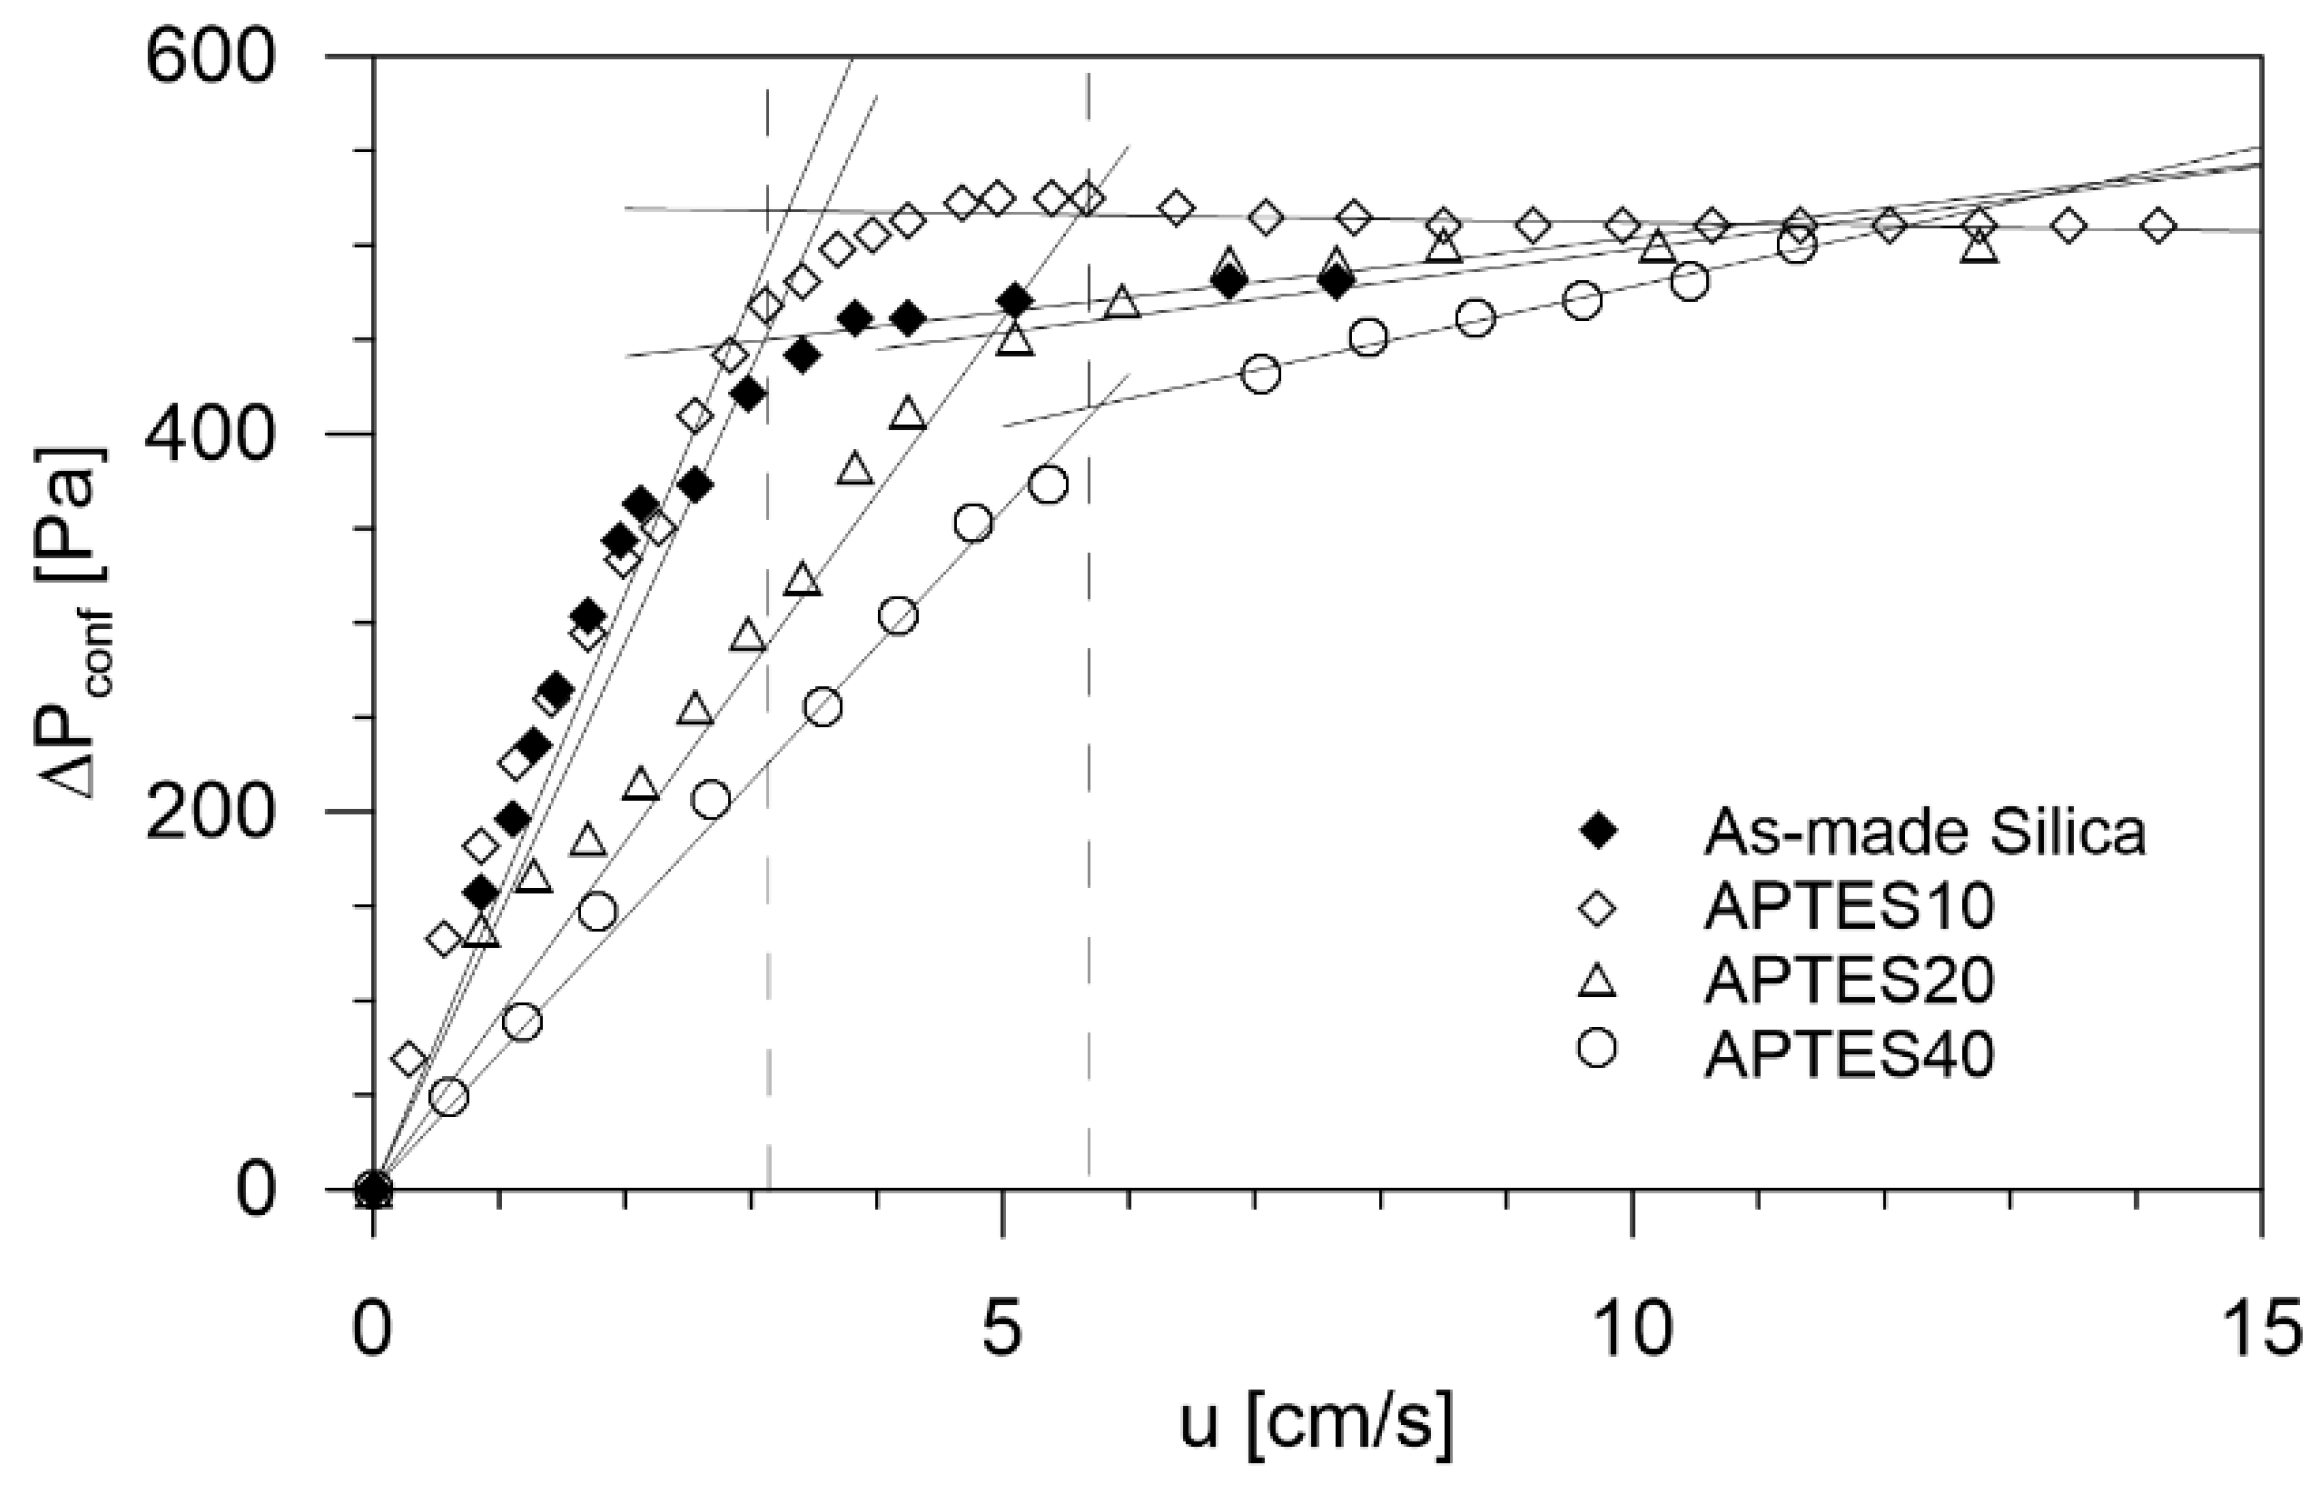
In a typical experiment of conventional fluidization, an amount of sorbent was loaded in the column and, after a complete fluidization-defluidization cycle, its height was measured to determine the bed voidage. Gas velocity was gradually increased, and the corresponding pressure drop was measured, resulting in the typical fluidization diagrams shown in
Figure 6. The characteristic fluidization velocities and corresponding voidage values were collected in
Table 3.
Different values of umf were obtained for the samples, from a minimum of 5.15 to a maximum of 8.63 cm/s, due to the change of particle density after functionalization and also to the different values of bed voidage. Probably, the effect of impregnation also changed the properties of the external surface, modifying the interparticle forces that rule the bulk voidage.
Concerning the confined fluidization experiments, as indicated in a previous study [
35], preliminarily, a packing of coarse spheres with a height of 450 mm was poured onto the column. Then, 100 g of the finer sorbent was loaded in the column and, after a complete fluidization-defluidization cycle, its height was measured. The bed voidage in the packed-fluidized bed and the fraction of volume available to the gas flow were calculated (
Table 4) according to the definitions reported in the previous article [
35].
The dependence of particle density by functionalization produced different values of
umfc also in the confined system tests, as shown in
Figure 7. The homogeneous expansion trends of
u/
εp versus
εfc were also determined (figure here not reported). Among the characteristic parameters (see
Table 4),
εfc and
u0 appear more constant, while the exponent n decreases for higher concentrations of APTES [
35].
The observed regular homogeneous expansion was described by a modified form of the Richardson and Zaki’s equation [
41], in which the exponent n and
u0 were calculated according to a method reported in a previous work [
42].
The effect of fluidization conditions in conventional and confined layouts during adsorption tests was explored, setting, first, the optimal superficial velocity of the gaseous mixture (CO2/air) fed to the column, taking into account the previously performed fluid-dynamic characterization.
For each of the two contact modes, various CO2 concentrations of the incoming stream were explored for the same amount of sorbent.
The breakthrough curves were obtained, measuring the CO2 concentration at the exit of the bed at prefixed times. In addition, the temperature was measured using a thermocouple inside the bed.
Once fixed the surface velocity, it was possible, knowing the column section, to calculate the flow rate of the inlet gaseous mixture:
From the total volumetric flow rate, it was possible to calculate the air and the CO
2 flow rates based on the volumetric concentration of CO
2 fixed in the various tests:
The contact time for this continuous process is defined as:
where
and
Qmix, the inlet flow rate of the mixture, is given by:
A differential balance in time was obtained on the column:
where
represented the amount of CO2 that accumulates on solid sorbent, , , , were respectively the inlet and outlet stream temperature and pressure of the column.
The pressure and temperature of the gas stream can be assumed constant. The volumetric flow rates change due to adsorption. Knowing the composition of CO
2 entering and leaving the column, the volumetric flow rates can be calculated as a function of the total gas flow rate:
It was possible to rearrange the balance equation in:
Finally, the integration provides the amount of CO
2 adsorbed as a function of the operating time of the process:
For each experiment, the gas velocity and the inlet concentration of CO2 were set. Considering the minimum fluidization velocity in a conventional environment, previously obtained for functionalized silica, two values were explored: 0.8umf for the fixed bed and 1.20umf for the bubbling bed. It is worth recalling that in a confined layout, sorbent was in the homogeneous expansion condition at these values of gas velocity.
3.2. Effect of the Concentration of APTES on Amino-Functionalized Silica
Before exploring the effect of the layout, a preliminary adsorption campaign was devoted to the analysis of the performance of the sorbent versus the concentration of APTES used for its functionalization. To this aim, a mixture with 12% of CO
2 was fed to a bed in the confined layout at
u = 4.4 cm/s for APTES10, like it was made at
u = 5.6 cm/s for APTES20 and at
u = 6.9 cm/s for APTES40, in a previous investigation [
35]. The intent of the test in confined fluidization was to analyze the adsorption process in the more favorable regime of homogeneous expansion of the adsorbent.
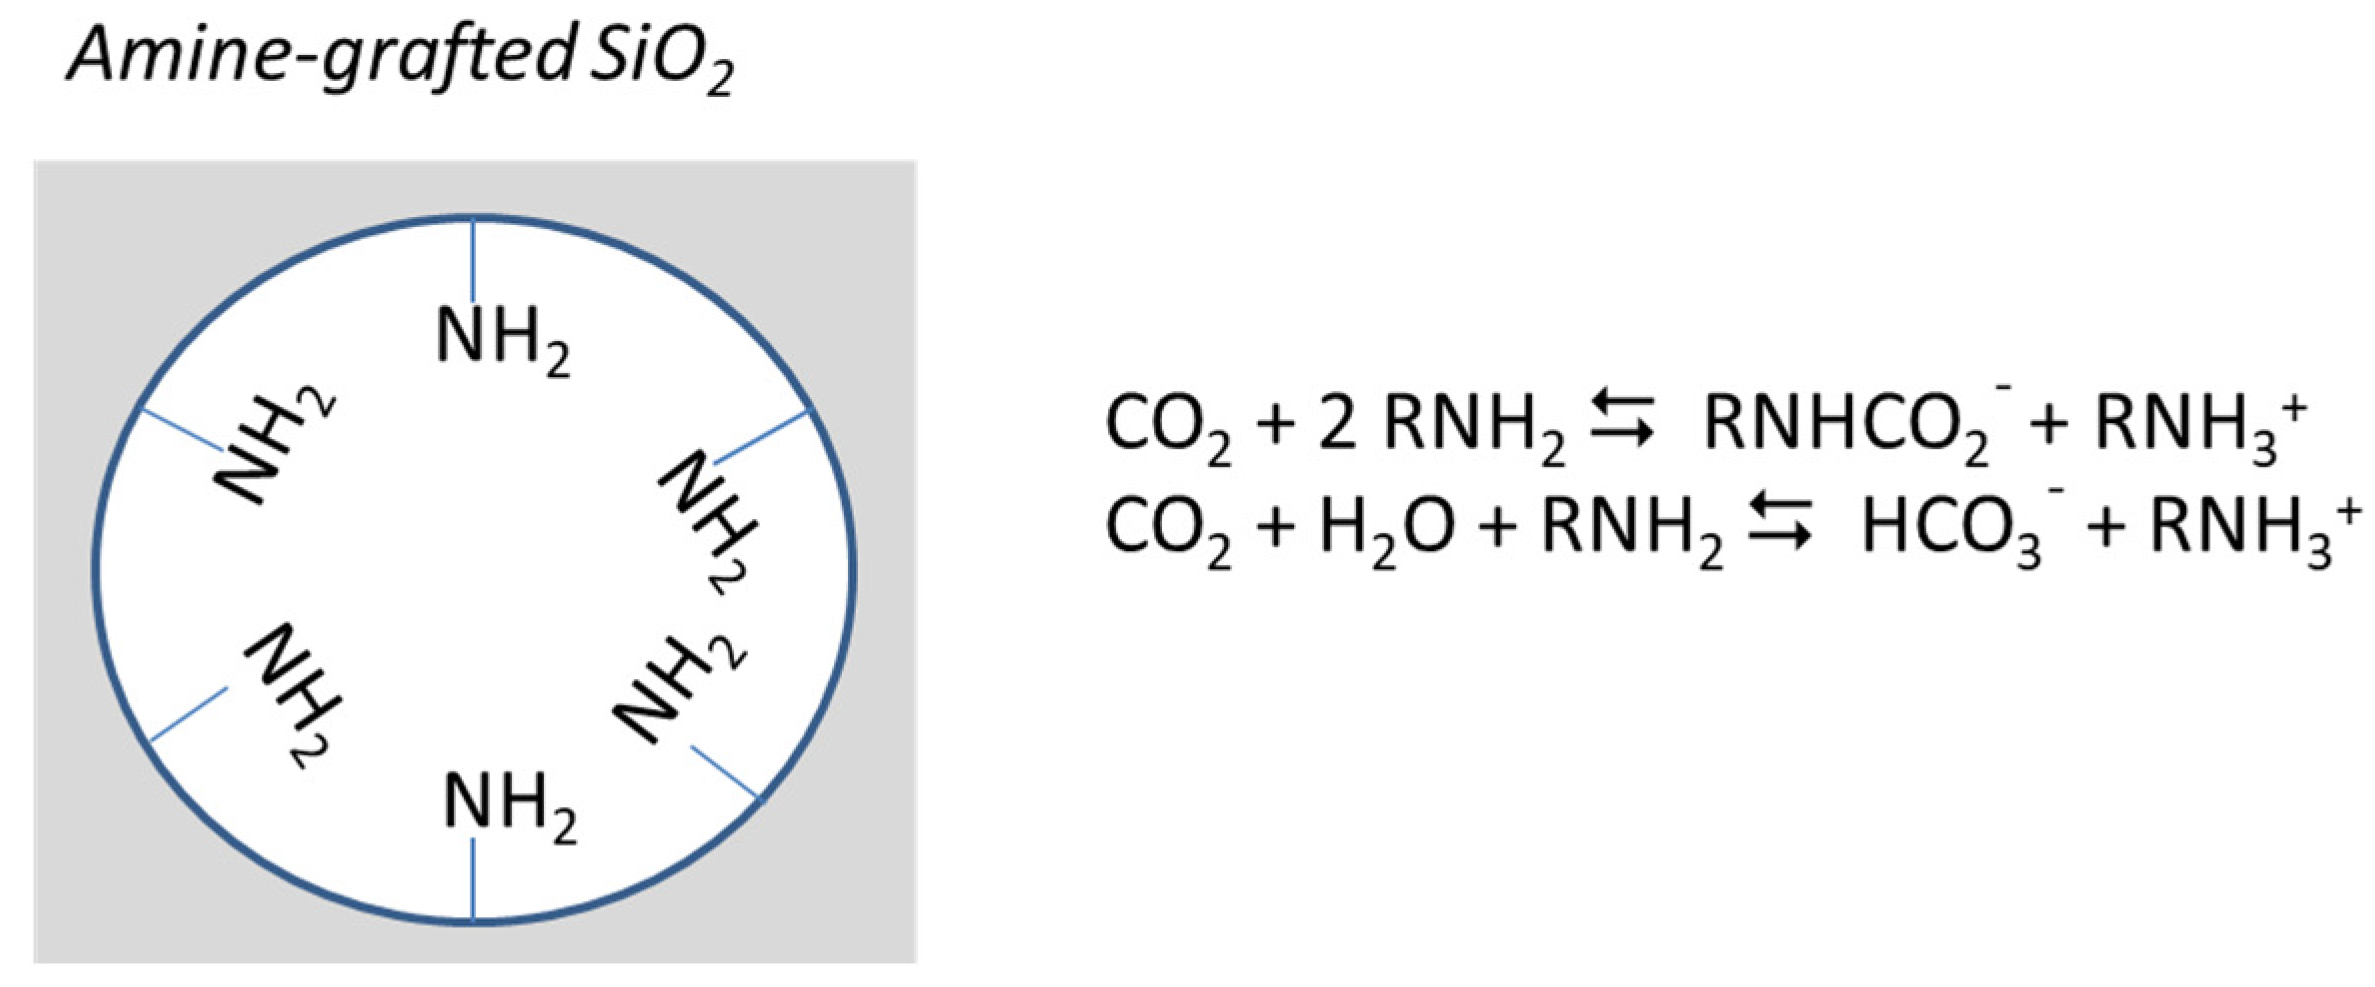
The comparison of the amount of CO
2 adsorbed,
m, and the bed fraction used,
W, (
Table 5) between silica and functionalized samples for a stream of 12% CO
2 shows as the presence of APTES had definitely improved the adsorption capacity.
The adsorption capacity, which was practically unchanged, passing from APTES40 to APTES20, decreased significantly for the APTES10 sample. Probably the 10% solution did not sufficiently modify the active sites able of capturing CO2. Although the amount of adsorbed CO2 was slightly higher for APTES40, this sample used a significantly lower bed fraction, indicating slow saturation kinetics and consequently insufficient use of the sorbent up to the breakpoint.
In fact, the breakthrough curves at the fixed concentration of CO
2 (12%) in
Figure 8 confirmed that: for a continuous process, the optimum was obtained with the APTES20 sample. The breakthrough curve had a higher time of breakpoint, indicating that this sorbent could capture CO
2 for a longer time during an industrial process. The saturation time was lower than the APTES40 sample time, suggesting that faster adsorption kinetics correlates with greater active surface availability.
For these reasons, dynamic adsorption tests were completed at several compositions of the inlet mixture only on the sample APTES20.
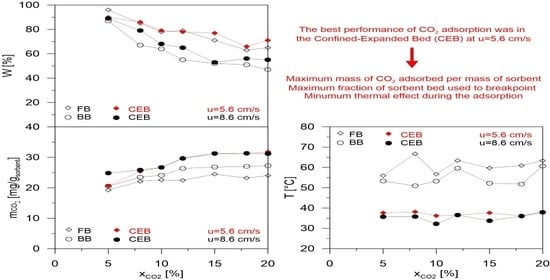
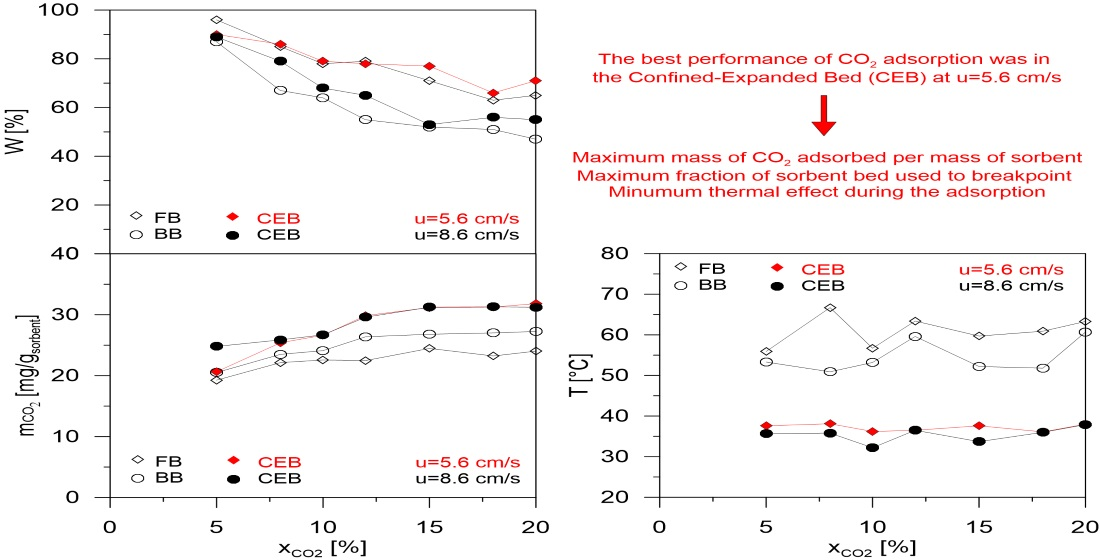
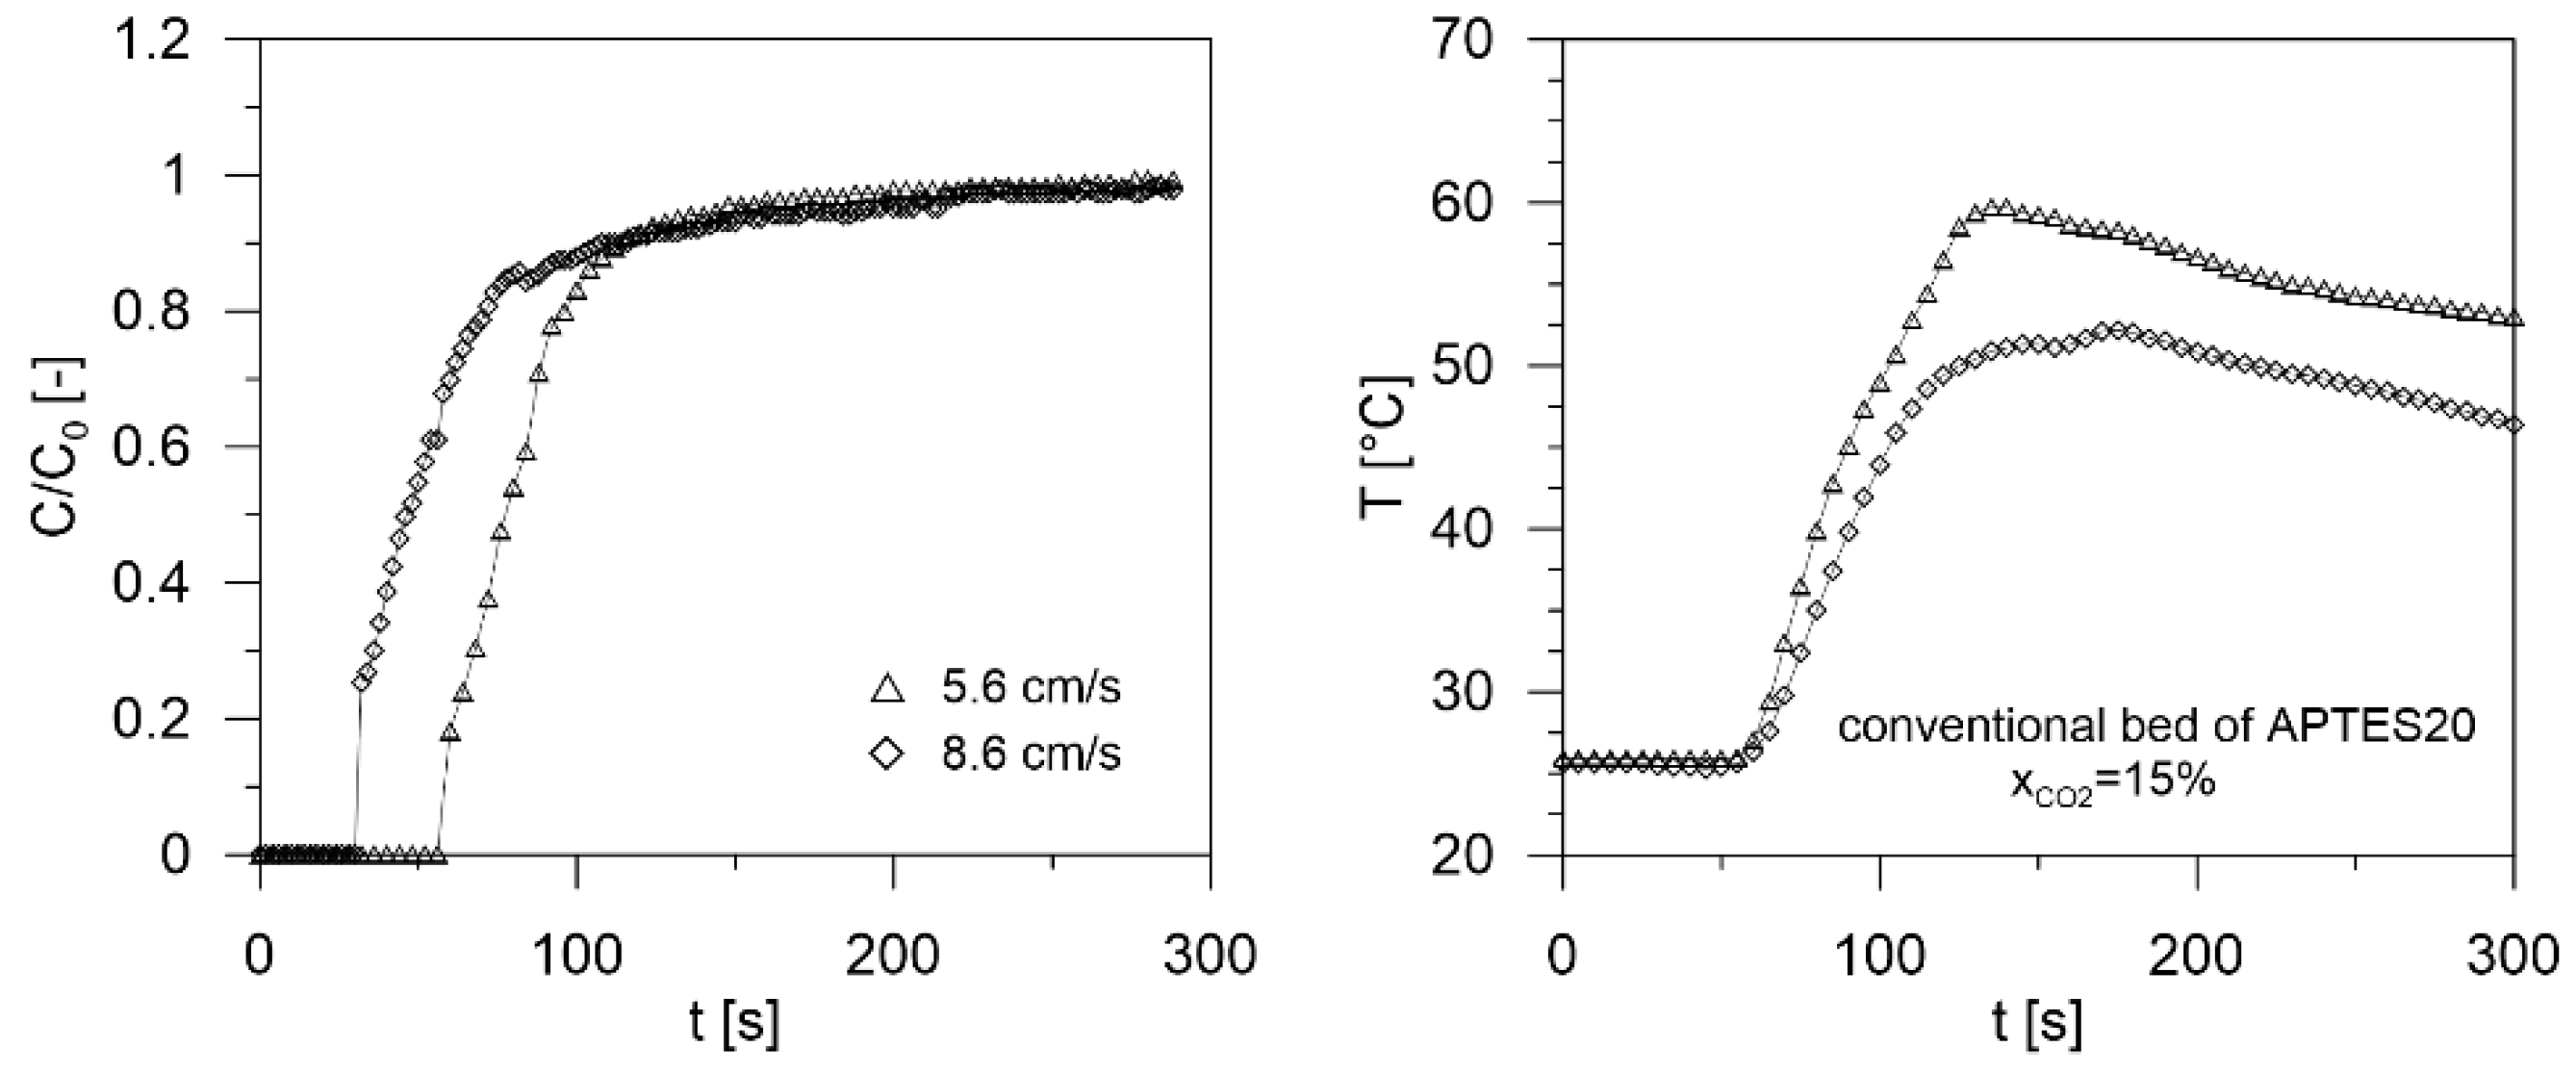
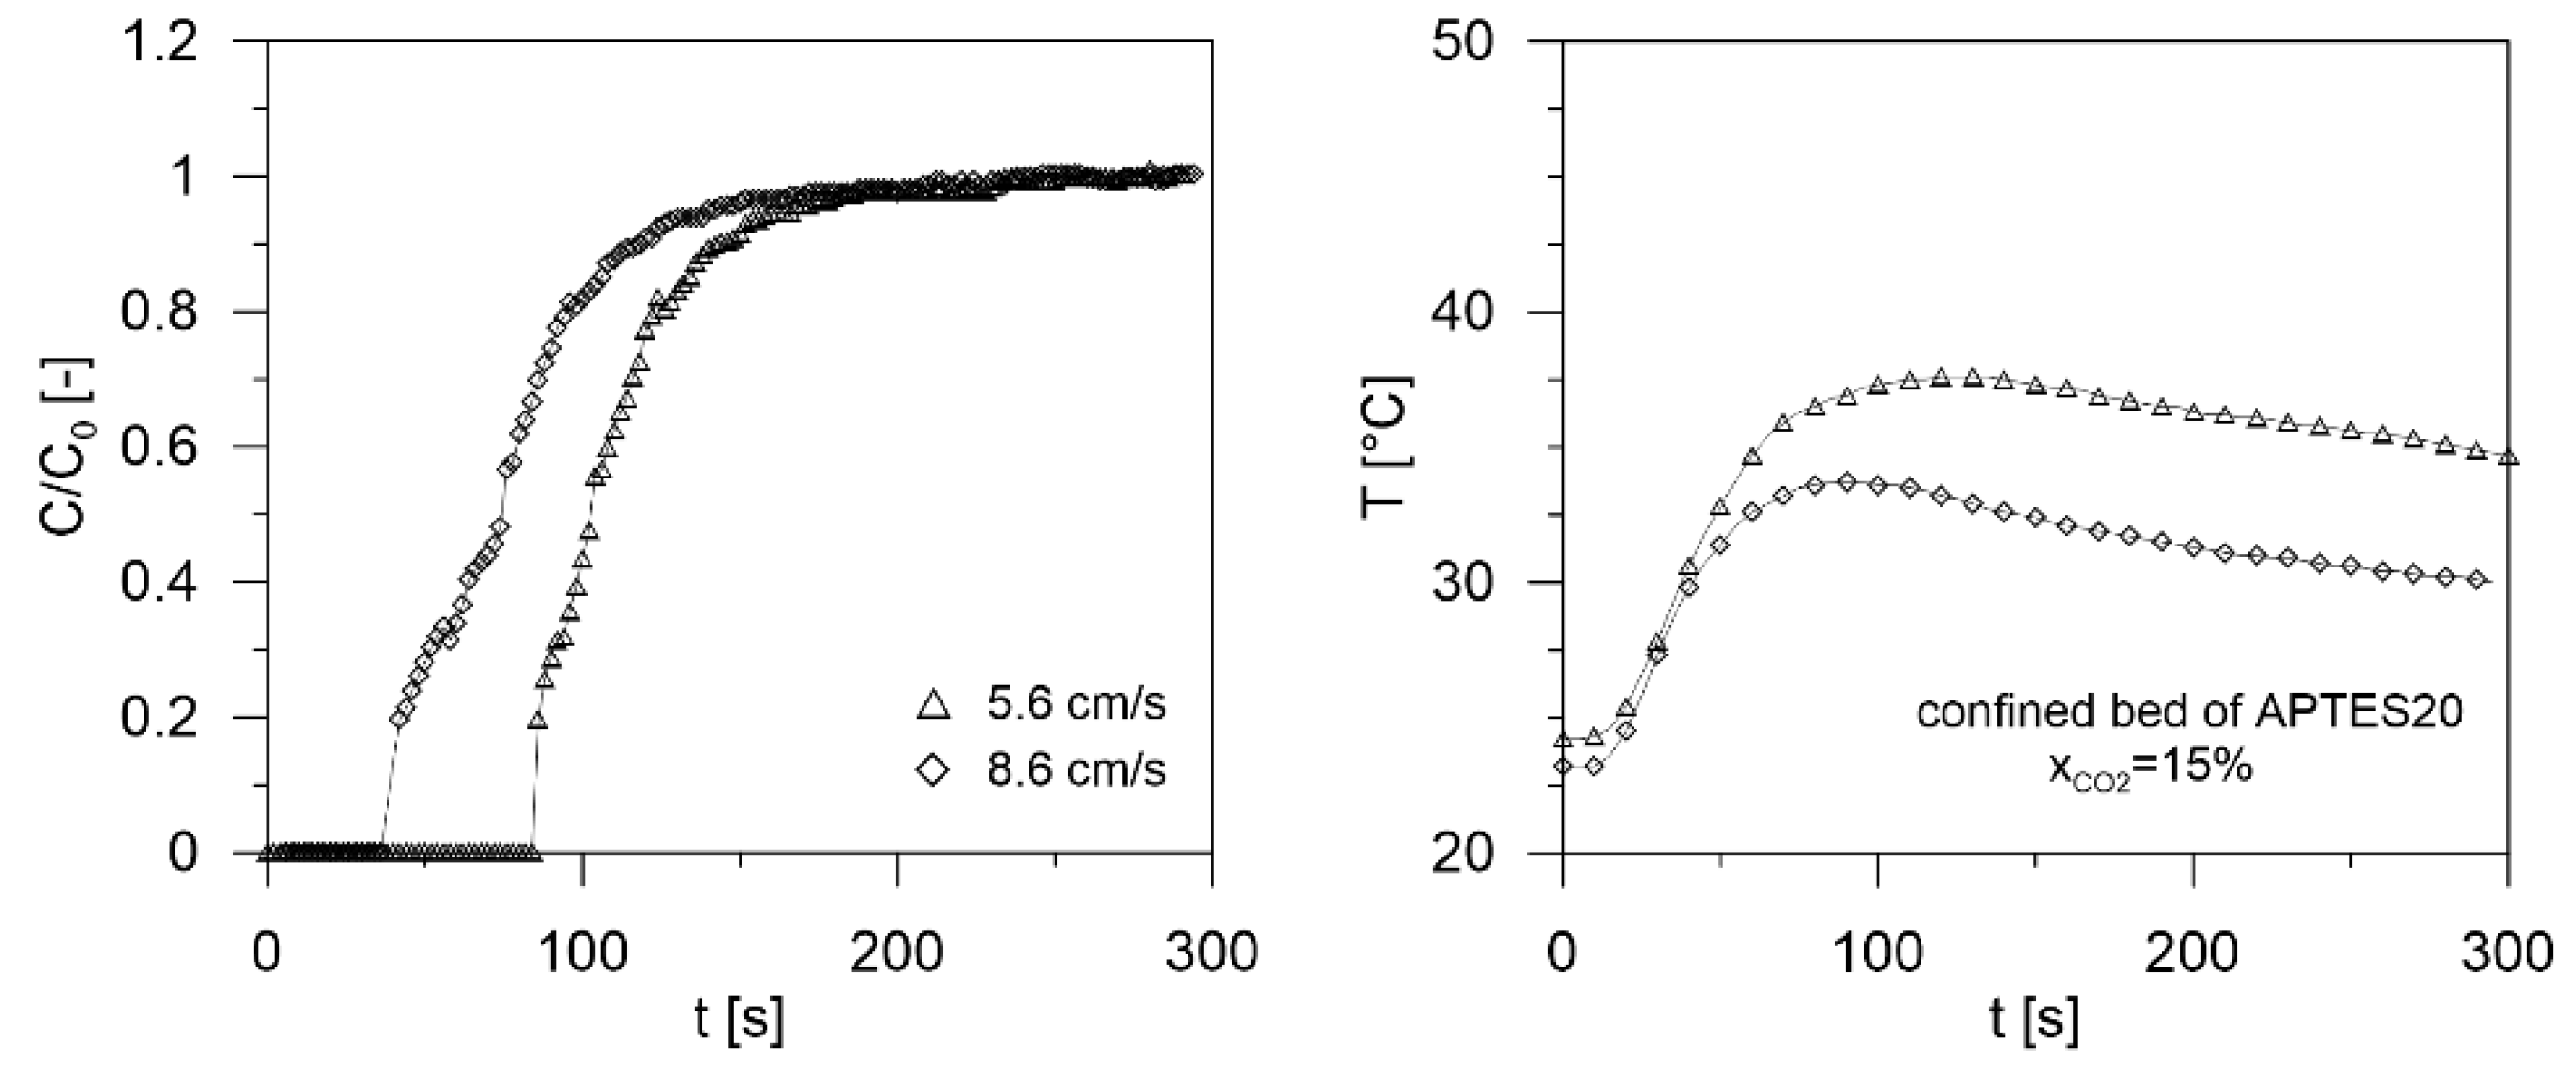
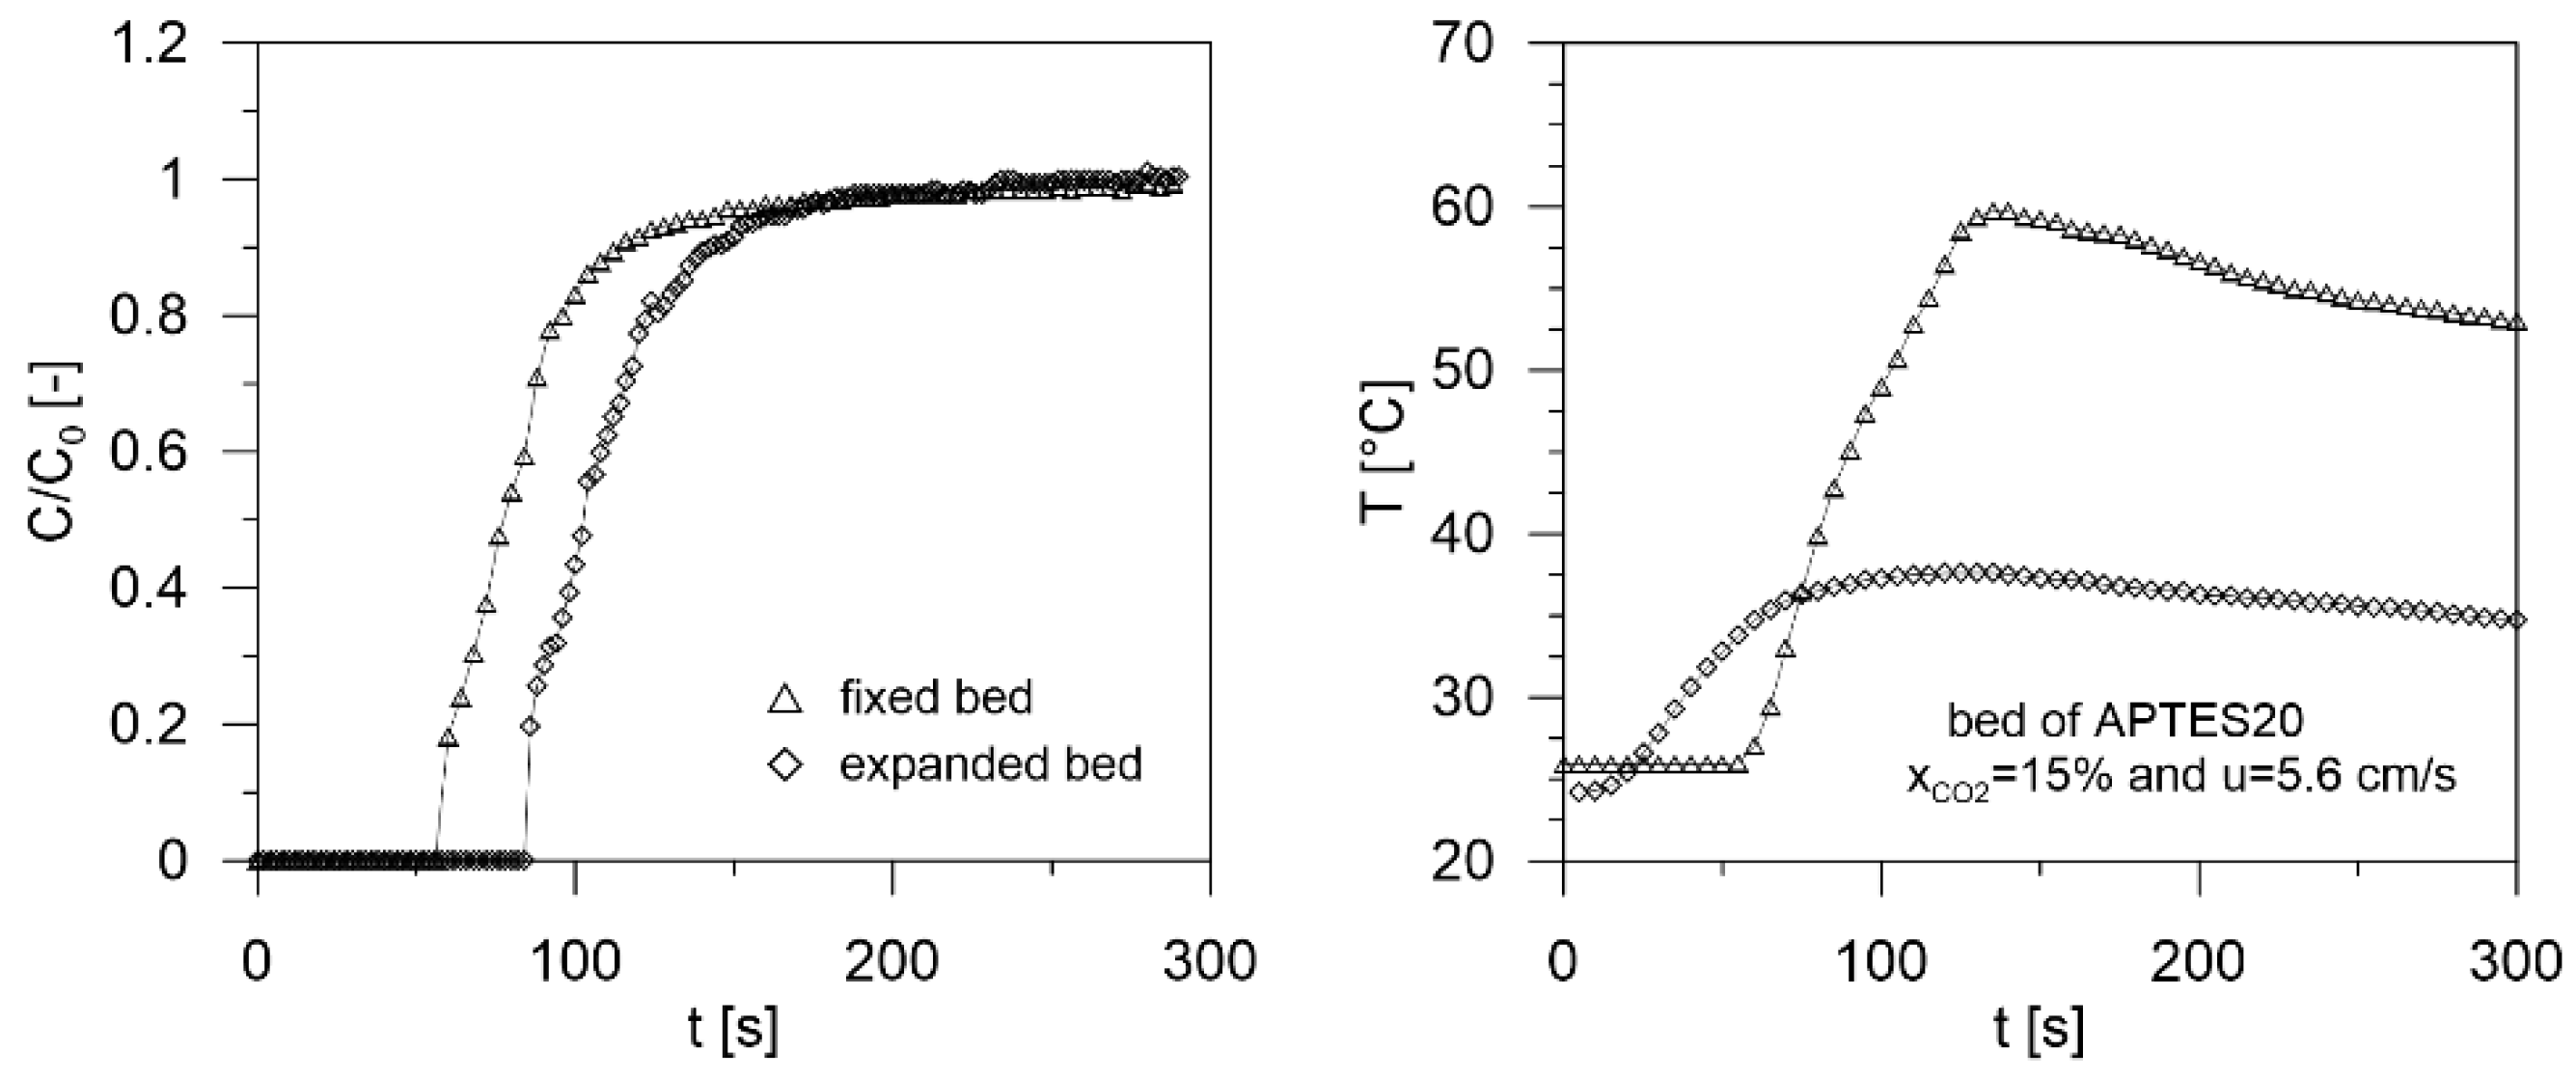
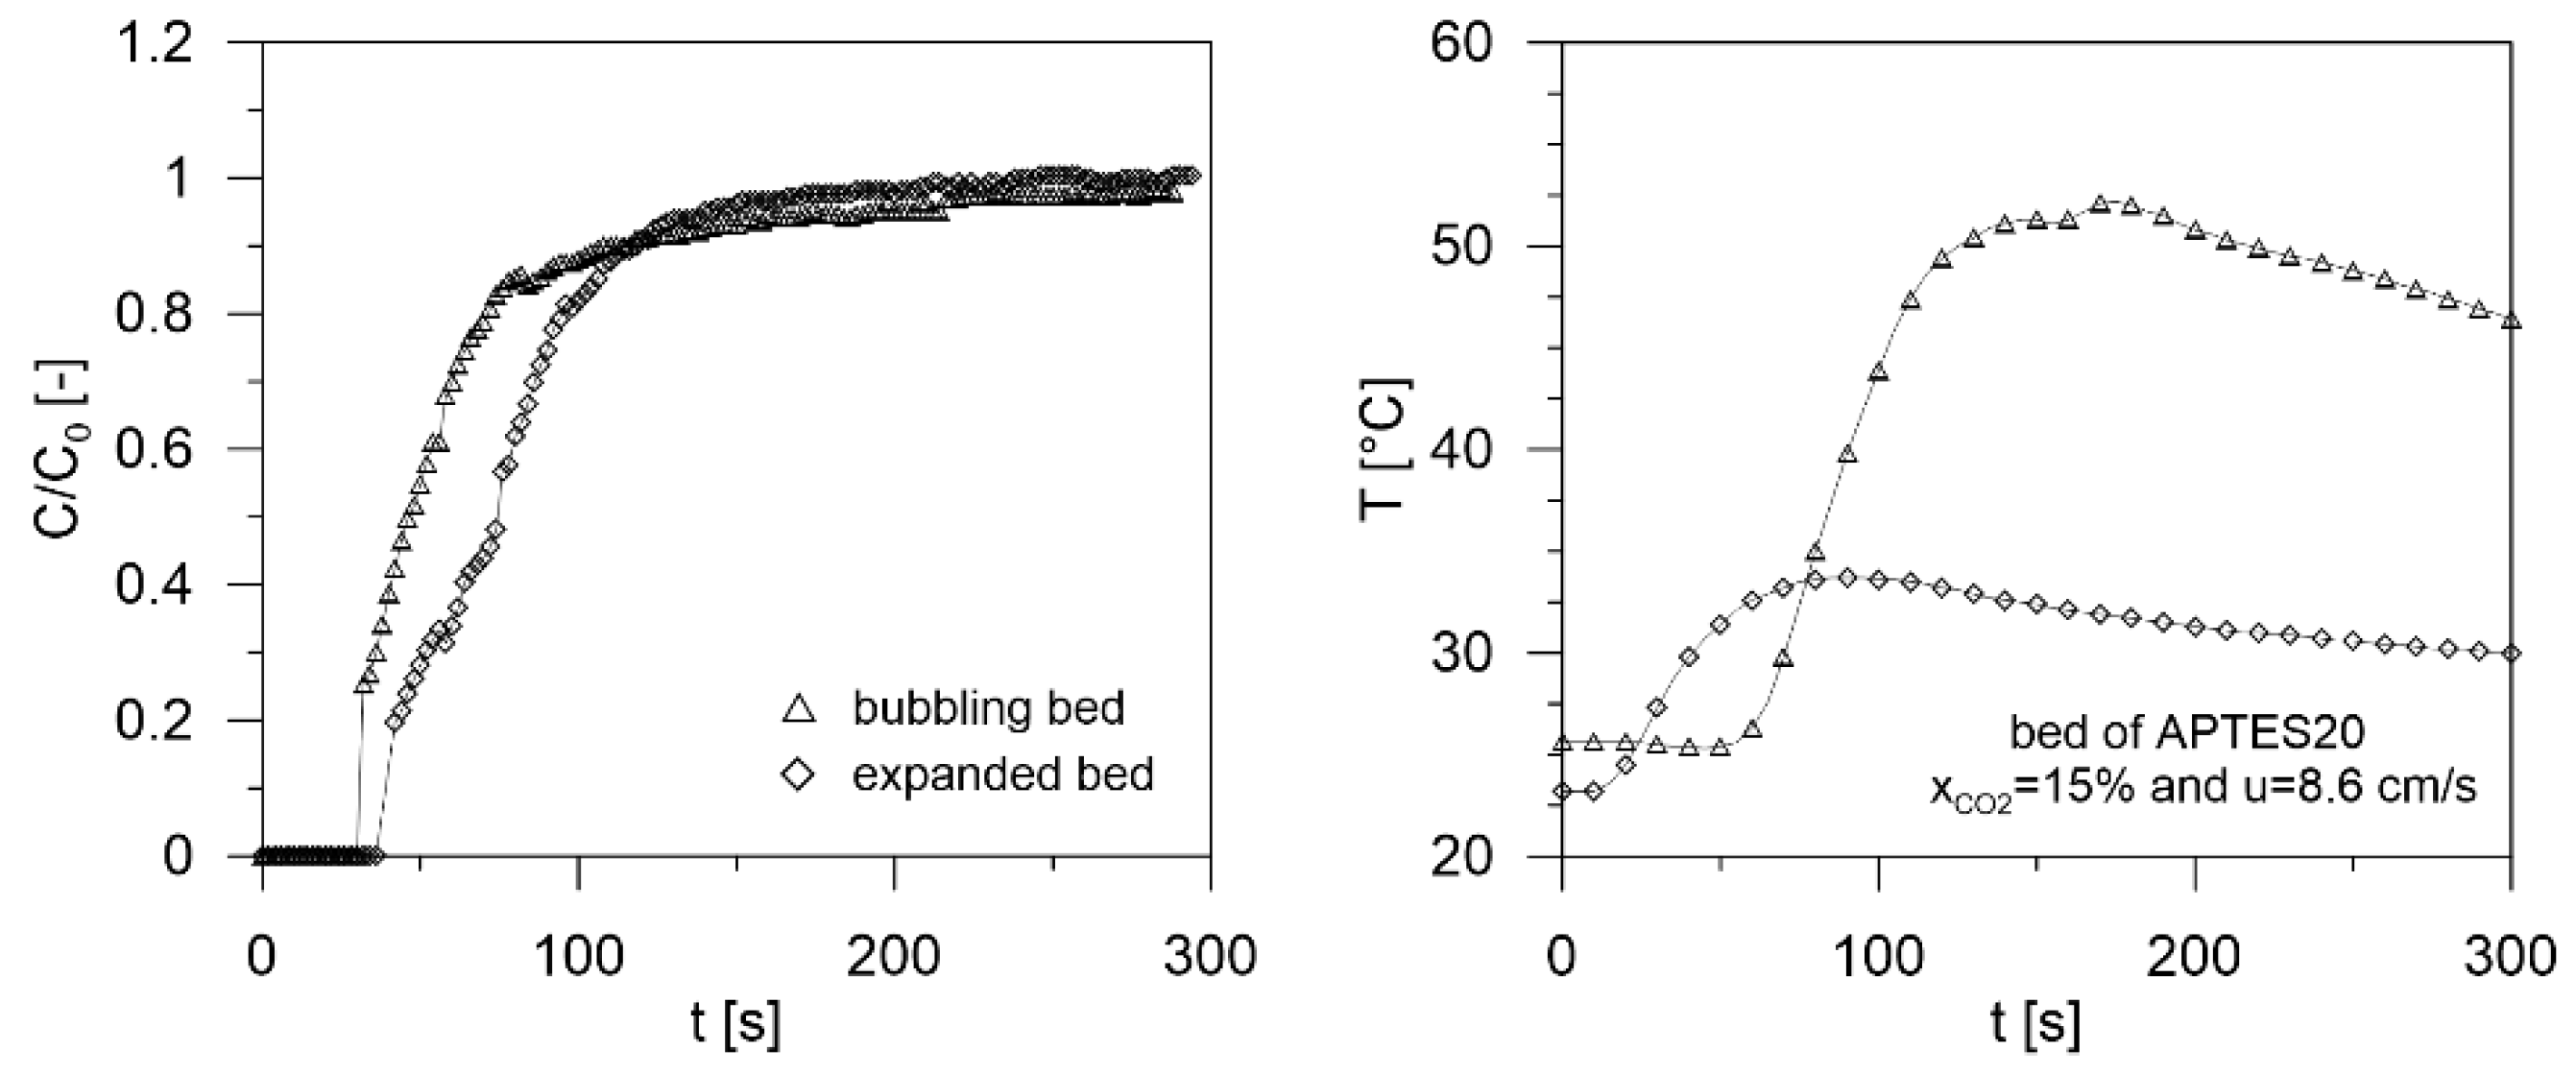
3.5. Effect of the Layout of the Gas-Adsorbent Contact
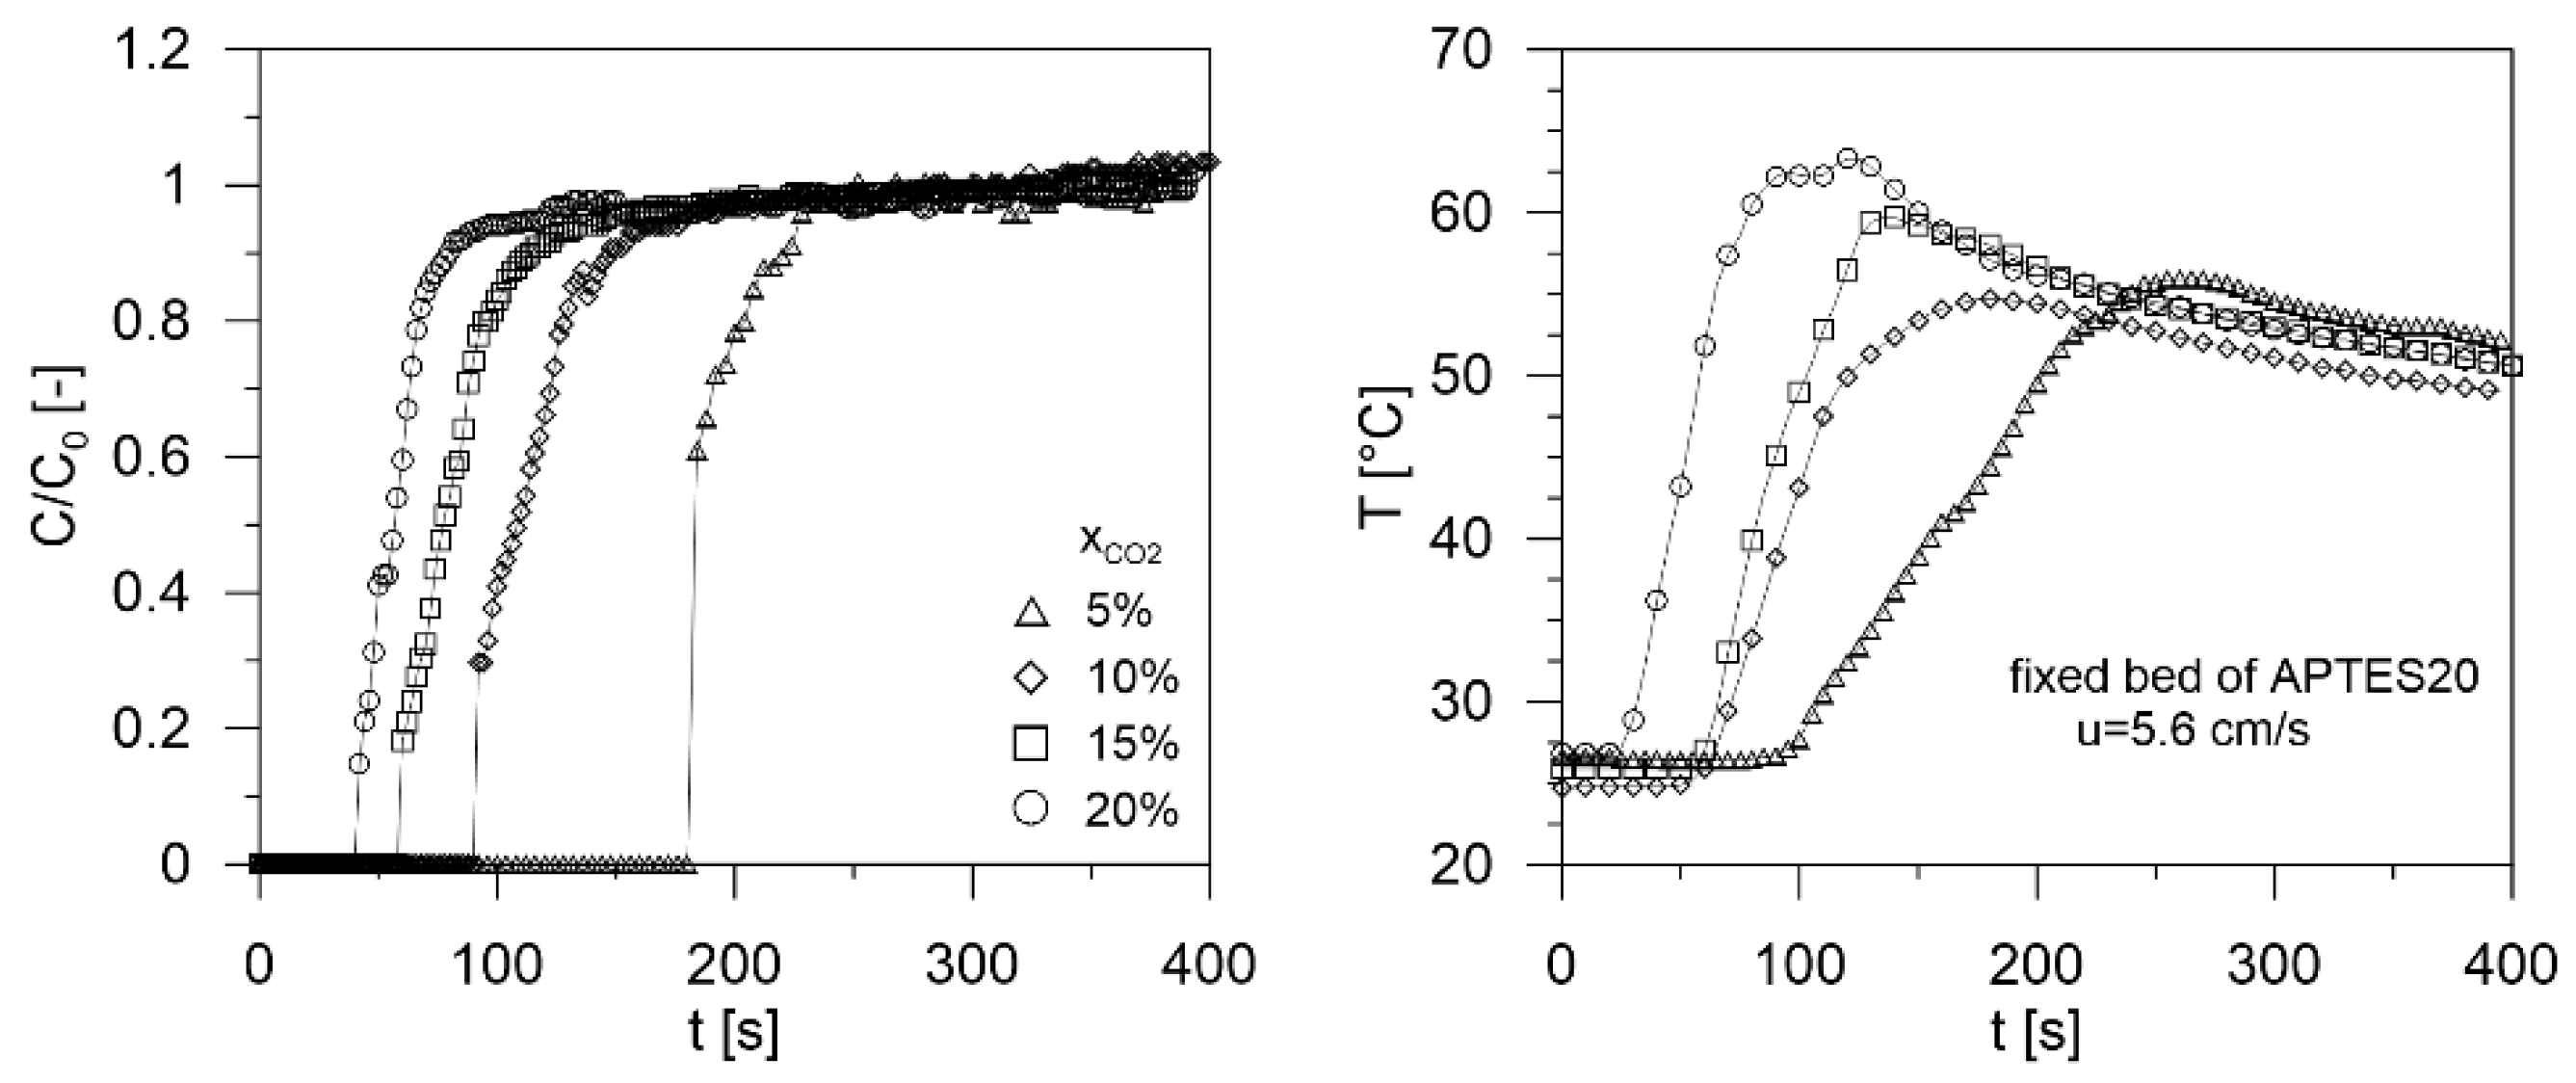
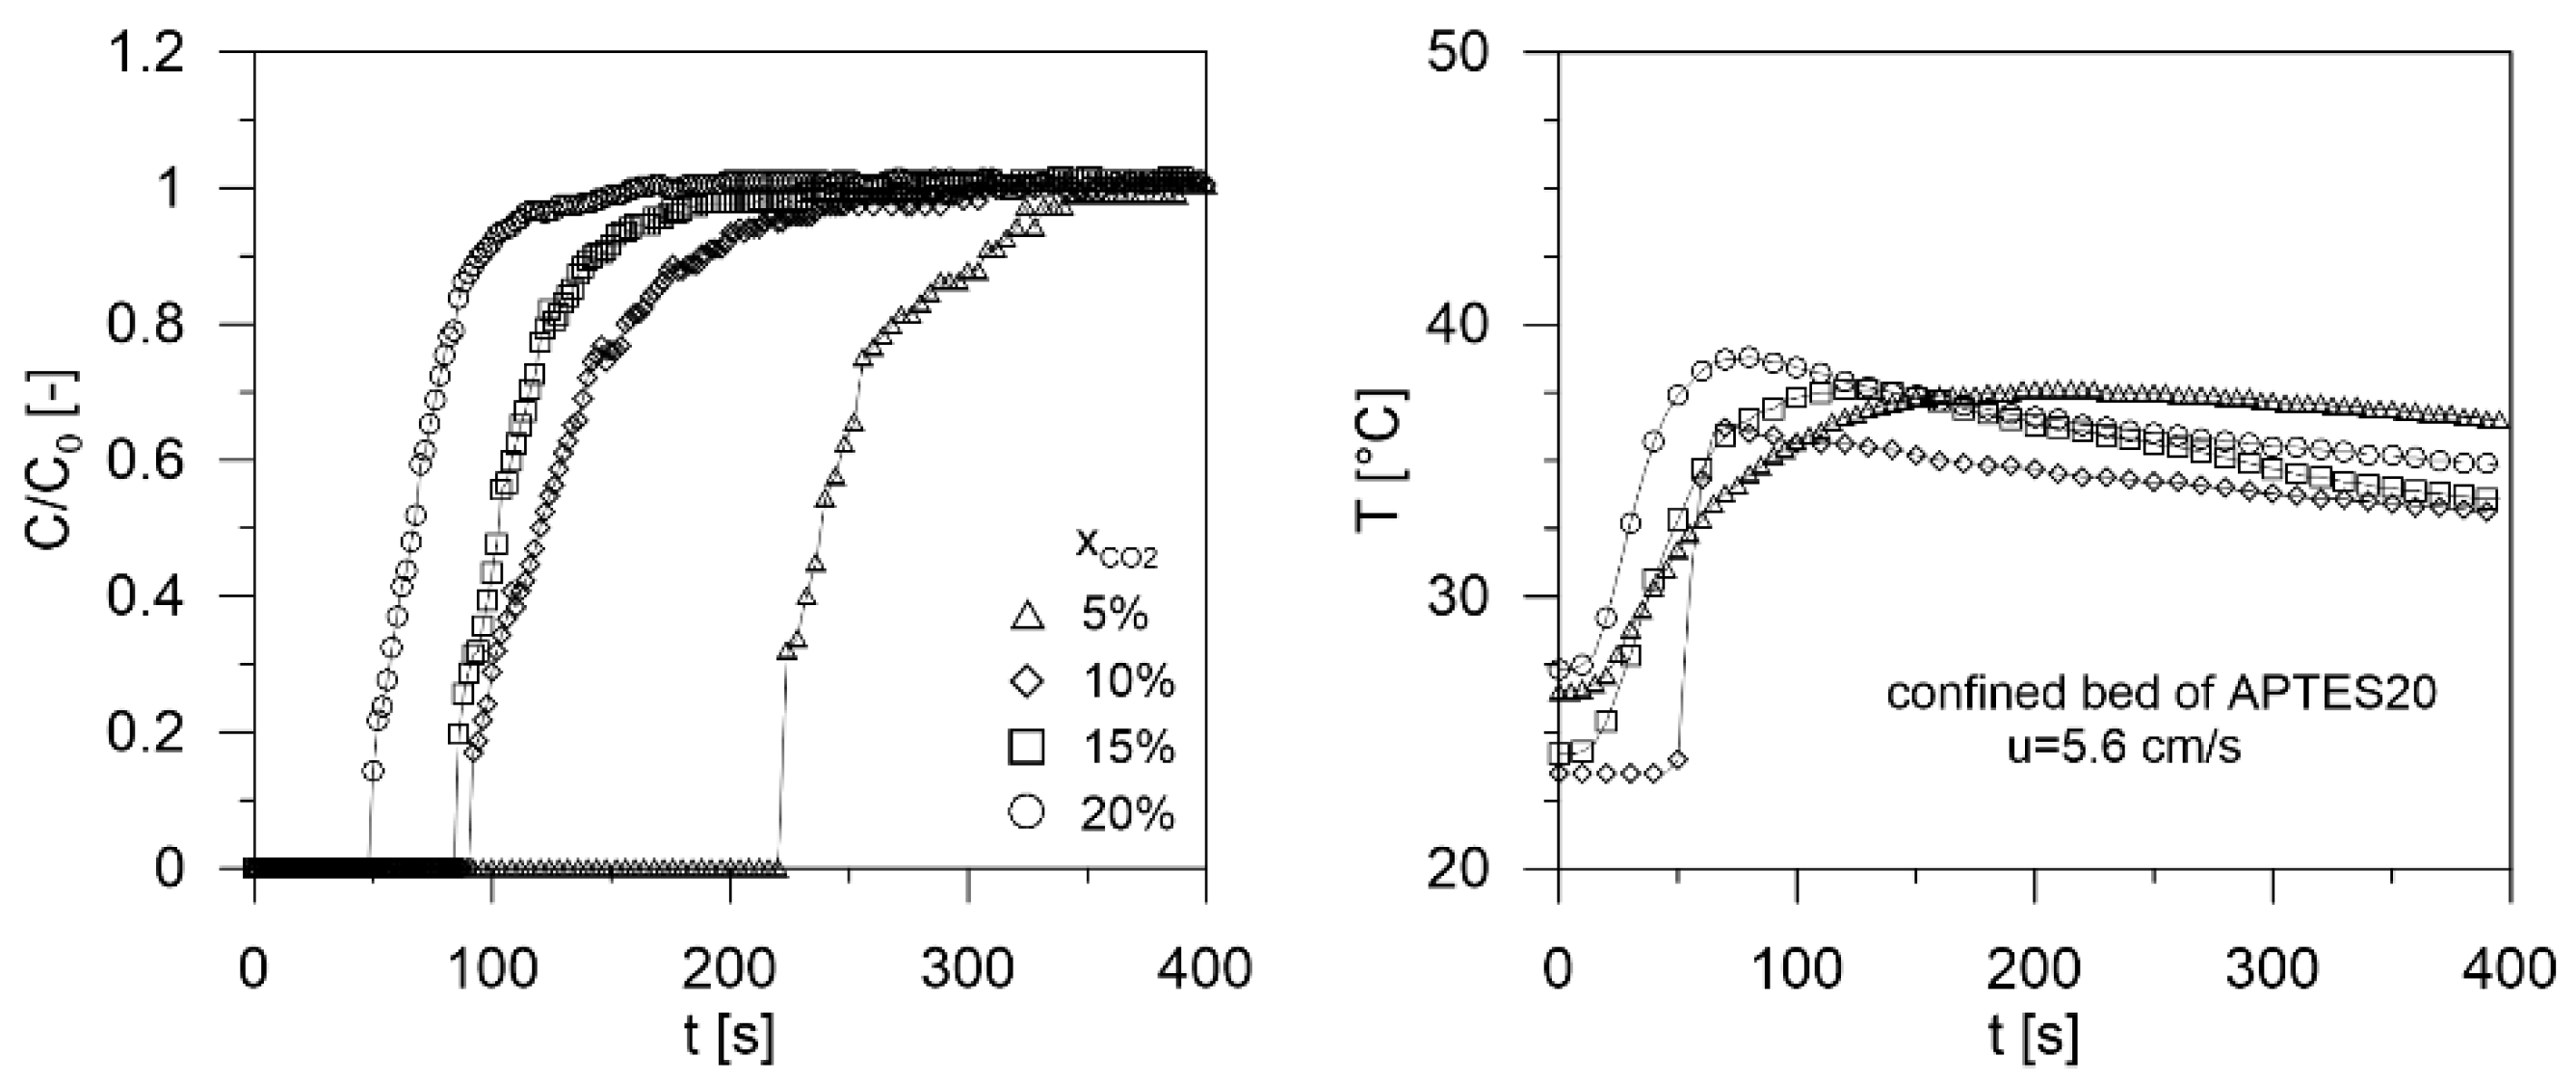
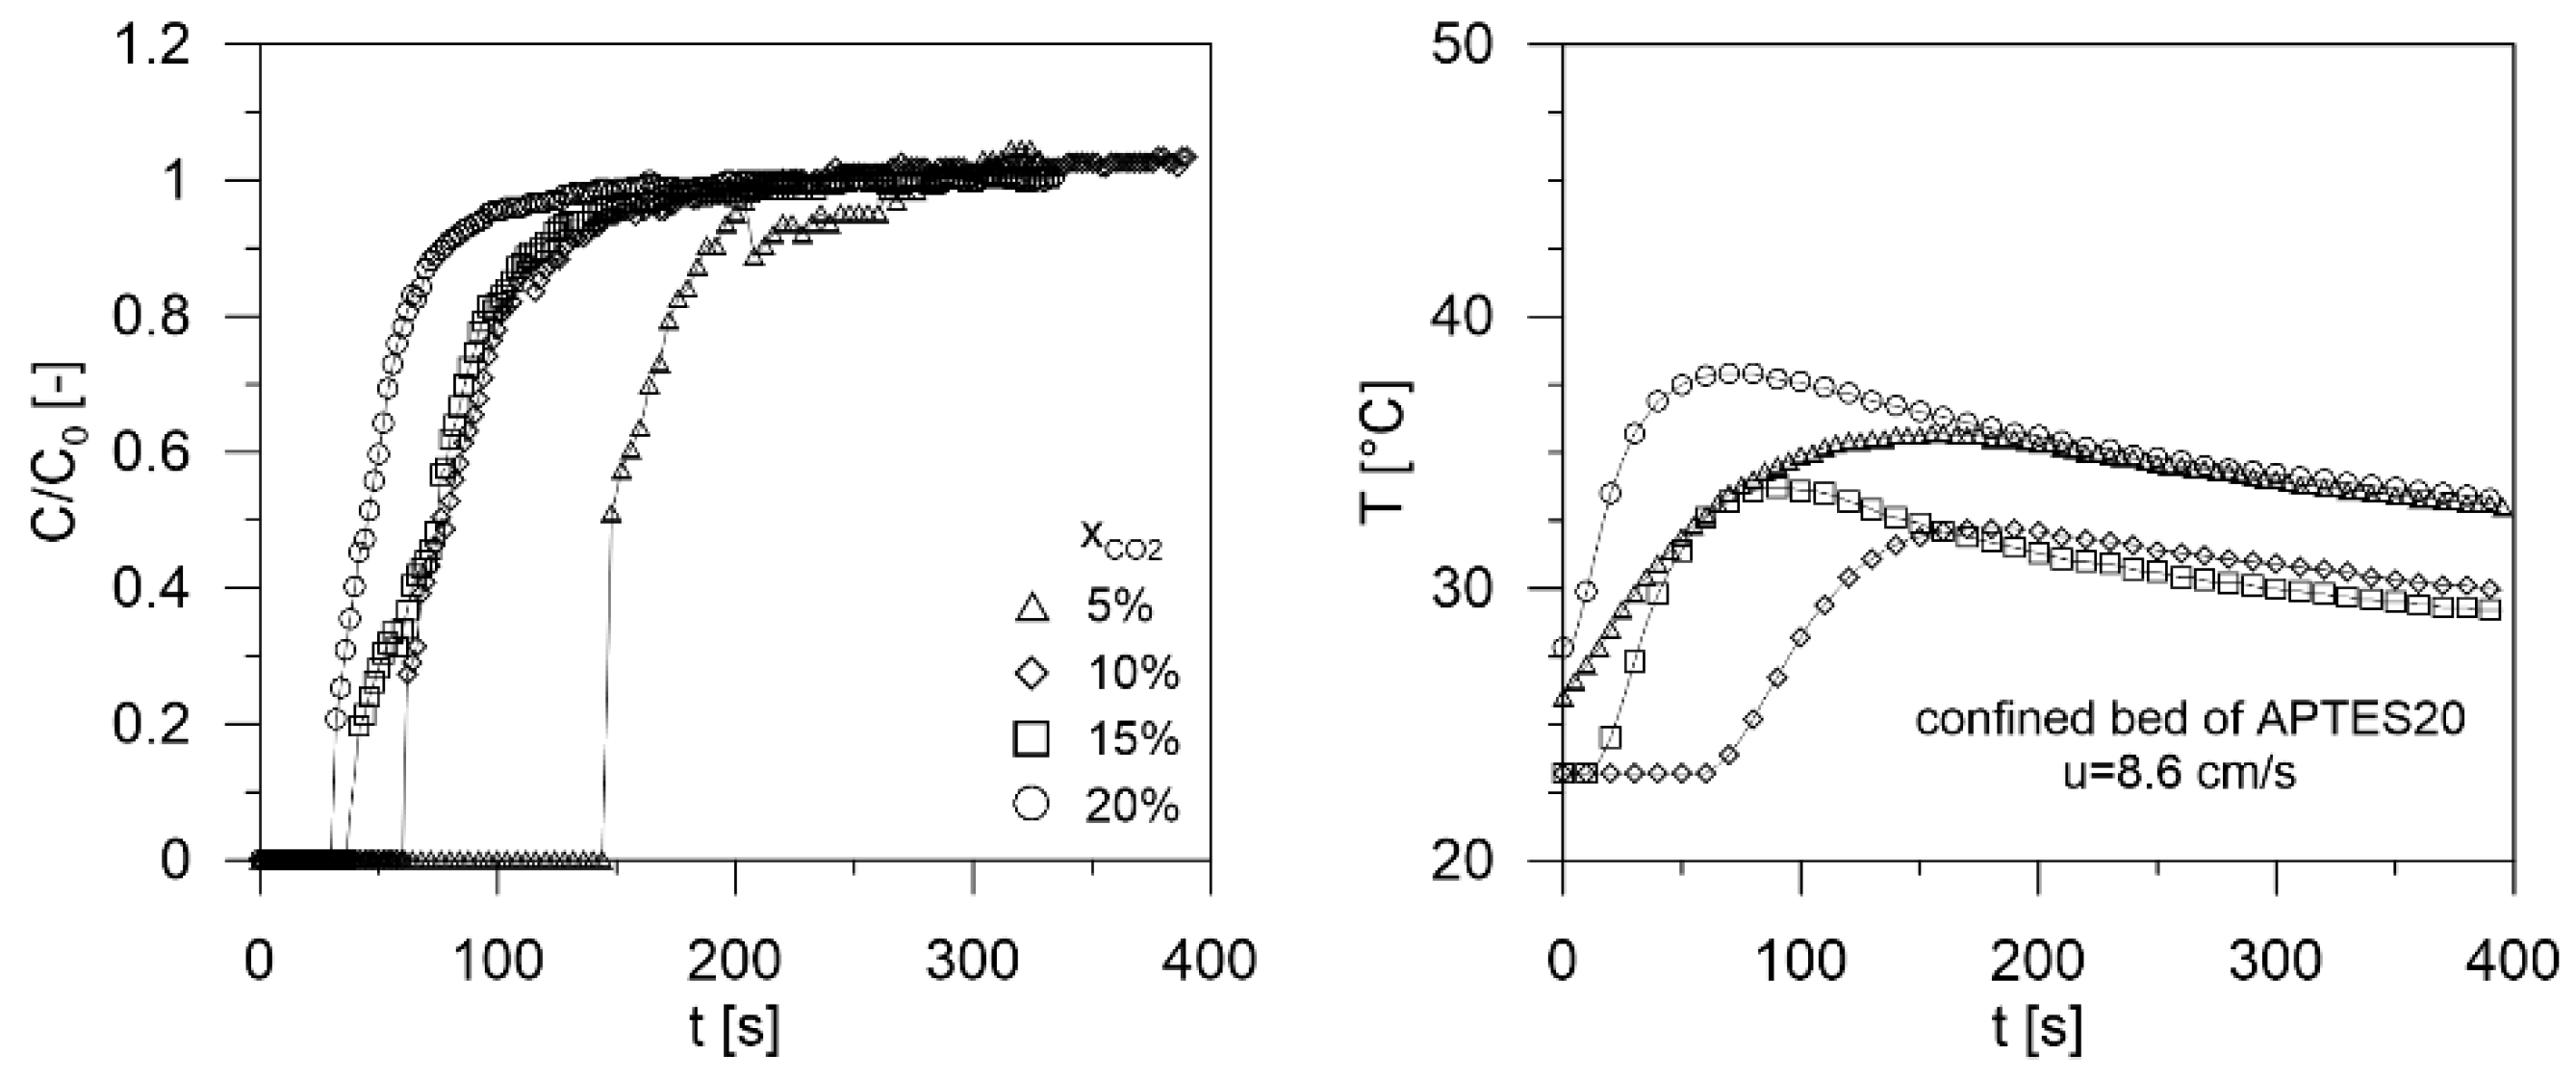
To evaluate the effect of the layout on gas-solid contact, in
Figure 15 and
Figure 16, the breakthrough curves were reported at the same velocity value and 15% of CO
2 as inlet gas concentration. The breakthrough curves in the confined mode were shifted toward the right with a relative increase in the breakpoint times and with a remarkable reduction in the temperature in the bed. The breakthrough time appears higher of 45% than that obtained in conventional fixed bed (see
Figure 15) and of 10% than that of bubbling bed (see
Figure 16). Noteworthy is the favorable control of the thermal effects: the confined expanded bed showed a maximum temperature of 38 °C with respect to the temperature of 60 °C reached in the fixed bed. Finally, the
Tmax was 52 °C for the bubbling bed and 34 °C for the confined layout.
The beneficial effect of the contact mode in a confined environment (
Figure 17,
Figure 18,
Figure 19 and
Figure 20) was evaluated by the analysis of the characteristic parameters (summarized in
Table 6) at different CO
2 concentrations.
All the parameters analyzed had indicated that a substantial improvement of the adsorption performance in the confined layout was obtained.
Even if the contact times decreased with increasing velocity, comparing the conventional and the confined layout at the same velocity, they were higher by about 40%.
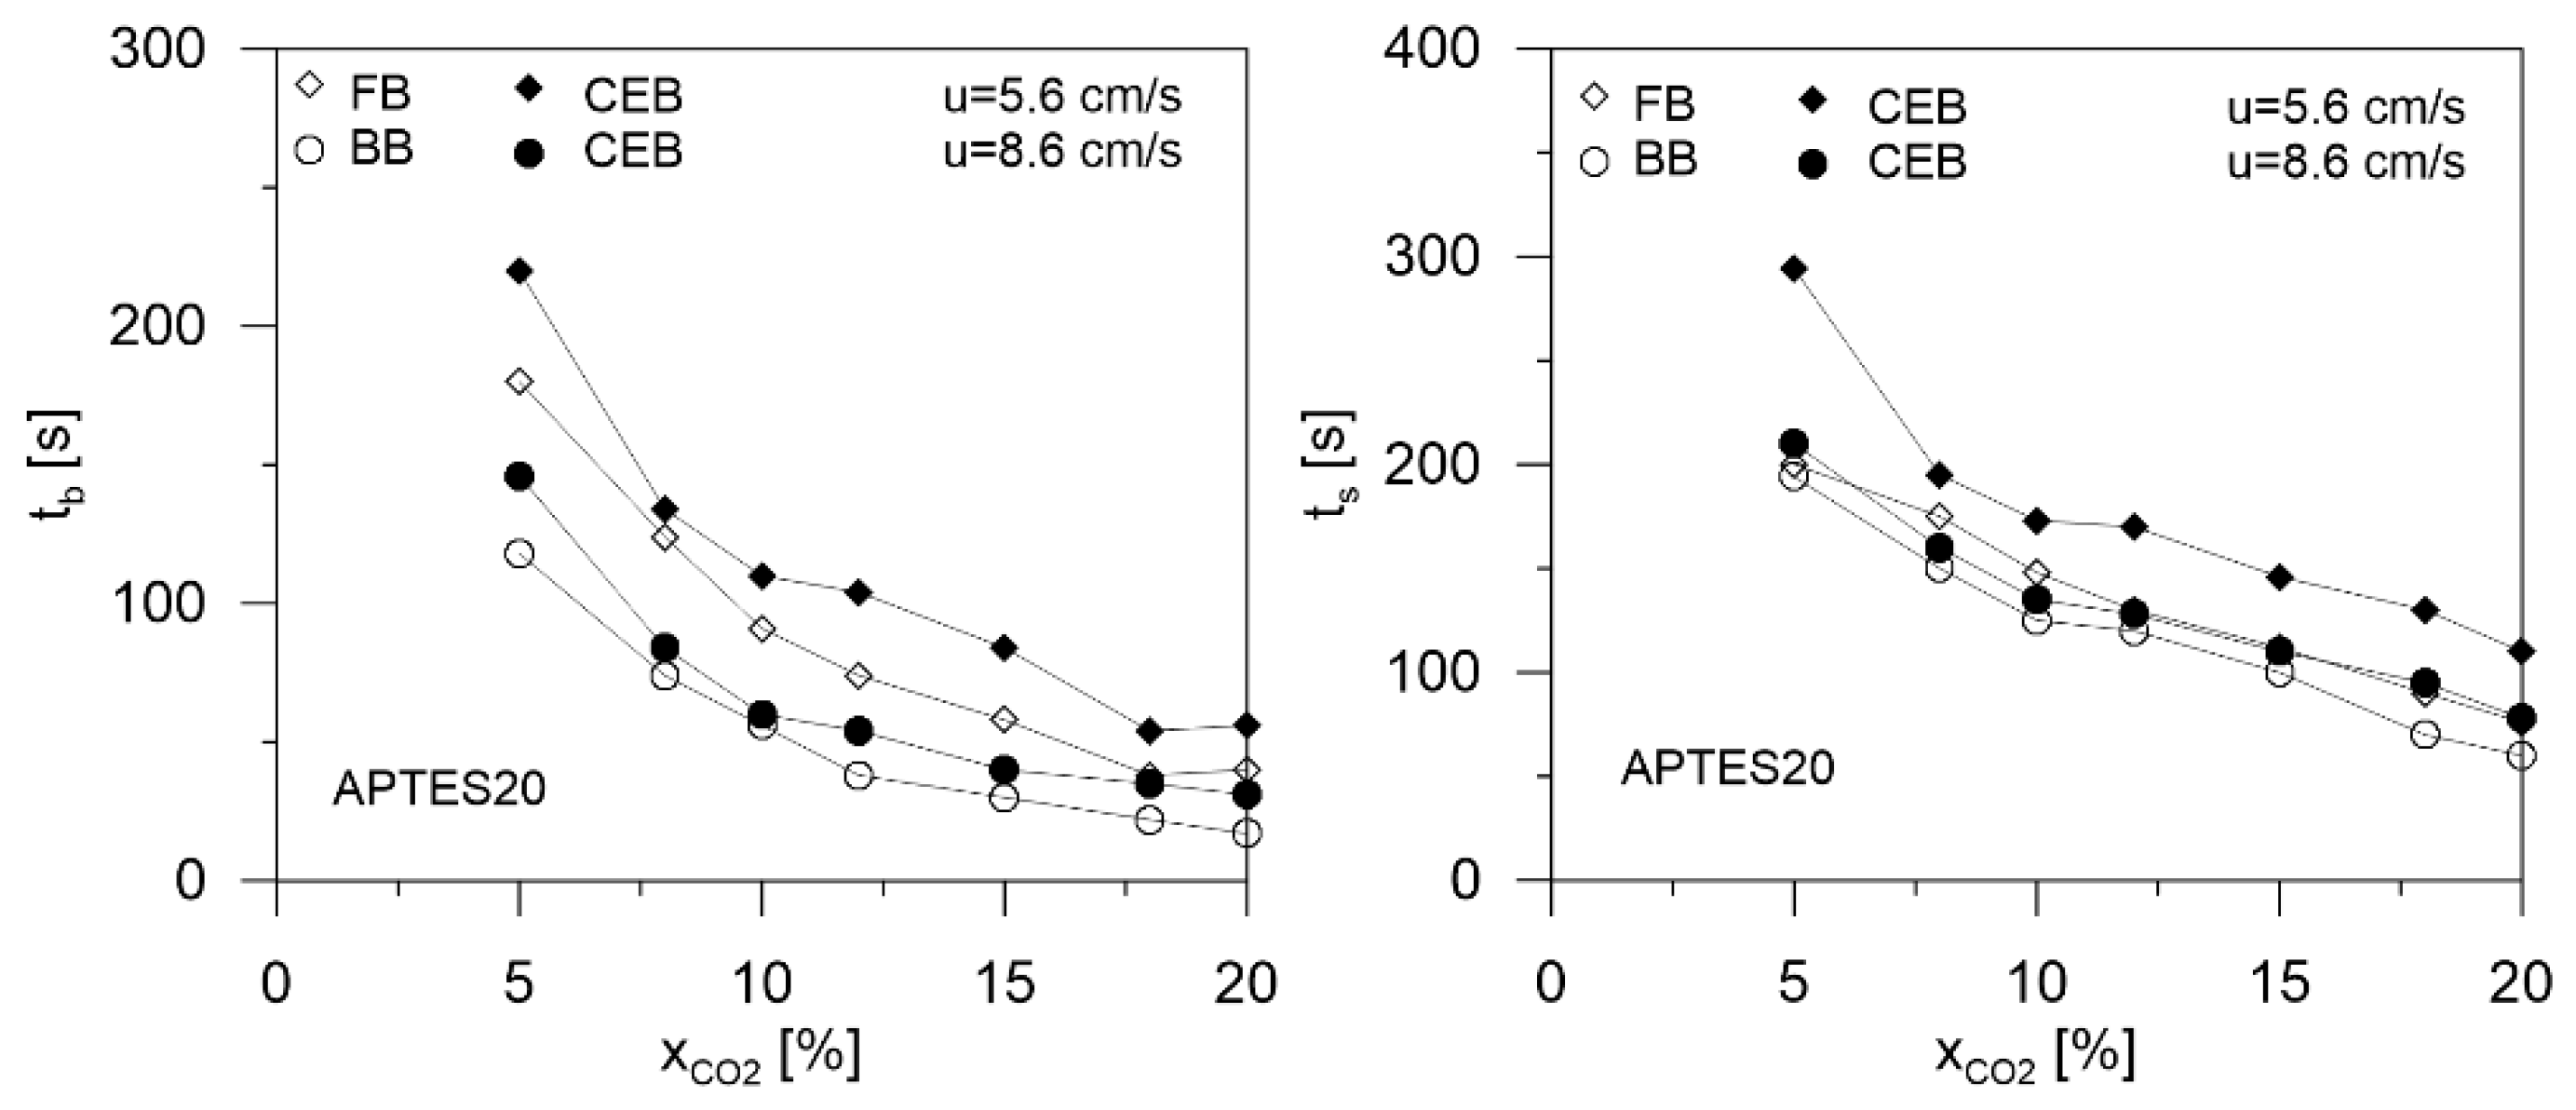
The improved contact performance was then confirmed by the characteristic breakpoint and saturation times, as illustrated in
Figure 17.
Considering the decreasing trend of the characteristic times as the inlet CO2 concentration in the gas mixture increased, a quadratic dependence was observed for the breakthrough time and an almost linear dependence for the saturation time. In both cases, in a confined environment, the values of the characteristic times were slightly higher than in the conventional mode at both velocities.
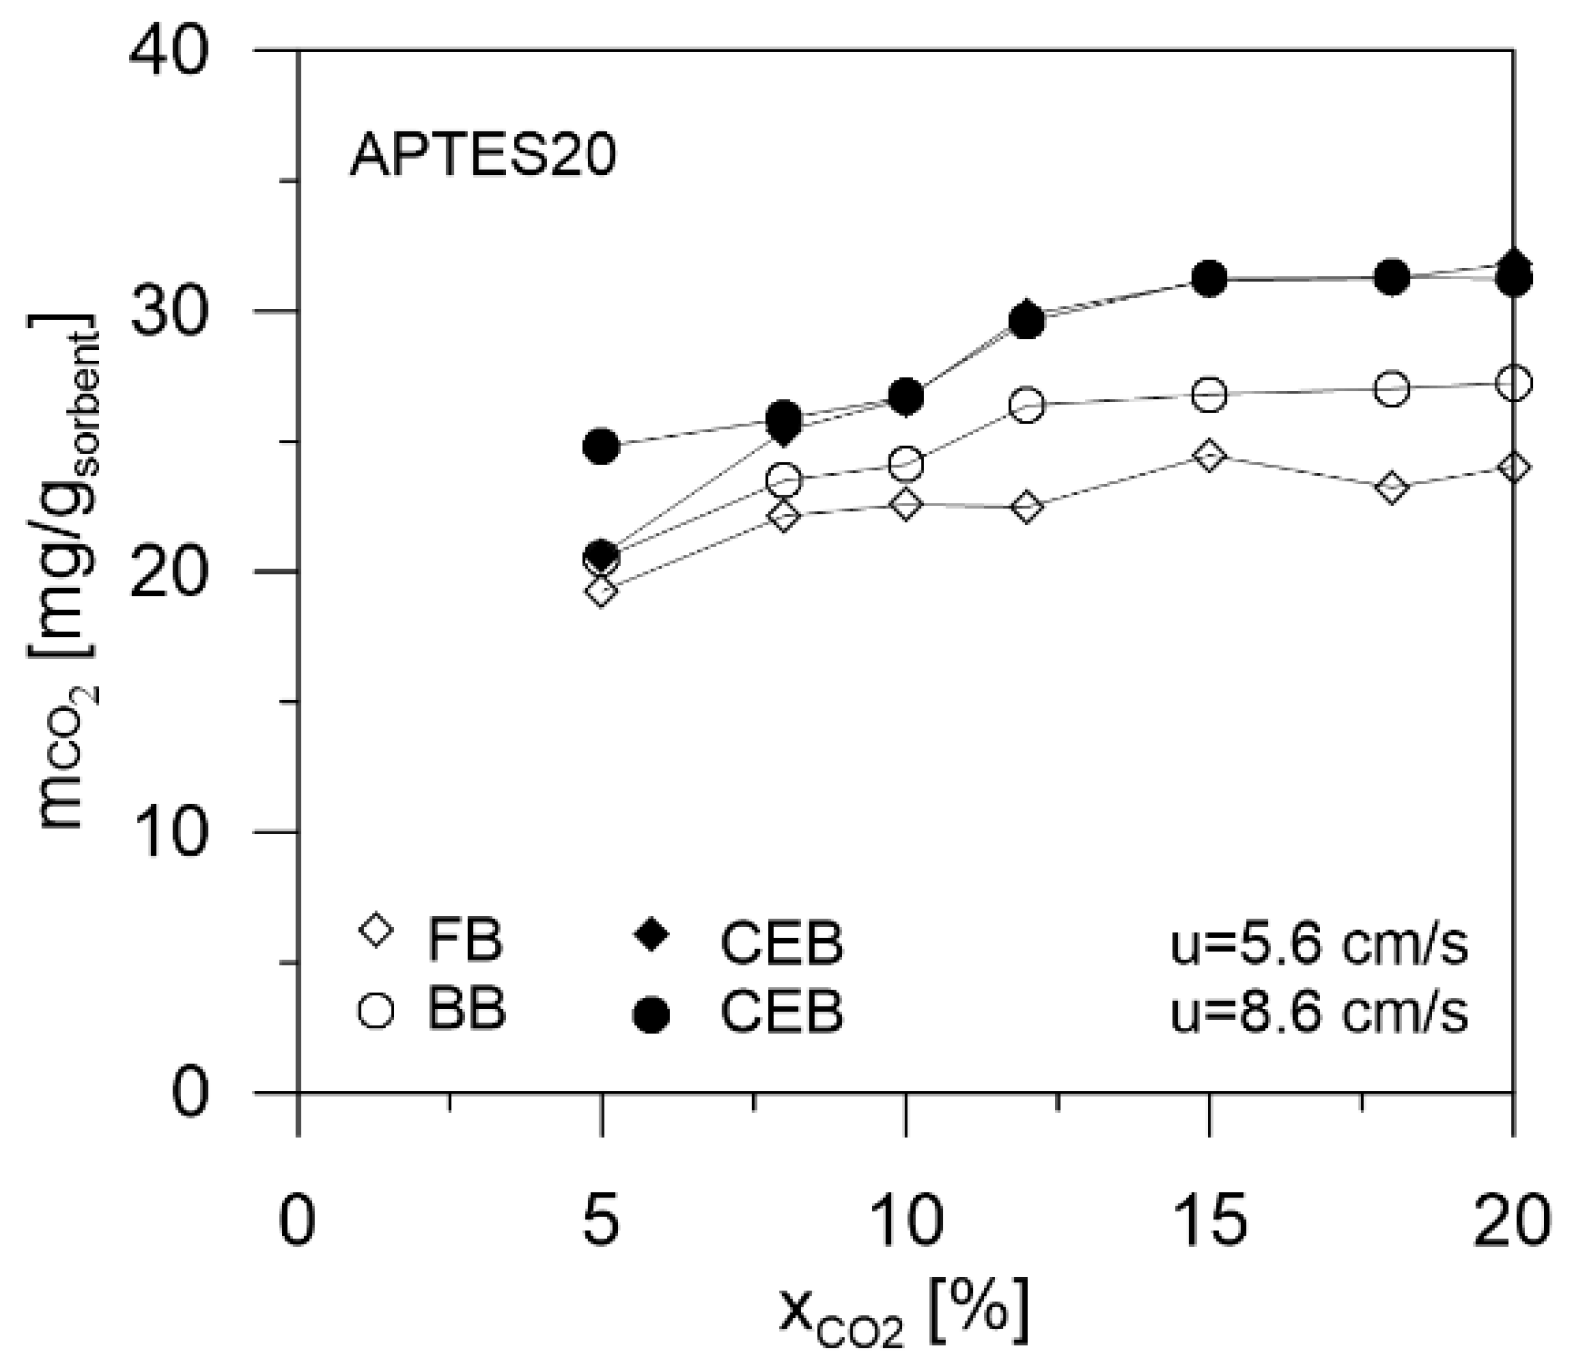
The amount of CO
2 adsorbed, shown in
Figure 18, increased with the inlet CO
2 concentration to reach a plateau, regardless of velocities and modes of contact. Moreover, in the confined layout, the constant value of ca. 31 mg/g of the adsorbent was the maximum reached regardless of the level of the expansion. It was evident the difference existing between the quantities adsorbed in the two contact modes, especially at the lower velocity, which suggests significantly improved performance in the confined mode.
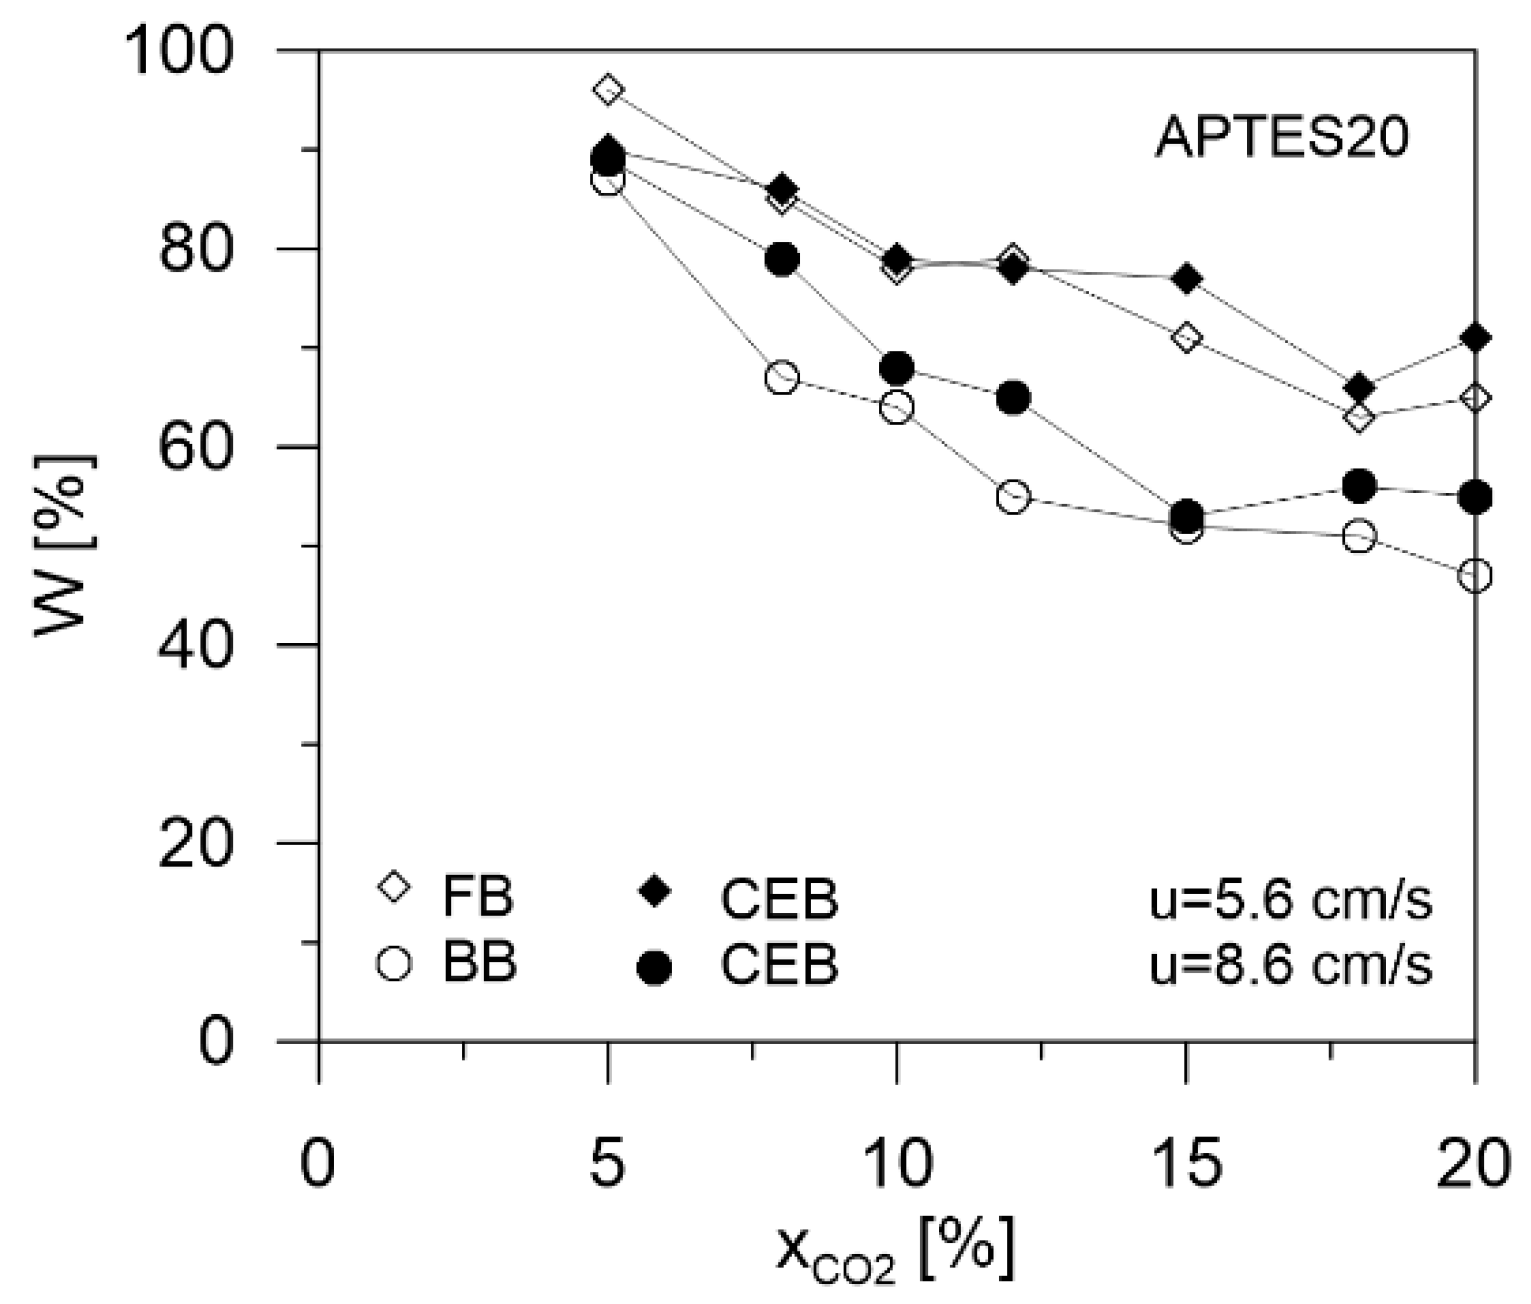
As shown in
Figure 19, the fraction of bed used up to the breakpoint confirmed that a higher value, in confined mode, was also obtained.
The fraction of bed used up to the breakpoint decreased as the concentration of CO2 increased. This trend is more evident for higher velocities. However, the difference in the confined bed was not too noticeable such as in terms of mass adsorbed.
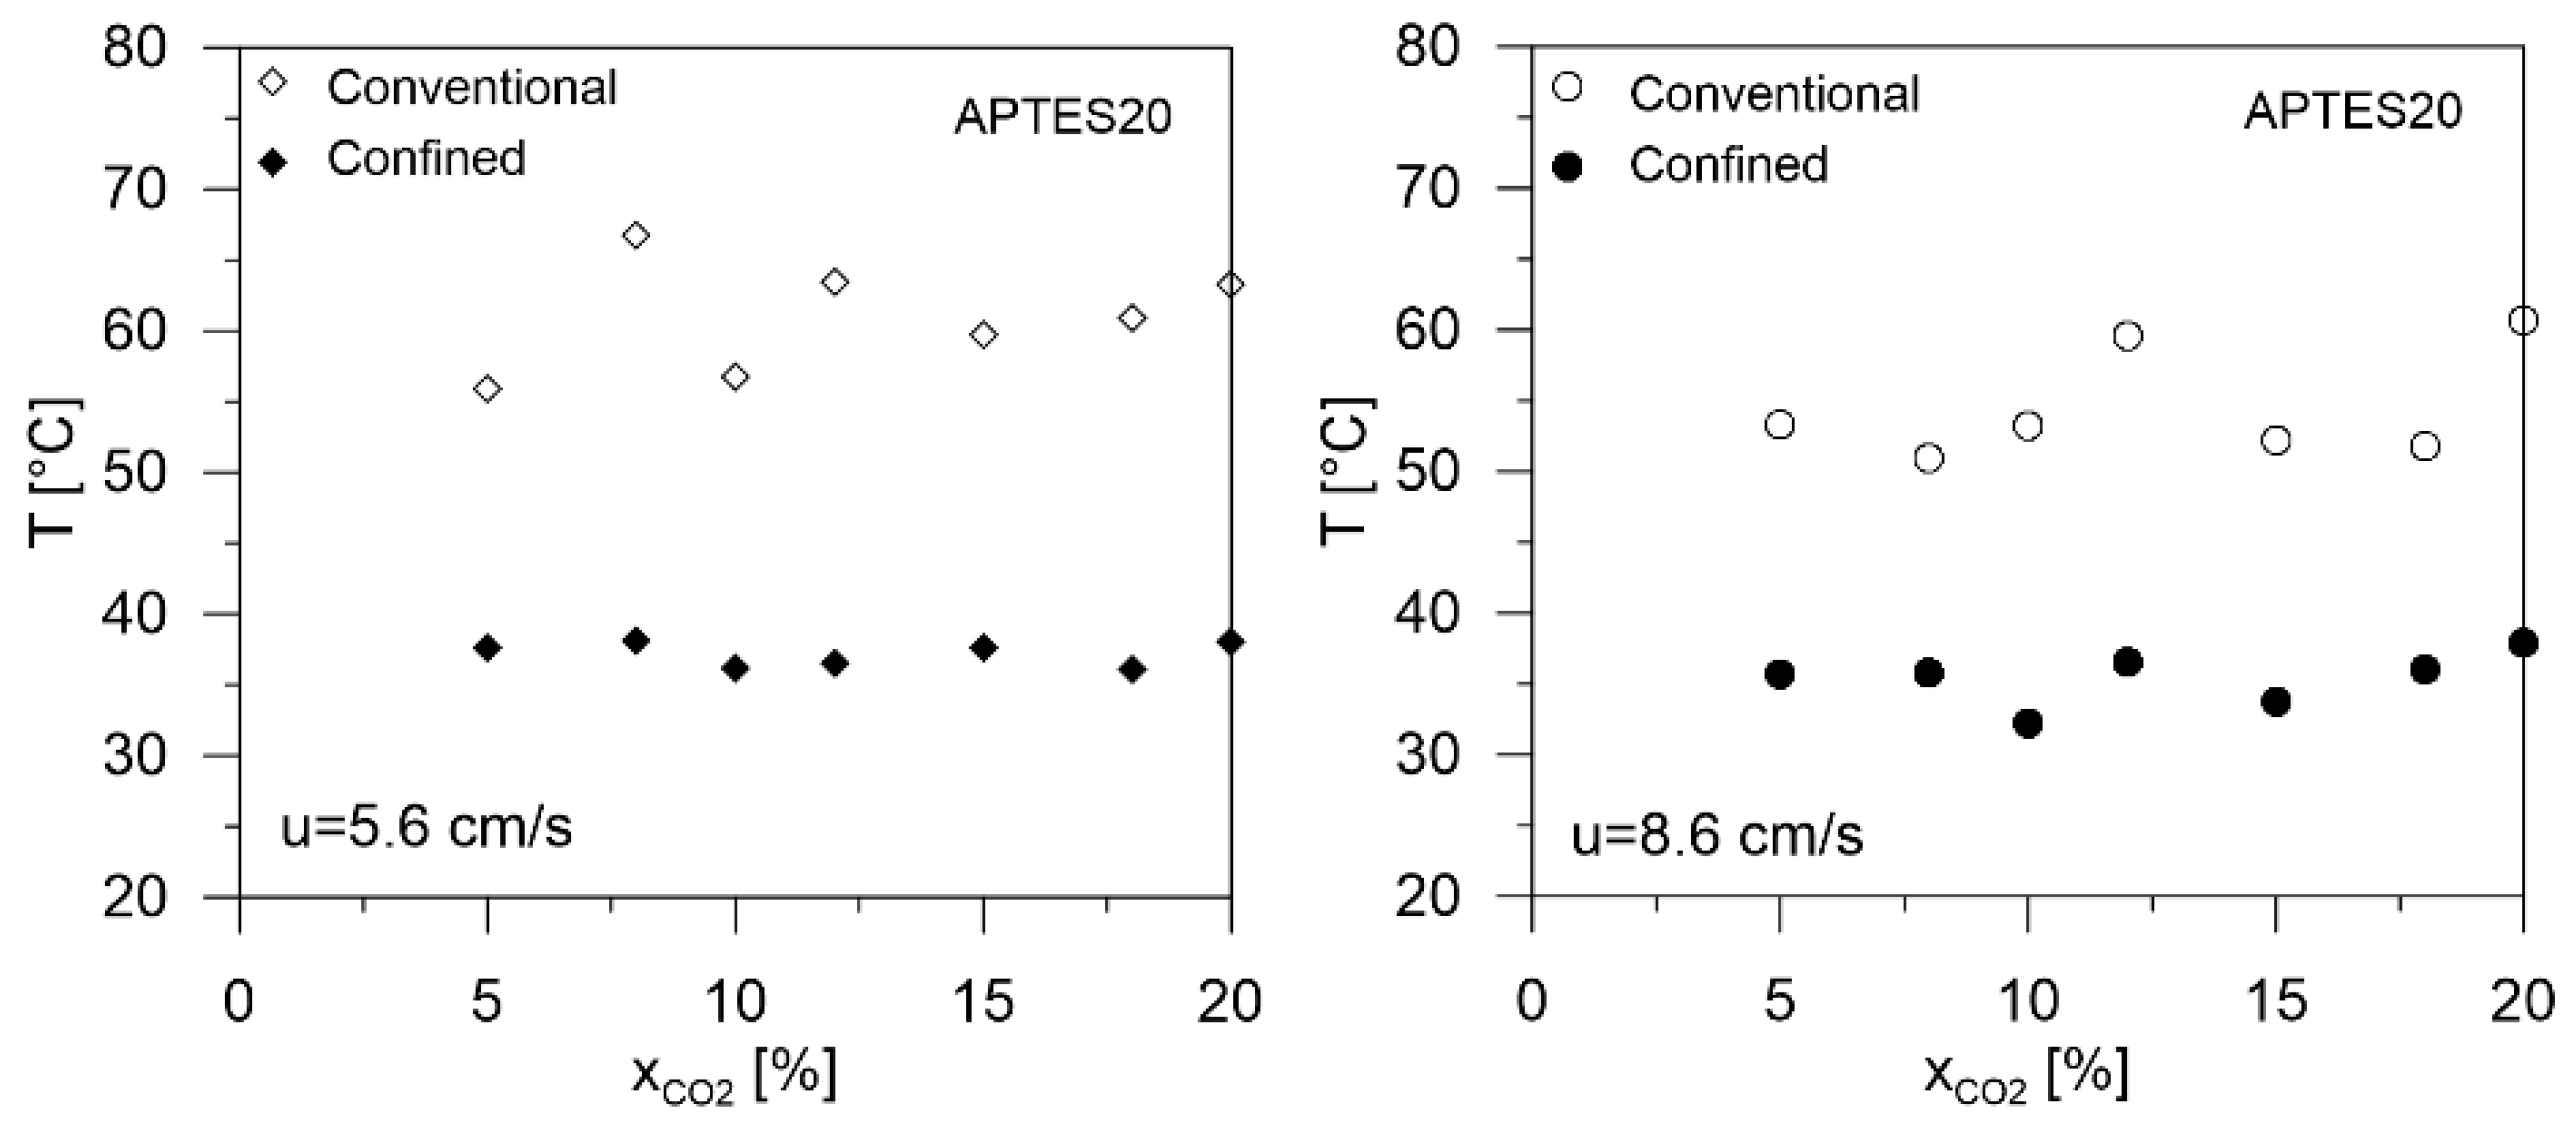
Finally, the temperature of the bed during adsorption in the two contact modes and velocities versus the inlet CO
2 concentration in the mixture is reported in
Figure 20.
These results are explained considering that CO2 adsorption is an exothermic process. Then, any temperature increase was not favorable to the adsorption performance of the bed. Of course, the fixed bed had lower performance, while bubbling or expanded beds were more able to reduce the variation of the operating temperature. Each contact mode had a typical thermal level, higher for the conventional bed (between 50 and 60 °C) and lower for the confined bed (between 30 and 40 °C). The temperatures were not particularly sensitive to velocity and concentration variations.
Table 7 summarizes the CO
2 adsorption values for mesoporous samples, as reported in previous works, modified using several amine agents. Data presented in our work are comparable and quite promising, considering that they are obtained using a CO
2/air mixture.


 ,
, 


