
Precipitation Behavior of Salts in Supercritical Water: Experiments and Molecular Dynamics Simulations


State Key Laboratory of Chemical Engineering, School of Chemical Engineering, East China University of Science and Technology, Shanghai 200237, China
*
Author to whom correspondence should be addressed.
Processes 2022, 10(2), 423; https://0-doi-org.brum.beds.ac.uk/10.3390/pr10020423
Submission received: 26 January 2022
/
Revised: 17 February 2022
/
Accepted: 18 February 2022
/
Published: 21 February 2022
(This article belongs to the Special Issue Advances in Water and Wastewater Treatment Processes)
Abstract
:Supercritical water desalination (SCWD) shows great potential in the treatment of high-salt wastewater with zero liquid discharge. To investigate the salt precipitation behavior and mechanism in supercritical water, experiments and molecular dynamics simulations (MDs) were used to study the salting-out process of different salts in supercritical water. The equilibrium concentrations of NaCl, KCl, CaCl2, Na2SO4, and Na2CO3 in supercritical water were experimentally measured. When the temperature exceeded 693 K, the salt equilibrium concentration measured in the experiment was less than 130 mg/L. The solubility decreased in the order of KCl > NaCl > CaCl2 > Na2SO4 > Na2CO3. To elucidate the effects of different cations and anions in supercritical water on salt dissolution and precipitation behavior, the potential energy, radial distribution function (RDF) and coordination number in the system were obtained via molecular dynamics simulation. Experimental and MD results showed that salt solubility has significant positive correlation with systemic potential energy and hydration number. MD results indicated that a small ionic radius, large ionic charge, and low hydration coordination number are favorable for inorganic salts to precipitate and crystallize since these factors can strengthen the interaction between free ions and salt clusters. Moreover, due to the formation of multilayer coordination structure, polyatomic ions can achieve a lower equilibrium concentration than that of the corresponding monatomic ions.
1. Introduction
Due to the significant decrease in the number of hydrogen bonds and dielectric constant, the dissolving property of supercritical water (T > 647 K, P > 22.1 MPa) approaches a nonpolar solvent [1,2], which becomes immiscible with inorganic salts and thus leads to the precipitation of inorganic salts from water [3,4,5]. On the basis of this principle, supercritical water desalination (SCWD) has attracted increasing attention and is expected to achieve zero liquid discharge compared with the traditional desalting process [6,7]. Odu et al. [8,9] proposed a supercritical seawater desalination process to obtain solid salt products without the generation of a concentrated salt stream. In addition, through the combination of SCWD and supercritical water oxidation (SCWO) [2,3,4], it is expected that high-salt organic wastewater can be treated economically and efficiently. However, the complexity of salt precipitation in supercritical water limits the development and application of the SCWD process.
Many scholars have conducted extensive studies on the salting-out behavior in supercritical water. Zhang et al. [10] summarized and analyzed the precipitation behavior and salting-out mechanism of inorganic salts in supercritical water through the phase equilibrium, dissolution, crystallization, and deposition of salt. The mechanism of salt deposition and phase behavior difference in supercritical water is still unclear, mainly due to the harsh conditions involved in supercritical water, high requirements for experimental equipment, and many properties that are difficult to obtain directly through experiments. Fortunately, molecular dynamics simulation (MD) research of the salting-out process has gained increasing attention in recent years. The precipitation behavior of salts, especially NaCl, has been studied by various groups under supercritical conditions. Yang et al. [11] used the MD method to study the nucleation of NaCl at the solid–liquid interface of a supersaturated solution. Focusing on changes in radial distribution function (RDF) and velocity correlation function (VCF), a molecular dynamics investigation of NaCl–H2O solution from subcritical to supercritical conditions was carried out by Reagan and Harris [12]. The aqueous solution of sodium chloride under ambient temperature and supercritical conditions was simulated by Koneshan and Rasaiah [13] through MD.
Lümmen et al. [14] simulated the aggregation process of FeCl2 clusters in supercritical water by MD. During the whole time interval covered by the simulation, water molecules were found in FeCl2 clusters, which is consistent with the existence of crystal water in FeCl2 crystals grown from aqueous solution. After that, research [15] shows that particle formation takes place within a few hundred ps after the jump from ambient to supereritical condition, and found that the nucleation rate of FeCl2 is in the range of 1035–1037 m−3s−1. In addition, Zhang et al. [16] simulated the agglomeration process of sodium carbonate in supercritical water and proposed that electrostatic interactions are the principal factor affecting the nucleation process of sodium carbonate. They found that, during the salting-out process, the effect of temperature was greater than that of pressure, and a higher temperature resulted in an increase in collision rate, facilitating forming the initial sodium carbonate nucleus.
Since current studies in the open literature are mainly focused on a single type of salt, a systematic comparison of different salts on their different solubilities in SCW with the related mechanism analysis in salt precipitation is not available. To fill this gap, in this paper, NaCl, KCl, CaCl2, Na2SO4, and Na2CO3 were selected as model salts, and through a combination of experiment and molecular dynamic simulations, the influence of different anions and cations on the dissolution and precipitation behavior of salt in supercritical water is explored.
2. Experimental Process and Simulation Method
2.1. Experimental Device and Process
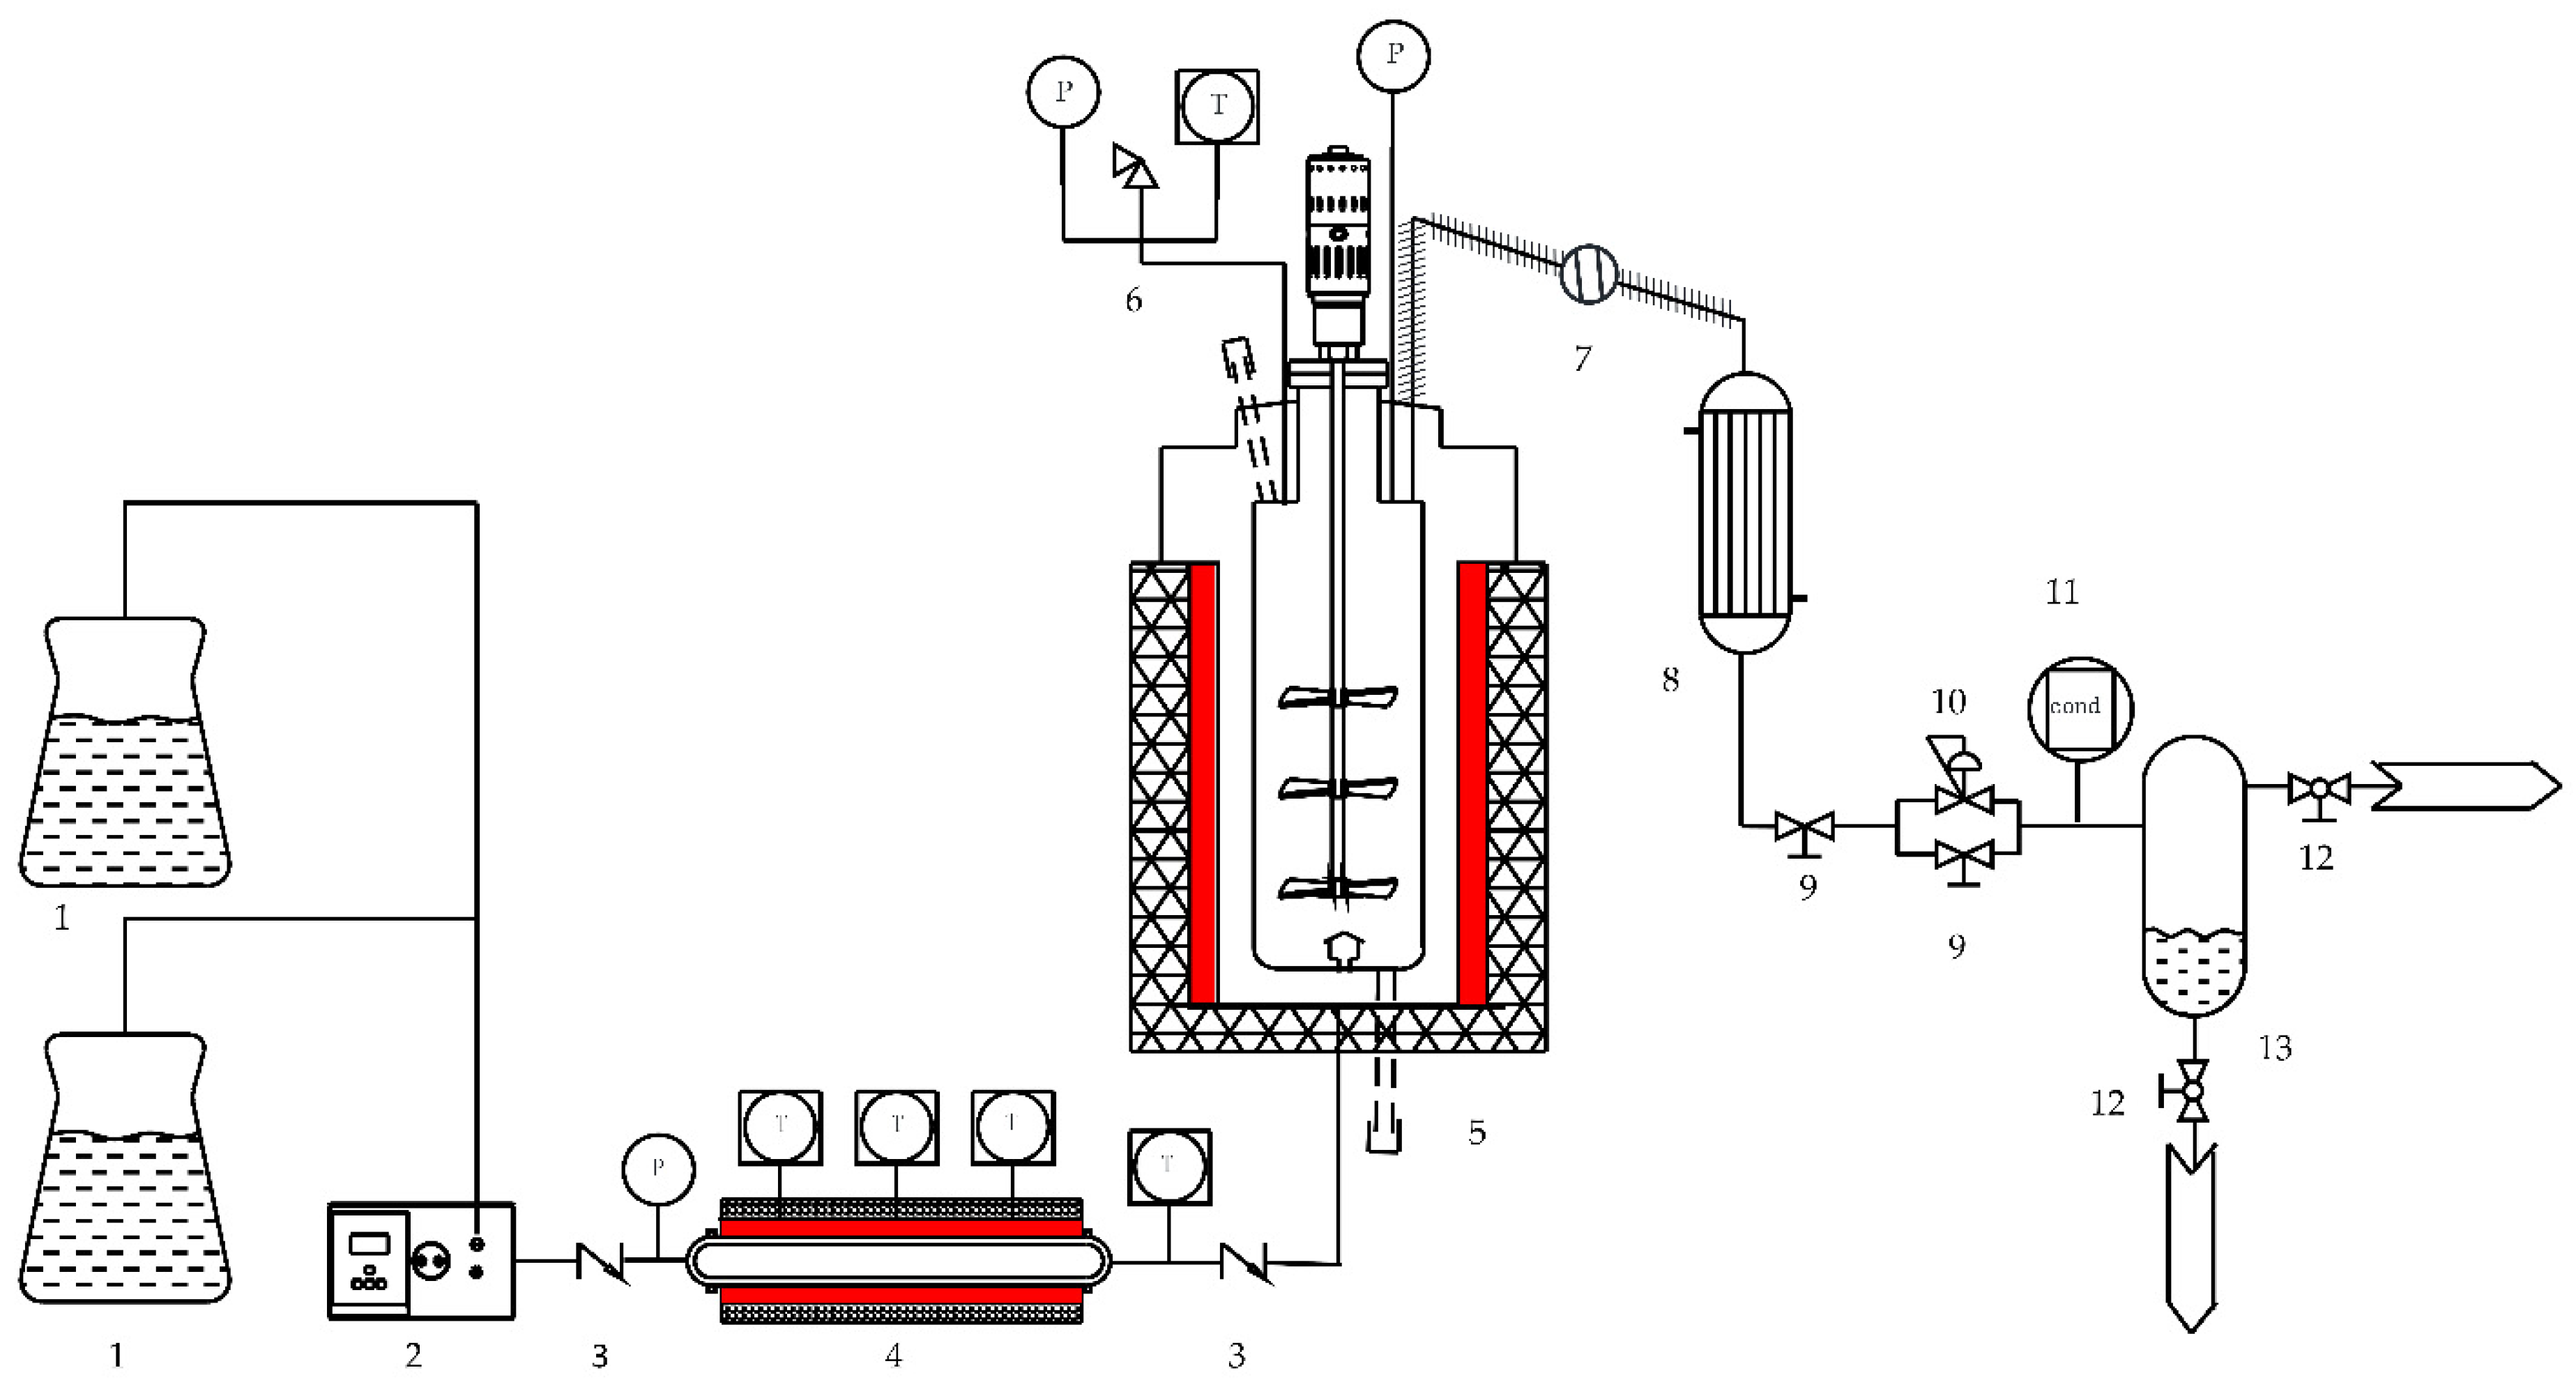
To avoid the corrosion problem by inorganic salts in supercritical water, the experimental device (Figure 1) was composed of Inconel 625 stainless steel with excellent corrosion resistance. The internal volume of the reactor was 1000 mL (inner diameter, 100 mm; height, 250 mm). The temperature of the system is measured by thermocouple (±1 K), and the temperature sensor is used for transmission and output recording. Temperature sensors were installed in the front, middle, and rear sections of the preheater, in front of the reactor where the fluid enters after preheating, and inside the reactor to effectively monitor and control the temperature of the reaction system in real time. Pressure in the experimental equipment is controlled and regulated by the high-pressure back pressure valve (R42LG-BBG-11-11-P, Amflo, Shanghai, China). The pressure sensor (±0.1 MPa) installed above the reactor can accurately measure and record the pressure of the reaction system. Salt crystals precipitated from solution also affect the operation of the device and data measurement. Therefore, a filter (SS10TF-MM-2, Swagelok, Solon, OH, USA) was installed in front of the back pressure valve to ensure that the salt crystals did not flow out of the apparatus, which would affect the validity of the experimental measurements. To ensure the safety of the experiment, bursting discs are installed on the top of the reactor. When pressure in the system is too high and exceeds the normal bearing range of the equipment (the design pressure of the device is 30 MPa), the pressure can be released through the bursting disc to avoid accidents.
Using a high-pressure pump (0–500 mL/min), the salt solution (1 wt %) was continuously pumped from the water tank into the reactor, preheated to a temperature as high as 573 K, and then heated to the supercritical temperature by an electric heating furnace. Pressure in the reaction system was checked and adjusted to the investigated conditions by a back pressure valve. The effluent material was cooled to ambient temperature through a tubular condenser. Lastly, an online conductivity meter was installed as a record of the conductivity of the fluid in real time to monitor the salt precipitation of the salts in supercritical water.
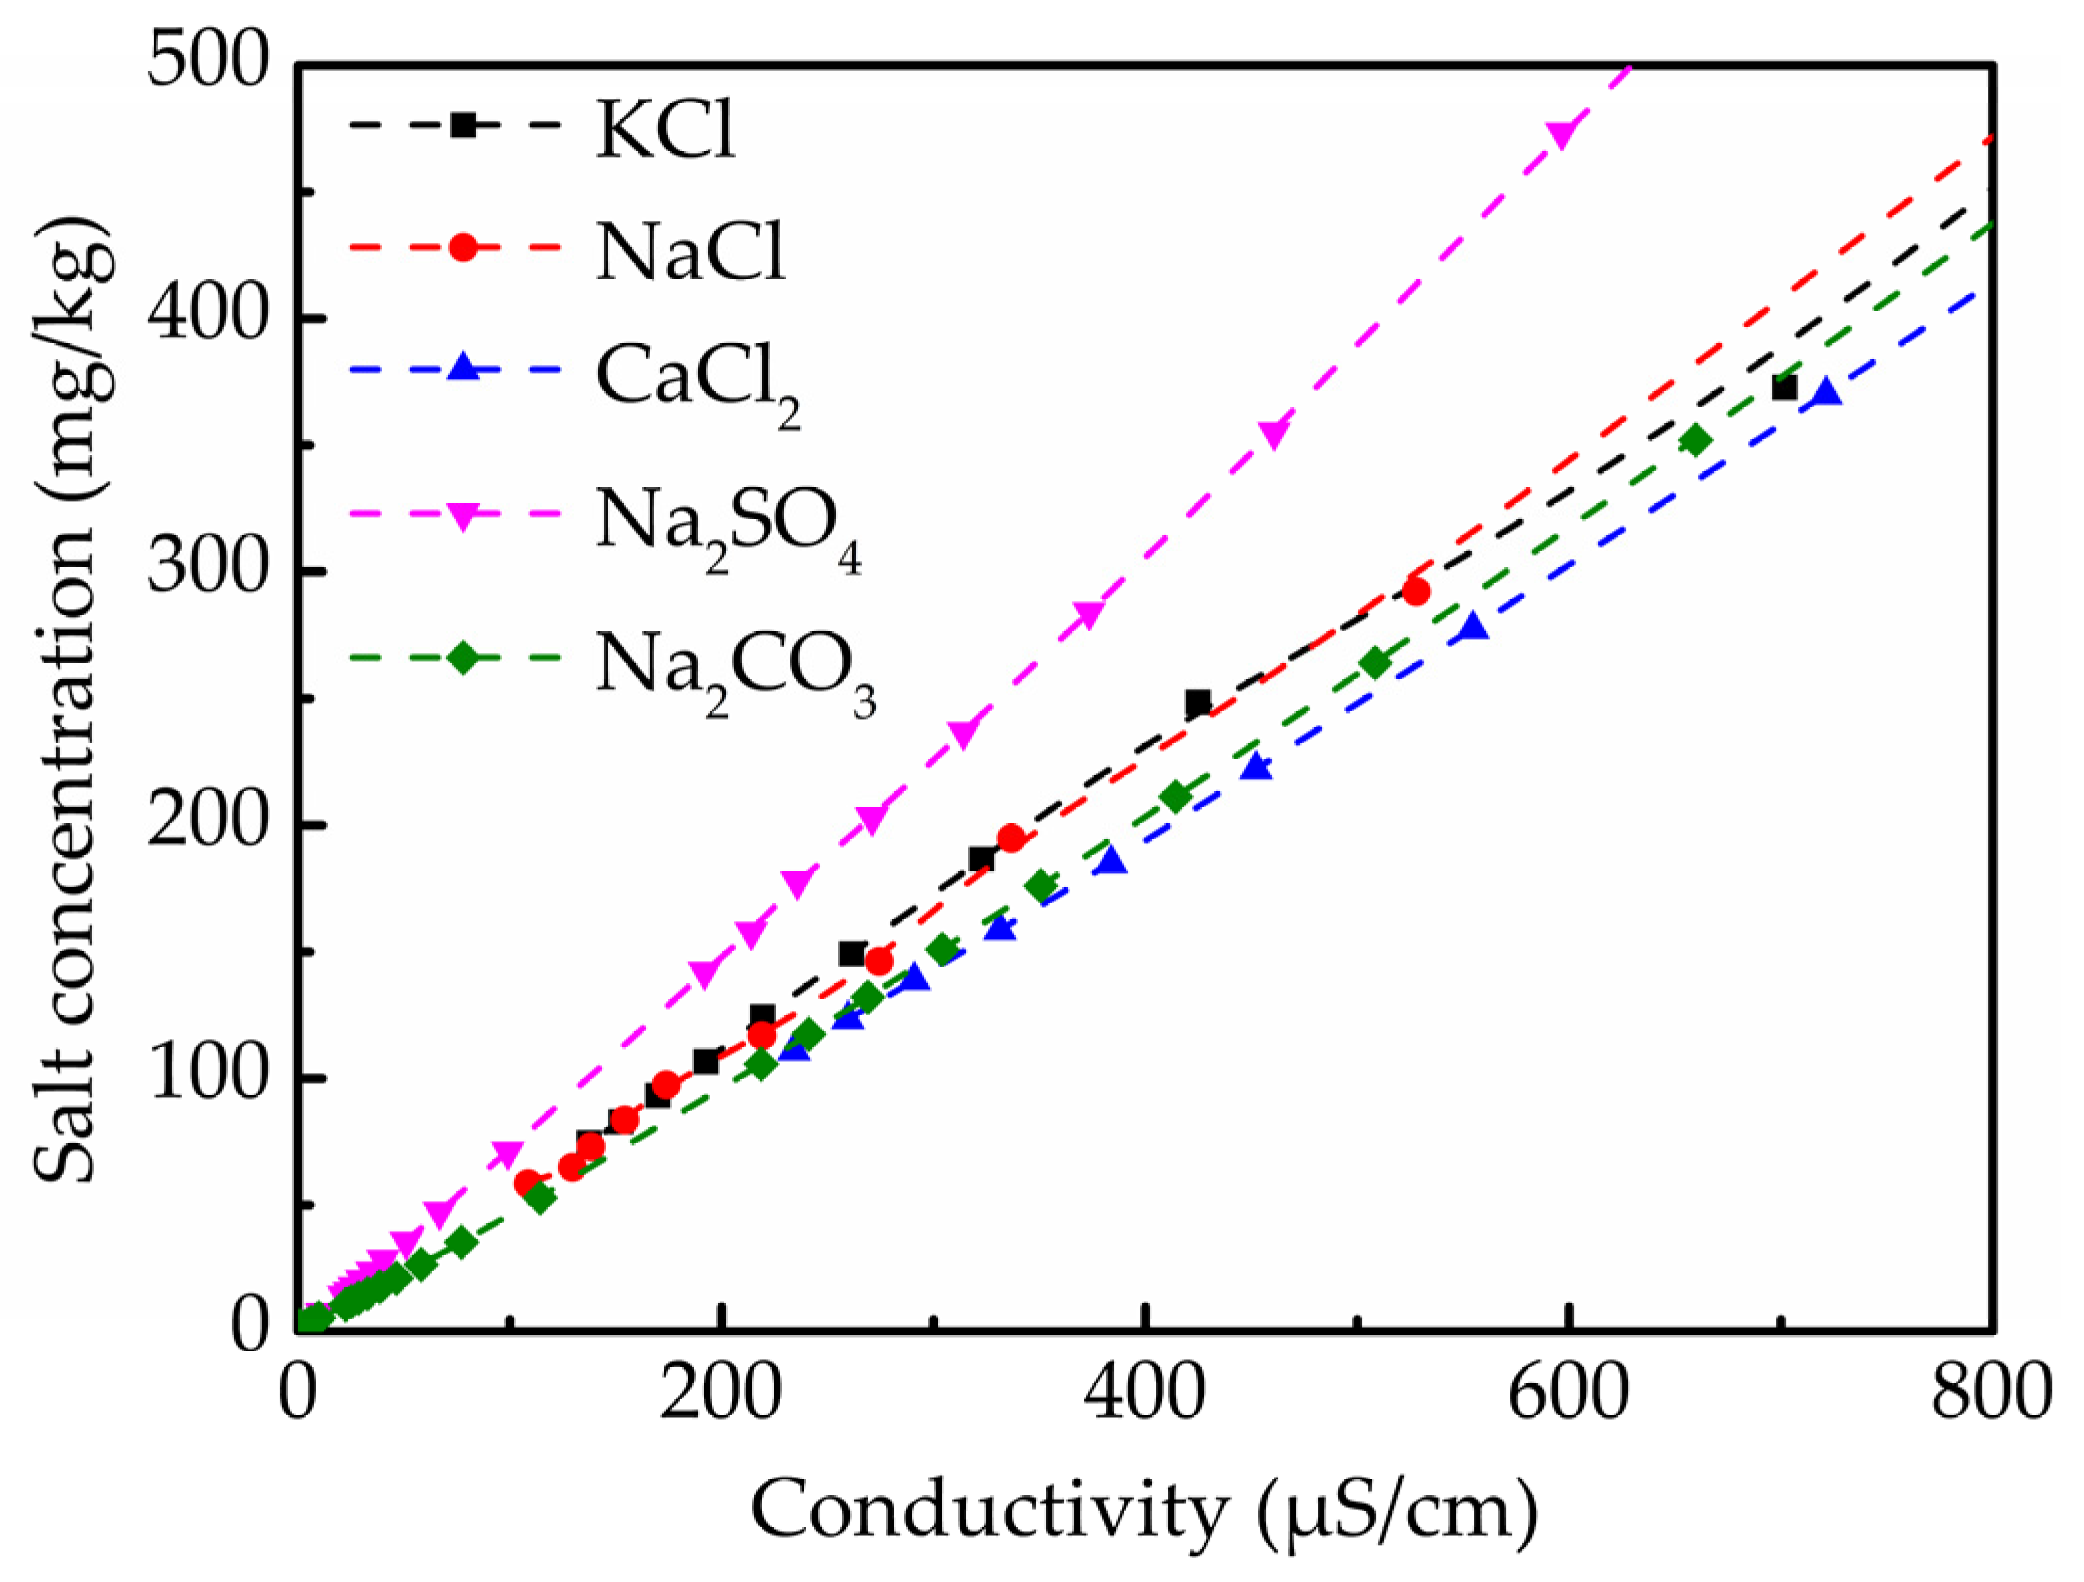
To convert the experimentally measured conductivity into concentration, the relationship between salt concentration and solution conductivity was calibrated into a second-order polynomial (see Equation (1)) [17]. The calibration curves between the concentration and conductivity of different salts are shown in Figure 2. The detailed fitting parameters are listed in Table 1.
where S is the salt concentration (mg/L), σ is conductivity(μS/cm), and A, B, and C are the coefficients of the corresponding terms.
2.2. Molecular Dynamics Simulation
The molecular dynamics simulation was completed by the Forcite module in materials design software package Materials Studio, developed by Accelrys. The molecular force field was based on COMPASS II [18], which is the updated version of COMPASS [19], whose validity for supercritical water property calculation has long been verified [20]. For ionic species, a model consisting of the electrostatic term described by the Coulomb potential and the van der Waals term described by the Lennard–Jones 9-6 potential was adopted [21].
The thermodynamic ensemble of the simulation system was according to the NPT ensemble. The NHL method [22] was selected for temperature control, and the Berendsen method [23] was selected for pressure control. Electrostatic interactions were calculated using the Ewald method [24]. Van der Waals interactions were calculated using the atom-based method, and the cutoff radius was half of the lattice. The equations of motion were solved by the Verlet leapfrog algorithm [25] with an integration time step of 0.5 fs. In addition, total simulation time was 2000 ps. The lattice structure adopted periodic boundary conditions. Molecular dynamics simulations of various inorganic salts under supercritical conditions (23 MPa, 673 K) are carried out to study and analyze the influence of the difference between anions and cations on the dissolution and precipitation behavior of inorganic salts in supercritical water.
3. Model and Theory
3.1. Thermodynamic Phase Equilibrium
On the basis of the phase equilibrium of the solid salt and supercritical water phases, a semiempirical and semitheoretical calculation model was proposed with good performance in the prediction of salt concentration [26,27,28,29]. It is based on the assumption that the formation of solid salt occurs through two steps: in Step 1, the saltwater complex phase is formed, and in Step 2, the saltwater is disassociated, which leads to the precipitation of the salt phase. Equations (2) and (3) are a description of the above process:
where Mec+ and Xd– are cations and anions, respectively; a and b are the number of atoms in the salt molecules; c and d are the valences occupied by the corresponding ions; s and f represent the solid phase and supercritical fluid phase, respectively; and n, m, and p refer to the number of water molecules required for solvation.
The phase equilibrium constant was defined according to Equation (3):
Here, α is the activity coefficient for the components in the equilibrium system.
To simplify this model, we assumed the following:
- Activity coefficient of solid salt is 1;
- The interaction between particles in supercritical water was ignored;
- The fluid phase is an ideal fluid.
The activity coefficient of the solvated salt was thus approximately replaced by the concentration of the salt, and the activity coefficient of water was approximately expressed as the density of the pure solvent. The approximate expression of the saltwater complex dissolution equilibrium constant is
Here, is the density.
The transformation of Expression (5) can be obtained:
Equilibrium constant is expressed by the Arrhenius equation:
Substituting Equation (7) into Equation (6) gives
where R refers to the universal gas constant, T is the system temperature, Gsolv the Gibbs free energy, Hsolv the enthalpy of the solvent, and Ssolv the entropy of the solvent.
3.2. Potential Energy of the Solution
In the electrolyte solution, there are two main interactions with the ions: one is the mutual attraction between ions, which acts as an ion association; the other is between ions and water, which acts as ionic hydration [4] and is quantitatively indicated as the binding energy (Ebind) of the system. Zhang et al. [16] analyzed the binding energy of Na2CO3 and K2CO3, and found that binding energy and solubility are positively related. However, considering this, for different types of salt, the solubility of the salt should also be introduced for the stability of the salt cluster structure. With stable clusters, it is easy to resist hydration and maintain the shape, and easy to precipitate out of the solution, showing low solubility.
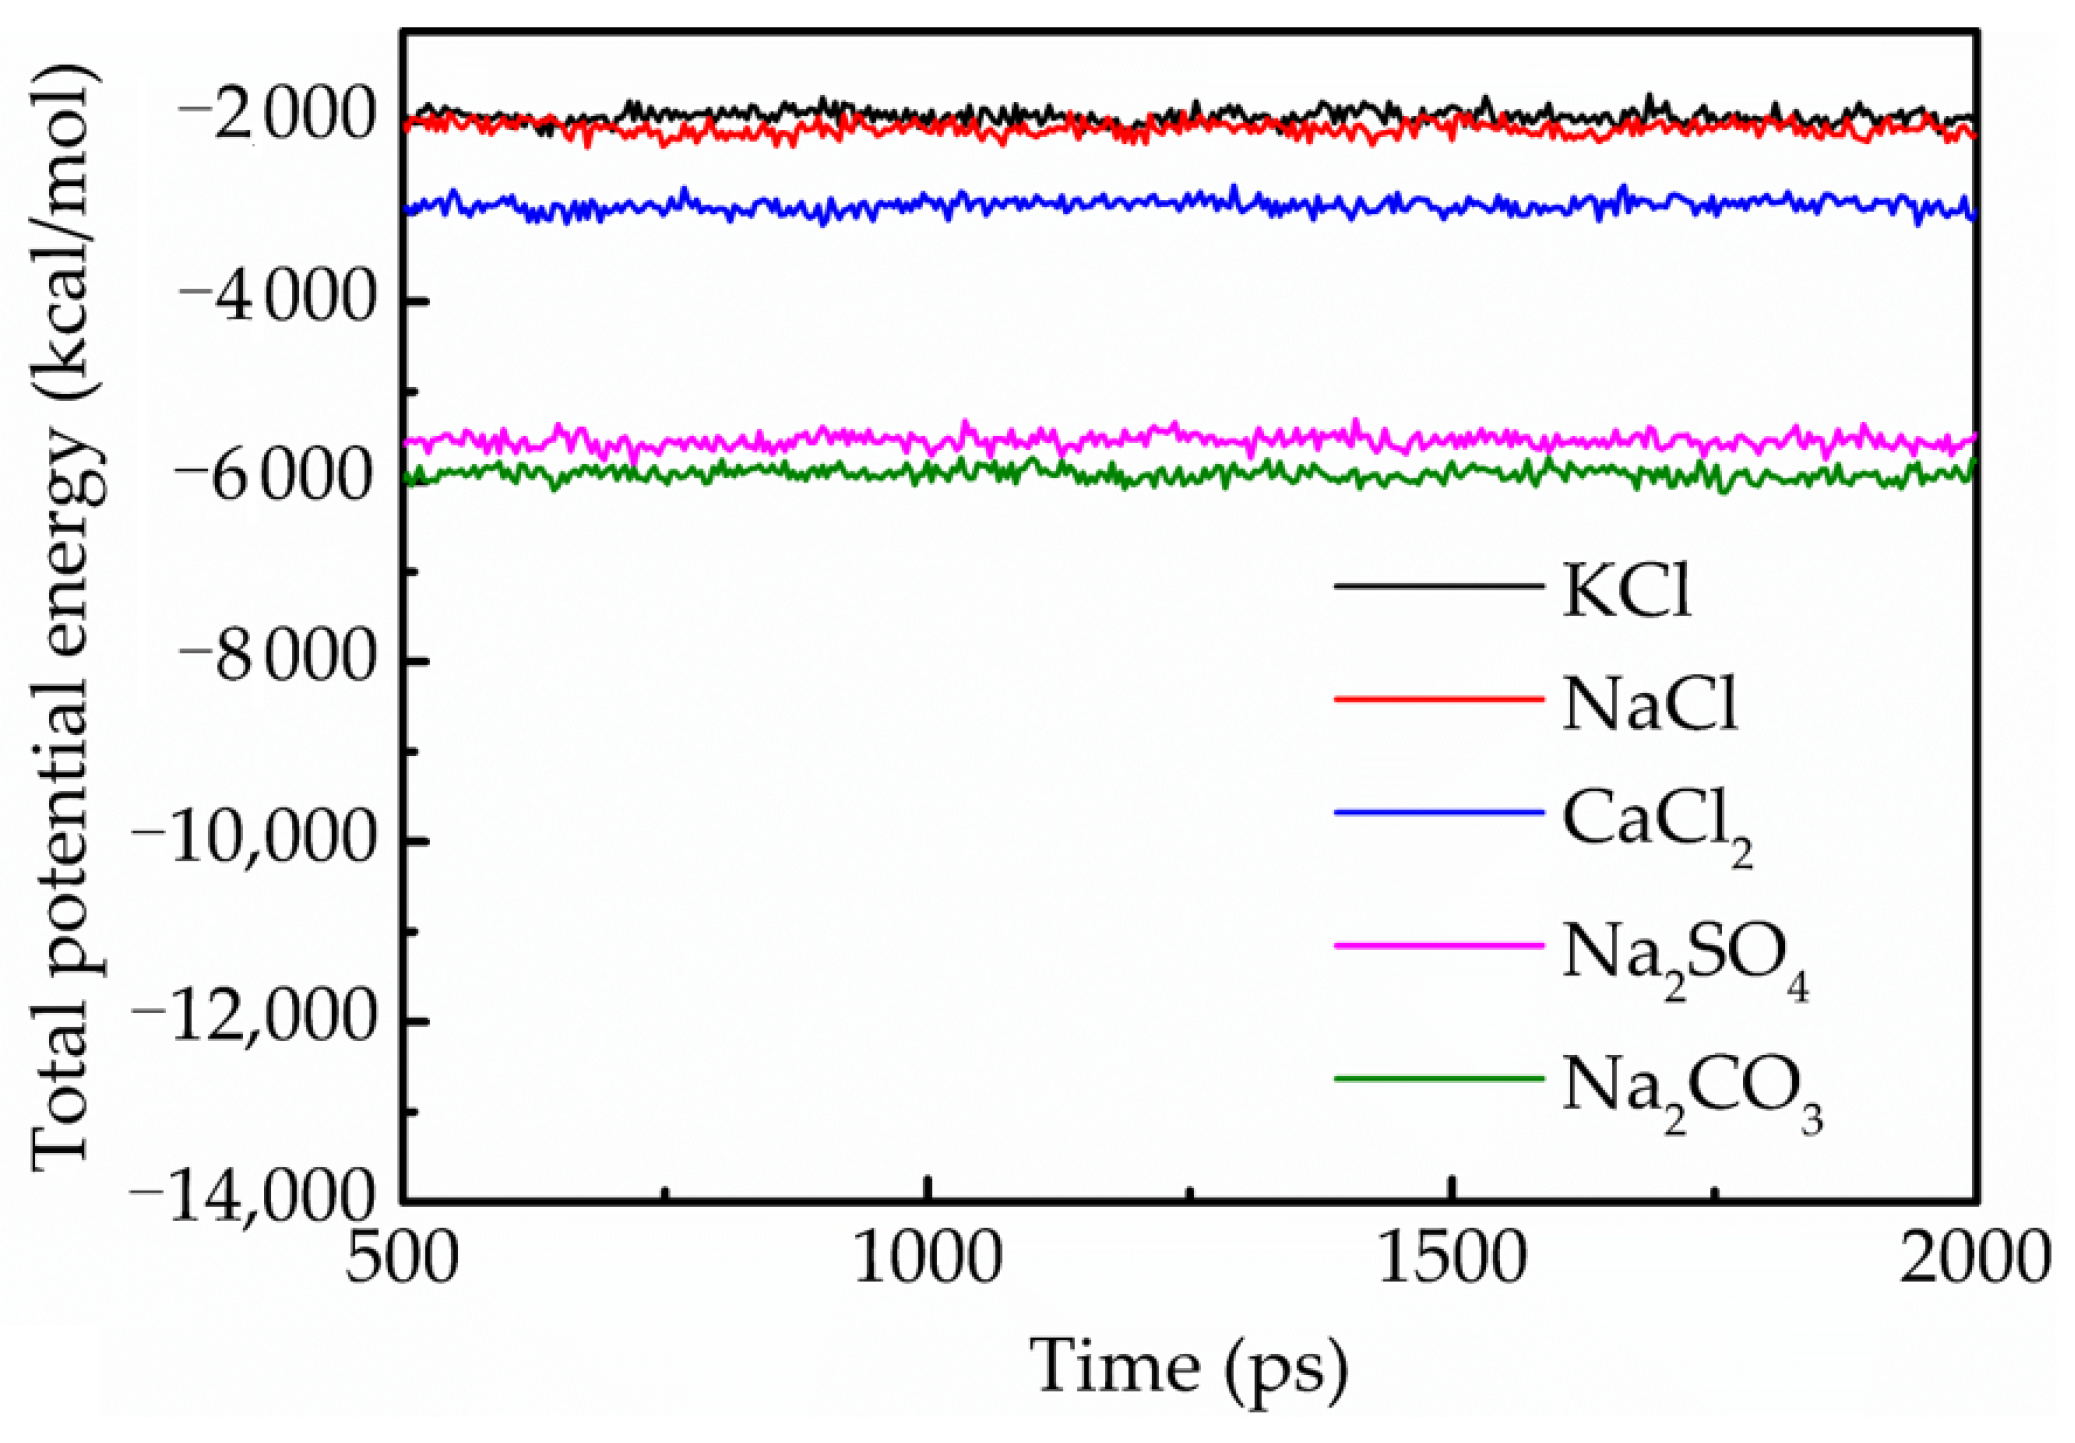
The stability of the cluster structure can be represented by the potential energy of the salt (Esalt). The greater the potential energy is, the stronger the interaction between the ions in the cluster, and the more stable the structure. Taking into account the two competing effects and assuming the potential energy (Ewater) of the water is not much different, the total potential energy of the solution (Esolution) is obtained from the energies of dissolution and precipitation differences of the salt:
Esolution in Equation (9) is an important parameter for microscopic interactions [16], which is mainly composed of chemical bond energies, including cross-term interactions (Ecross) and valence interactions (Evalence), and chemical nonbond energies, including van der Waals interactions (Evan), electrostatic interactions (Eelect), and hydrogen bonds (EH-bond). Since the number and strength of hydrogen bonds in the supercritical system drop sharply, the influence of hydrogen bonds is so small that it is negligible. Therefore, the potential energy is lastly calculated as Equation (10):
4. Results and Discussion
4.1. Precipitation Process Simulation
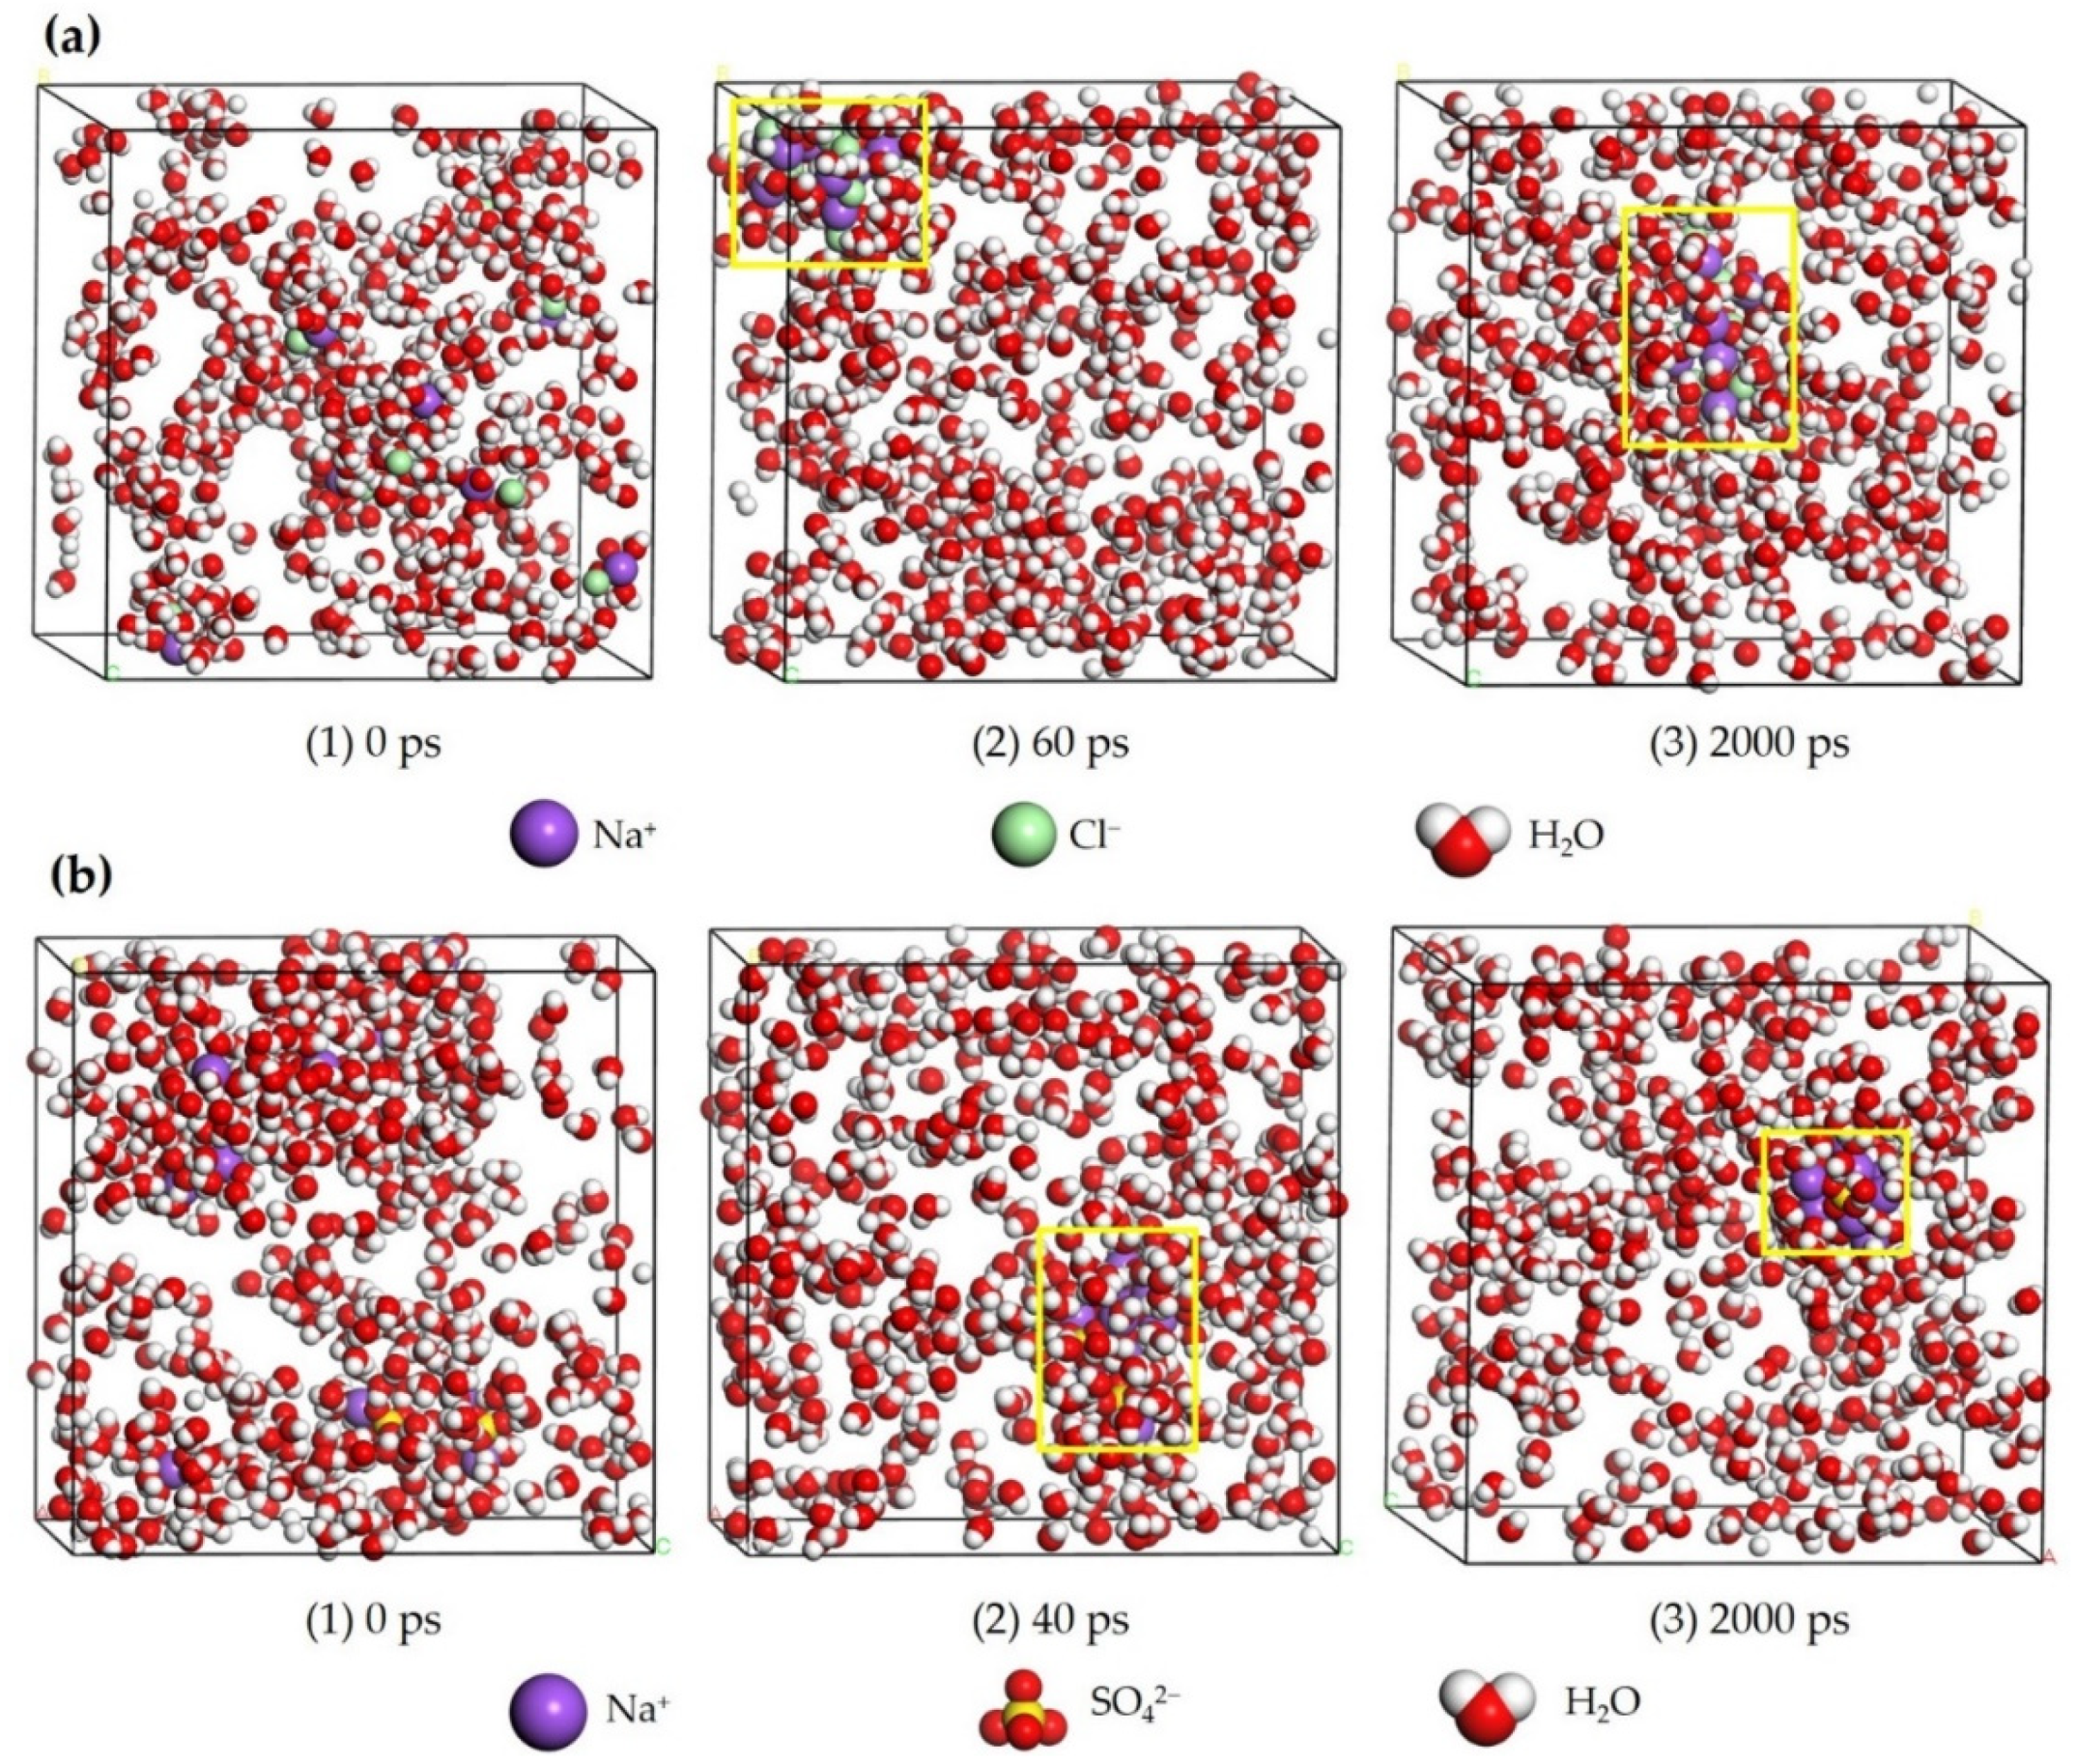
As shown in Figure 3a, at 0 ps, free Na+ and Cl− were randomly distributed and surrounded by water molecules to form solvated hydrated ions. At 60 ps, the hydrogen bond network in the system was quickly destroyed, and the electrostatic shielding effect of hydrated ions was reduced. The positive and negative ions attracted each other, collided and formed nucleus under electrostatic interactions. Compared with Figure 3b, the difference was that Na2SO4 aggregated faster and formed a nucleus at approximately 40 ps. After 500 ps, the cluster structure existed stably under supercritical conditions, and the cluster structure of Na2SO4 was more compact than that of NaCl, indicating that the cluster structure of Na2SO4 was more stable, which resulted in a much lower equilibrium concentration of Na2SO4. As with NaCl and Na2SO4, the deposition process in supercritical water is extremely fast for various other inorganic salts, and the phenomenon of cluster aggregation occurred within tens of picoseconds.
4.2. Equilibrium Concentration of Different Salts
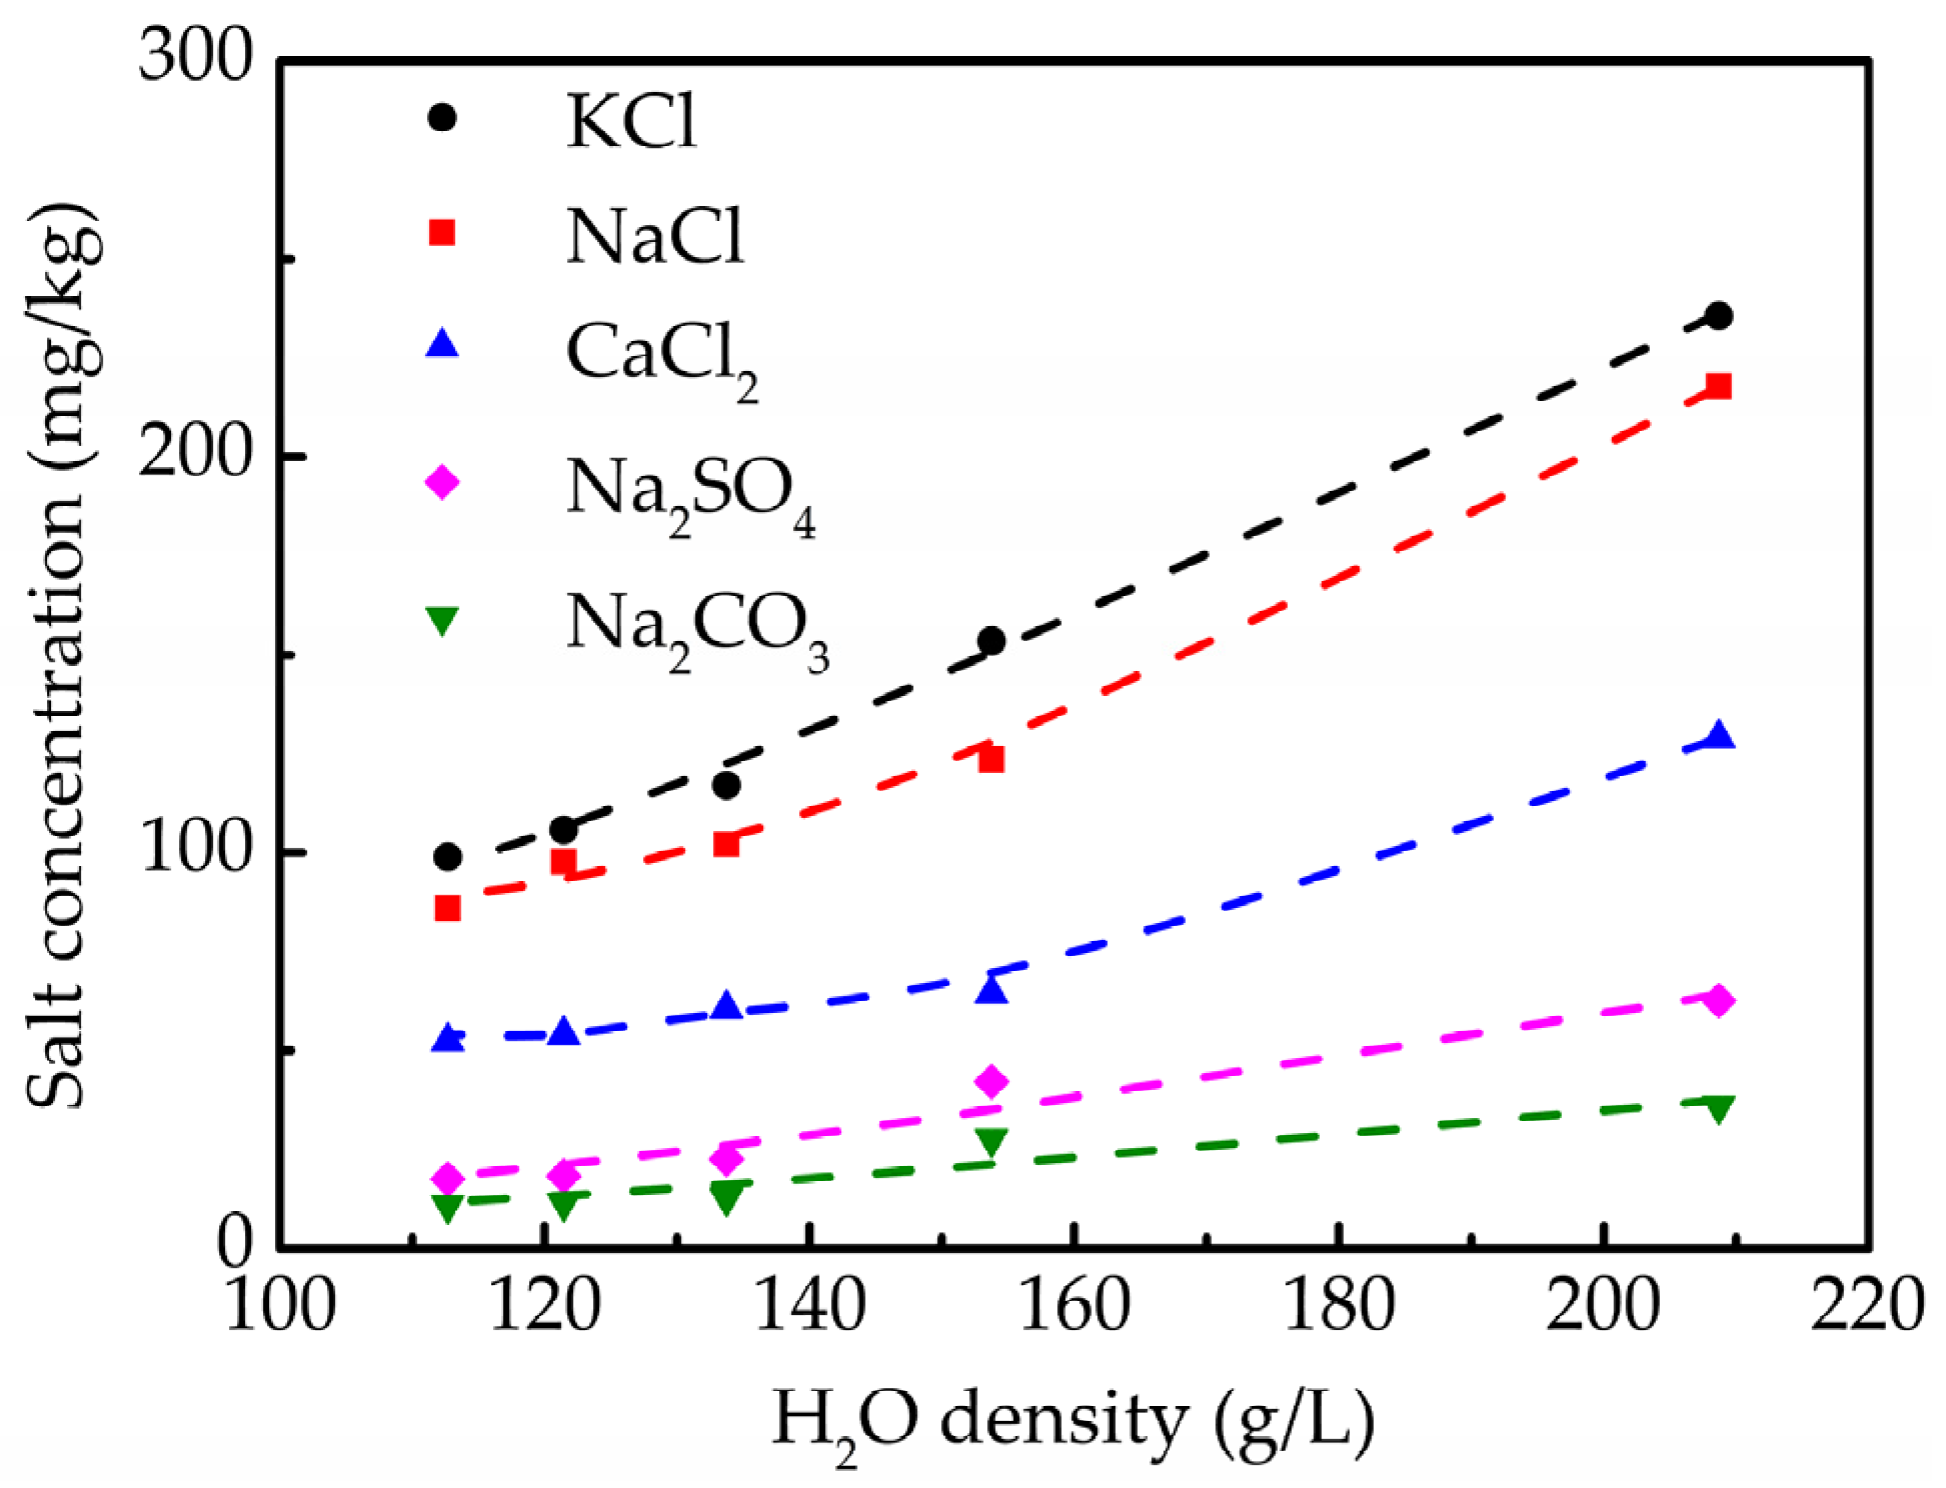
The equilibrium concentrations of different inorganic salts in the range of 653–693 K under 23 MPa were experimentally measured. Figure 4 shows that the solubility of inorganic salts under supercritical conditions is extremely low, and its trend with temperature is consistent. With increasing temperature (decreasing density), concentration decreases and gradually tends to be flat, which is consistent with most related studies [1,27,30]. Especially in the supercritical state (P = 23 MPa, T = 693 K), the concentration is less than 130 mg/kg. Experimental data were fitted and calculated by combining Equation (8) obtained from electrolyte equilibrium theory to predict the further equilibrium concentration of salt in supercritical water (shown by the dashed line in Figure 4). The fitting effect was very good, which indicated that the model could describe the salt precipitation process in supercritical water well. Both the experimental data and fitting results indicated that the solubility of salt decreases with a decrease in water density, which can be explained as the electrostatic shielding effect of water molecules on ion weakening, which is more conducive to ion collision and the association to form initial cluster crystals. Therefore, the higher the temperature (the lower the density) was, the lower the concentration that reached equilibrium.
However, there were great differences in the equilibrium concentrations of various inorganic salts, especially for types I and II salts classified according to the salt phase behavior by Valyashko et al. [31], and the concentration difference was even greater. Figure 5a,b show that the equilibrium solubility of NaCl, KCl, and CaCl2, which belong to the same type I salt, was significantly higher than that of Na2SO4 and Na2CO3, which belong to type II salt. At the same time, for salts with the same anion/cation, results enable us to establish a trend in the equilibrium solubility in the following decreasing order: K+ > Na+ > Ca2+ for various salts of Cl− and Cl− > SO42− > CO32− for salts of Na+.
4.3. Stability of Salt Cluster Structure
In order to reveal the difference in salt precipitation behavior in different systems, the interaction between particles in the system was investigated by molecular dynamics simulation. Potential energy in the salt solution under supercritical conditions obtained by molecular dynamics simulation showed that the energy of the cross-term and the energy of the valence interaction had negligible changes. In addition, the change in van der Waals energy was small compared with the change in electrostatic energy. Therefore, the potential energy is mainly affected by electrostatic interactions. Since ions mainly exist in the form of ion clusters in supercritical water, the solubility of salt in supercritical water is mainly determined by the stability of the cluster structure.
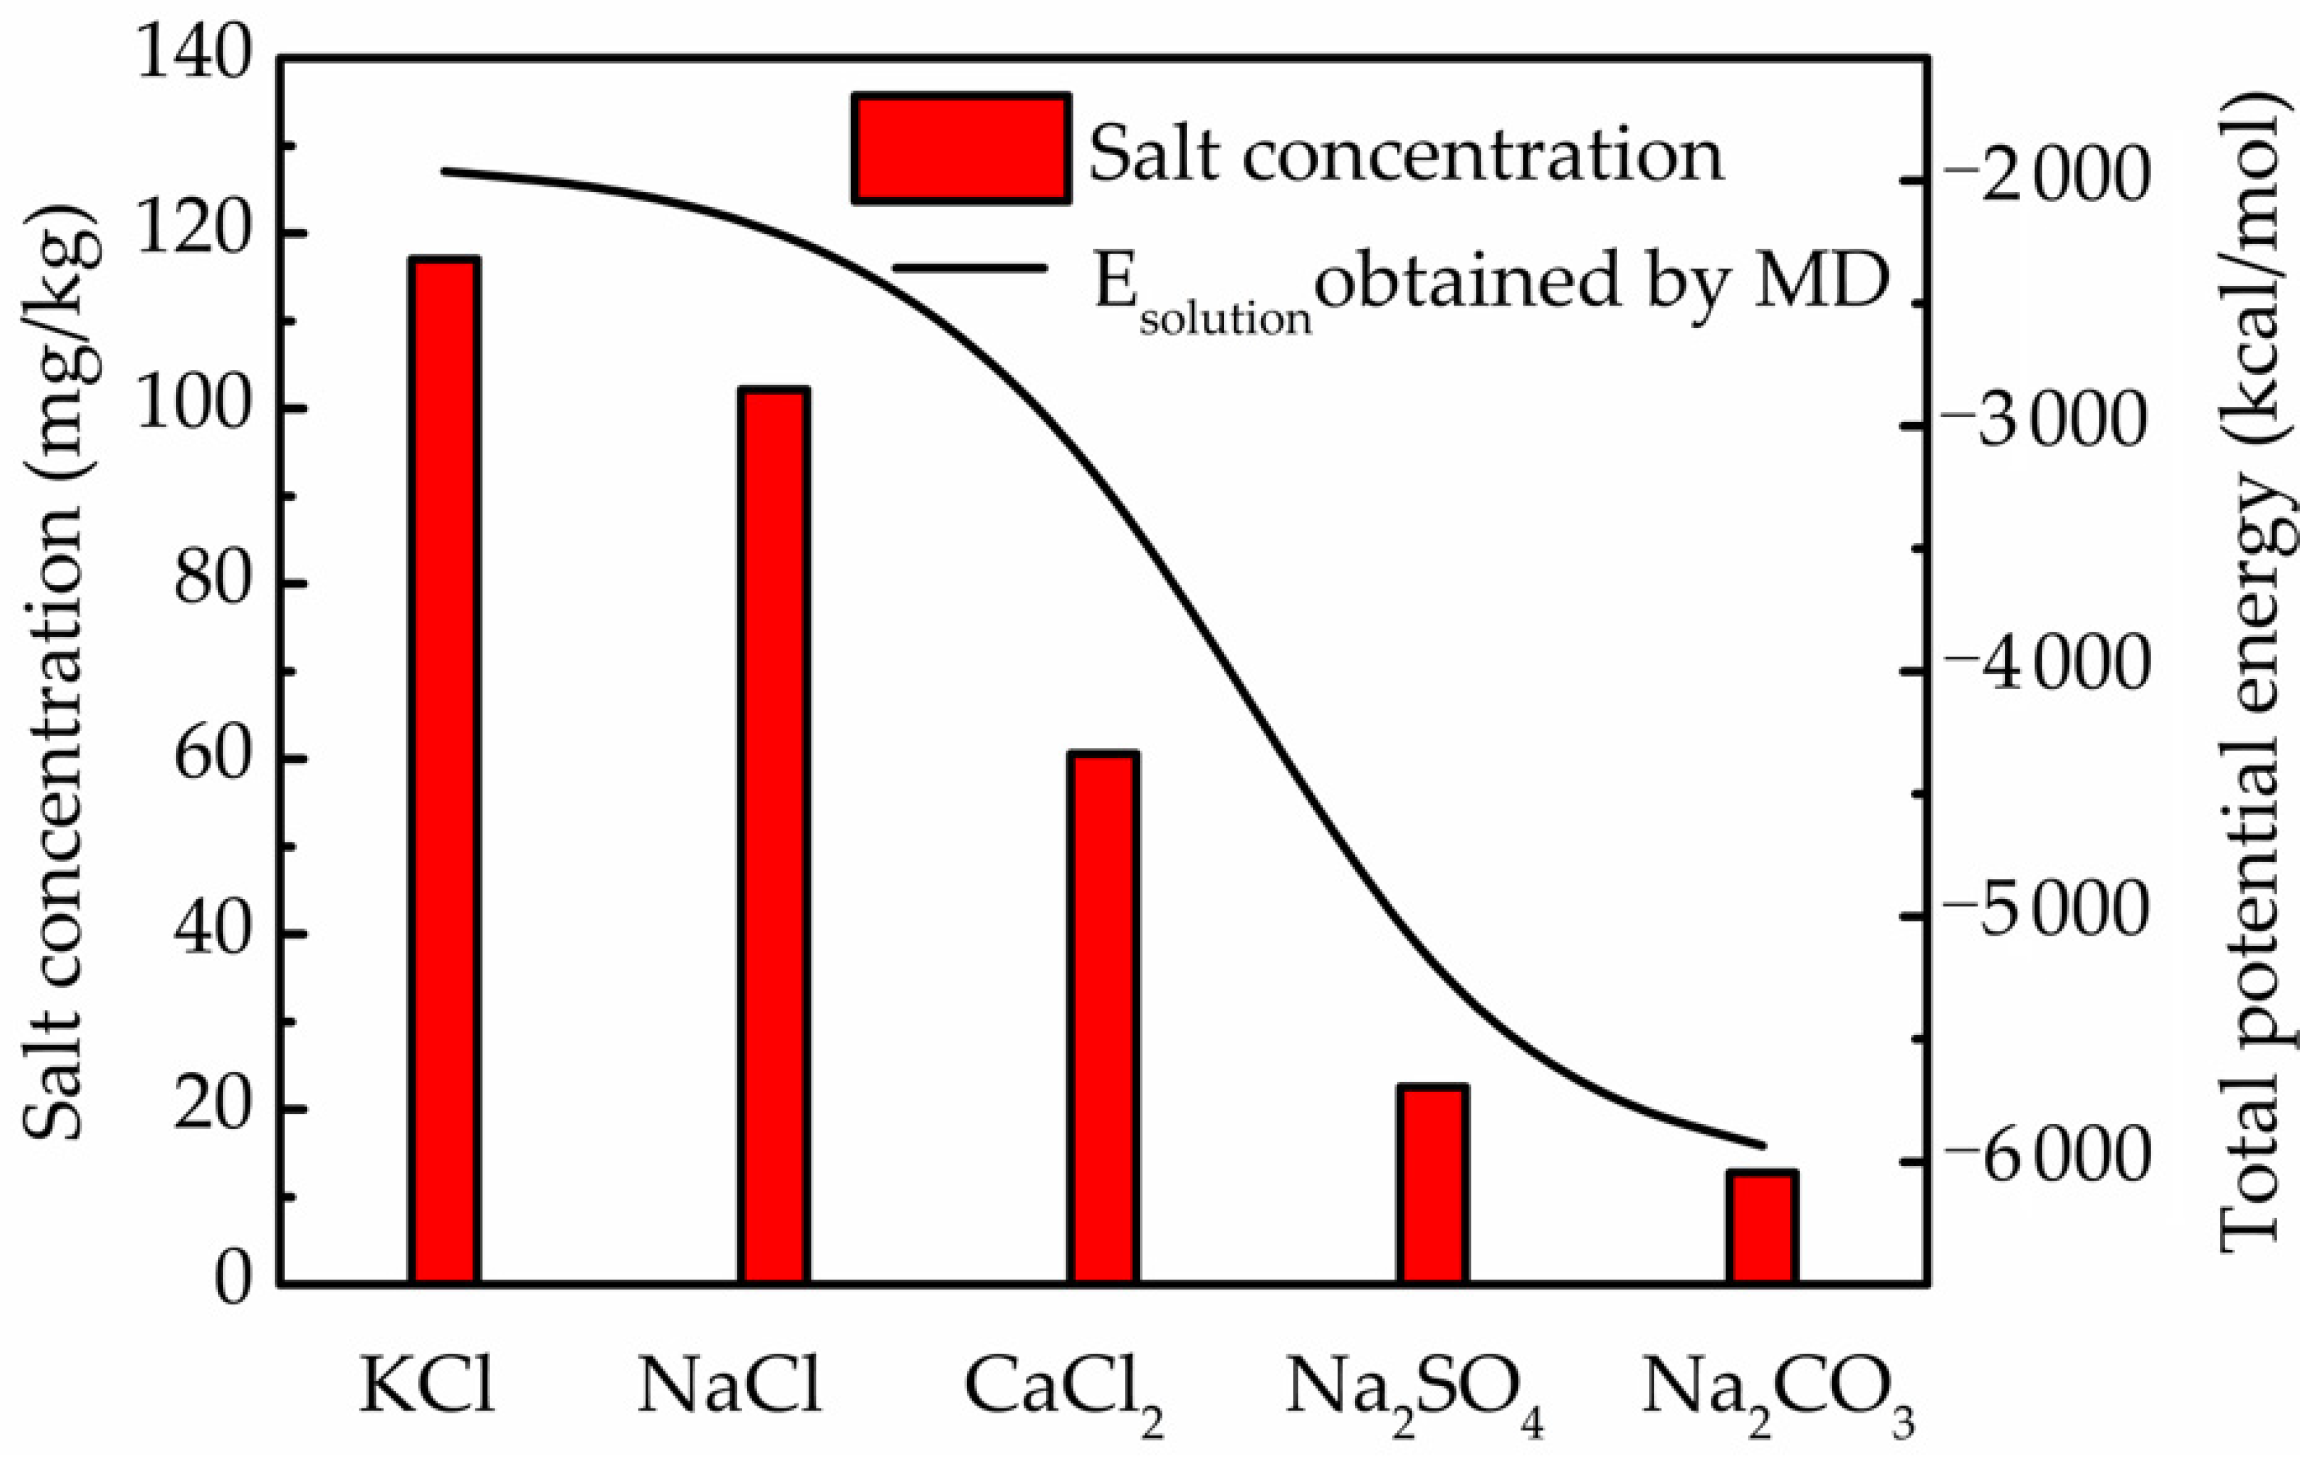
As shown in Figure 6, the total potential energy of each system was stable after 500 ps. The potential energy was negative, indicating that there was attraction between salt particles in the supercritical system. In addition, the relative size of the potential energy had the trend of Na2CO3 < Na2SO4 < CaCl2 < NaCl < KCl. Figure 7 shows the mean of the total potential energy in steady-state time obtained by MD and the equilibrium concentration measured experimentally of different inorganic salt systems. There was significant positive correlation between equilibrium concentration and total potential energy. Attraction between ions increased with the increase in the absolute value of potential energy, which led to the easy association of ions into ion clusters, and maintained a stable structure. Thus, it is easier for Na2CO3 to precipitate from the solution and show the lowest solubility, which explains the difference in solubility of various inorganic salts in supercritical water as S(KCl) > S(NaCl) > S(CaCl2) > S(Na2SO4) > S(Na2CO3).
Combined with the analysis of cation radius (Table 2), K+ had a larger radius, so the electrostatic interaction with Cl− was the weakest, and solubility was thus the largest. Na+ and Ca2+ have similar ionic radii, and both are smaller than K+. Therefore, Na+ is affected by the ionic radius, which causes the electrostatic attraction of Na+–Cl− and Ca2+–Cl− to be stronger than that of K+–Cl−, showing that the solubility is lower than that of K+. However, Ca2+ has more charges and greater electrostatic attraction with Cl−, so it is more prone to precipitation behavior than K+ or Na+. As the cations are the same, according to their ionic radius, carbonate has a smaller ionic radius than that of sulfate and is easier to crystallize, so there was the result of S(Na2CO3) < S(Na2SO4). Chloride ions have fewer binding sites as monoatomic ions than they do as polyatomic ion groups, and have the weakest ability to attract cations [28].
4.4. RDF and Coordination Number
To further study the interaction between particles in different salt systems from the microstructure, the radial distribution functions of each system were compared. The radial distribution function is defined as the probability density of a given particle relative to the random density of the system at the distance from the center r to :
where V is the total volume of the system, NB refers to the number of particles of B in the system, and is the number of particles from r to .
The radial distribution function g(r) can also be used to quantitatively calculate the coordination number NAB of the B particles around the A particles:
is the volume density of B particles.
4.4.1. Ion–Ion Interactions
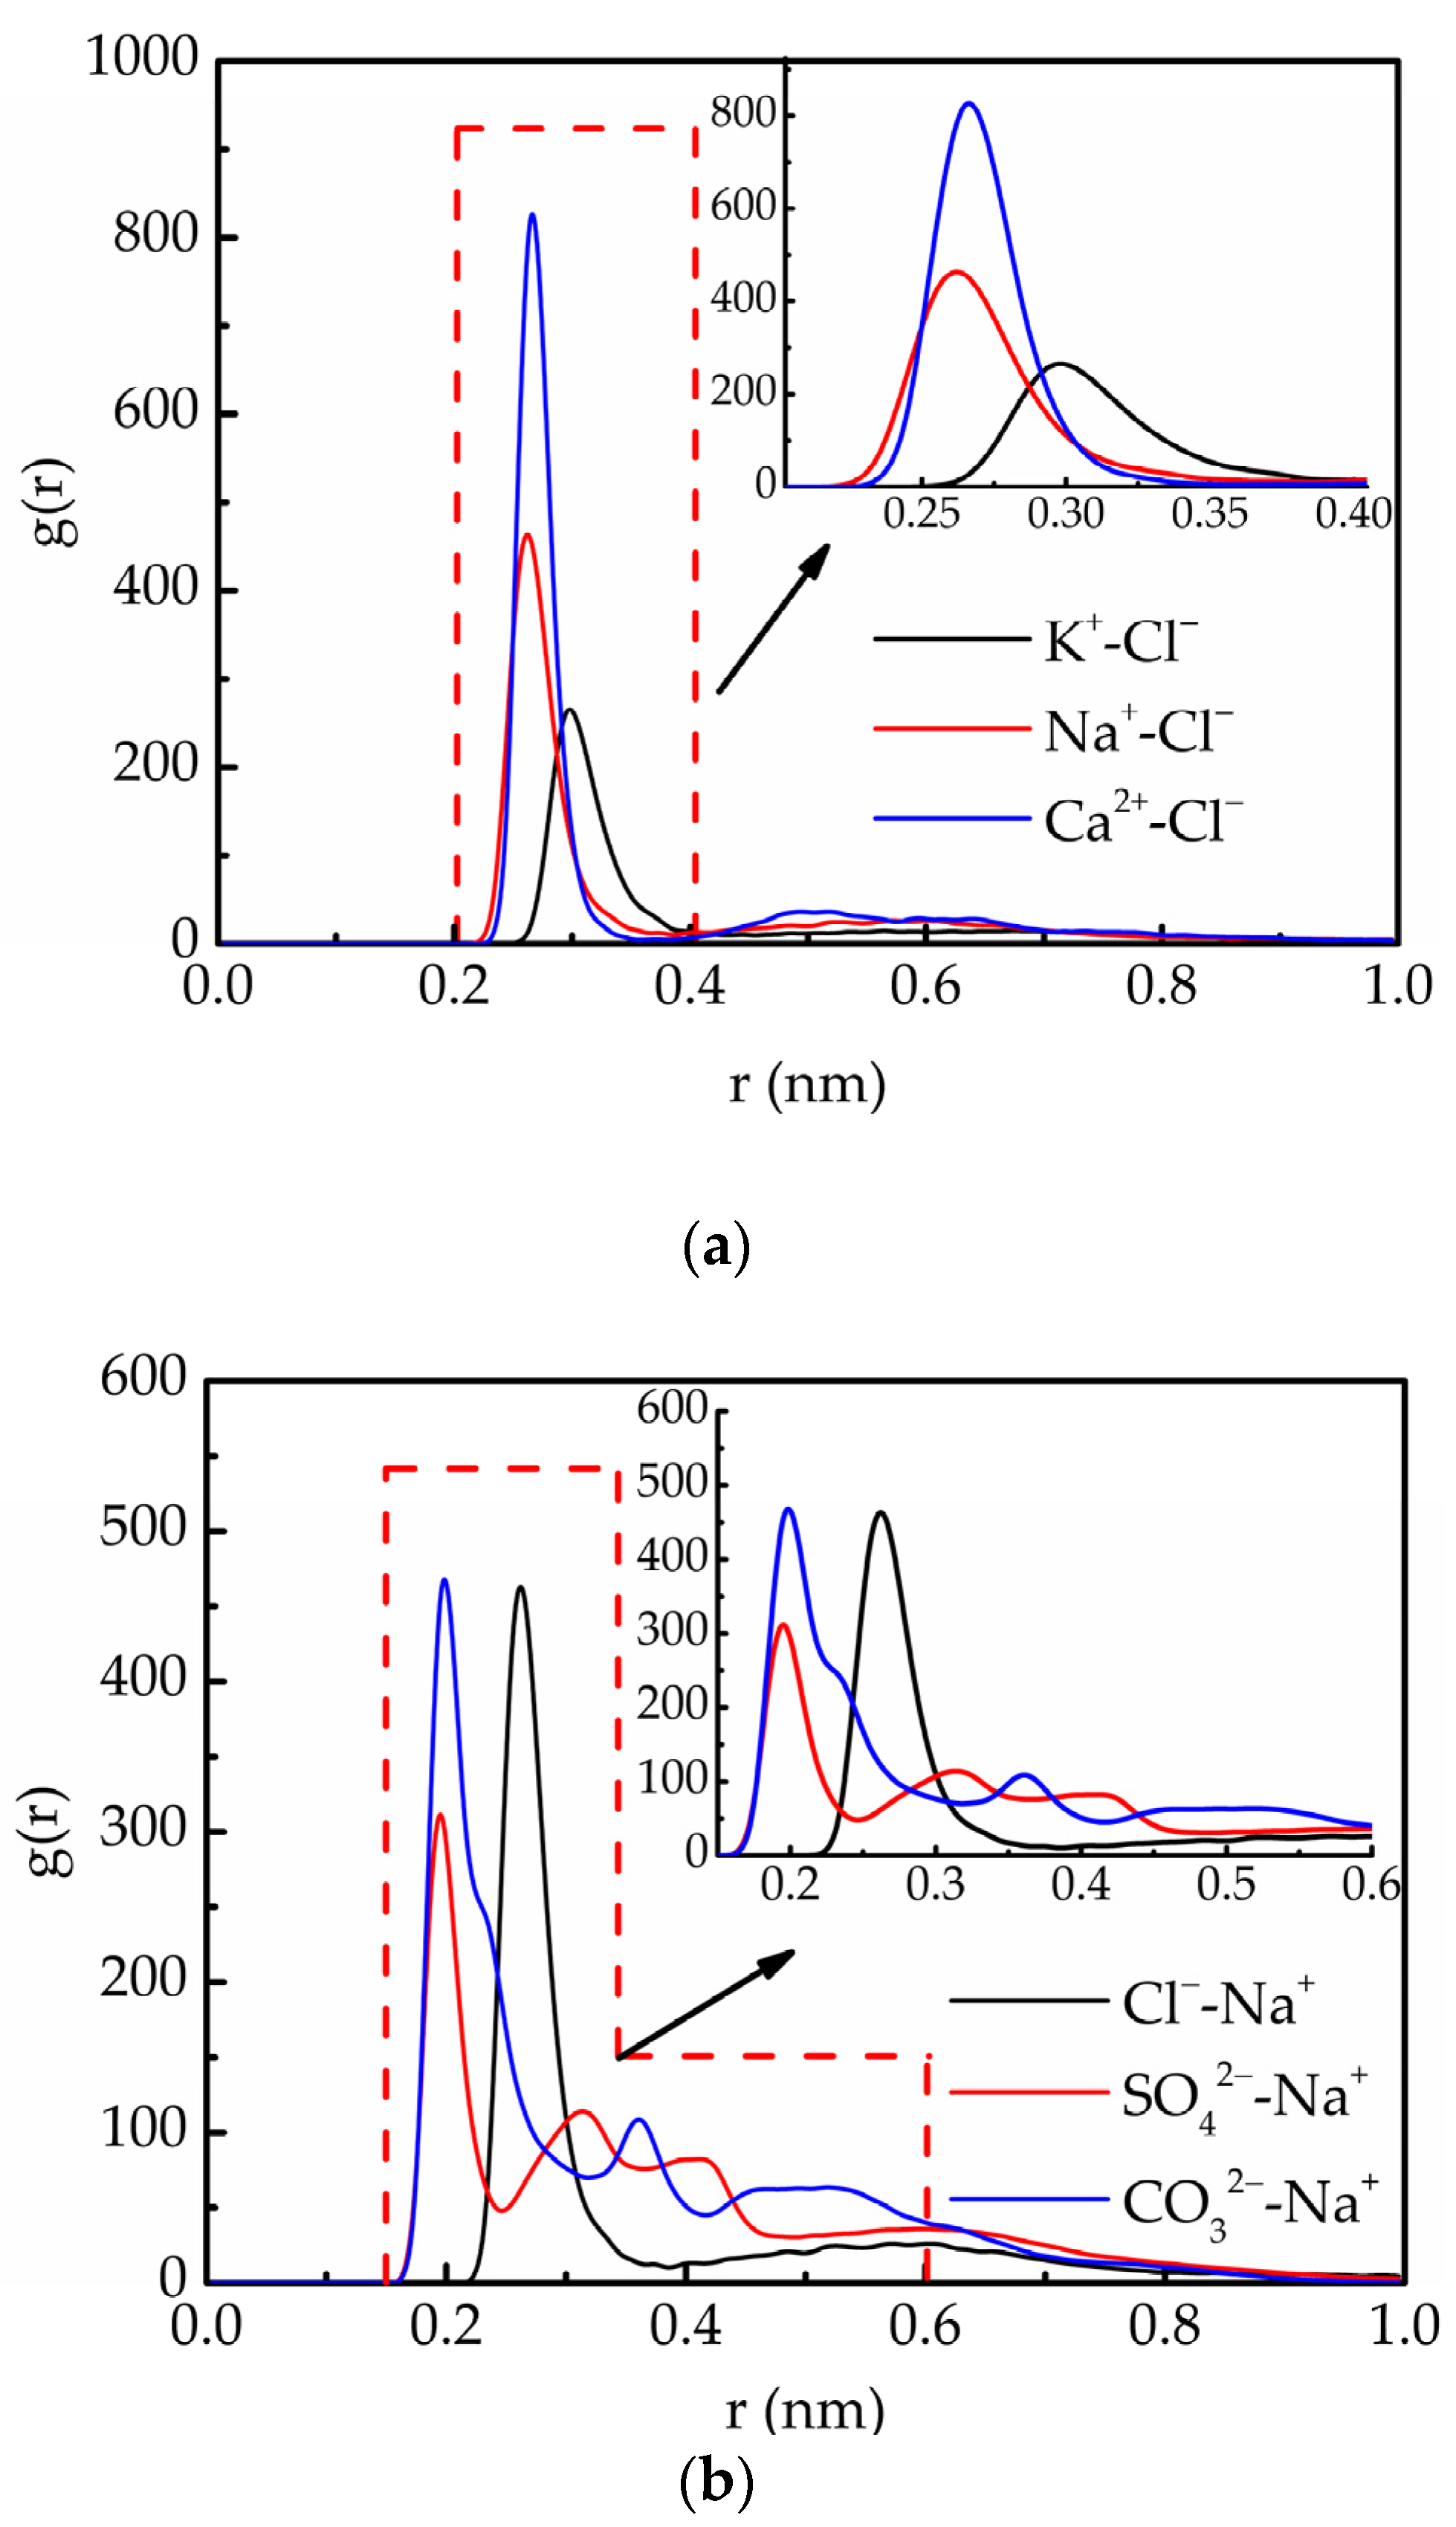
For the analysis of the microstructure, the way to fix one anion/cation identically and change the other ion is used to compare the performance differences of different ions. The radial distribution function between Cl− and each cation is presented in Figure 8a. Due to the difference in the radius of each ion and the effect of the electrostatic force, peak position and shape vary. The more left the peak position is, the stronger the interaction force and the closer the agglomeration are. The peak position of Na+ (0.265 nm) was less than that of K+ (0.295 nm), which is mainly ascribed to the small ion radius of Na+. The ionic radii of Ca2+ and Na+ are similar, but Ca2+ is a divalent ion, and the electrostatic attraction between Ca2+ and Cl− is stronger. In addition, according to the coordination number of each cation in the first coordination layer of Cl− (Table 3), Ca2+ has more coordination numbers, indicating that it has a stronger ability to bind Cl– and a more stable group cluster structure.
From the radial distribution functions of Na+ and various anions (Figure 8b), it can still be considered that each anion combines with Na+ to form ion clusters. The number of peaks directly reflects the change in architecture with distance. Generally, the more peaks there are, the more layers of coordination structure are considered, and the range of coordination layers can be determined by trough position. According to the number of peaks, compared with monoatomic ions such as Cl−, SO42− and CO32− have multiple peak positions. SO42− and CO32−, as polyatomic ion groups, have the ability to attract more Na+ and have more layers of coordination structure than Cl− does. Thus, their cluster structure is more stable. The end position of the coordination layer is established according to the trough position, and the range of the coordination layer between different ion pairs and coordination numbers of each layer are obtained, as shown in Table 4. SO42− and CO32− attract more Na+ in the short range (0–1.000 nm), forming a larger and more compact cluster structure. This can explain the relatively lower solubility of Na2SO4 and Na2CO3 in supercritical water, and why Na2SO4 and Na2CO3 behave as type II salts. The phase behavior is attributed to the stronger interaction between SO42−/CO32− and Na+, so they are more prone to crystallization.
4.4.2. Ion–H2O Molecule Interactions
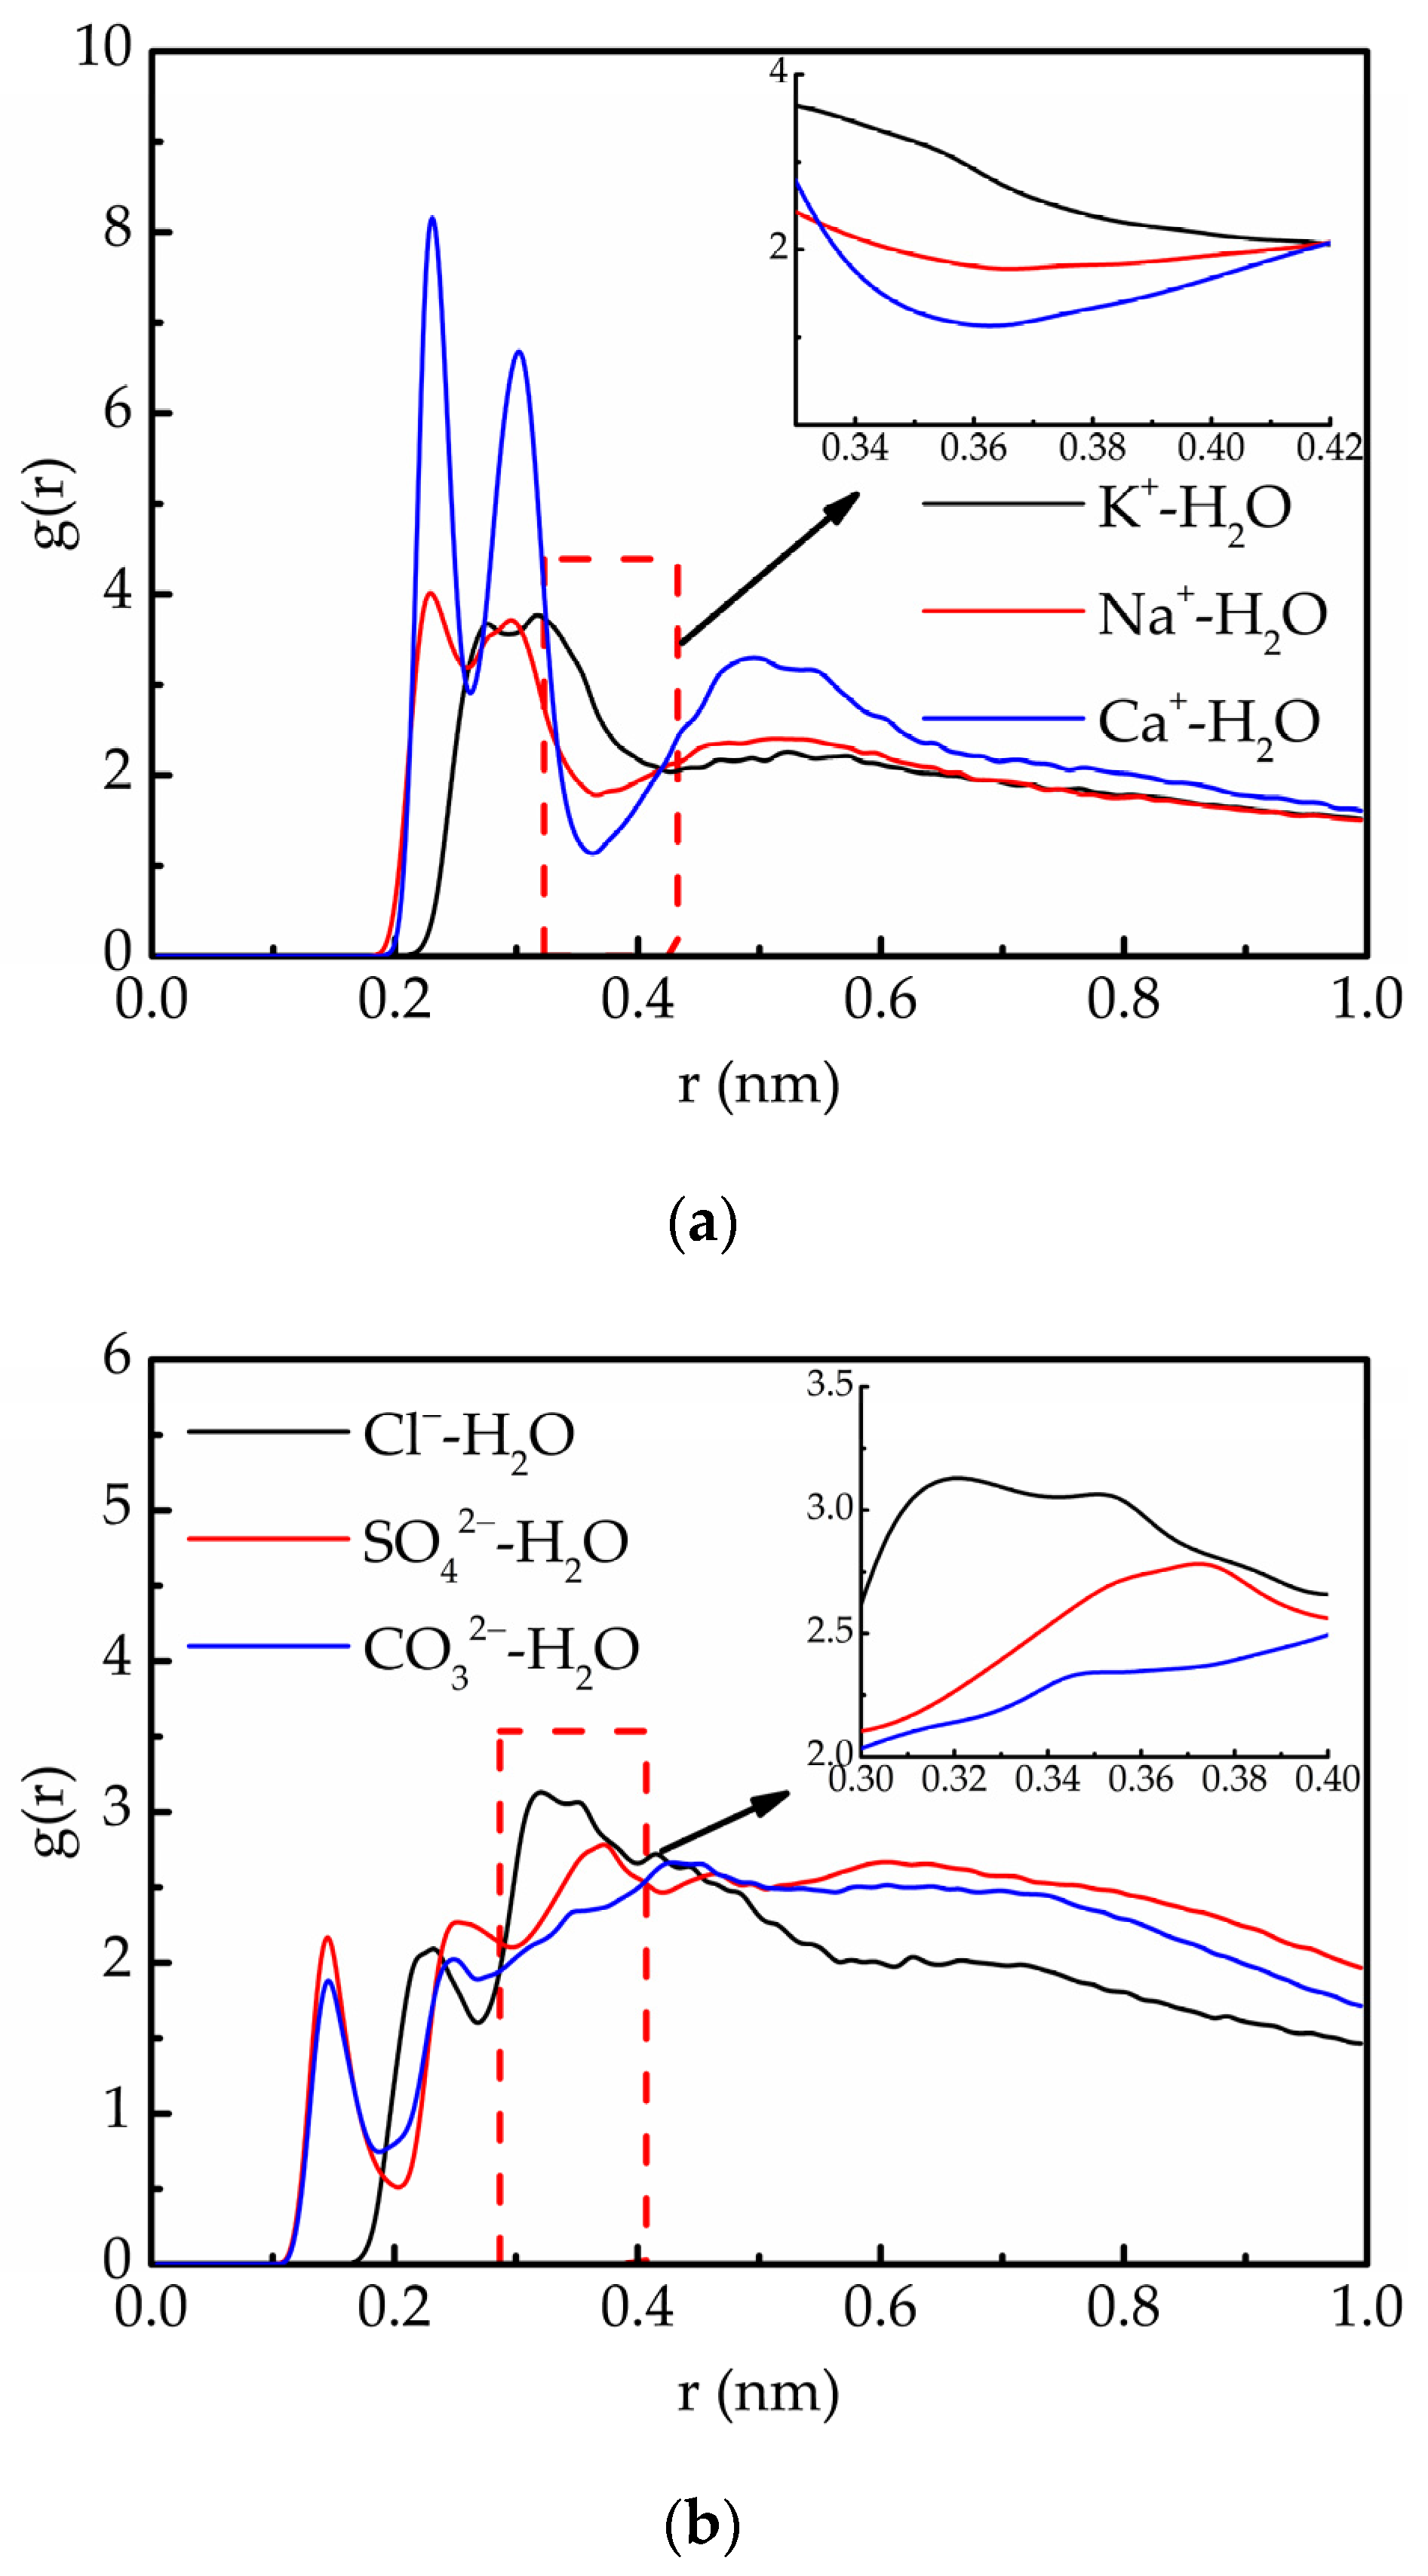
Classic solvation theory proposes that the main reason for the dissolution of solutes in water is the formation of hydrated particles between ions and water molecules [10]. Water has a strong electrostatic shielding effect on the charge of ions, which prevents anions and cations from combining to form ion clusters due to electrostatic forces. Therefore, it is necessary to analyze the interaction between ions and water. Molecular dynamics simulation analysis of the radial distribution function of each ion and water molecule (Figure 9) sowed that in the range (0.3–0.4 nm) outside the first coordination layer of anions and cations, the trend of the hydration number for the cations was K+ > Na+ > Ca2+, and the hydration number trend for anions was Cl− > SO42− > CO32−.
Further analysis of the hydration number of each ion approximately in the range of 0.3–0.4 nm shows that the hydration number and solubility trend of each ion are basically the same (see Table 5); thus, the electrostatic shielding effect of water molecules on ion pairs is related to the hydrate number outside the first coordination layer of cation and anion ions. Therefore, the ion pair can further attract more anions and cations under the action of electrostatic forces to form larger clusters. The hydration number of Ca2+ is somewhat unique. This is primarily because Ca2+ with two positive charges has a strong ability to attract water molecules, but its ability to attract Cl− is stronger. Under the influence of competition, Ca2+ attracts more Cl− to form ion clusters, resulting in a low solubility.
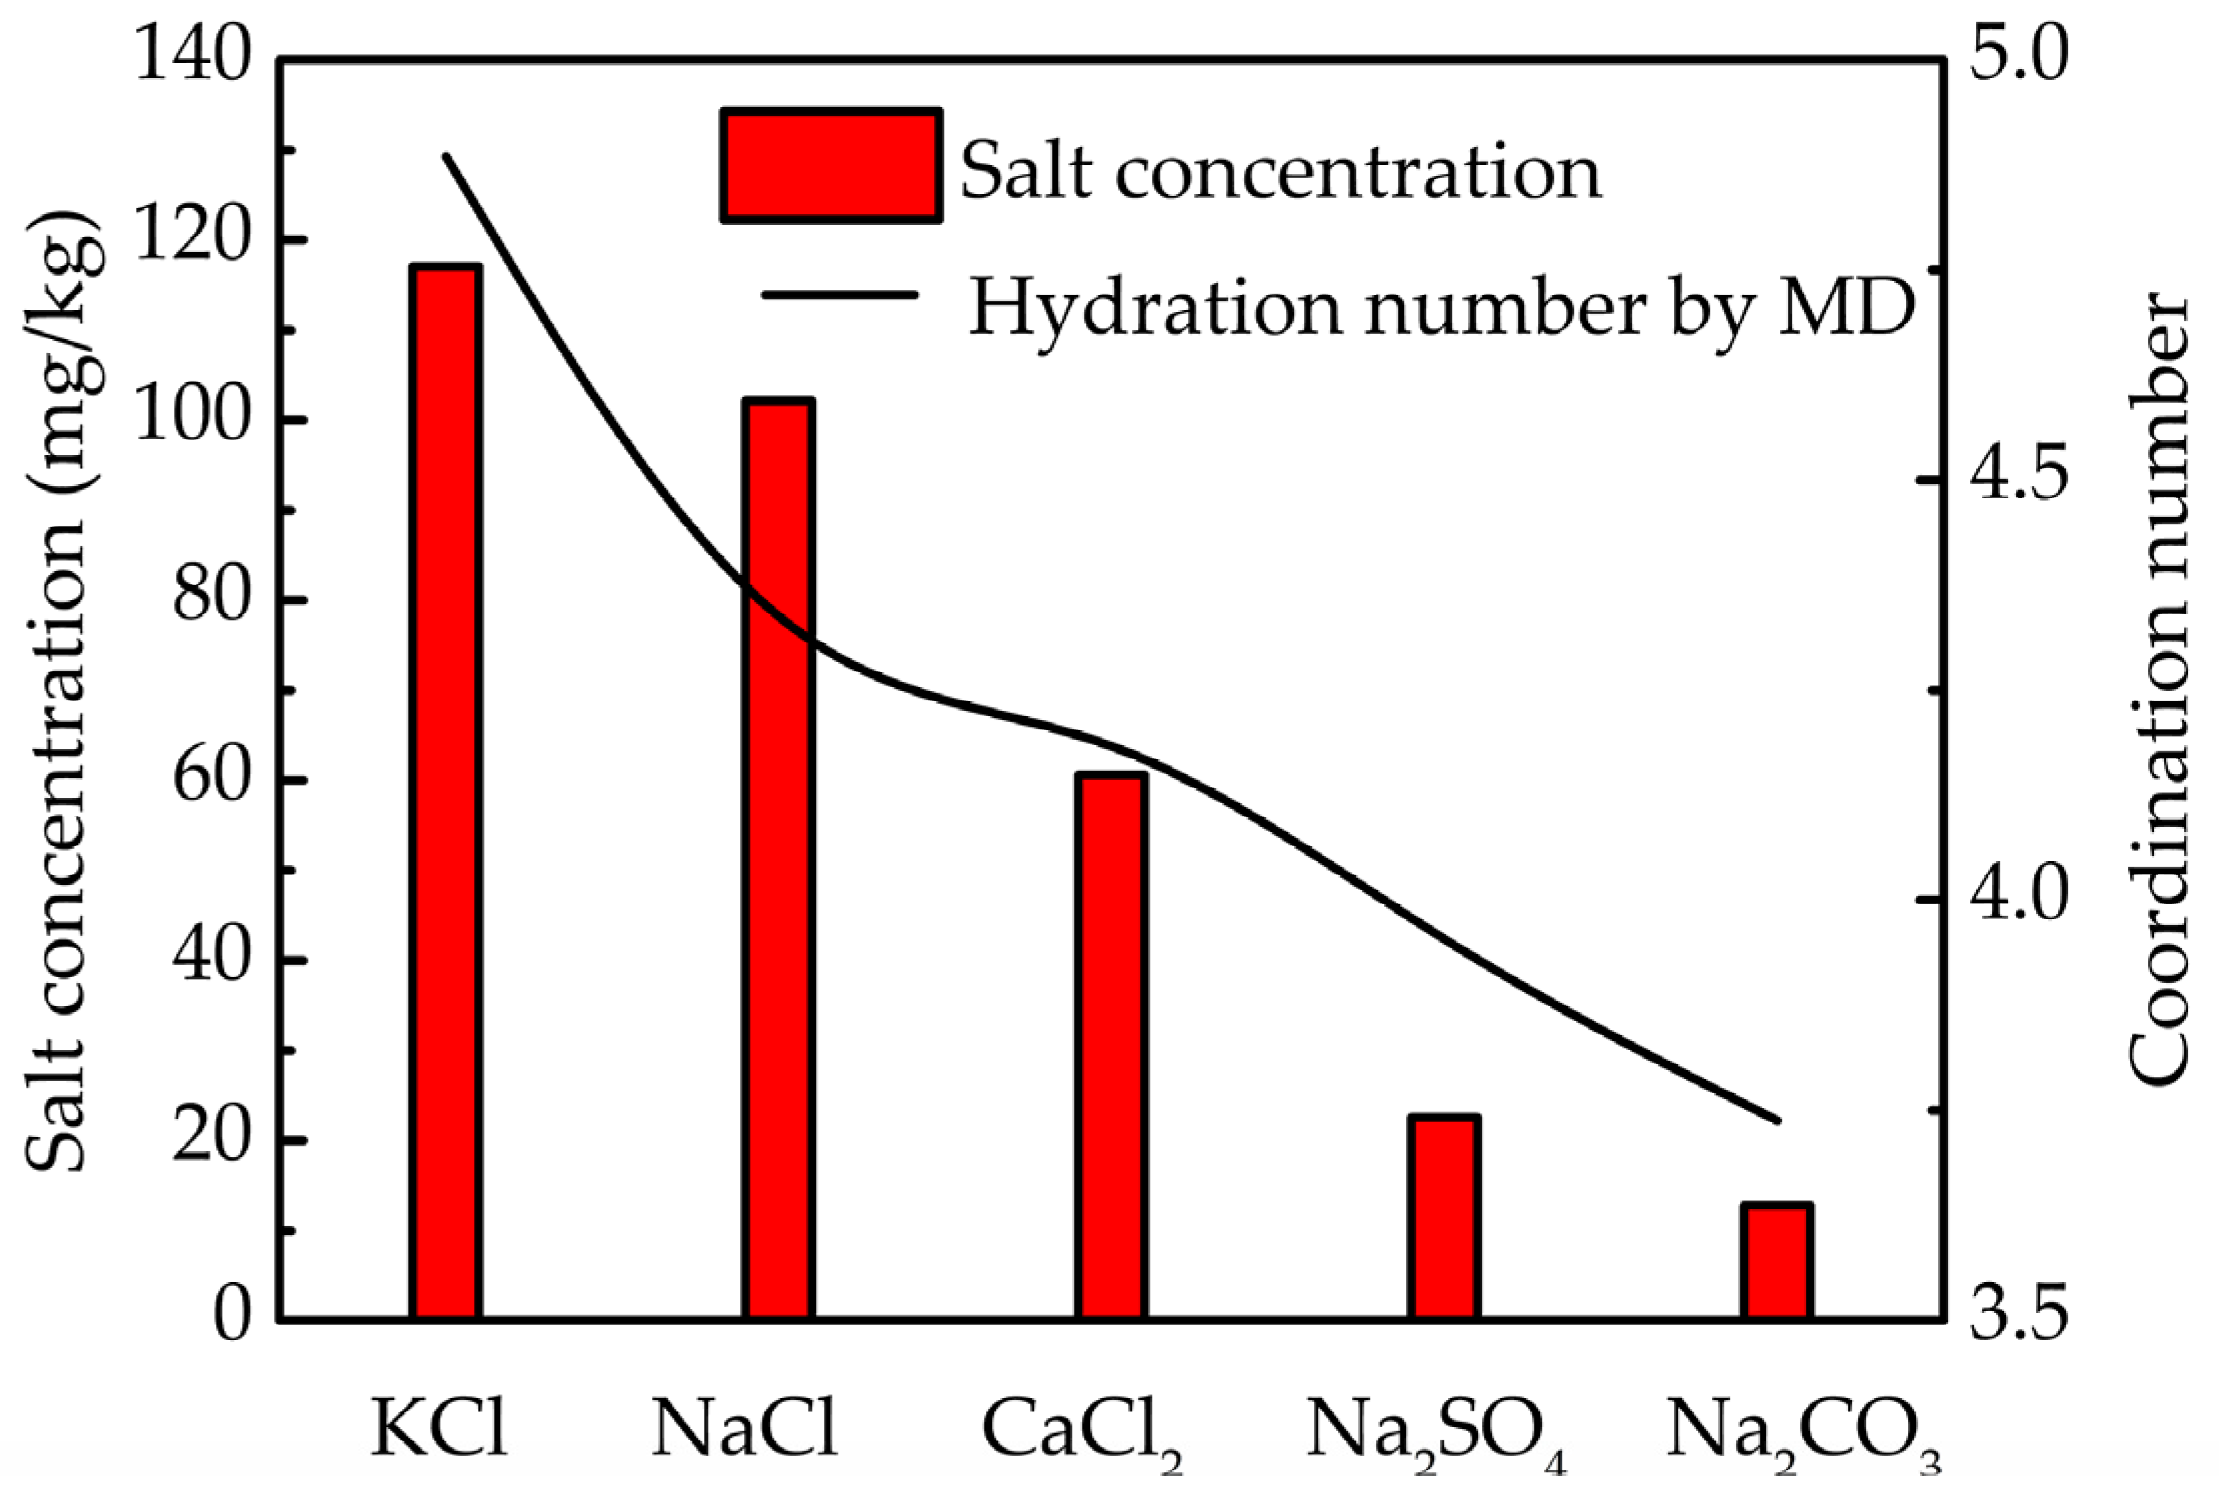
According to the molecular dynamics data, the total hydration number of each salt in Equations (2) and (3) was calculated and compared with the equilibrium concentration obtained by the experiment (Figure 10). As predicted by classical solvent theory, equilibrium salt concentration has significant positive correlation with hydration number. This indicates that the electrostatic shielding effect of water molecules plays a critical role in the equilibrium concentration of different salts in supercritical water.
5. Conclusions
This article explored differences in salting-out behavior of different salts in supercritical water through experiments and molecular simulations. Major findings are listed below:
- Under the supercritical conditions of 693 K and 23 MPa, the concentration of NaCl (typical class I salt) was approximately 100 mg/L, and that of Na2SO4 (typical class II salt) was approximately 20 mg/L, which is 3–4 orders of magnitude lower than the solubility under environmental conditions (300–400 g/L).
- The solubilities of different salts are quite different; in descending order, they are KCl > NaCl > CaCl2 > Na2SO4 > Na2CO3.
- Molecular dynamics simulation results showed that the equilibrium salt concentration is controlled by the ion radius, amplitude of charge, and coordination number. Generally, salt concentration decreases with decreasing ion radius and hydration coordination number, but with increasing charge. For class II salts such as SO42− and CO32− having multilayer coordination structures, their cluster structures are usually tighter, and their solubilities are normally lower than those of class I salts.
Author Contributions
Conceptualization, Y.S. and Z.C.; methodology, Q.Z.; software, Z.L.; validation, Z.H.; writing—original draft, Y.S.; writing—review & editing, Y.S., Z.L. and Z.C.; supervision, Z.C. All authors have read and agreed to the published version of the manuscript.
Funding
This research received no external funding.
Institutional Review Board Statement
Not applicable.
Informed Consent Statement
Not applicable.
Data Availability Statement
All data collected in this study are contained within the article.
Conflicts of Interest
The authors declare no conflict of interest.
References
- Brunner, G. Supercritical process technology related to energy and future directions—An introduction. J. Supercrit. Fluid. 2015, 96, 11–20. [Google Scholar] [CrossRef]
- Bermejo, M.D.; Cocero, M.J. Supercritical water oxidation: A technical review. AlChE J. 2006, 52, 3933–3951. [Google Scholar] [CrossRef]
- Marrone, P.A.; Hodes, M.; Smith, K.A.; Tester, J.W. Salt precipitation and scale control in supercritical water oxidation—part B: Commercial/full-scale applications. J. Supercrit. Fluids 2004, 29, 289–312. [Google Scholar] [CrossRef]
- Zhang, Y.; Wang, S.; Song, W.; Yang, J.; Xu, T.; Li, J.; Yang, C.; Li, Y. Characteristics of sodium sulfate deposition in hydrogen production from supercritical water gasification: A review. Int. J. Hydrog. Energy 2019, 44, 29467–29482. [Google Scholar] [CrossRef]
- Voisin, T.; Erriguible, A.; Aubert, G.; Aymonier, C. Aggregation of Na2SO4 Nanocrystals in Supercritical Water. Ind. Eng. Chem. Res. 2018, 57, 2376–2384. [Google Scholar] [CrossRef]
- Able, C.M.; Trembly, J.P. Advanced supercritical water-based process concepts for treatment and beneficial reuse of brine in oil/gas production. Desalination 2020, 481, 114334. [Google Scholar] [CrossRef]
- van Wyk, S.; van der Ham, A.G.J.; Kersten, S.R.A. Potential of supercritical water desalination (SCWD) as zero liquid discharge (ZLD) technology. Desalination 2020, 495, 114593. [Google Scholar] [CrossRef]
- Odu, S.O.; Van Der Ham, A.G.J.; Metz, S.; Kersten, S.R.A. Design of a Process for Supercritical Water Desalination with Zero Liquid Discharge. Ind. Eng. Chem. Res. 2015, 54, 5527–5535. [Google Scholar] [CrossRef]
- van Wyk, S.; Odu, S.O.; van der Ham, A.G.J.; Kersten, S.R.A. Design and results of a first generation pilot plant for supercritical water desalination (SCWD). Desalination. 2018, 439, 80–92. [Google Scholar] [CrossRef]
- Zhang, Y.; Wang, S.; Li, Y.; Zhang, J.; Xu, D.; Yang, C.; Yang, J.; Li, J.; Xu, T. Inorganic salts in sub-/supercritical water—Part A: Behavior characteristics and mechanisms. Desalination 2020, 496, 114674. [Google Scholar] [CrossRef]
- Yang, Y.; Meng, S. Atomistic nature of NaCl nucleation at the solid-liquid interface. J. Chem. Phys. 2007, 126, 044708. [Google Scholar] [CrossRef] [PubMed]
- Reagan, M.T.; Harris, J.G.; Tester, J.W. Molecular simulations of dense hydrothermal NaCl-H2O solutions from subcritical to supercritical conditions. J. Phys. Chem. B 1999, 103, 7935–7941. [Google Scholar] [CrossRef] [Green Version]
- Koneshan, S.; Rasaiah, J.C. Computer simulation studies of aqueous sodium chloride solutions at 298 K and 683 K. J. Chem. Phys. 2000, 113, 8125–8137. [Google Scholar] [CrossRef]
- Lümmen, N.; Kvamme, B. Aggregation of FeCl2 Clusters in Supercritical Water Investigated by Molecular Dynamics Simulations. J. Phys. Chem. B 2008, 112, 15262. [Google Scholar] [CrossRef] [Green Version]
- Lümmen, N.; Kvamme, B. Determination of nucleation rates of FeCl2 in supercritical water by molecular dynamics simulations. J. Supercrit. Fluids 2008, 47, 270–280. [Google Scholar] [CrossRef]
- Zhang, J.L.; He, Z.H.; Han, Y.; LI, W.; Wu, J.J.X.; Gan, Z.X.; Gu, J.J. Nucleation and growth of Na2CO3 clusters in supercritical water using molecular dynamics simulation. Acta Phys. Chim. Sin. 2012, 28, 1691–1700. [Google Scholar] [CrossRef]
- Voisin, T.; Erriguible, A.; Philippot, G.; Ballenghien, D.; Mateos, D.; Cansell, F.; Iversen, B.; Aymonier, C. Investigation of the precipitation of Na2SO4 in supercritical water. Chem. Eng. Sci. 2017, 174, 268–276. [Google Scholar] [CrossRef]
- Sun, H.; Jin, Z.; Yang, C.; Akkermans, R.L.C.; Robertson, S.H.; Spenley, N.A.; Miller, S.; Todd, S.M. COMPASS II: Extended coverage for polymer and drug-like molecule databases. J. Mol. Model. 2016, 22, 47. [Google Scholar] [CrossRef]
- Sun, H. COMPASS: An ab Initio Force-Field Optimized for Condensed-Phase ApplicationsOverview with Details on Alkane and Benzene Compounds. J. Phys. Chem. B 1998, 102, 7338–7364. [Google Scholar] [CrossRef]
- Xin, S.-M.; Liu, Q.-K.; Wang, K.; Chen, Y.; Yuan, P.-Q.; Cheng, Z.-M.; Yuan, W.-K. Solvation of asphaltenes in supercritical water: A molecular dynamics study. Chem. Eng. Sci. 2016, 146, 115–125. [Google Scholar] [CrossRef]
- Peng, Z.; Ewig, C.S.; Hwang, M.-J.; Waldman, M.; Hagler, A.T. Derivation of Class II Force Fields. 4. van der Waals Parameters of Alkali Metal Cations and Halide Anions. J. Phys. Chem. A 1997, 101, 7243–7252. [Google Scholar] [CrossRef]
- Samoletov, A.A.; Dettmann, C.P.; Chaplain, M.A.J. Thermostats for “slow” configurational modes. J. Stat. Phys. 2007, 128, 1321–1336. [Google Scholar] [CrossRef] [Green Version]
- Berendsen, H.J.C.; Postma, J.P.M.; Van Gunsteren, W.F.; Dinola, A.; Haak, J.R. Molecular dynamics with coupling to an external bath. J. Chem. Phys. 1984, 81, 3684. [Google Scholar] [CrossRef] [Green Version]
- Karasawa, N.; Goddard, W.A. Acceleration of convergence for lattice sums. J. Phys. Chem. 1989, 93, 7320–7327. [Google Scholar] [CrossRef]
- Allen, M.P.; Tildesley, D.J.; Banavar, J.R. Computer simulation of liquids. J. Solution Chem. 1989, 42, 105–106. [Google Scholar] [CrossRef]
- Masoodiyeh, F.; Mozdianfard, M.; Karimi-Sabet, J. Solubility estimation of inorganic salts in supercritical water. J. Chem. Thermodyn. 2014, 78, 260–268. [Google Scholar] [CrossRef]
- Liu, B.; Ding, X.; Jiang, Z.; Wang, B.; Fang, T. Research on the Solubilities of Sodium Chloride and Sodium Sulfate Under Hydrothermal Conditions. J. Solut. Chem. 2020, 49, 1186–1207. [Google Scholar] [CrossRef]
- Voisin, T.; Erriguible, A.; Ballenghien, D.; Mateos, D.; Kunegel, A.; Cansell, F.; Aymonier, C. Solubility of inorganic salts in sub- and supercritical hydrothermal environment: Application to SCWO processes. J. Supercrit. Fluids 2017, 120, 18–31. [Google Scholar] [CrossRef] [Green Version]
- Leusbrock, I.; Metz, S.J.; Rexwinkel, G.; Versteeg, G.F. The solubilities of phosphate and sulfate salts in supercritical water. J. Supercrit. Fluids 2010, 54, 1–8. [Google Scholar] [CrossRef]
- Mojca, Š.; Željko, K.; Maša, K.H. Solubility of solids in sub- and supercritical fluids: A Review. J. Chem. Eng. Data. 2011, 56, 694–719. [Google Scholar]
- Valyashko, V.M. Phase Equilibria of Water—Salt Systems at High Temperatures and Pressures. ChemInform 2005, 36. [Google Scholar] [CrossRef]
Figure 1.
Flow chart of supercritical desalination device. 1, Tank; 2, high-pressure pump; 3, check valve; 4, preheater; 5, reactor with stirring device; 6, bursting disc; 7, filter; 8, condenser; 9, needle valve; 10, back pressure valve; 11, conductivity meter; 12, ball valve; 13, reservoir.
Figure 1.
Flow chart of supercritical desalination device. 1, Tank; 2, high-pressure pump; 3, check valve; 4, preheater; 5, reactor with stirring device; 6, bursting disc; 7, filter; 8, condenser; 9, needle valve; 10, back pressure valve; 11, conductivity meter; 12, ball valve; 13, reservoir.

Figure 2.
Calibration between salt concentration and conductivity at ambient temperature and pressure.
Figure 2.
Calibration between salt concentration and conductivity at ambient temperature and pressure.

Figure 3.
Changes in aggregation and sedimentation process in supercritical water: (a) NaCl; (b) Na2SO4.
Figure 3.
Changes in aggregation and sedimentation process in supercritical water: (a) NaCl; (b) Na2SO4.

Figure 4.
Concentrations of inorganic salts as a function of H2O density (dashed line—Equation (8)).
Figure 4.
Concentrations of inorganic salts as a function of H2O density (dashed line—Equation (8)).

Figure 5.
Relationship between salt concentration and temperature at different supercritical states: (a) Cl− salt of Na+, K+, Ca2+, (b) Na+ salt of Cl−, CO32−, SO42−.
Figure 5.
Relationship between salt concentration and temperature at different supercritical states: (a) Cl− salt of Na+, K+, Ca2+, (b) Na+ salt of Cl−, CO32−, SO42−.

Figure 6.
Potential energy in different inorganic salt systems.

Figure 7.
Relationship between total potential energy and equilibrium concentration in different inorganic salt systems.
Figure 7.
Relationship between total potential energy and equilibrium concentration in different inorganic salt systems.

Figure 8.
Radial distribution functions (RDFs) between solute ions: (a) RDFs between Na+, K+, Ca2+ and Cl−; (b) RDFs between Cl−, CO32−, SO42− and Na+.
Figure 8.
Radial distribution functions (RDFs) between solute ions: (a) RDFs between Na+, K+, Ca2+ and Cl−; (b) RDFs between Cl−, CO32−, SO42− and Na+.

Figure 9.
Radial distribution functions (RDFs) between solute ions and H2O molecule: (a) RDFs between Na+, K+, Ca2+ and H2O; (b) RDFs between Cl−, CO32−, SO42− and H2O.
Figure 9.
Radial distribution functions (RDFs) between solute ions and H2O molecule: (a) RDFs between Na+, K+, Ca2+ and H2O; (b) RDFs between Cl−, CO32−, SO42− and H2O.

Figure 10.
Relationship between hydration coordination number and equilibrium concentration in different inorganic salt systems.
Figure 10.
Relationship between hydration coordination number and equilibrium concentration in different inorganic salt systems.


Table 1.
Fitting parameters for Equation (1).
| Salt | A | B | C | R2 |
|---|---|---|---|---|
| KCl | 8.39 × 10⁻⁶ | 0.6130 | −15.06 | 0.9998 |
| NaCl | 2.99 × 10⁻⁵ | 0.5157 | 11.53 | 0.9987 |
| CaCl2 | 1.14 × 10⁻⁵ | 0.5744 | −40.29 | 0.9999 |
| Na2SO4 | 2.66 × 10⁻⁵ | 0.7649 | −2.66 | 1.0000 |
| Na2CO3 | 2.57 × 10⁻⁵ | 0.5699 | −10.24 | 0.9998 |
Table 2.
Radius of different cations.
| Cations. | K+ | Na+ | Ca2+ |
|---|---|---|---|
| r (nm) | 0.138 | 0.102 | 0.100 |
Table 3.
Coordination numbers of the cations in the first coordination layer.
| Salt | Coordination Layer Interval r (nm) | |
|---|---|---|
| K+–Cl− | 0–0.425 | 1.896 |
| Na+–Cl− | 0–0.385 | 2.154 |
| Ca2+–Cl– | 0–0.385 | 2.876 |
Table 4.
Anion coordination numbers.
| Coordination Layer | Salt | Coordination Layer Interval r (nm) | n |
|---|---|---|---|
| Layer 1 | Cl−–Na+ | 0–0.385 | 2.154 |
| SO42––Na+ | 0–0.245 | 1.262 | |
| CO32−–Na+ | 0–0.315 | 3.834 | |
| Layer 2 | Cl−–Na+ | 0.385–1.000 | 4.444 |
| SO42––Na+ | 0.245–0.365 | 2.576 | |
| CO32−–Na+ | 0.315–0.415 | 2.590 | |
| Layer 3 and above | Cl––Na+ | / | / |
| SO42−–Na+ | 0.365–1.000 | 14.951 | |
| CO32−–Na+ | 0.415–1.000 | 13.524 | |
| Cl−–Na+ | 0–1.000 | 6.60 | |
| SO42−–Na+ | 18.79 | ||
| CO32−–Na+ | 19.95 |
Table 5.
Coordination number between ion and water.
| Salt | n |
|---|---|
| K+–H2O | 2.444 |
| Na+–H2O | 1.786 |
| Ca2+–H2O | 1.793 |
| Cl−–H2O | 2.441 |
| SO42−–H2O | 2.152 |
| CO32−–H2O | 1.952 |
Publisher’s Note: MDPI stays neutral with regard to jurisdictional claims in published maps and institutional affiliations. |
© 2022 by the authors. Licensee MDPI, Basel, Switzerland. This article is an open access article distributed under the terms and conditions of the Creative Commons Attribution (CC BY) license (https://creativecommons.org/licenses/by/4.0/).
Share and Cite
MDPI and ACS Style
Song, Y.; Li, Z.; Zhu, Q.; Huang, Z.; Cheng, Z. Precipitation Behavior of Salts in Supercritical Water: Experiments and Molecular Dynamics Simulations. Processes 2022, 10, 423. https://0-doi-org.brum.beds.ac.uk/10.3390/pr10020423
AMA Style
Song Y, Li Z, Zhu Q, Huang Z, Cheng Z. Precipitation Behavior of Salts in Supercritical Water: Experiments and Molecular Dynamics Simulations. Processes. 2022; 10(2):423. https://0-doi-org.brum.beds.ac.uk/10.3390/pr10020423
Chicago/Turabian StyleSong, Yafei, Zhe Li, Qiao Zhu, Zibin Huang, and Zhenmin Cheng. 2022. "Precipitation Behavior of Salts in Supercritical Water: Experiments and Molecular Dynamics Simulations" Processes 10, no. 2: 423. https://0-doi-org.brum.beds.ac.uk/10.3390/pr10020423
Note that from the first issue of 2016, this journal uses article numbers instead of page numbers. See further details here.