
Impact of Residential Real-World Wood Stove Operation on Air Quality concerning PM2.5 Immission


Karlsruhe Institute of Technology, Institute of Mechanical Process Engineering and Mechanics, Straße am Forum 8, 76131 Karlsruhe, Germany
*
Authors to whom correspondence should be addressed.
†
These authors contributed equally to this work.
Processes 2022, 10(3), 545; https://0-doi-org.brum.beds.ac.uk/10.3390/pr10030545
Submission received: 21 February 2022
/
Revised: 4 March 2022
/
Accepted: 8 March 2022
/
Published: 11 March 2022
(This article belongs to the Special Issue Characterization of Emissions from Fuel Combustion)
Abstract
:In Germany, the number of small wood-burning combustion plants was around 11 million in 2020. The PM2.5 immissions caused by the operation of these combustion plants are already about as high as those from traffic exhaust gases. Thus, particulate matter immissions occur not only on busy roads but also in residential areas. Since there are few official measuring stations for PM2.5 in residential areas and suburbs, this study determined PM2.5 concentrations from November 2020 to June 2021 at three stations (urban, suburban, and residential) in the Karlsruhe area. Simultaneous measurements of PM2.5 at the three locations have been implemented to determine short-term (peaks), medium-term, and long-term particulate matter levels and to assign them to sources by observation, considering wind direction. Illustratively, PM2.5 immission levels in January and May 2021 were compared in this paper. The comparison of the particulate matter immissions measured in the urban and residential area in January revealed that PM2.5 concentration peaks of up to 60 µg/m3 occurred for short periods in the residential area, especially on Fridays and in the evenings, which could be assigned to wood stove operation. In the urban and suburban areas, the number of the immission peaks was lower by 70–80%, and the peak concentrations were also lower by an average of 13–18%. However, the high short-term peaks have no significant impact when calculating the PM2.5 annual average according to the current limit value regulation (39. BImSchV).
1. Introduction
Clean air is important for a long and healthy life. In order to achieve the aim of clean air, immission limit values for air pollutants were set in Germany based on the limit and guideline values set by the EU Directive 2008/50/EC in the 39. BImSchV (39. Federal Immission Control Act). Immission limit values define the impact of harmful substances on humans and the environment [1]. Besides immission limits for gaseous substances (e.g., NO2, CO, etc.), immission limits for particulate matter are defined for PM10 and PM2.5 categories. While PM10 is regulated based on a daily and annual average, the PM2.5 immission limit is currently only defined as an annual average. The WHO (World Health Organization) publishes guideline values for air pollutants regularly. A new air quality guideline was released in 2021, in which the guideline values for PM2.5, PM10, and NO2 are tightened in comparison to the last guideline of 2005 [2]. Since this paper focuses on PM2.5 immissions, the current limit values for PM2.5 of the 39. BImSchV as well as the guidelines from the WHO from 2005 [2] and 2021 [3] are listed in Table 1.
Compared to other countries, as well as to the guideline values of the WHO, there are significant differences in the particulate matter immission limits. The WHO recommends a new annual guideline value for PM2.5 of 5 µg/m3, while the European annual average of 25 µg/m3 is five times as high [2]. The 39. BImSchV does not specify a limit value for daily mean values of PM2.5 [3,4].
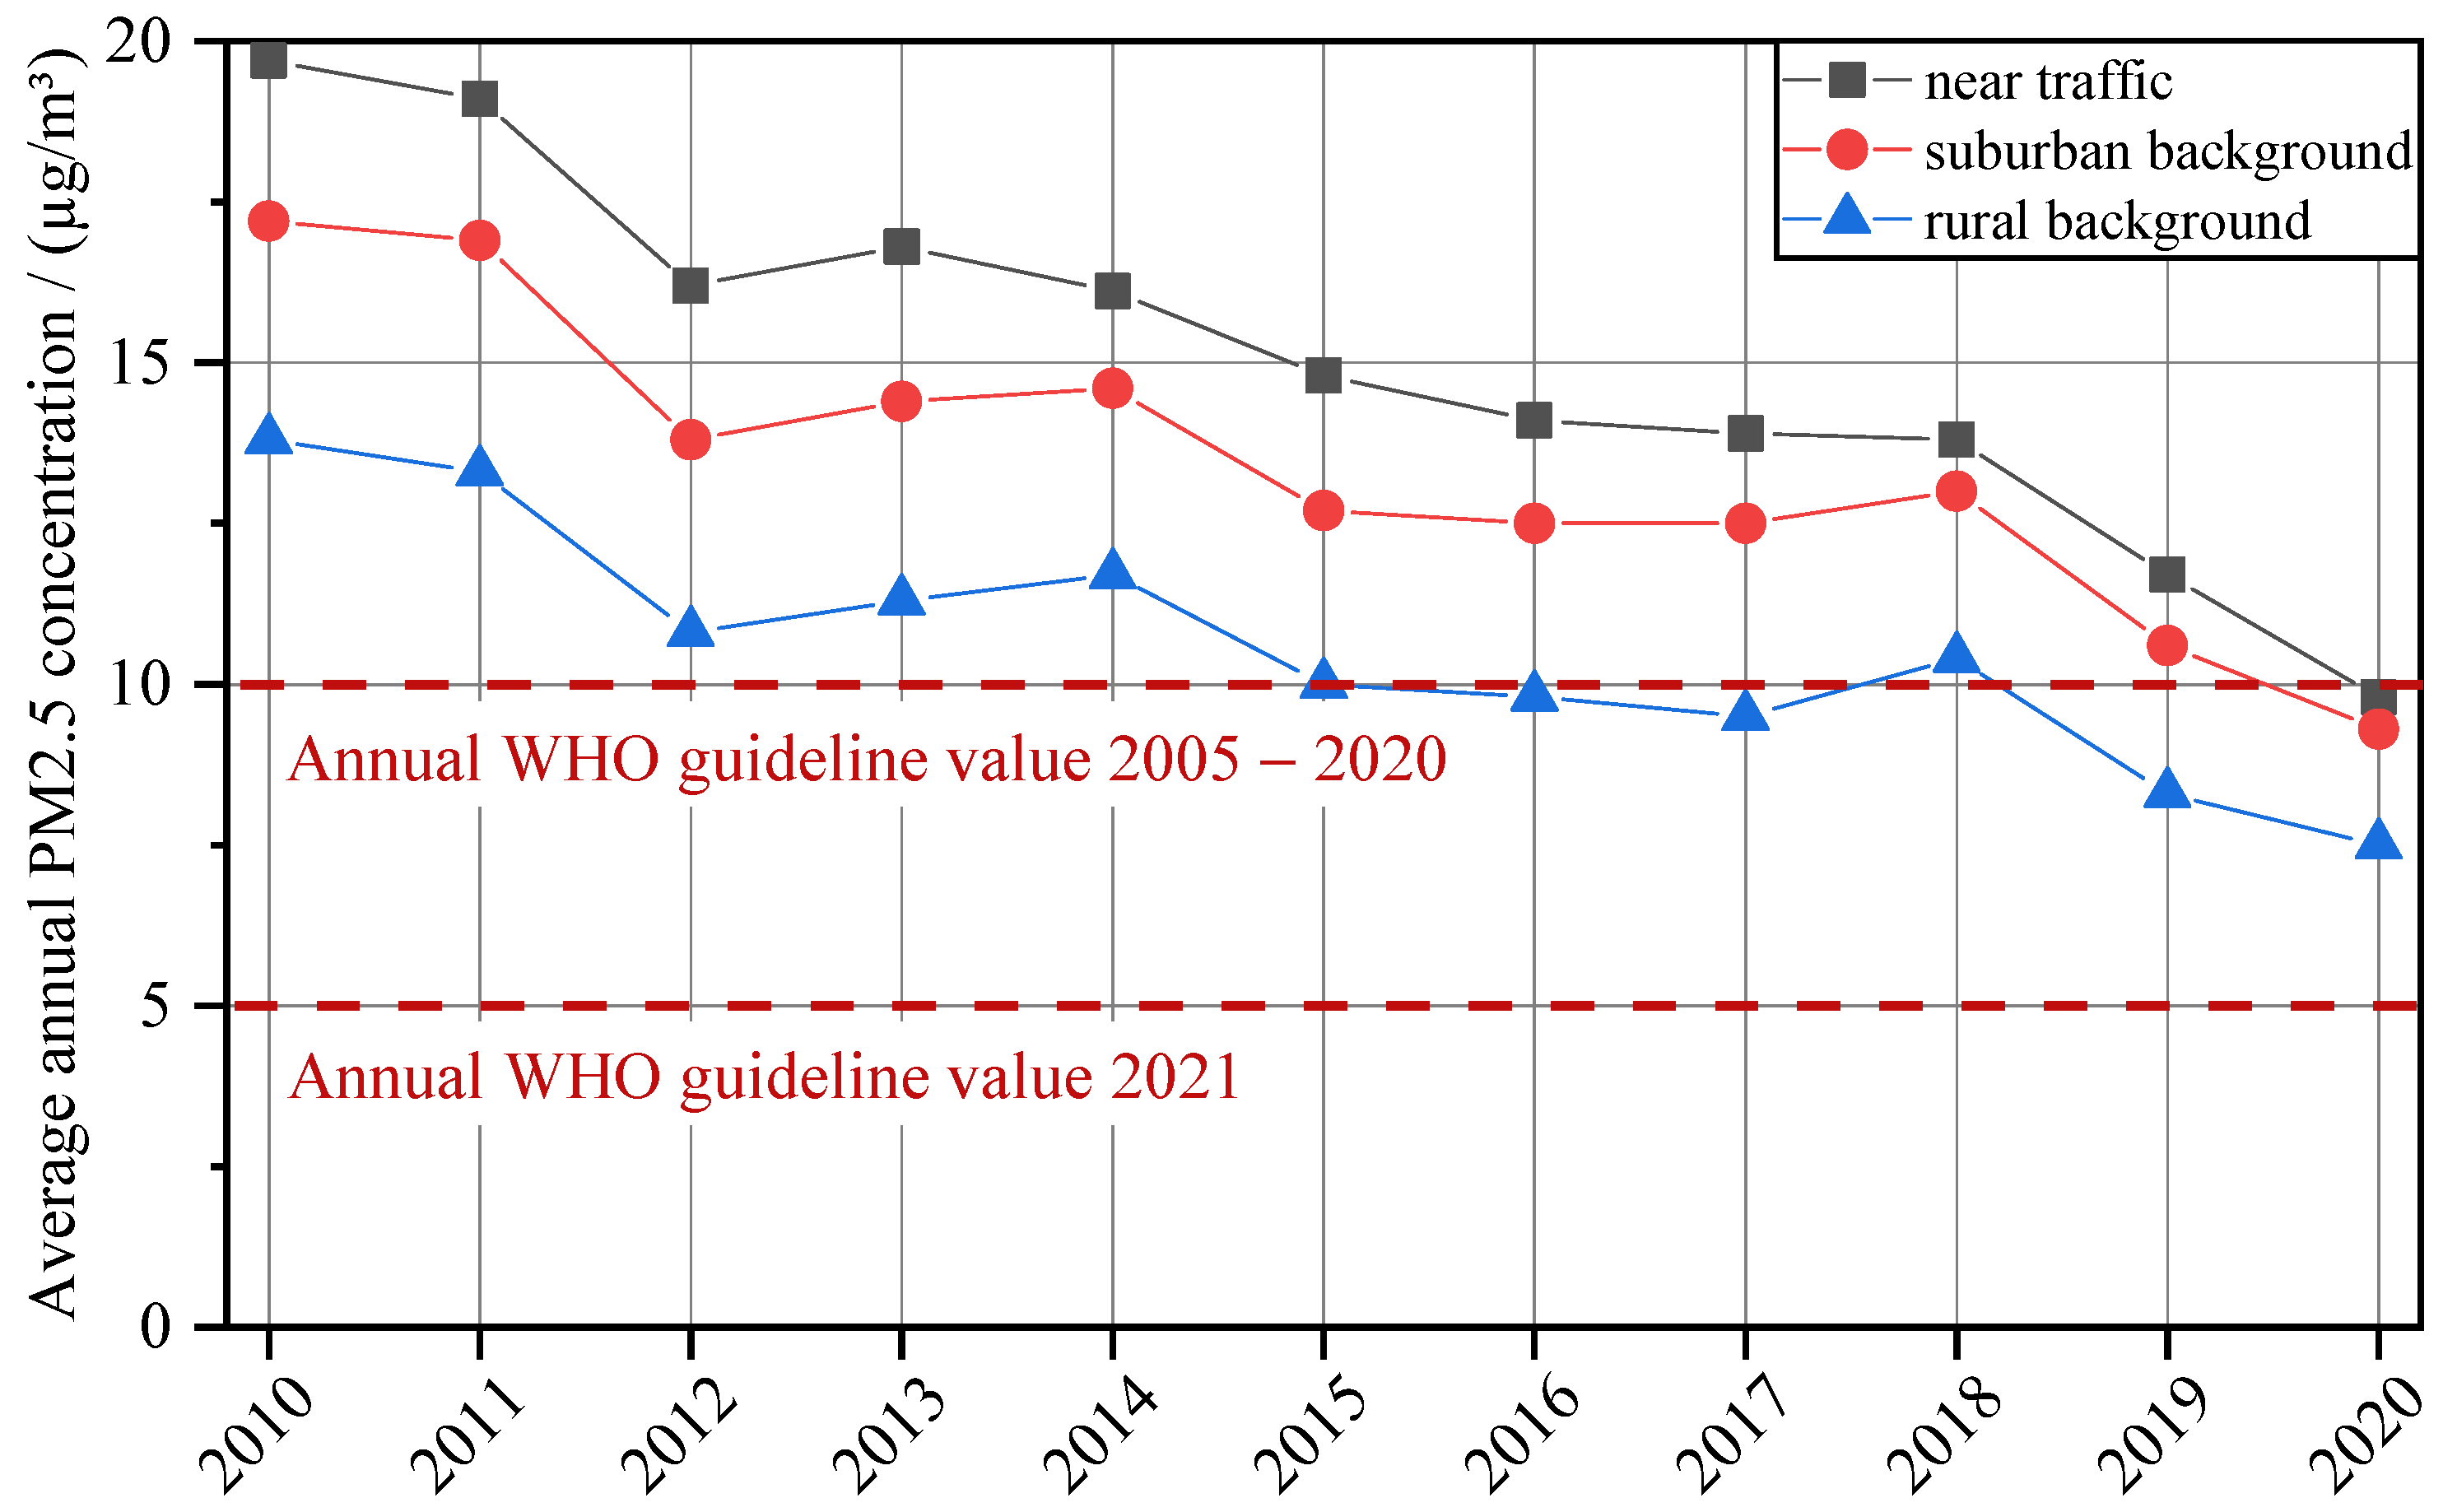
According to current studies, particulate matter is a harmful component and can lead to cardiovascular and lung diseases in the case of long-term exposure. It has also been shown that health is negatively affected even at low PM2.5 concentrations (e.g., 8.7 µg/m3 in the study of Crouse et al., (2012) [5]) [5,6]. Even if fine dust concentrations in Germany are declining, efforts should be made to further reduce exposure [1,7]. The evaluation of the annual mean values of PM2.5 at selected measuring stations in Germany are illustrated in Figure 1.
The European PM2.5 annual average of 25 µg/m3 has not been exceeded at the measuring stations measuring PM2.5 in the last decade. However, the annual WHO guideline value of 2005 (10 µg/m3) was undercut for the first time at the measuring stations in rural areas in 2015. At this time, the stations in the suburban background and near traffic were 1.3 times (suburban background) and 1.5 times (near traffic) above the specified annual guideline value of the WHO (2005). The annual mean value of 10 µg/m3 (WHO 2005) was undercut in all three areas (rural, suburban, and near traffic) for the first time in 2020. In this context, it is important to mention that, in 2020, the COVID-19 pandemic in Germany led to some lockdowns, which may also have contributed to the decrease in immissions [9,10]. However, due to the current tightening of the WHO guideline, the measured annual mean values are again above the guidelines of the WHO Air Quality Guideline (2021). The difference in PM2.5 concentrations between rural and urban areas (see Figure 1, near traffic and suburban background) has converged in recent years.
The presented annual mean values (from Figure 1) refer to measuring stations in Germany. Table 2 lists the classifications of the monitoring stations in Baden-Württemberg measuring PM2.5 and the overages in 2019 and 2020.
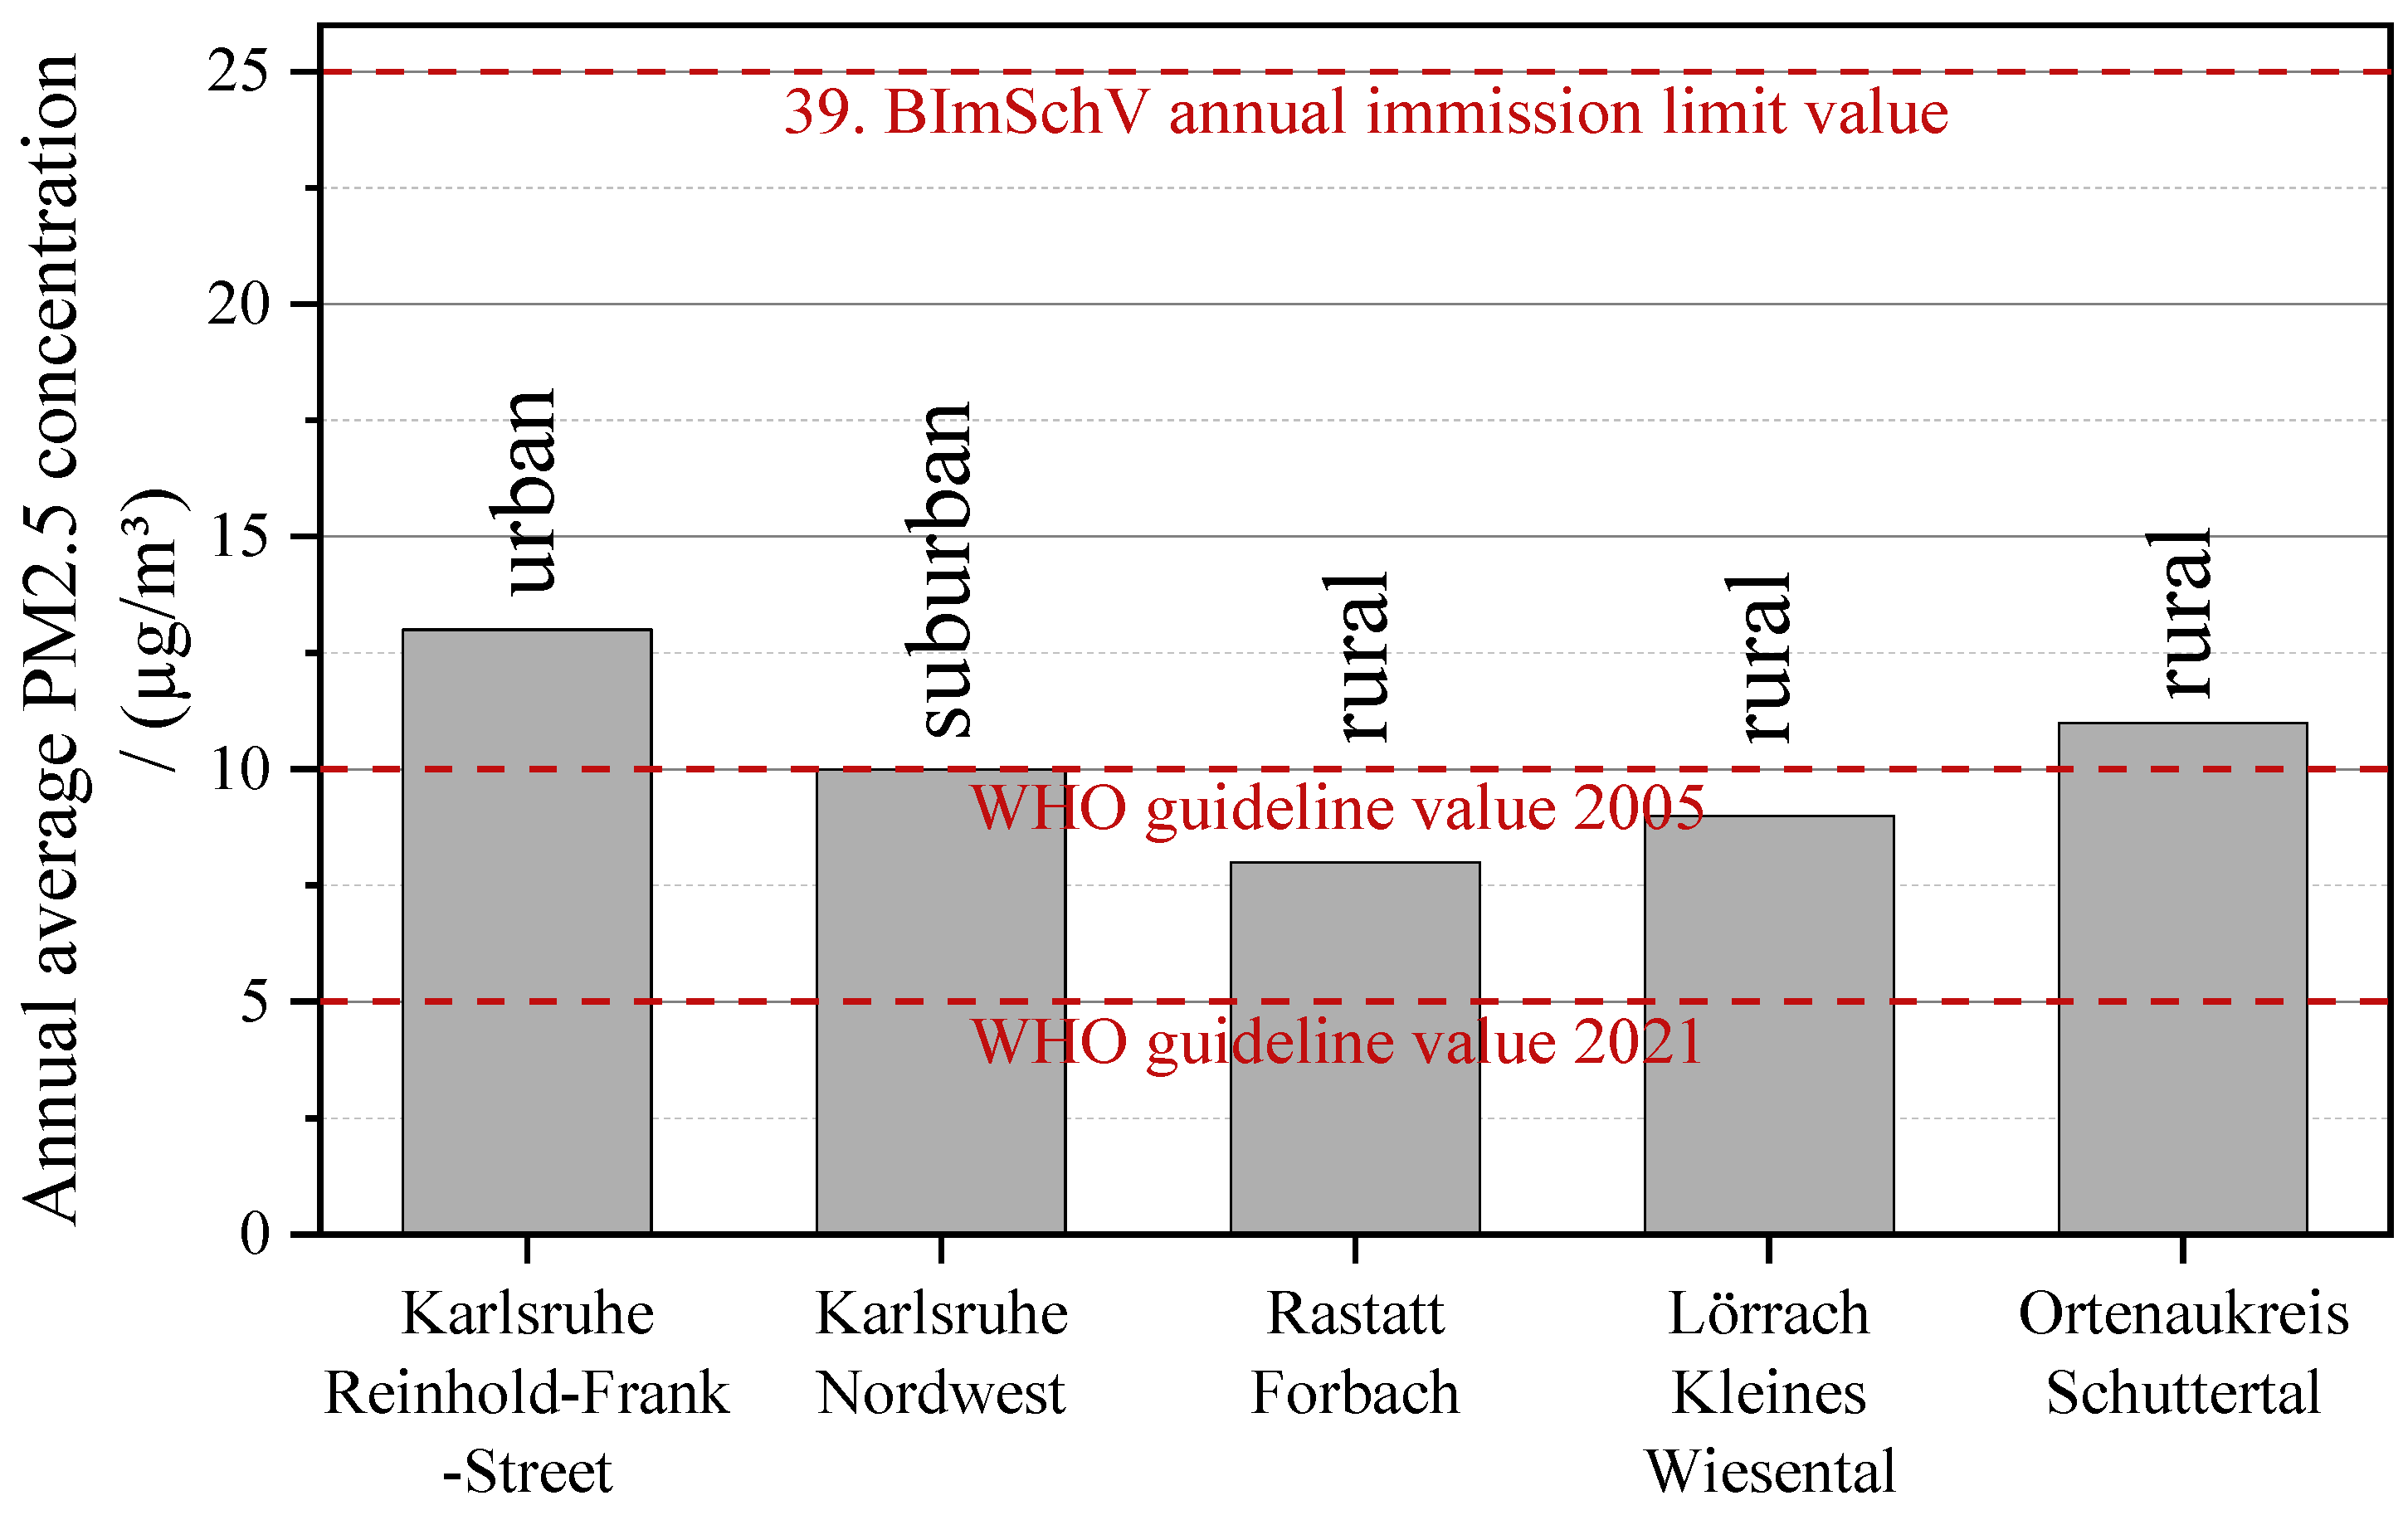
If the measuring stations for PM2.5 of the LUBW (Landesanstalt für Umwelt Baden Württemberg) are considered, it is noticeable that these are mainly located in urban backgrounds and near traffic. This is due to the regulation of the 39. BImSchV Annex 5 in Germany. This ordinance specifies the minimum number of sampling points for stationary measurements in metropolitan areas. The number of measuring stations is related to the population size. In Karlsruhe (population on 31.12.2020: 303 970 [13]), for example, three measuring stations may be set up for PM measurements. One measuring station is to be set up in the urban background and another at a traffic location [4]. However, this regulation does not address residential areas. The highest exceedances in 2019 (Table 2) are measured at the stations near traffic and with urban background (most exceedances in 2020 are at the stations near traffic), but due to the few rural stations, no statements can be made about the air quality in residential areas in Baden-Württemberg. For this reason, the LUBW carried out fine dust measurements (PM10 and PM2.5) in three communities in the Black Forest (Rastatt, Forbach; Lörrach, Kleines Wiesental and Ortenaukreis Schuttertal in Germany) in order to evaluate the impact of wood combustion on fine dust pollution [14]. The annual mean values of the measurements in the Black Forest (Forbach, Kleines Wiesental, Schuttertal) and, as a comparison, the annual mean values of two measuring stations in Karlsruhe (Reinhold-Frank-Street, Nordwest) in 2019 are presented in Figure 2 [11,12,14].
In this case, the measurement results confirm that the fine dust limits for PM2.5 are observed, and even the stricter guideline values of the WHO of 2005 are just exceeded at one test station (Schuttertal) for the PM2.5 concentration. However, the measured values are comparable to the stations in Karlsruhe close to traffic and are slightly below the Reinhold-Frank-Street. In the winter months, the particulate matter is dominated by wood-fired heating systems, and it is partially higher than at the urban background. The determination of the contribution of wood combustion was based on the levoglucosan concentration in the particulate fraction PM10. Levoglucosan is an anhydro-sugar that is formed during the combustion of carbohydrates (e.g., starch or the cellulose contained in wood) [14]. The presented study clarifies that the limit value of the BImSchV is undercut by all stations. However, the guideline value of the WHO 2005 is partially exceeded and the tightened guideline value from the year 2021 was exceeded by all stations. The study of the LUBW reveals that measuring stations in rural areas are also important in order to check air quality and compliance with limit values there as well.
Other studies from Northern Europe show comparable results. For example, Glasius et al. (2006) and Krecl et al. (2008) already showed years ago that PM concentrations in rural areas without traffic were at a similar level as in large cities, where air pollution mainly resulted from street traffic [15,16]. This ratio has increased in recent years [7,17]. A study by Kukkonen et al. (2020) compared the impact of residential wood combustion in four Nordic cities. It was shown that, in Helsinki and Copenhagen, the highest levels of particulate matter were measured outside the city center in suburban areas [18]. Nevertheless, air quality is mainly measured in large cities, where the amount of wood combustion for energy production is lower.
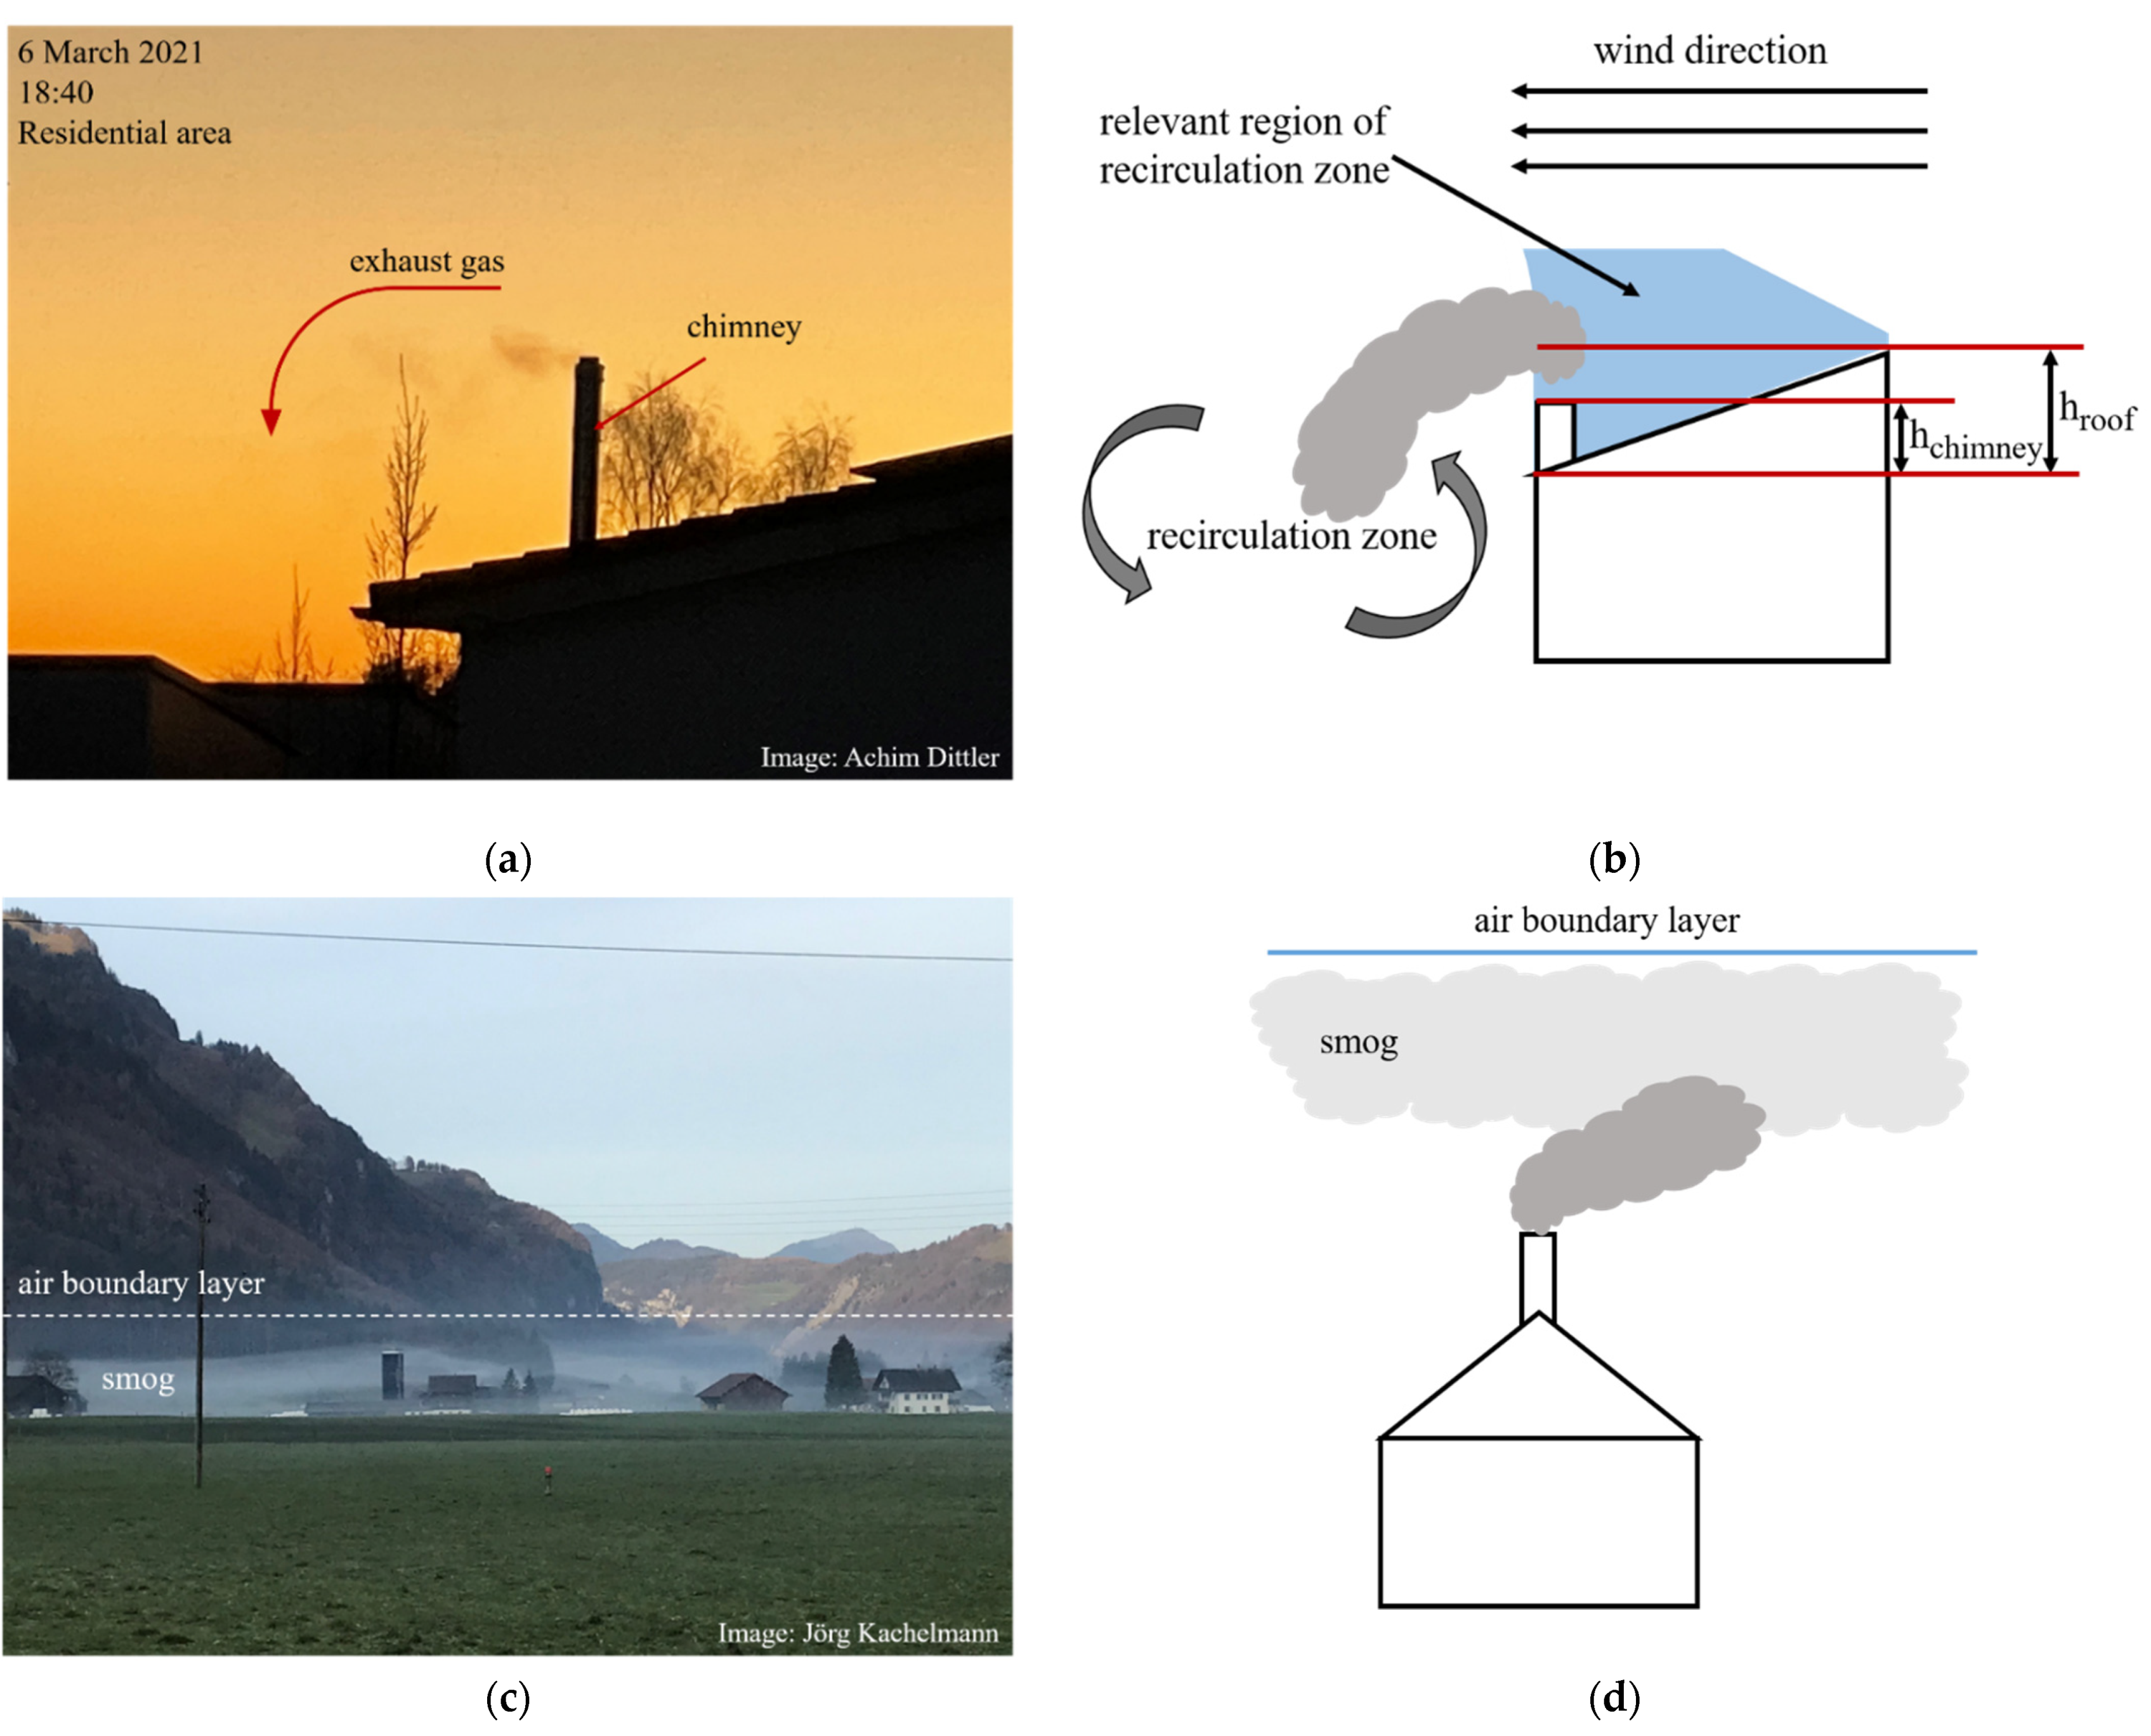
High immissions of particulate matter can also be a result of chimneys that are installed too low. Chimneys built before the amendment of the 1. BImSchV (13 October 2021) did not have to be erected near the highest point of the roof (horizontal distance from the ridge is smaller than its horizontal distance from the eaves) with an overhang of at least 40 cm [19,20]. In VDI3781 part 4, it was shown how an improperly installed chimney causes the exhaust gas to remain in a recirculation zone, preventing the exhaust gas from flowing away [21]. This leads to an increase in PM pollution and reveals that the BImSchV represents the state of the art just for newly built chimneys. During inversion weather conditions, even a higher chimney and, therefore, the optimal discharge of exhaust gases from wood-burning stoves is not guaranteed. Due to the different temperatures of the air layer, the particulate matter cannot be mixed and the pollutants concentrate in the layers close to the ground.
In this study, PM2.5 pollution will be measured simultaneously and temporally at three different locations, urban (near-traffic), suburban (near-traffic), and residential (non-traffic) background. The focus is on a residential area, as current studies either measure air pollution in a city (traffic) or rural areas with a lower population density than residential areas outside metropolitan regions. Because of the regulations in Germany (39. BImSchV), measuring stations are rarely installed in residential areas to measure the fine dust pollution with respirable PM2.5. Here, however, the breathing air quality can be worse than on high-traffic streets. Due to the trend of wood combustion as an alternative heating method, PM2.5 concentrations during different months, as well as extreme events (PM2.5 concentrations > 40 µg/m3), will be observed more closely in this study. The aim is to investigate and compare the short-term (peaks), medium-term, and long-term particulate matter levels and to assign them to sources by observation, considering wind direction simultaneously at three locations in the area of Karlsruhe.
2. Materials and Methods
2.1. PM2.5 Sensor System—FDS 15
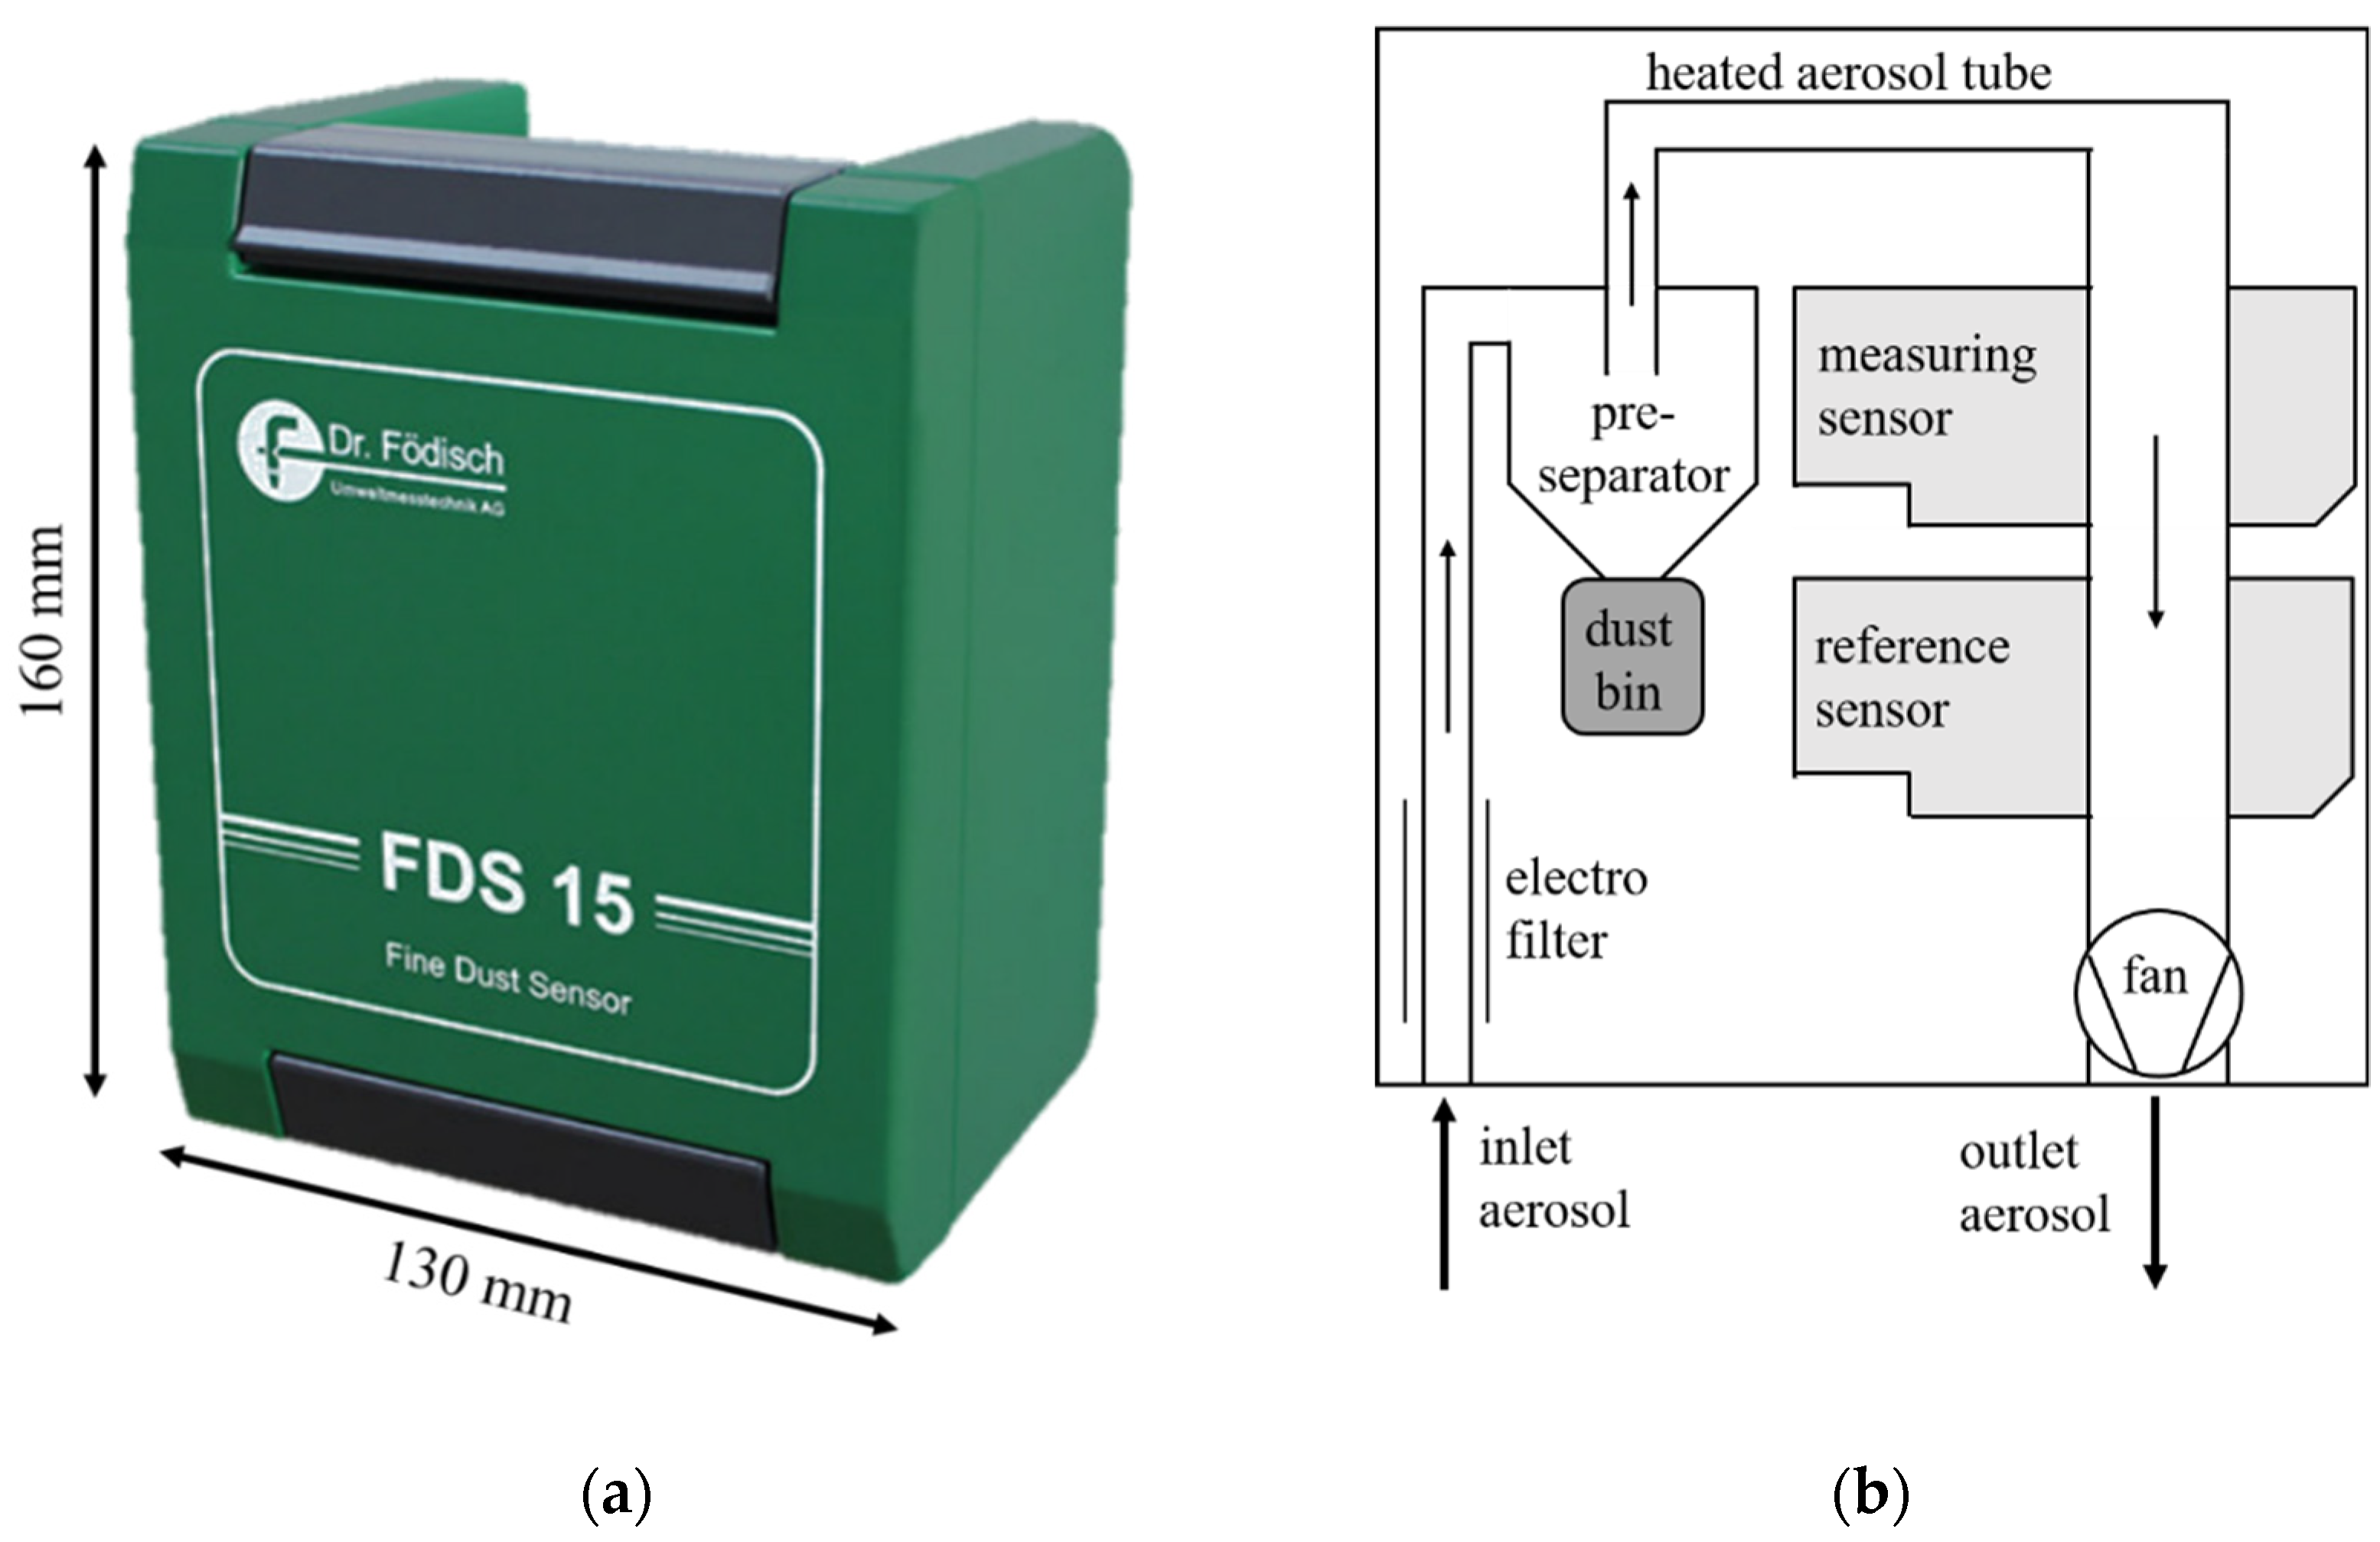
The fine dust sensor FDS 15 (Dr. Födisch Umweltmesstechnik AG) is an optical sensor for continuous measurement and monitoring of the fine dust concentration PM2.5 in a measuring range of 2–2000 µg/m3 with a detection limit of 2 µg/m3 [22]. The technical specifications of the FDS 15 are listed in Table 3.
The size of the FDS 15, as well as the schematic structure, is shown in Figure 3. The measuring principle is based on the scattered light measurement. The ambient air is suctioned in and tempered to 50 °C to reduce secondary influences, e.g., moisture from the ambient air, resulting in mist formation (water droplets), which could be incorrectly measured as particulate matter in the measurement device. In front of the PM sensor is a pre-separator that removes particles above 2.5 µm from the aerosol. In addition, an electrostatic precipitator is installed, which is applied for zero-point setting.
2.2. Reference Device
As a reference device at the official measuring station, Reinhold-Frank-Street (urban—near traffic), as well as at the test station Großoberfeld (suburban—near traffic) of the LUBW, a Palas Fidas 200 S from PALAS GmbH for PM2.5 measurements is used, which is approved and certified for ambient air measurements. At the station in the residential area, there is no measuring station or test center of the LUBW, which is why no data of the Fidas can be recorded here. For this reason, in the following evaluations, only the data of the FDS15 are used. The technical specifications of the instrument are listed in Table 4.
Fidas 200 S is an aerosol spectrometer specially developed for use in official environmental monitoring. It continuously analyzes the fine dust particles present in the ambient air in the size range between 0.18 and 18 µm and simultaneously calculates the immission values PM10 and PM2.5 [24].
The measuring instruments are regularly calibrated and maintained. A detailed description of the experimental setup of the field tests follows in chapter 2.3. The measurement data used are presented in the following chapters as mean values (minute mean values, hourly mean values, and 4-h mean values).
2.3. Field Tests
2.3.1. Measurement Setup
The field tests with the fine dust sensor FDS 15 were carried out at two locations in Karlsruhe (Germany) and another station in the surrounding area, in Stutensee-Büchig. Figure 4 gives an overview of the locations of the three test stations.
The measuring setup was integrated into two already existing measuring stations (first and second station) of the LUBW, which is an official authority for measuring and monitoring air quality in Baden-Württemberg, Germany. This authority owns measuring stations that are designed and operated according to the European Directive 2008/50/EG or 2015/1480/EG. The first station (Figure 4) is located in the suburb Großoberfeld of Karlsruhe, 44 m next to a four-lane highway, and is intended to detect the immission of the urban background. The second measurement station (Reinhold-Frank-Street) is located less than 1 m next to a two-lane road and 240 m from a busy intersection. At this station, traffic-related exposure to particulate matter is detected. The third station was installed in a residential area (away from traffic) in Stutensee. Since Stutensee, with its population of 25,057 (30 June 2021) [26], is not a conurbation according to the 39. BImSchV, no official measuring station of the LUBW is in this area that could be used for the measurements [4]. For this reason, the measurement set-up was placed on a terrace in the residential area. At this measuring station, the urban background is essentially detected, since the residential area is about 1.5 km away from a road, and otherwise only fields and other residential areas are located in the vicinity.
The FSD 15 were installed at all three measuring stations (suburban, urban, and residential) without additional protection against weather influences (wind, rain, and sun).
At the measuring stations from the LUBW (suburban and urban), the sensor systems were mounted on the roof of the stations, which is about 3 m above the ground. At the urban measuring station near the city traffic (Reinhold-Frank-Street), the sensors were installed on the side of the walkway due to possible turbulence from passing cars. In the suburban station were no influencing factors by, for example, traffic. In the residential area, the sensor was attached on a terrace in approximately 4.5 m height.
The data transmission was performed at the suburban as well as at the urban station via Modbus and at the station in the residential area via the integrated WiFi interface of the sensor systems. The major wind direction was southwest with average wind speed of 2–3 m/s during the measurements in January and May 2021.
2.3.2. Duration
The continuous PM2.5 concentration measurements of the ambient air with the FDS 15 started in November 2020 and ended in June 2021. This period was selected to evaluate the local exposures in different months of the year. In addition, the air quality and local events were detected at the measuring stations to determine a fundamental prediction of air pollution at various localities in a city as well as its surroundings.
During the measurement time, the FDS 15 run continuously. Due to problems with data communication, there are partial gaps in the results, where the sensors have continued to run, but the data recording has stopped. Despite these outages, the sensor uptime of the evaluated data in this paper (excluding data outages) was 95% in January and 93% in May. The data communication failures are seen as gaps in the data in the figures of Section 3.
2.3.3. Data Analysis
The sensor systems record the measured values in time steps of 2–5 s. For the evaluation of the data, the sensor measurements, as well as the reference measurements, were averaged (minute, hour, or 4-h values).
Pearson correlation was applied for the correlation between the sensor systems and the reference devices. The Pearson coefficient indicates the linear correlation between two variables and will give a positive correlation in the case of the comparisons of the sensor systems and the reference devices. The correlation coefficient will be analyzed as a qualitative index of the accuracy of the sensors compared to the reference device.
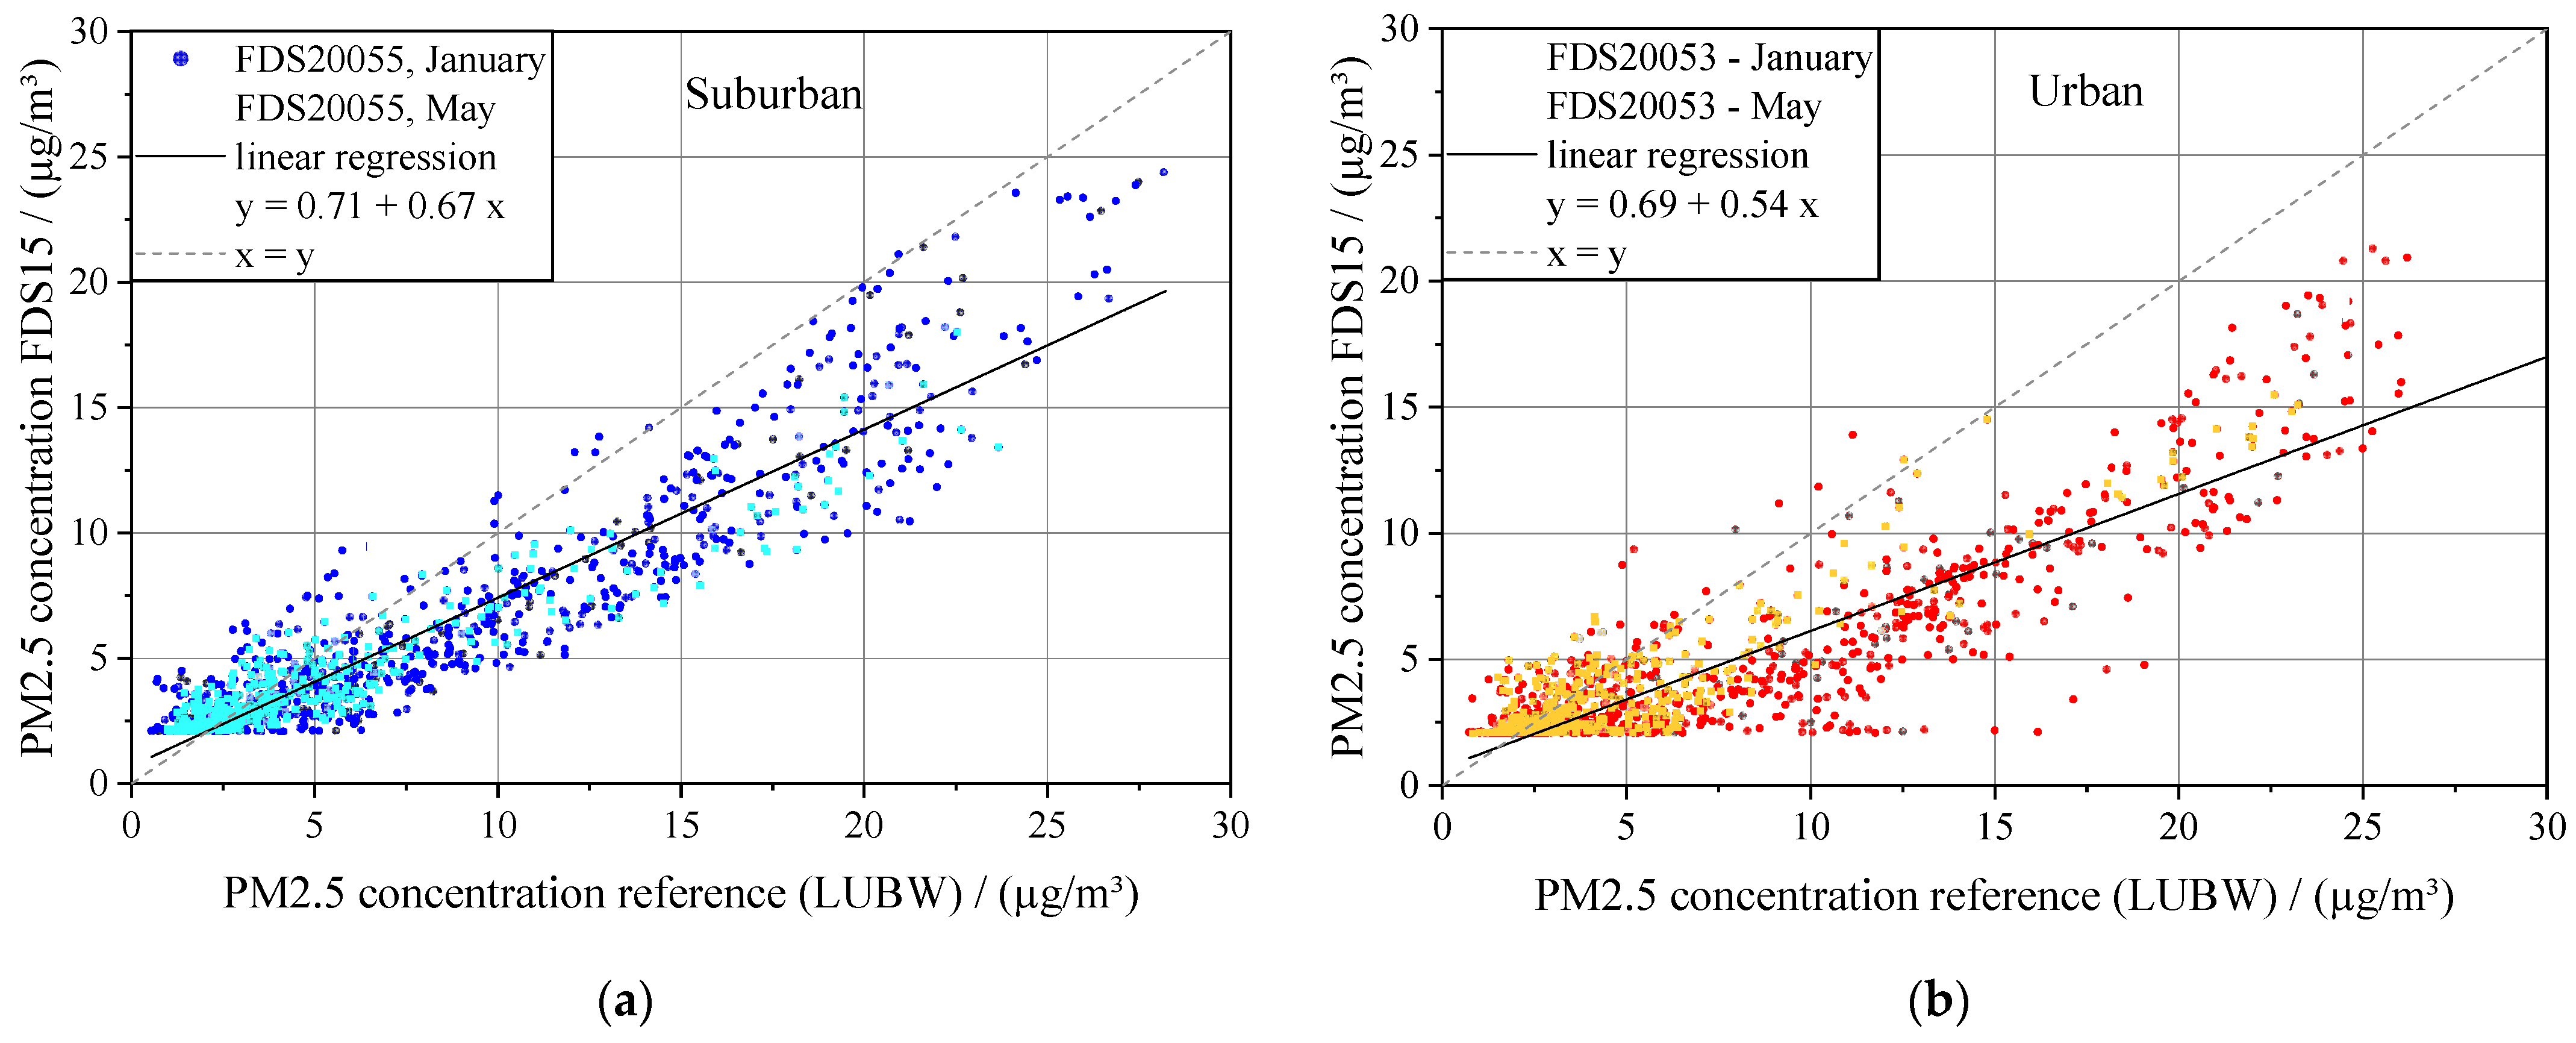
The PM2.5 concentrations of the suburban measuring station (a) and the urban measuring station (b) for the Pearson correlation are shown for two periods, January (1–31 January 2021) and May (1–31 May 2021), in Figure 5. Linear regression was used for the correlation of the data points of the FDS 15 and the reference device (Figure 5, black line). The corresponding slopes and intercepts of the linear regression are listed in Table 5. The measurement data of the LUBW reference devices are used as reference values.
The data points represent that the concentrations of the reference device are underestimated in the suburban and urban measuring stations. The scatter of the data points is larger in January in comparison to May 2021. In this period, concentrations between 2 and 28 µg/m3 were measured at both stations.
For the correlation of the measured values, the Pearson coefficient was calculated and listed in Table 5 with the corresponding intercepts (a) and slopes (b) of the linear regression.
The calculated correlation coefficient for January and May (one linear regression) shows a high correlation of the two measuring stations, suburban with 0.94 and urban with 0.89. In general, the FDS 15 underestimates the mass concentration of the reference device, which can be seen in Figure 5 and from slope b in Table 5 (b < 1). This aberration can be attributed due to a correction factor used in optical measuring instruments. During the measurement, an optical parameter is measured via scattering of light and, subsequently, converted into a mass concentration. In case of the fine dust sensor FDS 15, the factory calibration was also used during the field measurements, and no additional field calibration was measured. This can result in the underestimation of the FDS 15 to the reference instrument, which are not of major pertinence for a comparison of the FDS 15 at the three stations. At the station in the residential area, only a FDS 15 could be installed. For this reason, in the following evaluations, the data of the FDS 15 are used.
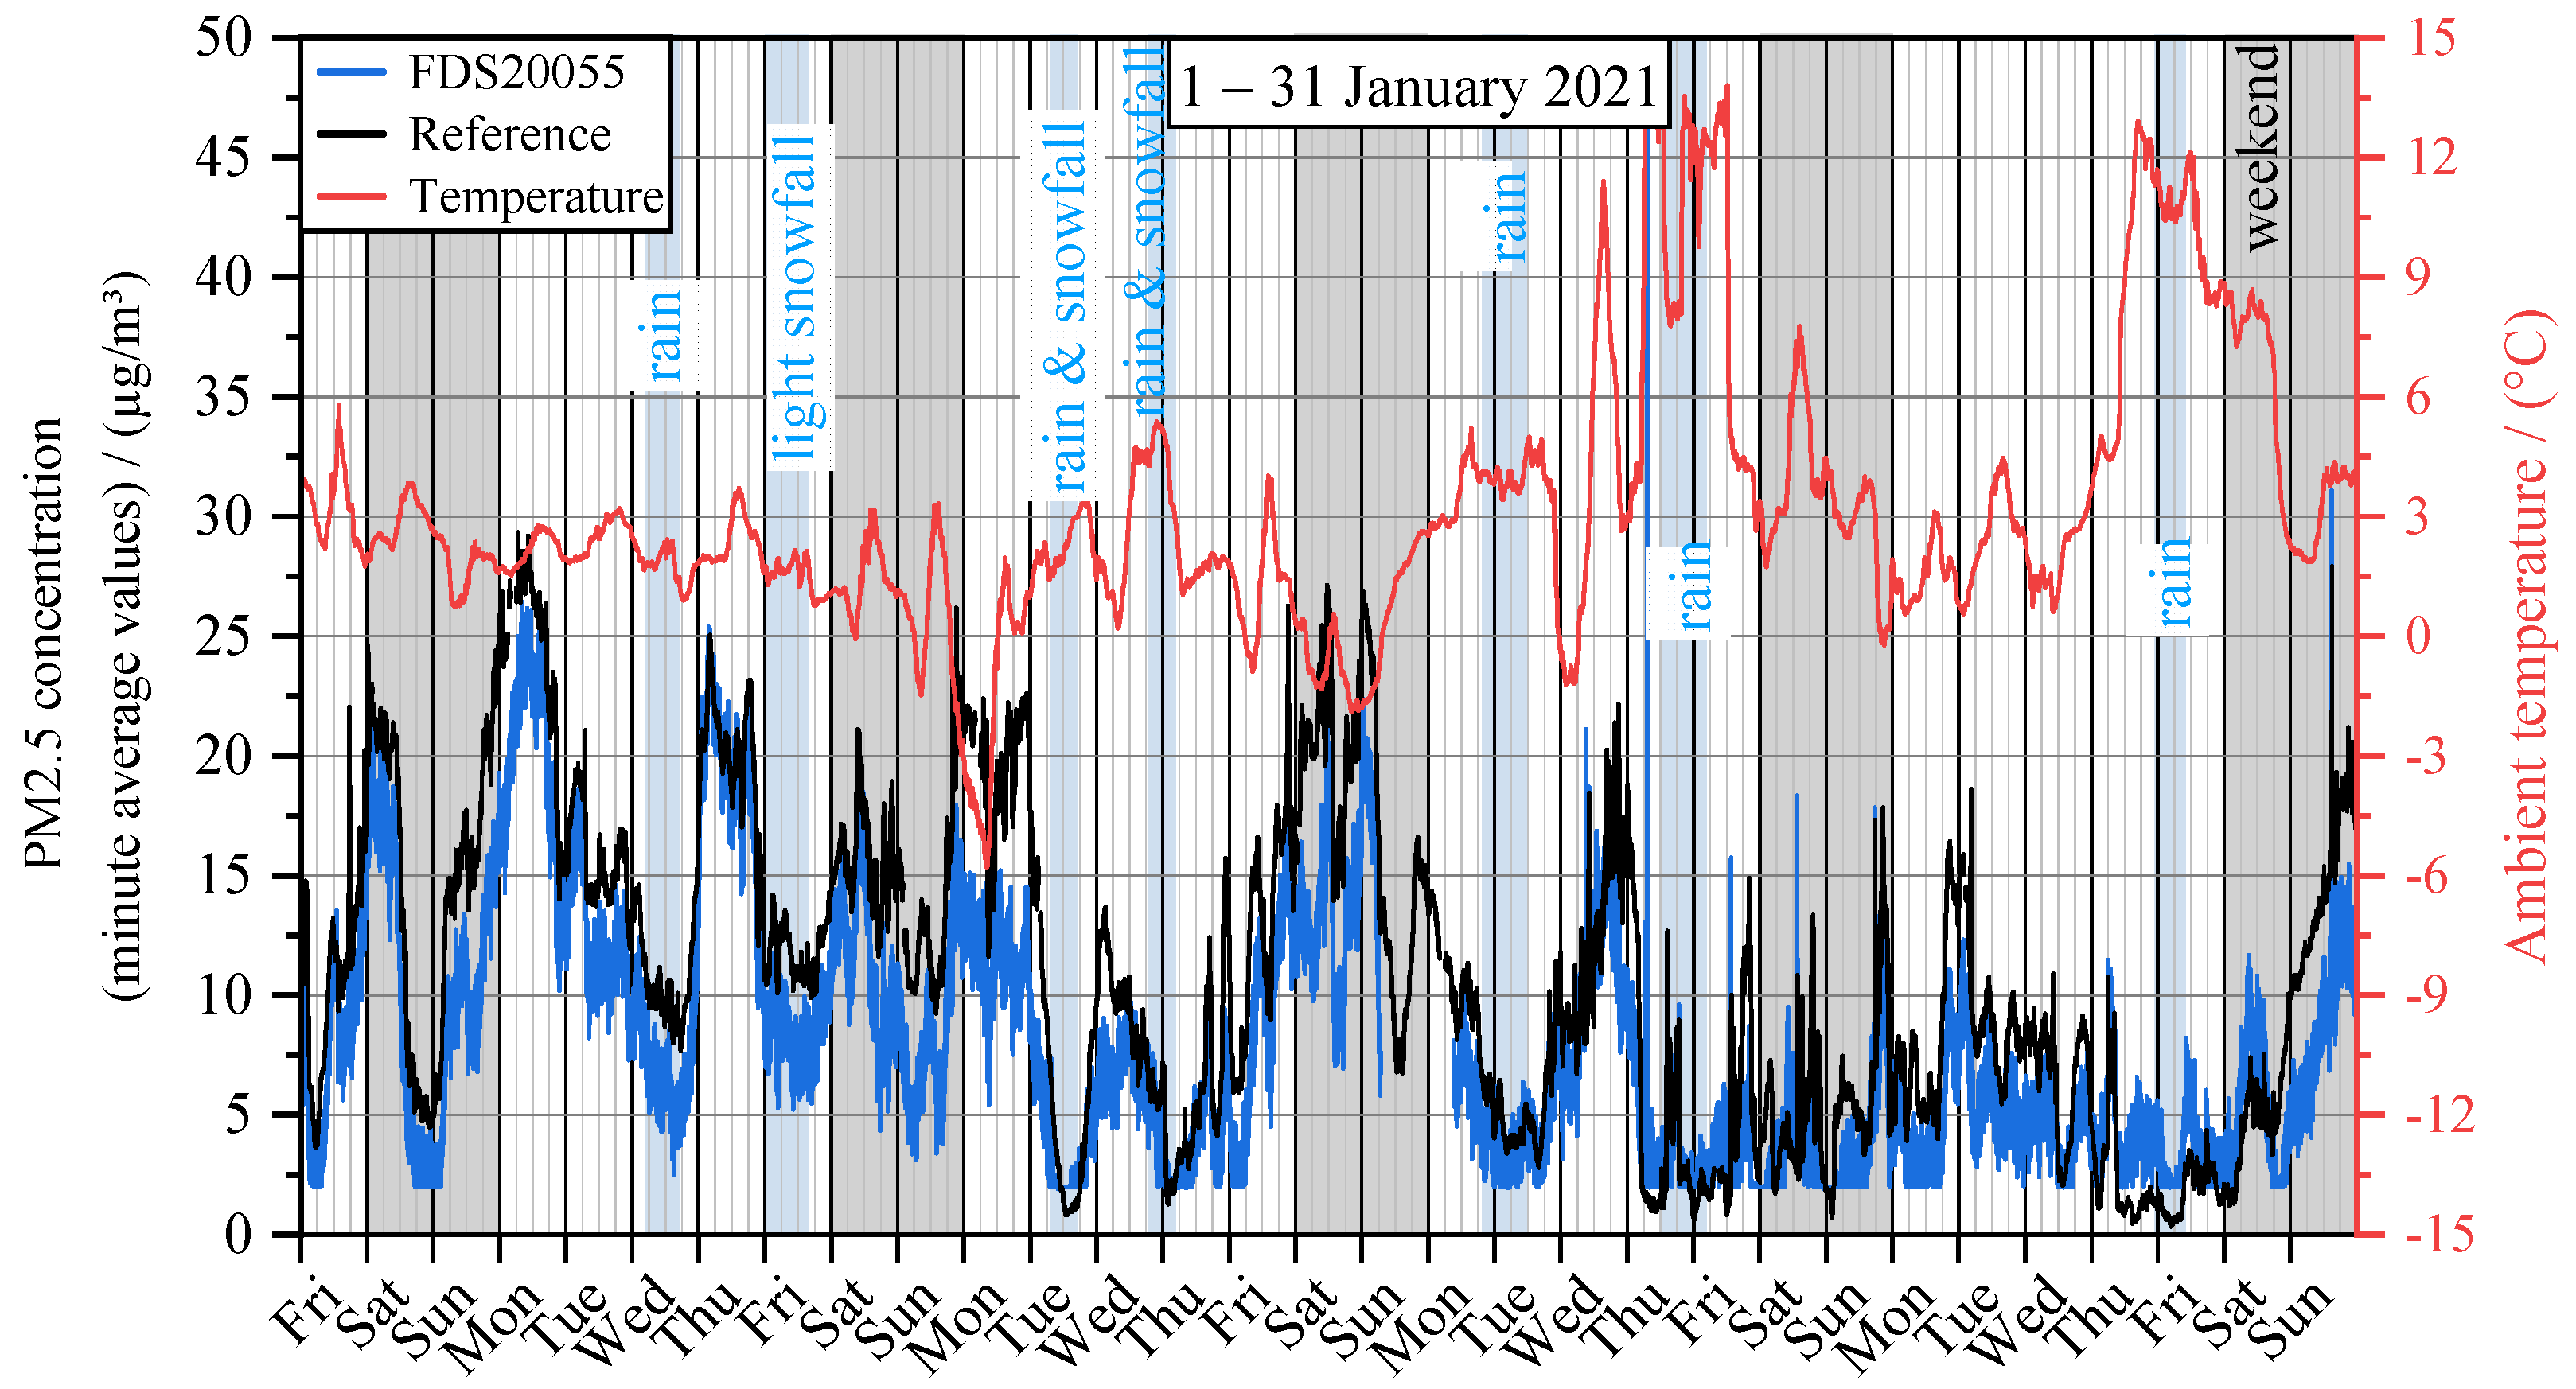
The underestimation of the measured values can also be seen in the course of the measured PM2.5 concentration in January at the suburban station, which is illustrated in Figure 6. Additionally, the ambient temperature is shown. Here, the measured concentrations of the FDS 15 are below the reference value of the LUBW and, thus, underestimate on average the fine dust concentration of PM2.5 in the ambient air. In general, the PM2.5 concentration curves are characterized by an increase and decrease lasting several hours (e.g., due to leaching of particulate matter by incipient rain) and also by a short-term increase within a few minutes. The ambient temperature is in the first half of January, on average, 1.8 °C. The second half of January is with an average temperature of 4.4 °C warmer. The minimum measured temperature is 5.7 °C on 11 January and the maximum on 21 January is 14.3 °C.
Despite the underestimation of the measured mass concentration, an agreement of the sensor systems to the reference instruments can be recognized. For this reason, the following evaluation compares the data of the FDS 15 at the three measuring stations, with the background of the underestimation of the measured values in comparison to the reference device.
3. Results
3.1. PM2.5 Concentration—Time Courses at the Measuring Stations
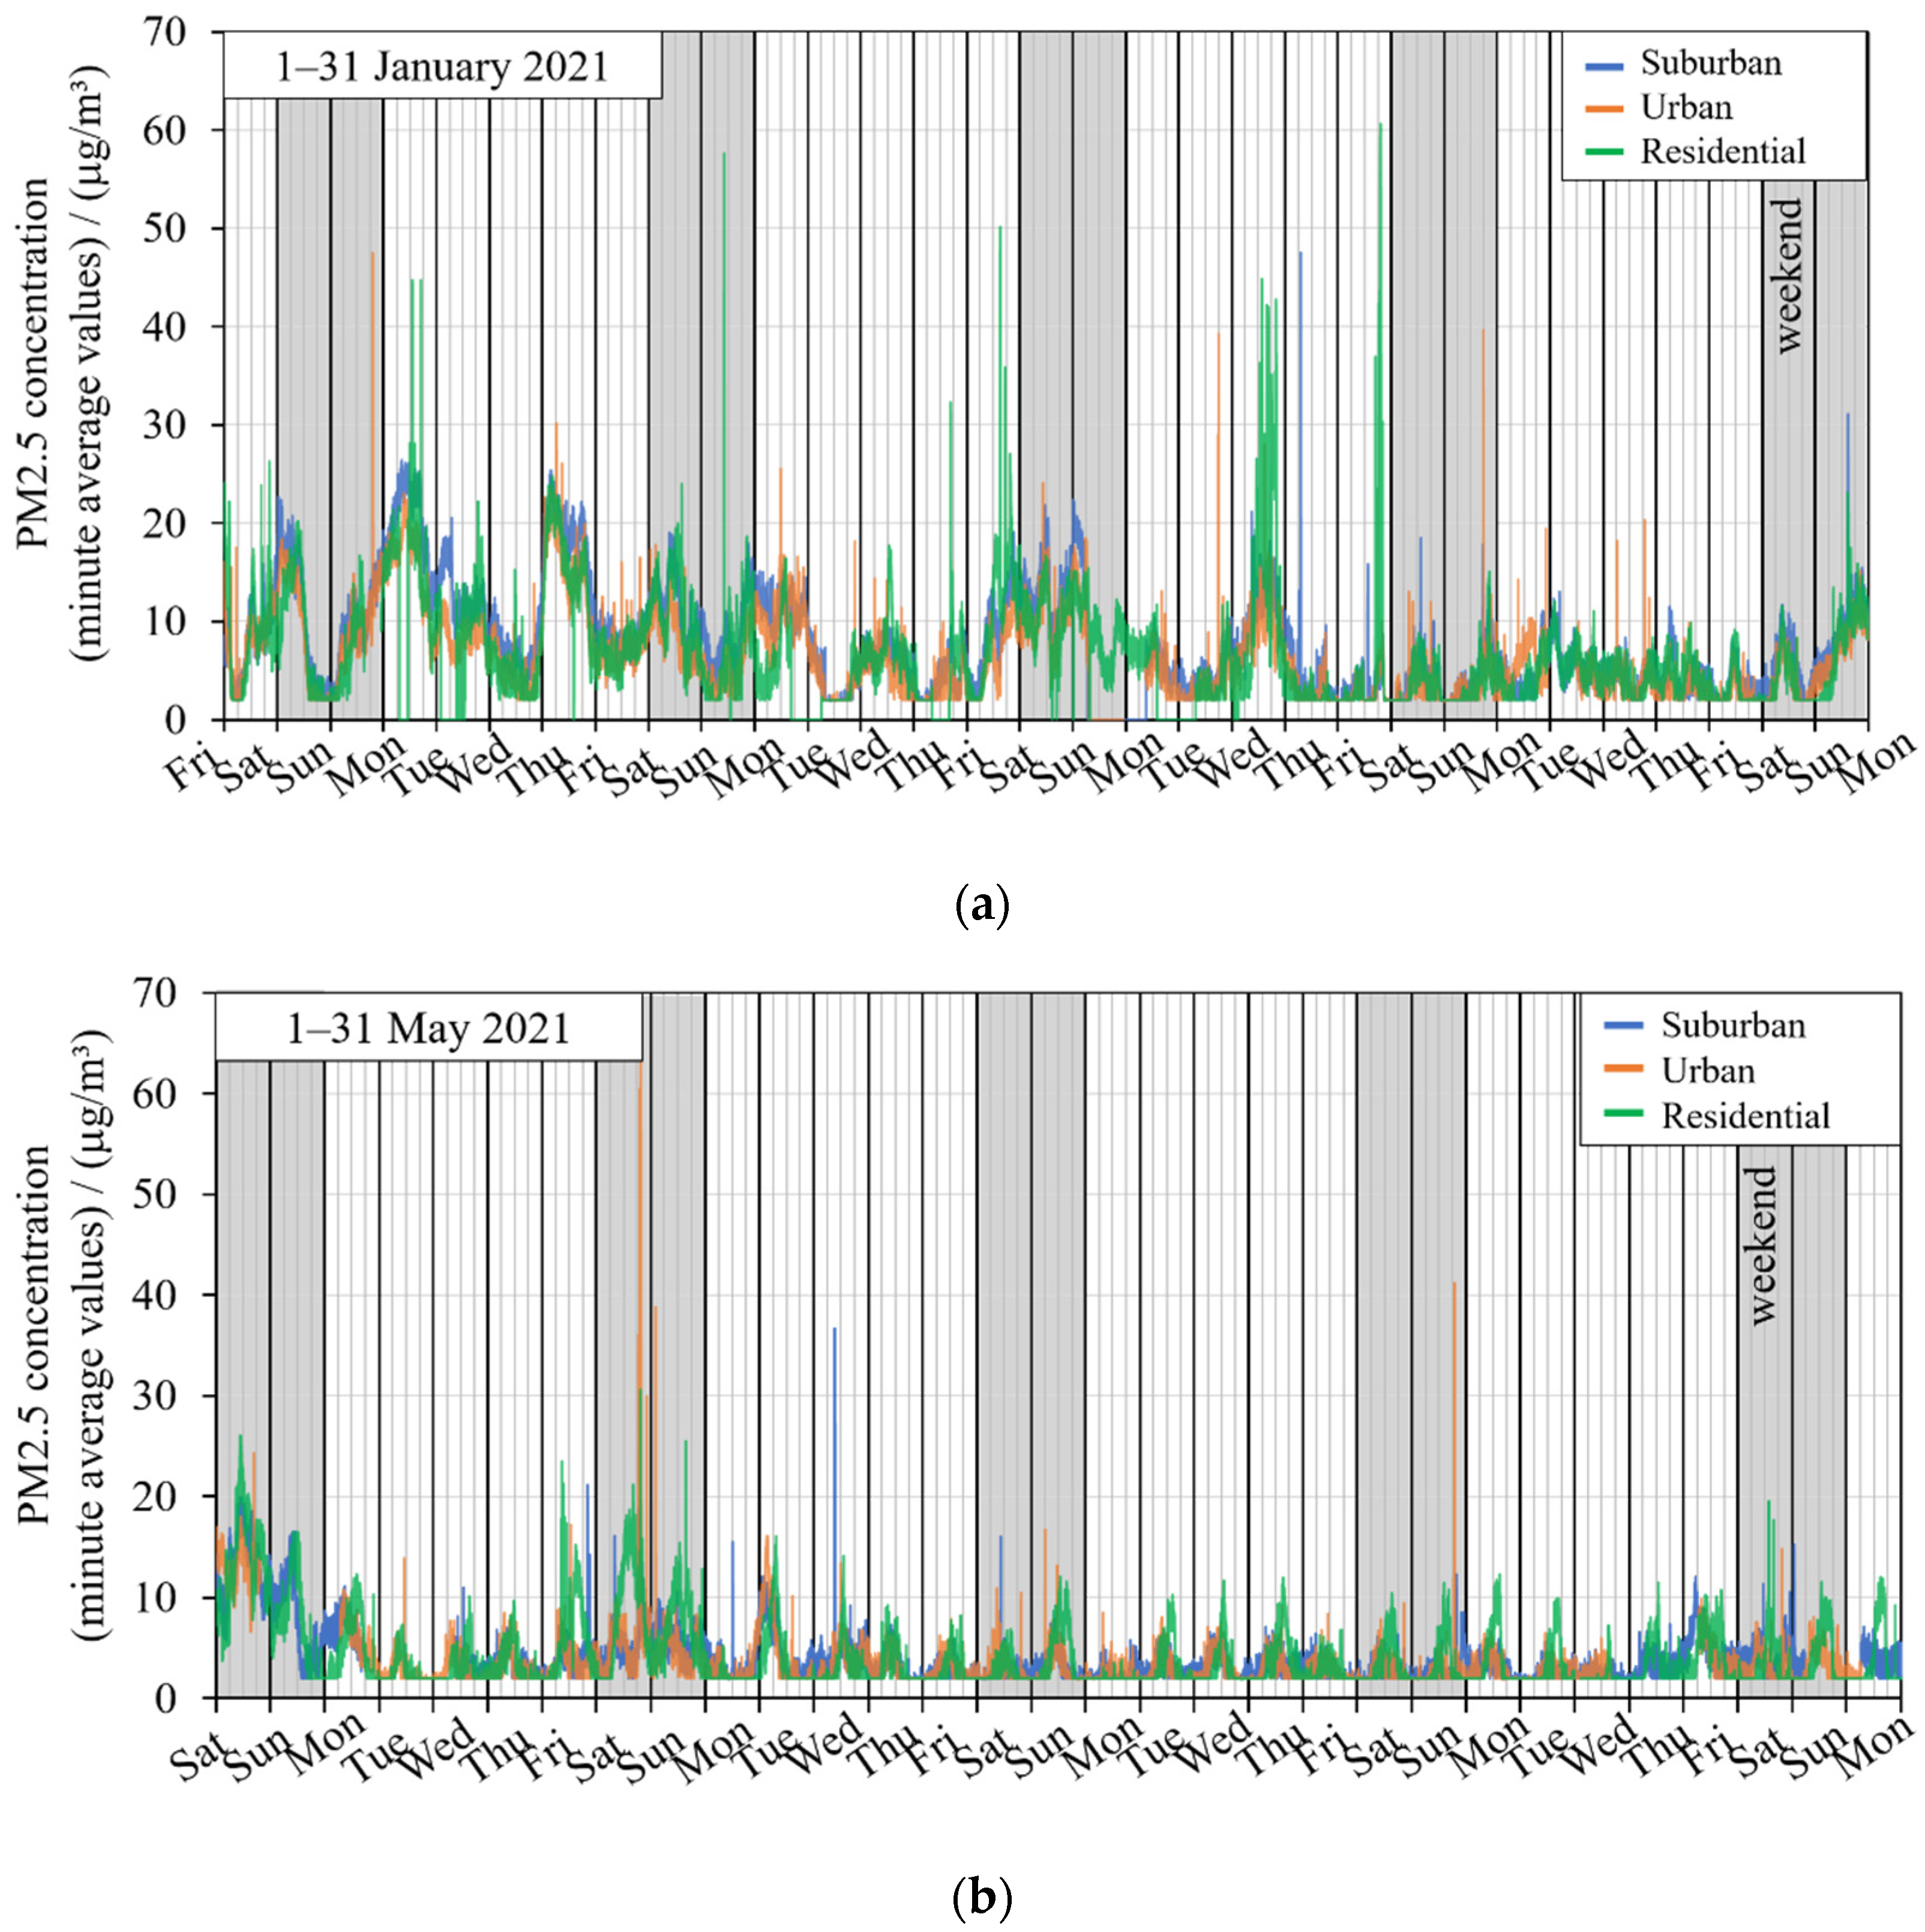
Figure 7 depicts the temporal development of the PM2.5 concentrations measured at the three measuring stations in January and May. In January 2021, the temperature in the area of Karlsruhe ranged between 4.4 and 13.8 °C, resulting in an average temperature of 3.1 °C. In May 2021, the minimum temperature was 3.8 °C and the maximum temperature was 29.8 °C, leading to an average temperature of 13.0 °C. Short-term data failures occurred due to disturbances in the data transmission and are presented as data gaps in the curve progressions. In January, the particulate matter concentrations at all stations ranged from approximately 2 to 60 µg/m3. High concentration peaks up to 60 µg/m3 mainly occurred in the residential area. Short-term peaks also appeared at the other stations, but these reached comparatively lower concentrations. In general, more peaks were determined in January than in May. In May, the concentration was mainly between 2 and 40 µg/m3—apart from 60 µg/m3, detected once at the urban location. The two selected months are also comparable with other months, e.g., January is comparable with December and May with the available results of June.
In addition to the short-term peaks, the concentration courses at the three stations are superimposed. This suggests large-scale PM2.5 pollution in the Karlsruhe area. In May, the large-scale PM2.5 concentrations are about two times lower than in January at all stations.
The illustrated lower concentrations are also reflected in the monthly mean concentration, i.e., the background levels, at the measuring stations (Table 6). Since the high concentration peaks especially in January, the monthly mean concentration is comparatively low. The largest PM2.5 exposure was determined in the suburban area with 7.9 µg/m3. In the residential area and at the urban location, the monthly mean concentration fluctuates around a comparable value of 6.9 µg/m3 and 6.3 µg/m3, in consideration of the respective standard deviation. In May, the deviations between the monthly mean values are smaller. Consequently, particulate matter levels do not vary as much between stations because there are fewer local events with high and prolonged exposure.
The comparatively low monthly PM2.5 concentrations, especially in January, imply that temporally limited and large particulate matter loads are only slightly considered in the balancing of the annual limit values.
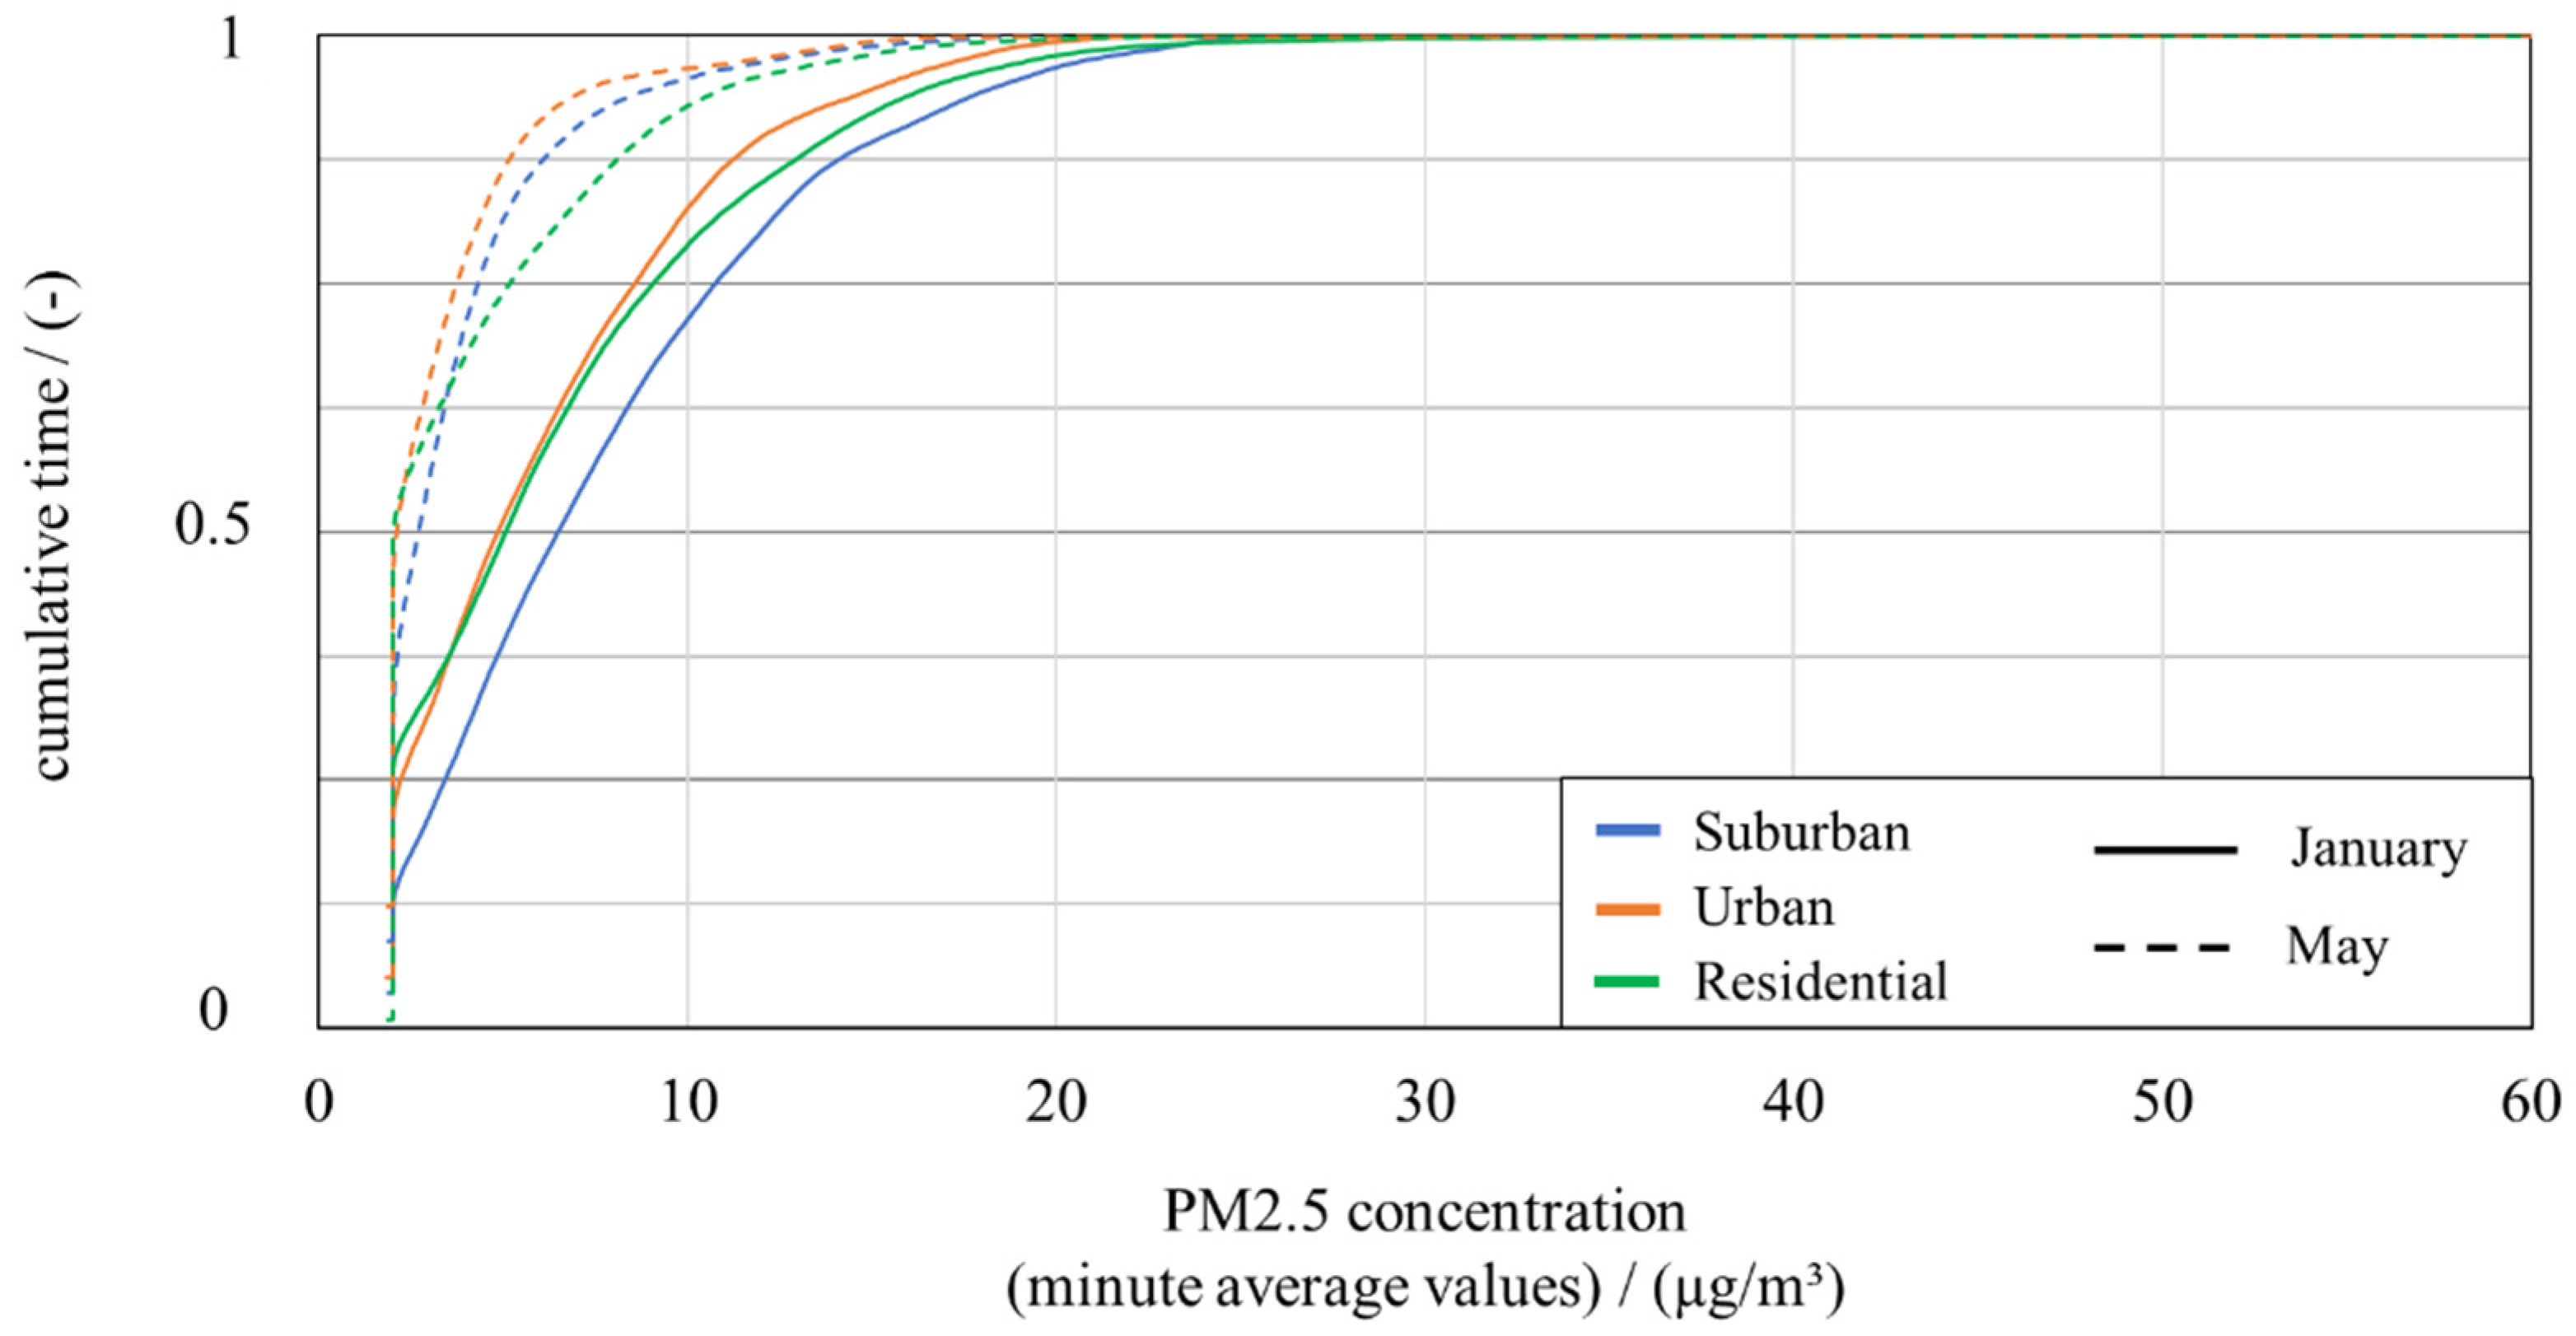
In order to verify the temporal occurrence of PM2.5 pollution in January and May, the PM2.5 concentration is plotted as a function of cumulative time in Figure 8.
Missing measuring values due to data failures were left out for the sake of clarity. Due to the missing data, the temporal exceedance of the limit value is underestimated.
As was already evident from the monthly averages, the concentration level in January is almost twice as high as in May. High short-term concentrations over 25 µg/m3 account for approximately 1% of the month in January and 0.5% in May. Three-quarters of the time, the concentration is in a range of 2 to 11 µg/m3 in January and, respectively, at 2 to 5 µg/m3 in May.
3.2. Comparison of the Three Stations
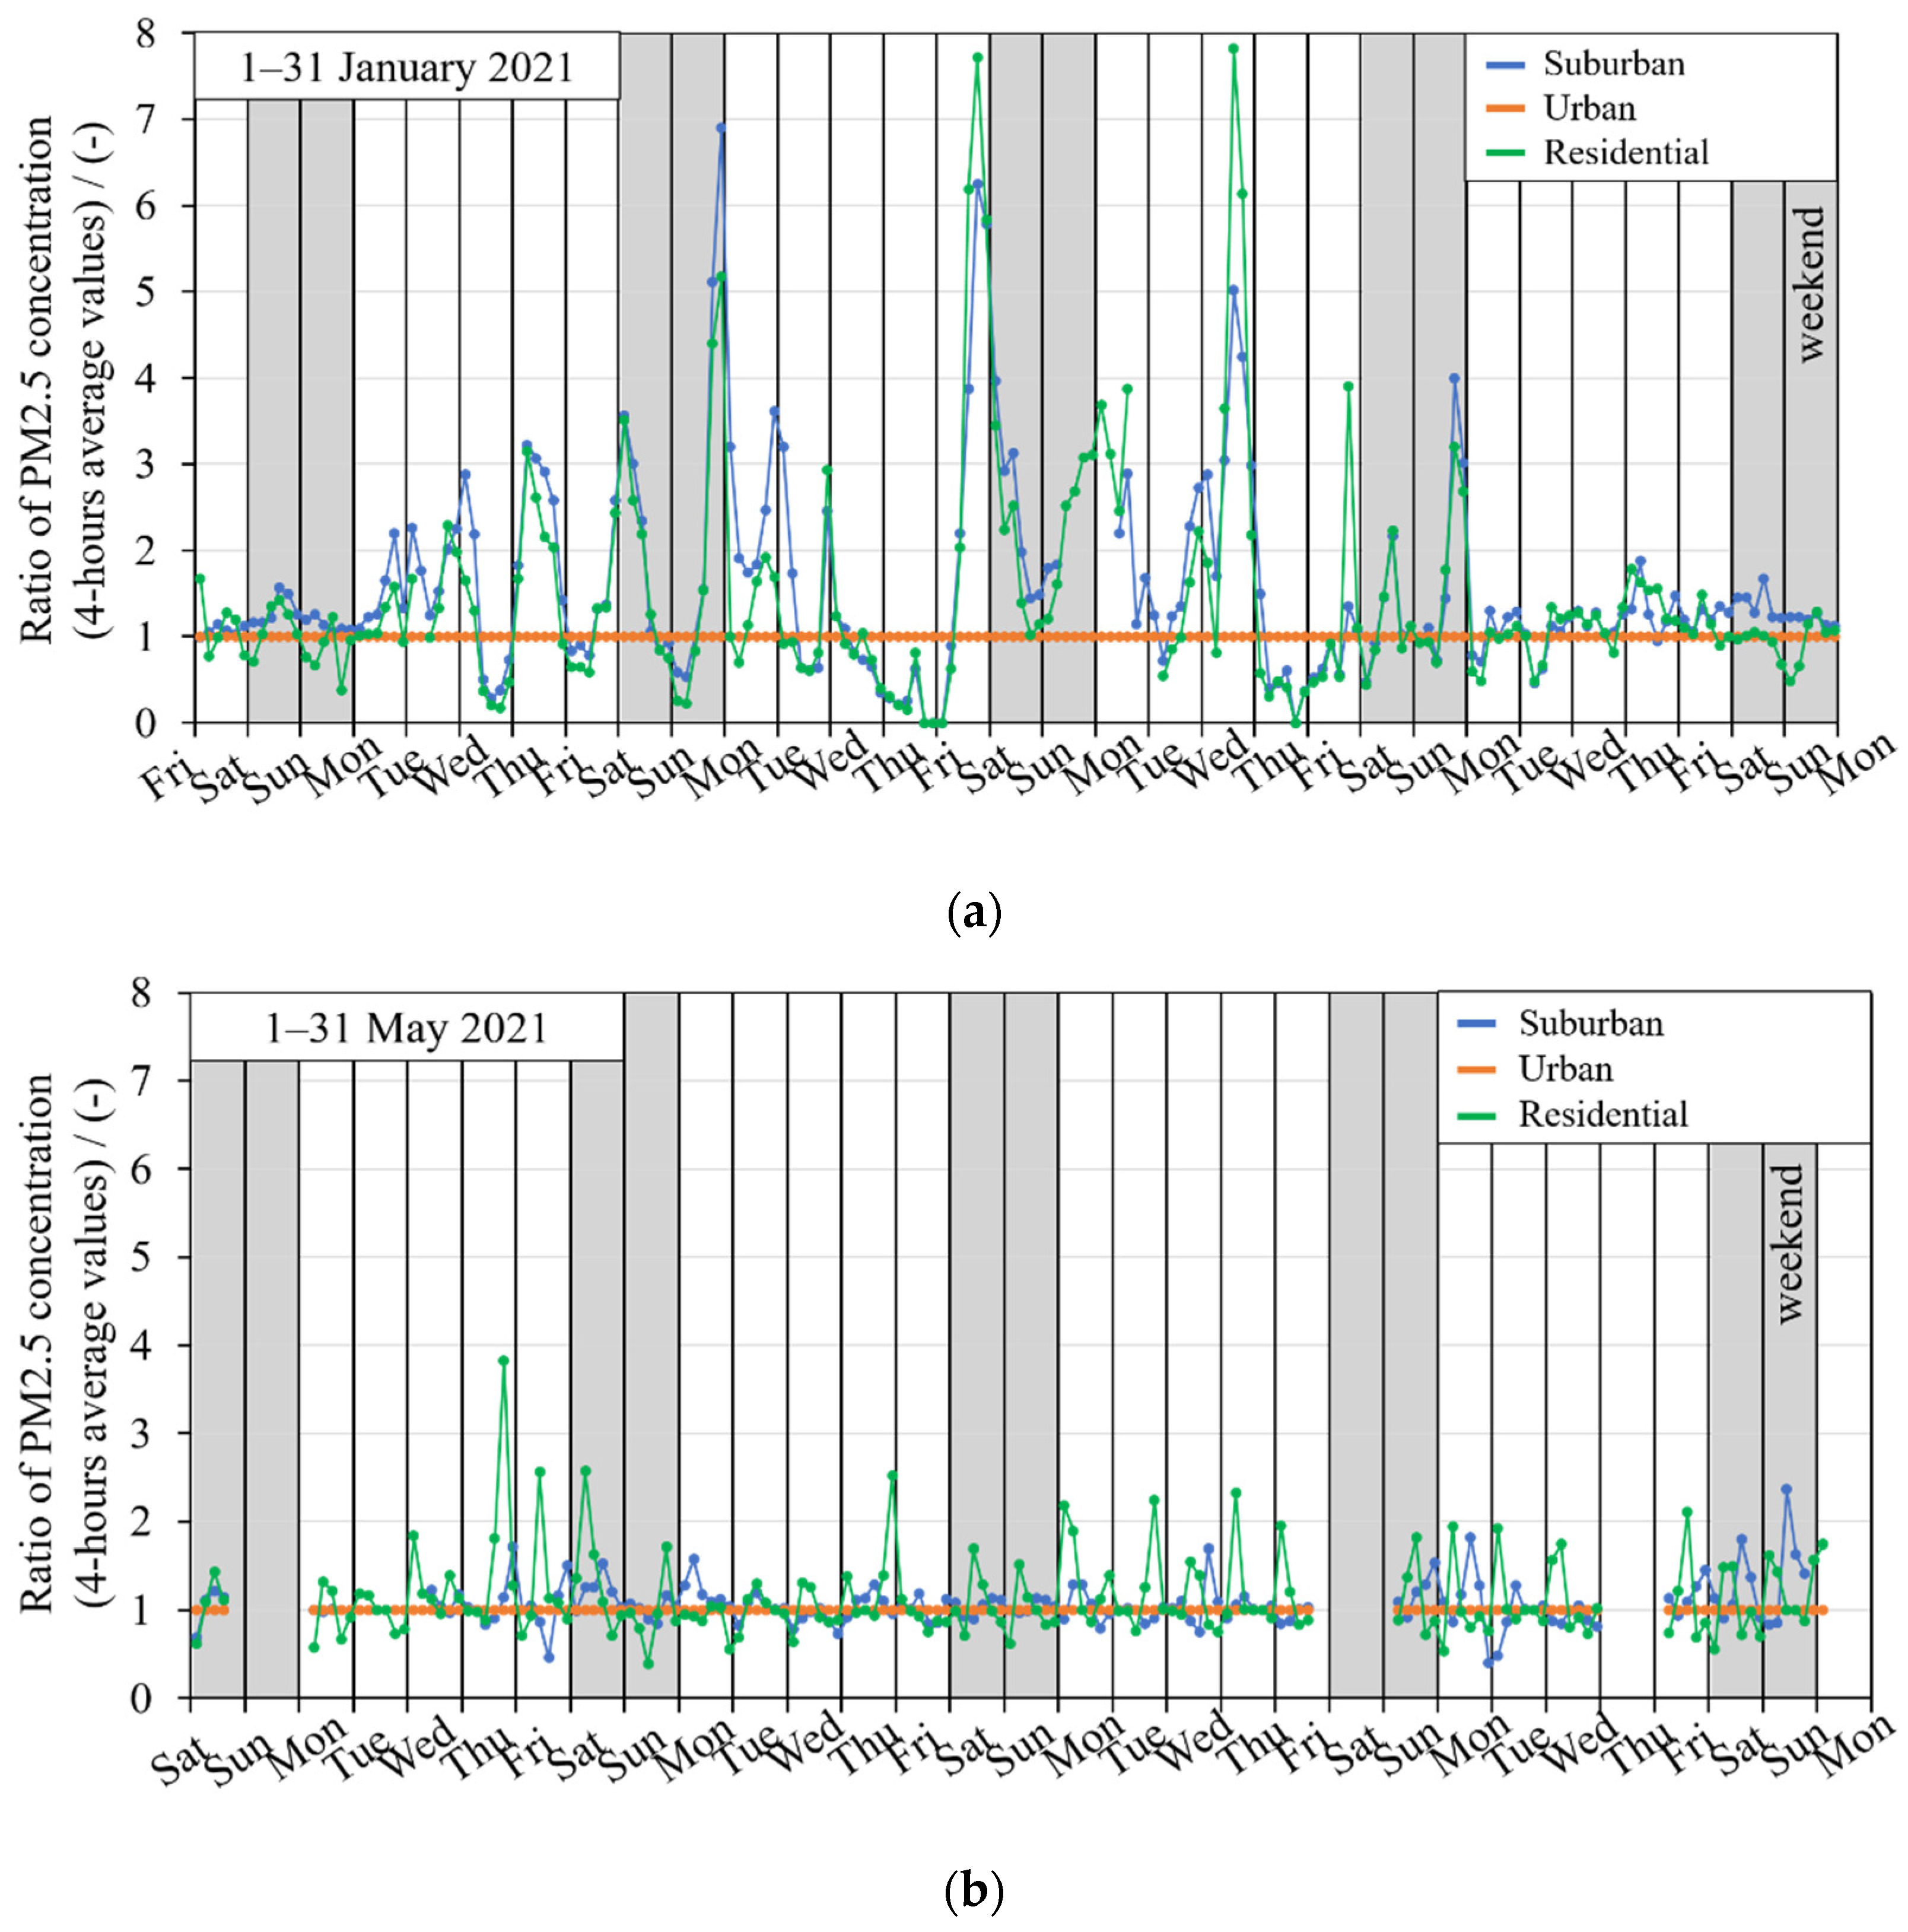
For a comparison of the three stations, the suburban as well as the residential station are considered concerning the measuring station close to traffic. For the sake of clarity, the evaluation is based on 4-h average values. The 4-h average concentrations in the suburban area and the residential area are compared to the traffic-dominated urban location. In Figure 9, the ratio of the particle concentrations (values) is illustrated for January 2021 (a) and May 2021 (b).
Generally, the differences in PM2.5 concentration at the suburban measuring station and the residential area concerning the urban station are larger in January than in May. In January, the concentration level reached was often two to eight times higher in the overages than in the undercutting of the reference concentration. Especially, in the residential area, the concentration was up to eight times higher than at the urban area (near traffic) on two days. In May, the largest deviations occurred in the residential area. Here, up to 3.7 times higher PM2.5 exposures are determined over almost 12 h.
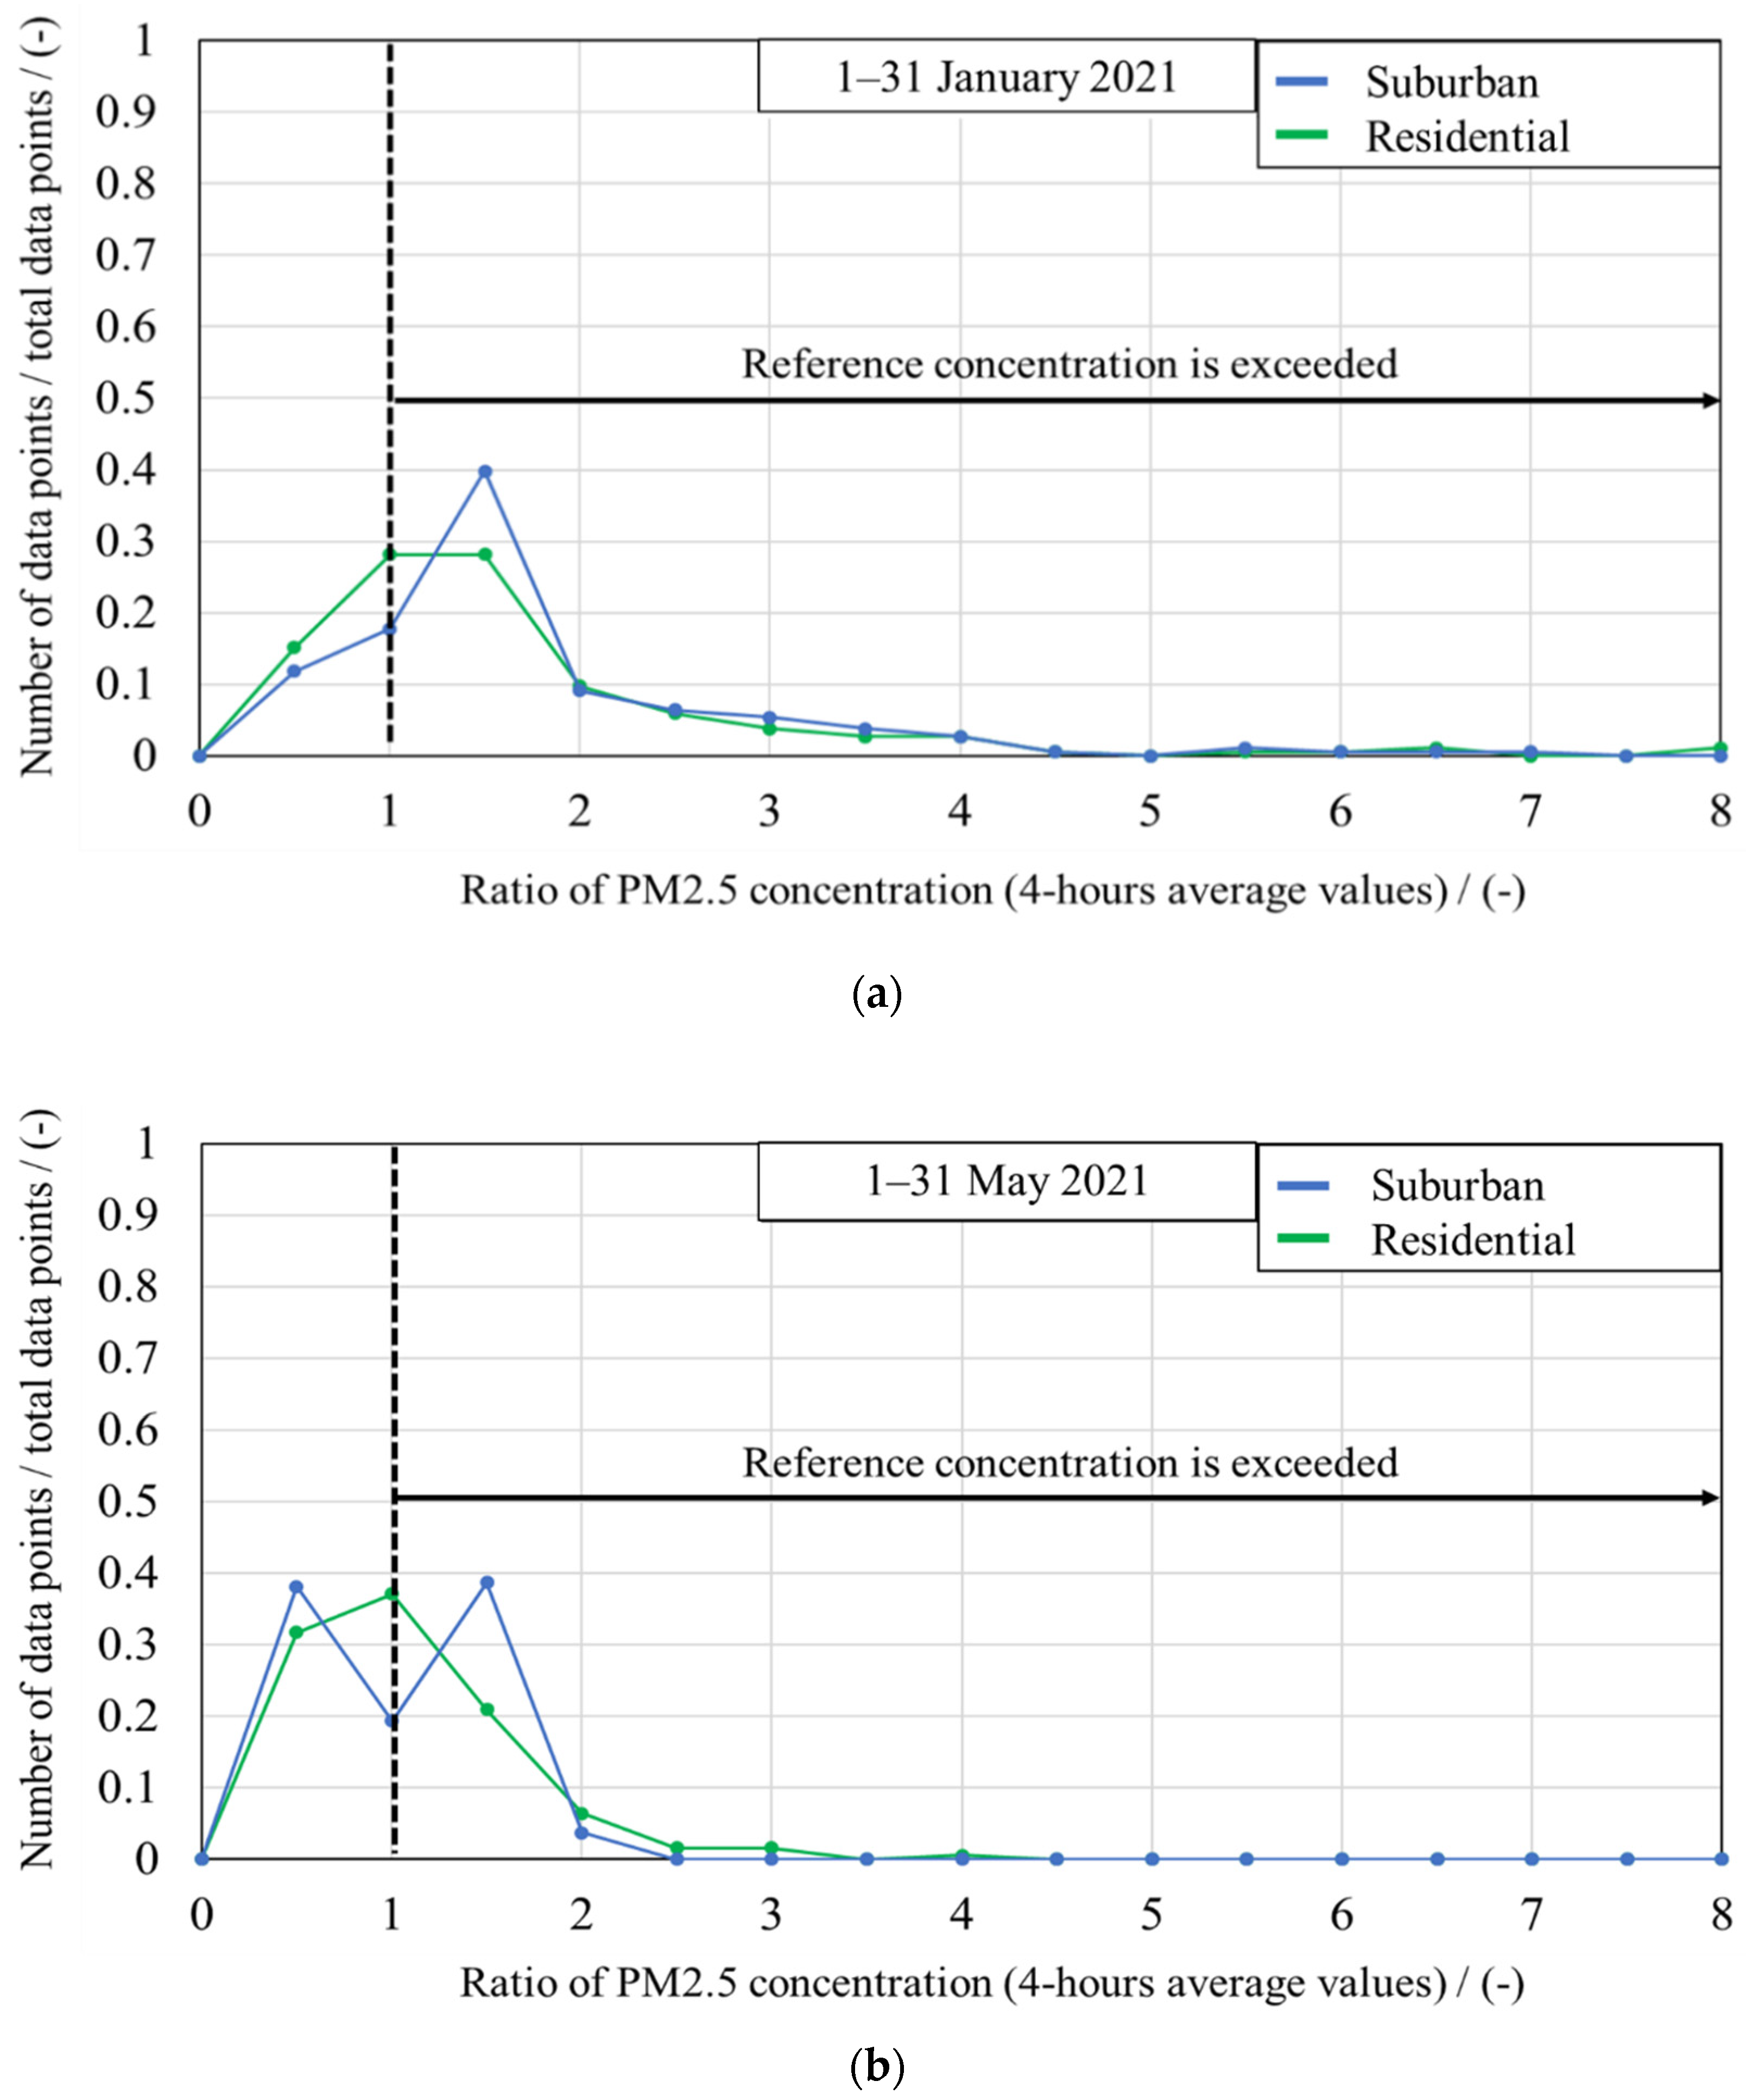
In order to show trends, the number of data points is related to the particular range (0.5 steps) of the ratio of PM2.5 concentration in Figure 10. In January, as well as in May, most detected concentrations are one to two times higher at the suburban and the residential area than at the urban location. In January, 67–71% of the measured values are above the level measured at the urban area. The proportion of significantly higher concentration ratios > 3 also occurred more frequently in January. In May, 57–61% of the measured values are below the reference concentration. Furthermore, the reference concentration is exceeded only four times by factors > 3 in the residential area, in May. Accordingly, significantly higher levels of particulate matter occurred at the measuring stations further away from traffic than in the immediate vicinity of traffic, particularly in January.
3.3. Frequency of Short-Term Air Pollution with PM2.5—Peak Evaluation
In the following, to analyze the local peaks (short-term events, which have high particulate matter concentrations), only the maxima of the measured PM2.5 concentrations, which represent short-term pollution, are observed. In this case, a peak is defined as a local maximum, which has a PM2.5 concentration above 25 µg/m3 (local peaks below 25 µg/m3 are not considered). The limit concentration for the peak evaluation was selected based on the annual limit value of the 39. BImSchV [4]. For this evaluation, the minute mean values of the measurements were used.
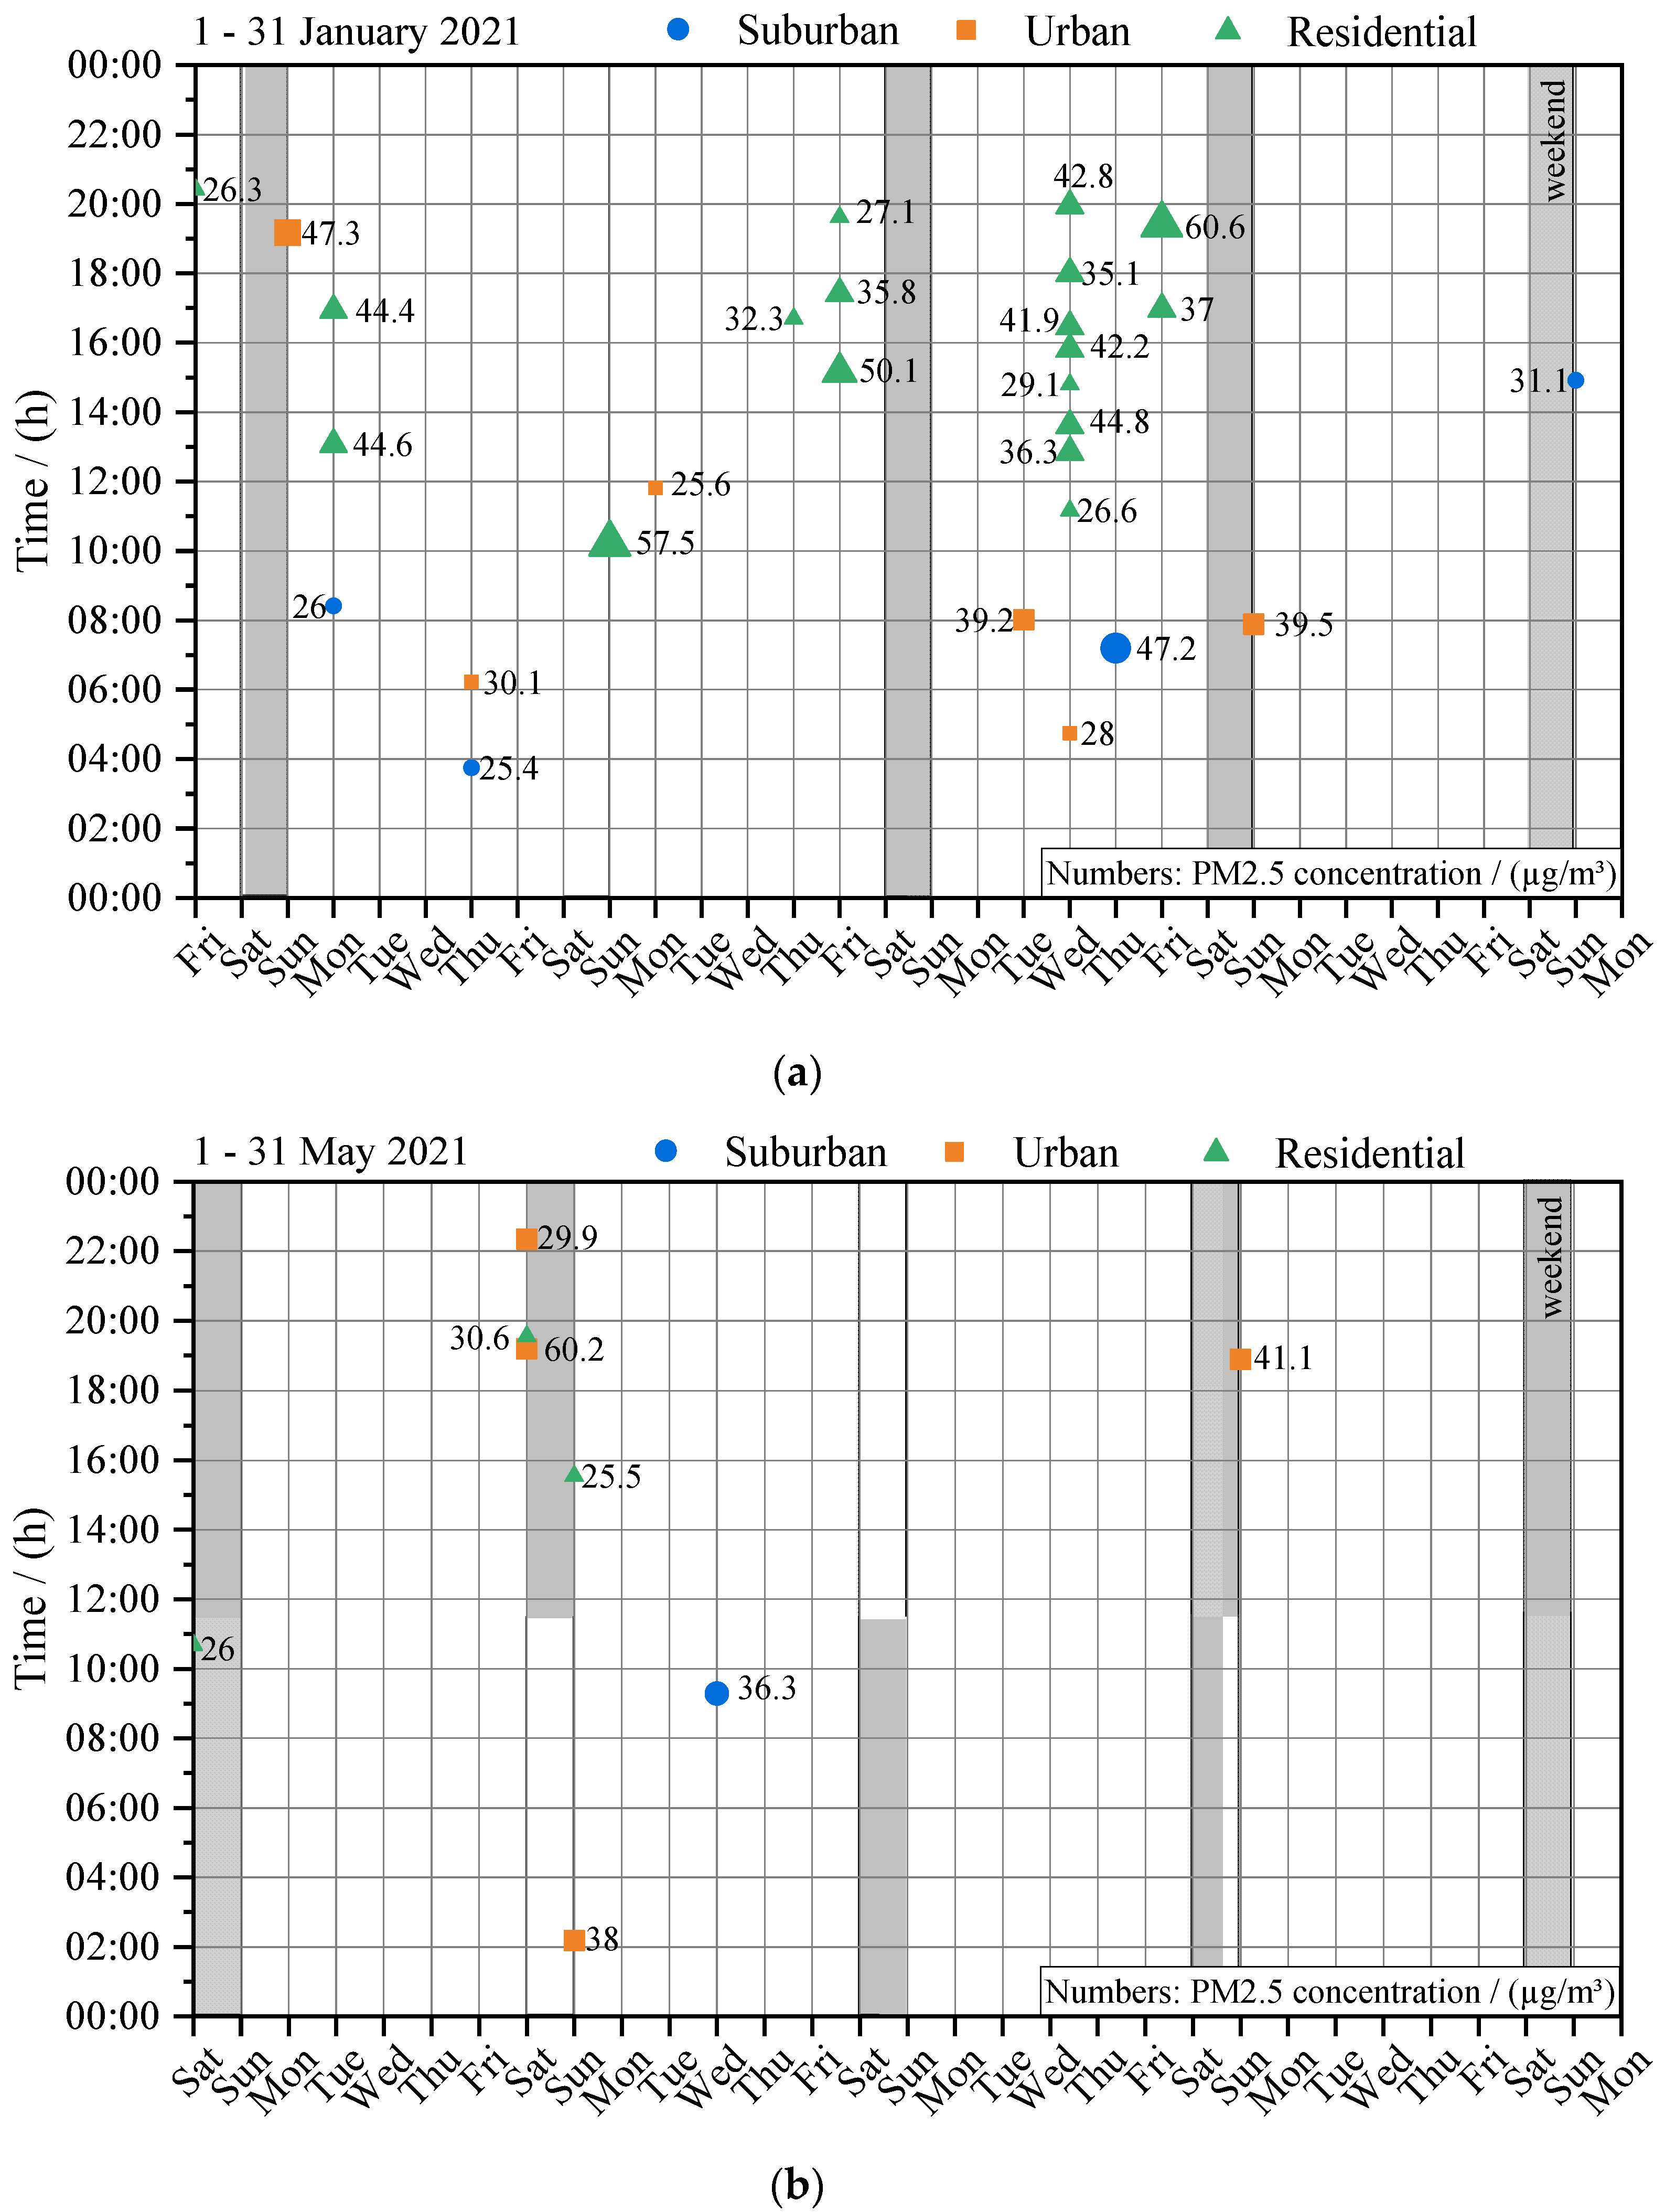
Figure 11 presents the comparison of the concentration peaks of the evaluated months: January (a) and May 2021 (b). The larger the point, the higher the pollution at the respective measuring station. The comparison of the two figures (Figure 11a,b) shows that more peaks were measured in January than in May 2021. In January, the PM2.5 pollution in the residential area is significantly higher compared to the other two stations. At this station, 66% more peaks occurred and reached maximum values over 60 µg/m3, which is more than twice the current annual average value of 25 µg/m3. In January 2021, it is noticeable that the peak PM2.5 concentrations in the residential area mostly appeared in the afternoon and evenings as well as on Fridays. Concentration peaks in the night (0:00–5:00) and in the morning hours (5:00–9:00) were not measured in the residential area. In these periods, most of the concentration peaks were detected in the urban station and are distributed during the week, without regularity on a weekday, and have an average concentration of 35 µg/m3 (average of all peaks), which reduces only slightly in spring to 33.5 µg/m3. Compared to the monitoring station close to traffic (urban), the residential area exceeded the average of all peaks with an average peak concentration of 40 µg/m3 in January 2021. Peaks at the suburban measuring station were rare in January and May 2021, and thus have no regularity in terms of day of the week and time of day.
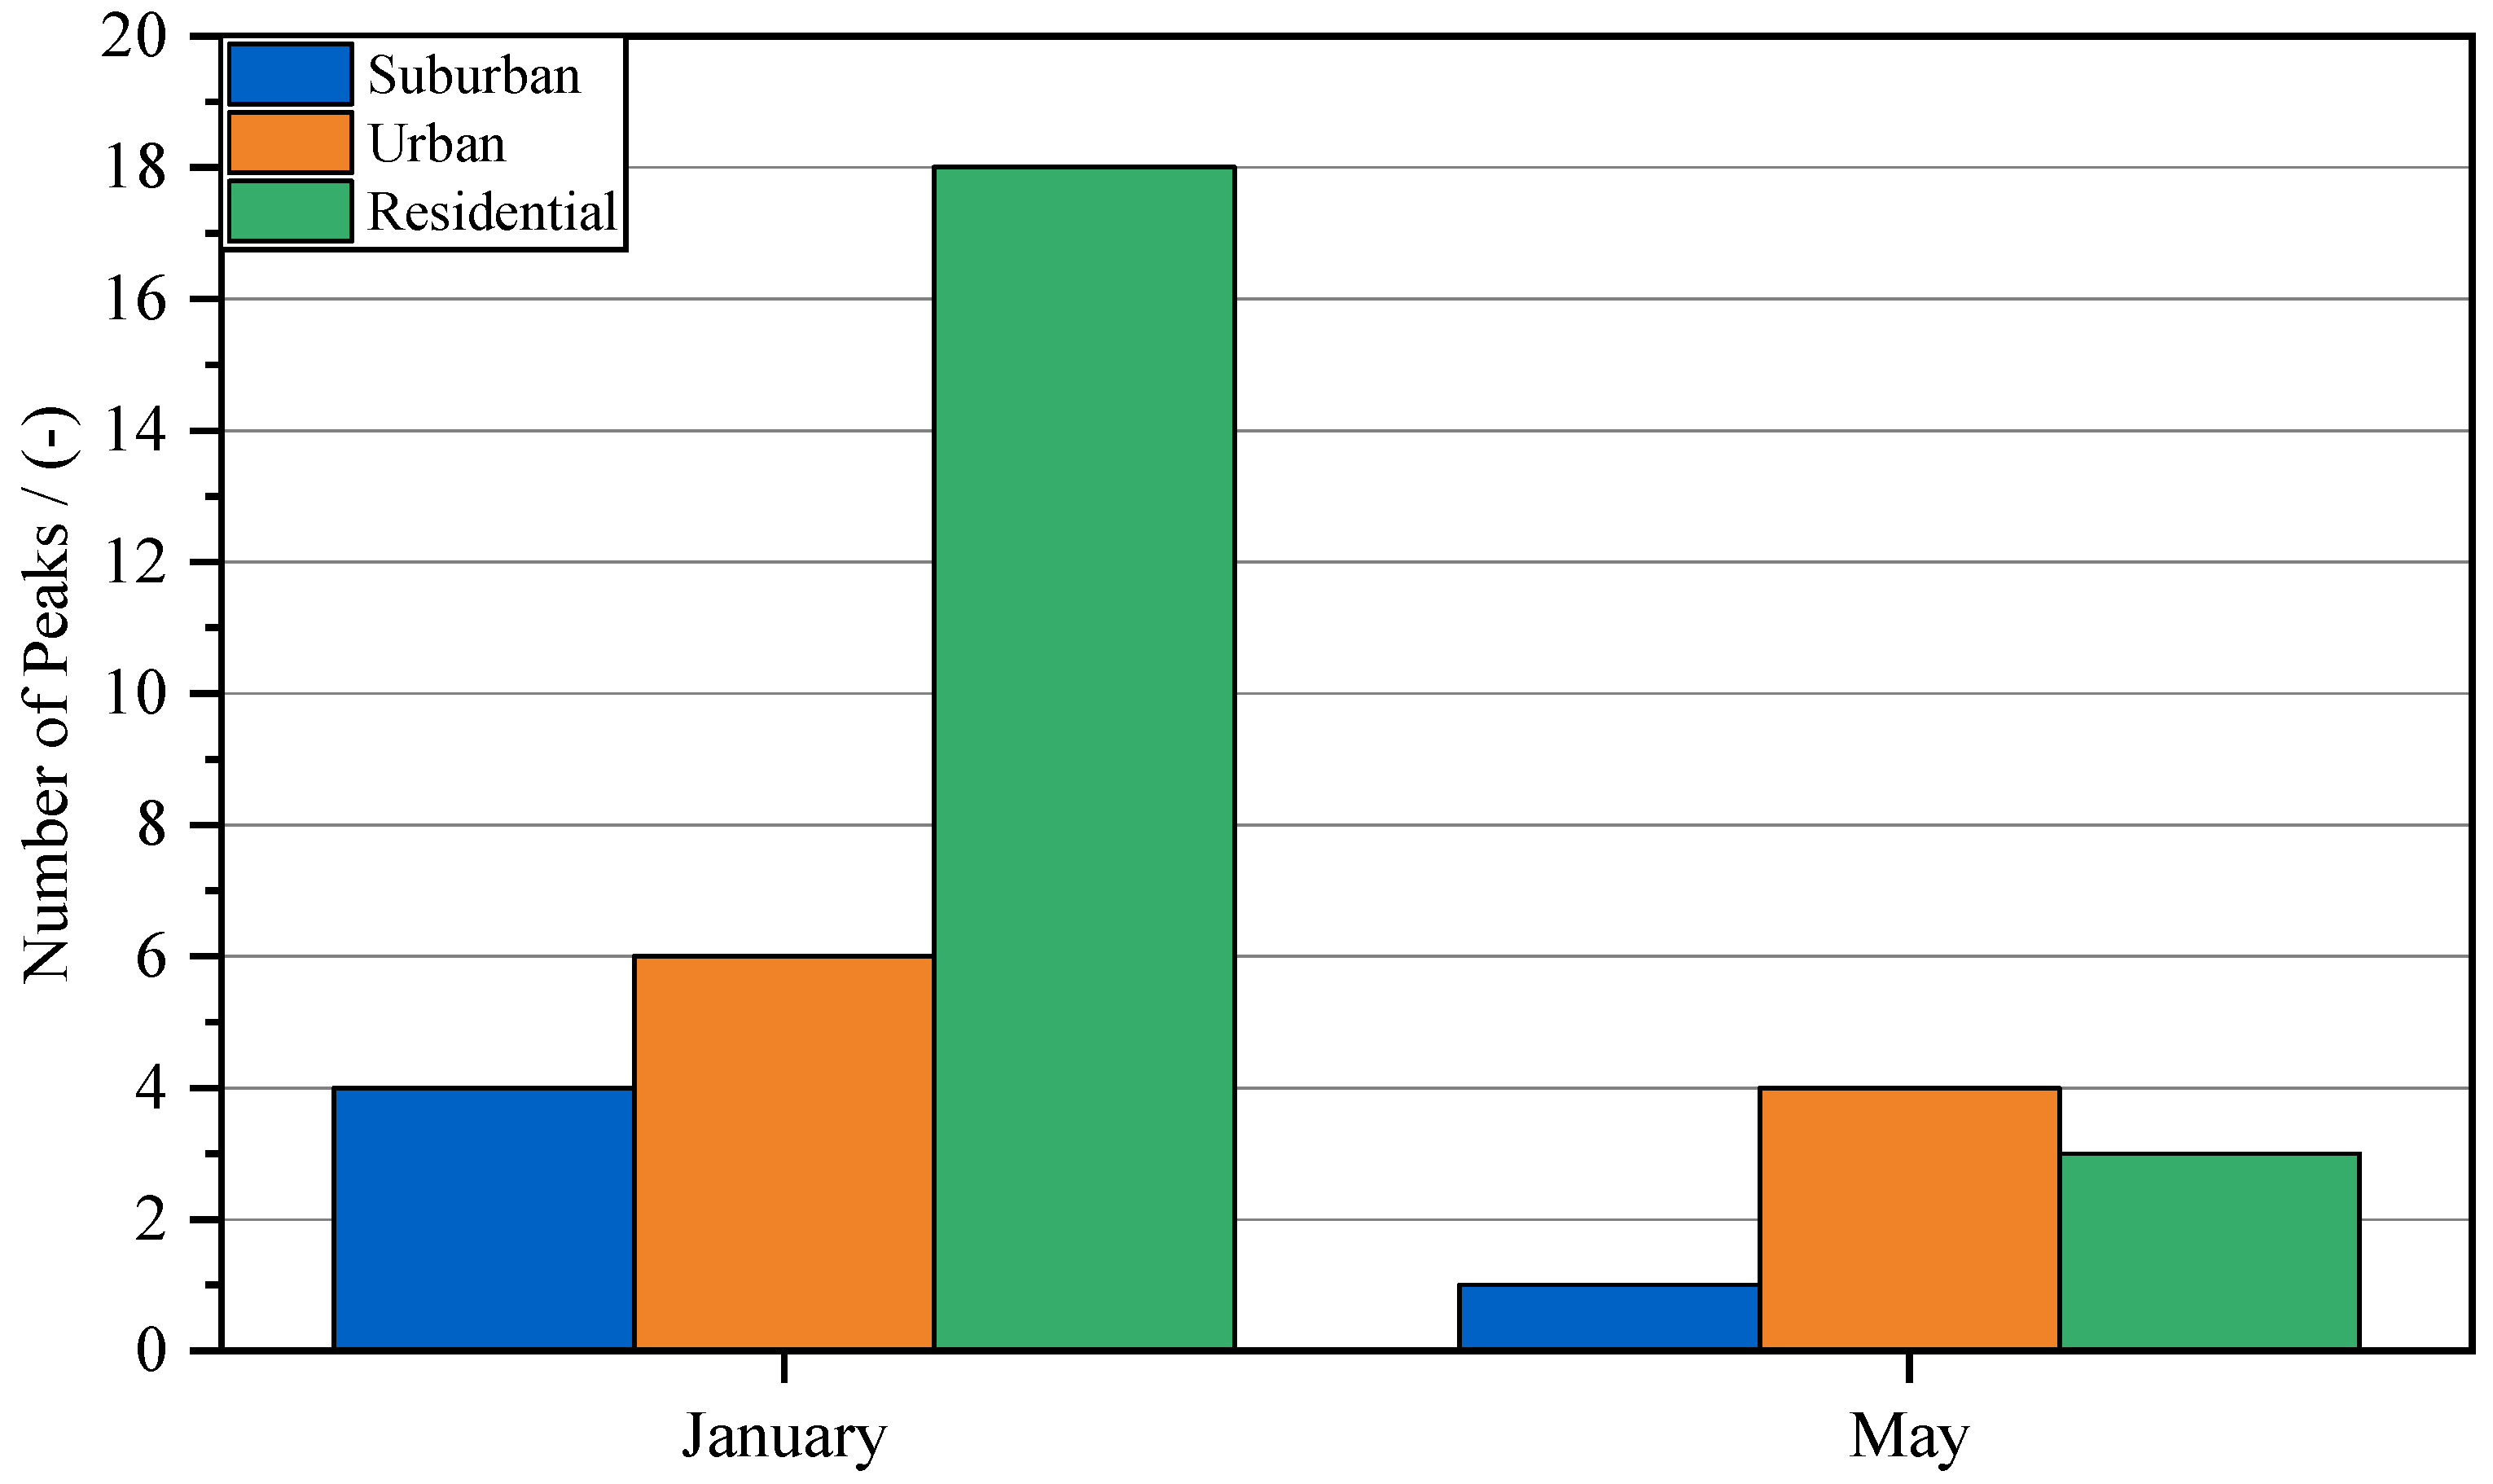
A comparison of the number of peaks above 25 µg/m3 at the three stations is presented in Figure 12. In January 2021, the residential area had three times higher numbers of peaks than the station close to traffic (urban). In May, the number of peaks decreased at the suburban station and the residential area. At the urban station, the number in January and May is comparable.
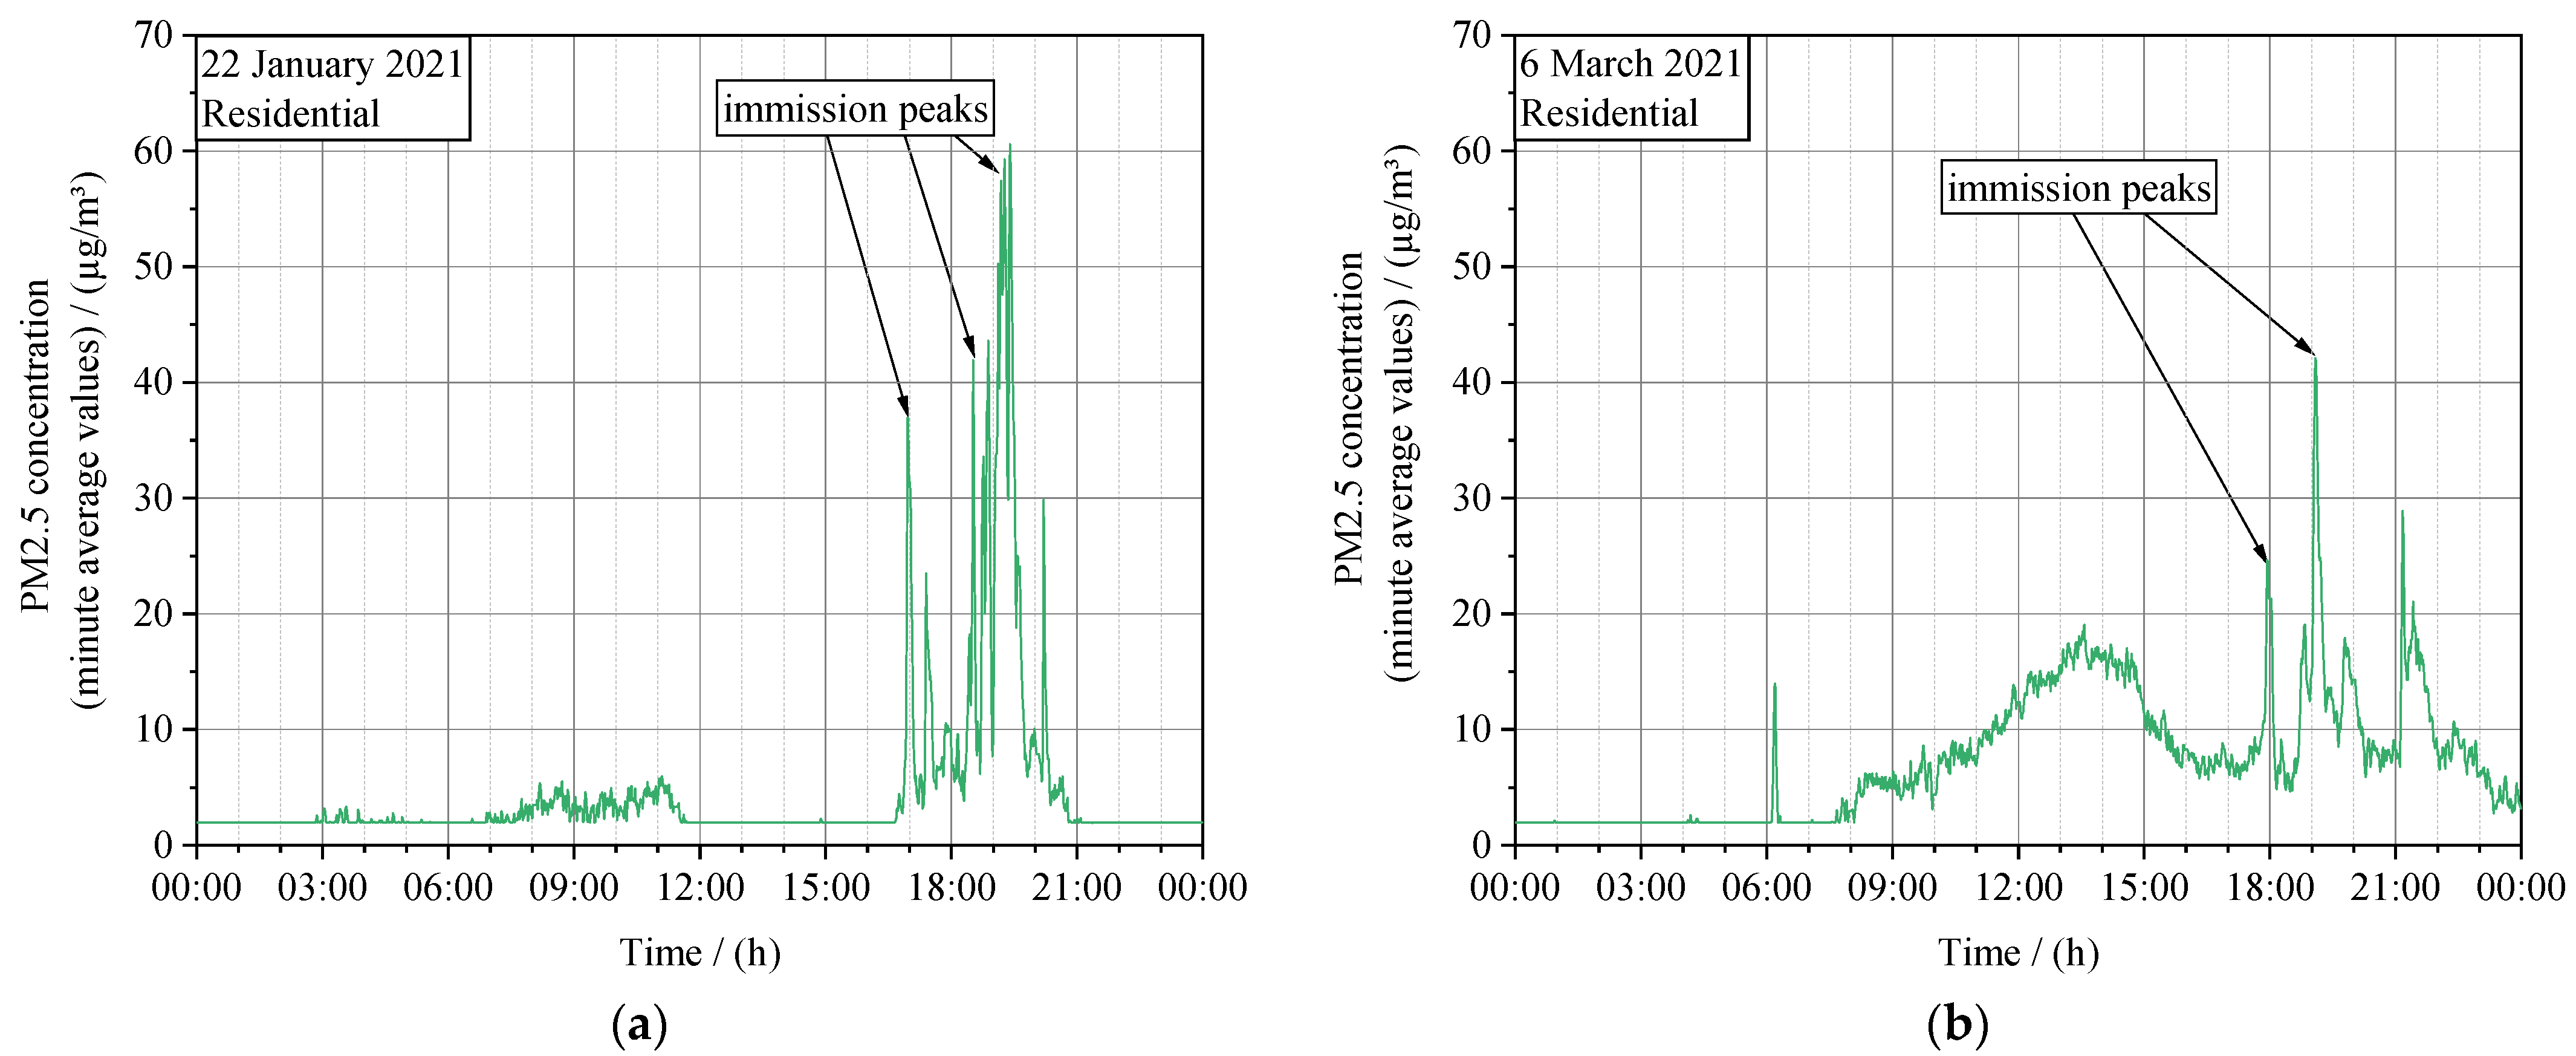
In Figure 13, the PM2.5 concentration curves of two exemplary days in the residential area, 22 January and 6 March, are shown to illustrate the PM2.5 immission levels. This station was evaluated based on the previous measurement data (see, e.g., Figure 12), since the loads in the residential area are significantly higher than the urban and suburban station in winter.
On 22 January 2021, a low PM2.5 concentration was measured in the residential area during the day. Starting at 5 p.m., the PM2.5 concentration increased steeply and reached a value of 38 µg/m3. Afterward, there is a peak about every half hour until the maximum peak of over 60 µg/m² is reached at 7:16 p.m. The PM pollution decreases until 9 p.m., with one more peak (23 µg/m3) at about 8 p.m.
On March 6, in contrast, the PM2.5 pollution was also significantly higher during the day and rising steadily from 8 a.m. until about 18 µg/m3 at 1:30 p.m. The measured peaks above 25 µg/m3 were recorded on this day at 6 p.m. and repeatedly recur every hour, with a maximum peak concentration of 42 µg/m3. The concentration curves shown here illustrate a common ambient air quality pattern in residential areas that PM2.5 immissions increase significantly in the evening hours.
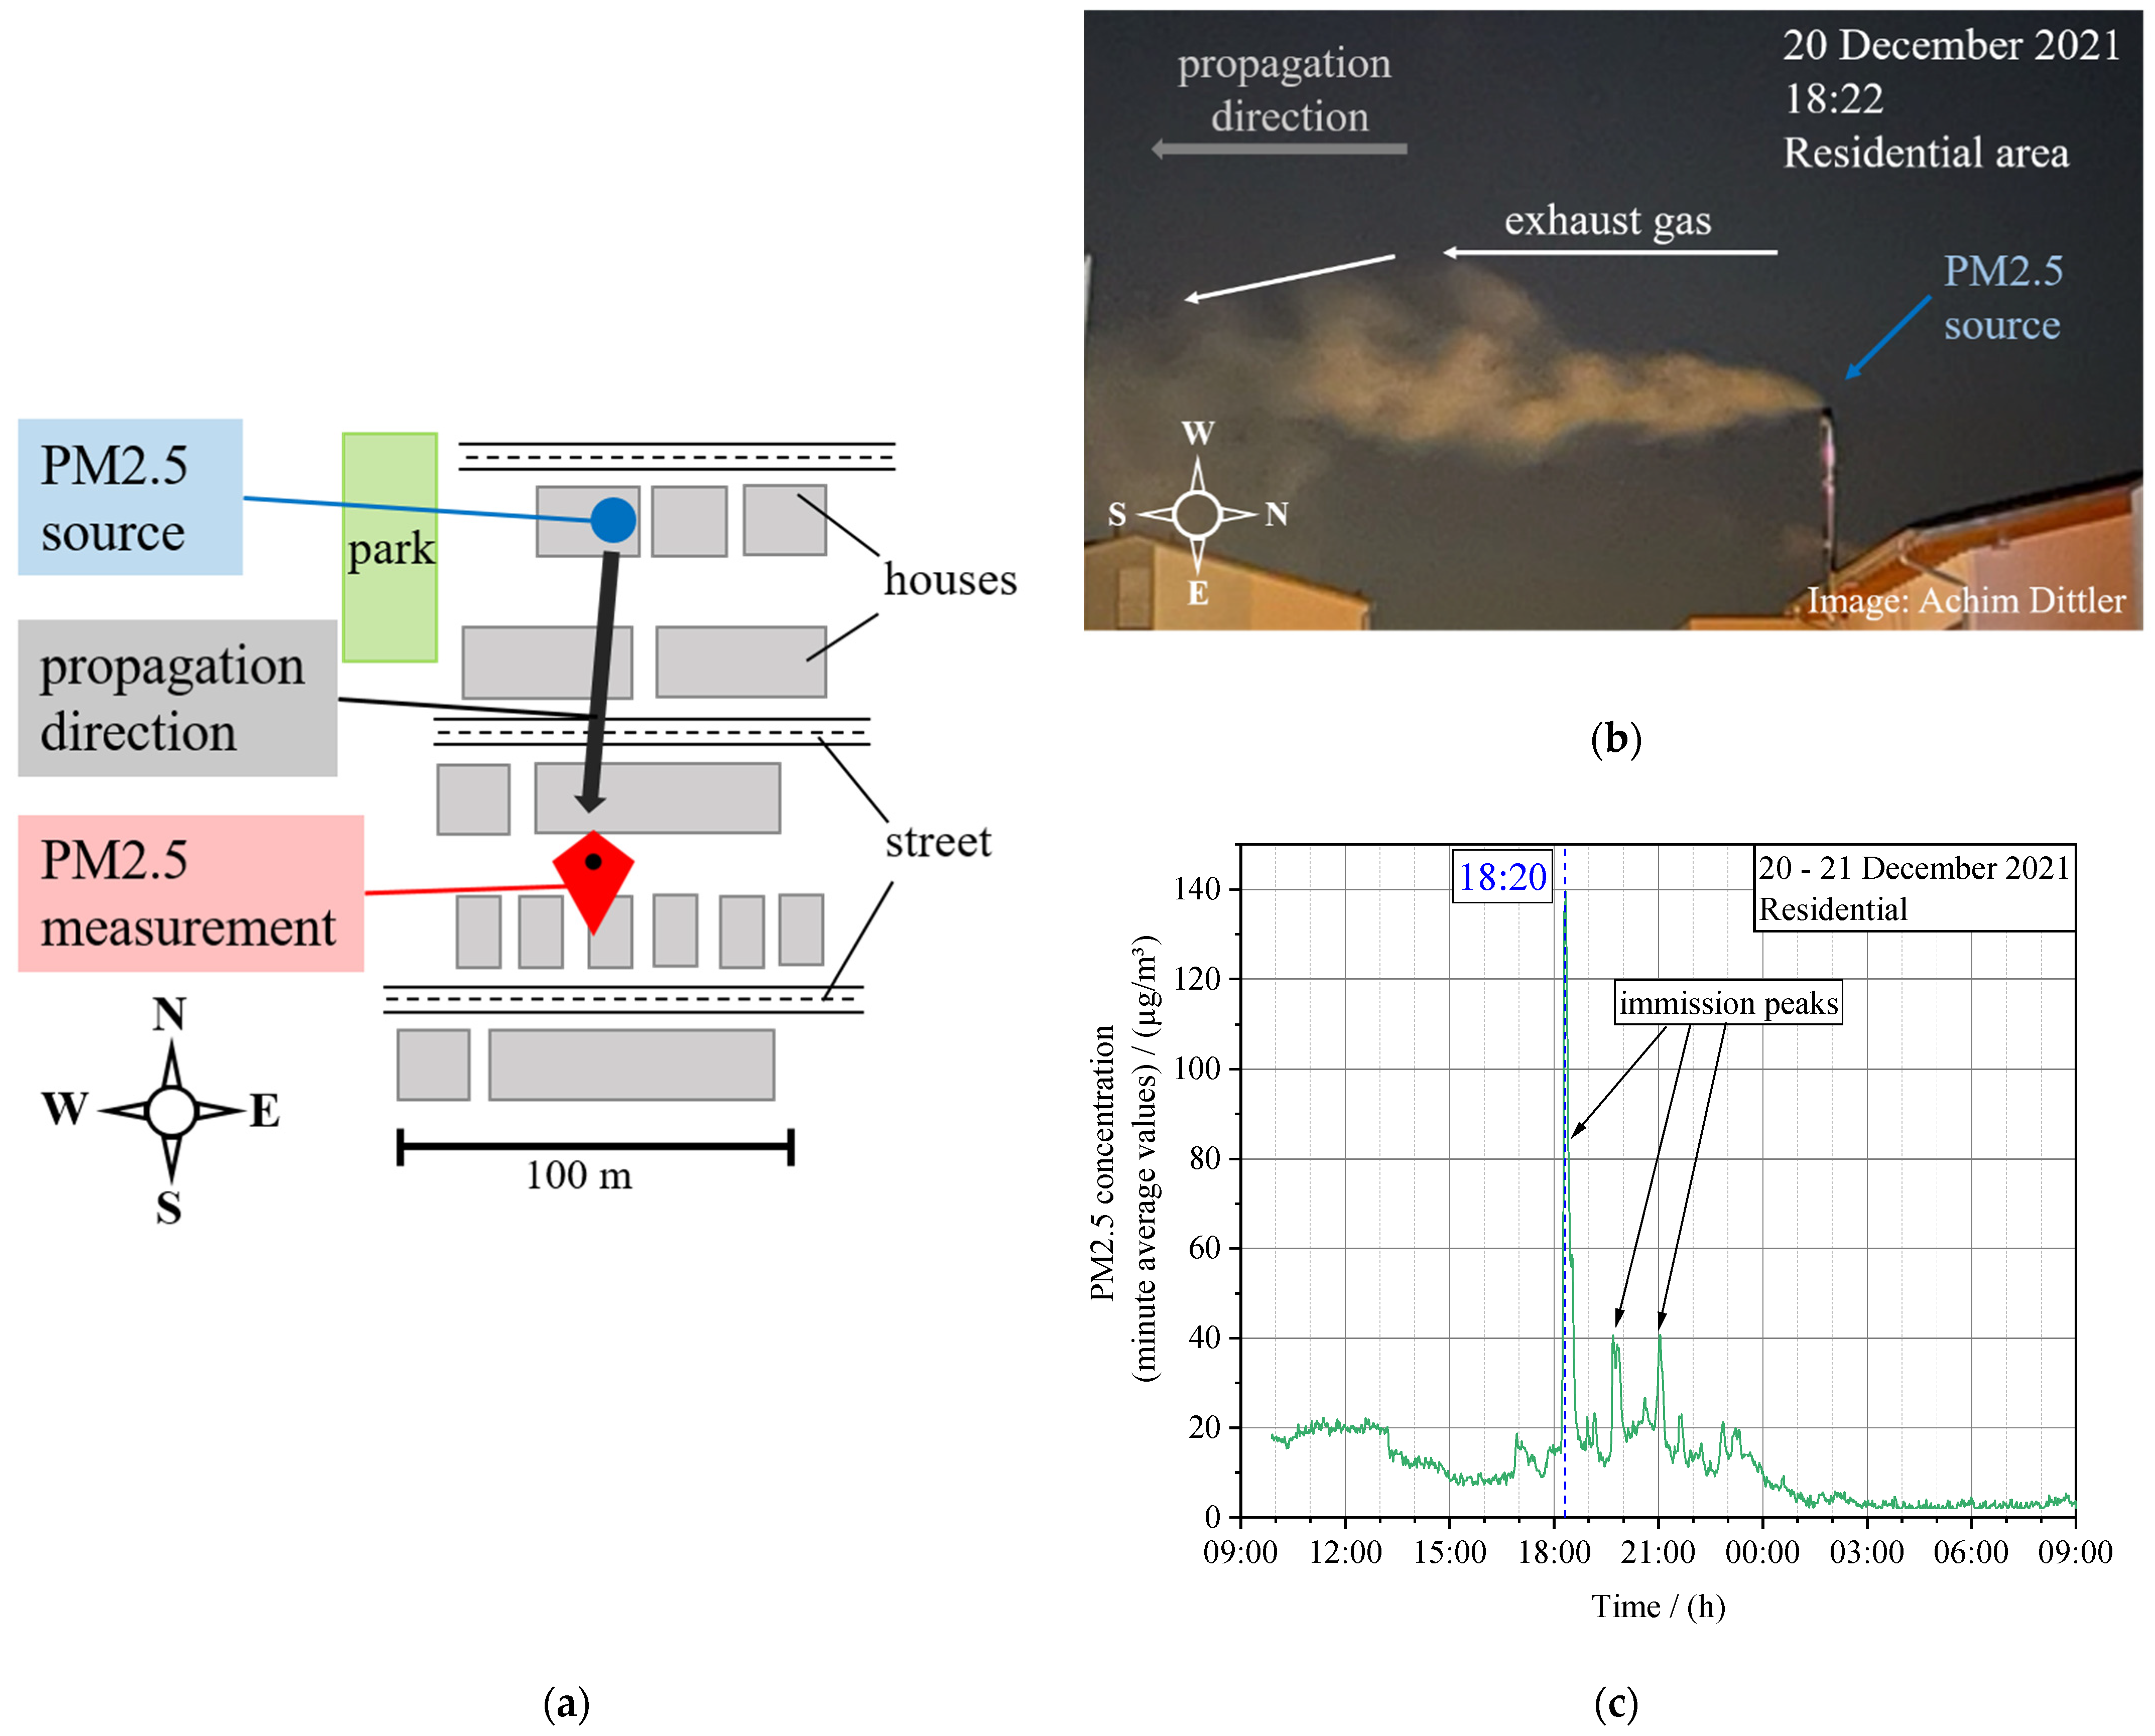
Another example of PM2.5 immission measurement and source identification by optical observation is shown in Figure 14. Here, Figure 14a presents a schematic map of the location of the measuring station and the source of the PM2.5 pollution with the direction of propagation. The source of particulate matter is located north of the measuring station.
The corresponding image (Figure 14b) to the measurement on 20 December (Figure 14c) shows the transmission of the exhaust gas from the chimney in the direction of the measuring station. The exhaust gas from the combustion does not rise vertically but flows in a horizontal direction to the measuring point. This is attributable to the fact that the height of the chimney is too low and is not installed at the highest point at the single-pitch roof. The image was taken on 20 December at 18:22. On this day, the PM2.5 concentrations were about 20 µg/m3 in the time between 10 a.m. and 1 p.m. Due to problems with data communication, the measured PM2.5 concentrations were not recorded before 10 a.m. In the evening, the measured PM2.5 concentration increases steeply and reaches a maximum value of 144 µg/m3 at 6:20 p.m., shortly before the optical observation (Figure 14b). Subsequently, further hourly peaks with concentrations of about 40 µg/m3 were measured. As already described above, a smoking chimney in the immediate vicinity of the measuring station was identified as the source for the short-term high particulate matter immissions. In this case, the visual observation was made between the measured values and the visible contamination caused by a combustion process.
4. Discussion
The study confirms that the PM2.5 concentration at all three measuring stations is approx. 50% higher in January than in May, which other studies have also shown [16,18]. In Karlsruhe, 31 heating days and 5 freeze days were counted due to the low temperatures in January (average temp., 3.09 °C) [27]. January is in the heating season, which confirms the higher PM concentrations. However, the basic pollution by traffic remains comparable in summer and winter [16].
The annual EU limit value of 25 µg/m3 is not exceeded in the considered two months in city areas as well as in rural areas. Since only two months of 2021 are treated in the evaluation, no statement for the annual mean value can be made from the data. Nevertheless, the data reflects the trend of recent years, as the PM2.5 concentration has been decreasing for years and the annual limit value has not been exceeded in Germany since 2010 [8]. If the monthly mean values are compared with the value recommended by the WHO guideline of 5 µg/m3 [3], it can be seen that, in January, all three stations are above the guideline value. In May 2021, the behavior is different; here, the value recommended by the WHO guideline can be complied with. The results already reveal, based on the monthly mean values, that higher concentrations of fine particulate matter in winter are compensated for by lower concentrations in spring. Consequently, temporally limited high particulate matter pollution has no significant impact on the averaging process of the limit values, which means that the annual mean values are not affected by individual peaks.
Furthermore, the results indicate that PM2.5 concentrations varied at the three measurement locations. Comparing the mid-term PM2.5 immissions at the three stations in January, the concentrations (4-h averages) in the residential area were up to eight times higher than those at the urban station. The PM2.5 pollution was mostly up to 6 h above the concentration level at the urban station. Consequently, the air quality in the residential area in January is worse than near the main street, and accordingly, the health risk from respirable fine dust is also higher [1]. Studies from Denmark and Sweden found similar results, as already mentioned in the introduction, by the comparison of rural and urban areas [15,16]
High short-term exceedances (>25 µg/m3) of the PM2.5 concentrations appeared more often in January than in May 2021. Temporally high concentrations are mainly measured in January in the second half of the day in the residential area and are significantly higher than at the station near traffic (urban) and the suburban station. Due to wood stove operations in January, significant amounts of particulate matter could be released. These wood stoves are mainly located in single-family houses, which are placed commonly in rural residential areas and rarely in city apartments and operated during the winter season [15,28,29]. The use of wood as an additional or main energy source results in air pollution with particulate matter in residential areas [28,30,31].
The local, very high, immissions in the residential area start mostly in the afternoon from about 2 p.m. as well as in the evening hours. During this period, most people are at home. The measured maximum values of the peaks (e.g., 144 µg/m3 on 20 December, 6:20 p.m., see Figure 14c) resulted from small combustion furnaces. Similar results were also seen by Krecl et al. (2008) and Saffari et al. (2013), that the PM concentration by residential wood combustion is higher in the evening as well as on weekends [16,32].
In Germany, the BImSchV should protect people as well as the environment. In the 1. BImSchV, it is specified, newly built chimneys (installation after 31 December 2021), that they must be placed close to the highest point of the roof and exceed it by at least 40 cm [19,20]. However, all chimneys built previously are not affected by this new regulation, even if they do not comply with the directive. This regulation does not improve the situation shown in Figure 14b and Figure 15a. Figure 15b, additionally, shows a schematic drawing of an incorrectly installed chimney and how the exhaust gas enters the recirculation zone. The people living in the immediate vicinity of such chimneys will be exposed to particulate matter and other gaseous components which are generated during the operation of wood combustion stoves that is harmful to their health over many hours on up to 11 days a month. This issue has already been noted in VDI3781 Part 4 [21]. If all chimneys were rebuilt according to these guidelines, on many days, the pollution in the layers close to the ground would be significantly reduced. The measurements show that despite an adjusted state of the art in the guidelines, the situation in residential areas has not changed, as already built chimneys are not affected by the regulations. However, during inversion weather conditions, as seen in Figure 15c, even a higher chimney and, therefore, the optimal discharge of exhaust gases from stoves, is not guaranteed. In this case, the exhaust gases from heating systems and other heat sources cannot be mixed due to the different temperatures of the air layers, and the pollutants concentrate in the layers close to the ground (see Figure 15d). On these days, it would only help if no combustion took place.
The results indicate that exposure to harmful PM2.5 is partly higher in a residential area in the south of Germany than on a high-traffic street. These highest pollution levels occur mainly in the afternoon and evening when people are at home. This air pollution is not taken into account in current measurements, as the specifications do not provide for measuring points in areas that are not located directly on a main road or in the urban background [4]. Additionally, the current guidelines do not help with already built chimneys that, due to their incorrect installation, allow the exhaust gas to flow into the recirculation zone.
5. Conclusions
The present study focused on the simultaneous measurement of PM2.5 immissions at three different spots in the region of Karlsruhe: a spot close to traffic, a suburban spot, and a location in a purely residential area in Stutensee. PM2.5 immissions were measured continuously over eight months from November 2020 to June 2021, applying fine dust sensors FDS 15 (Dr. Födisch Umweltmesstechnik AG). Two representative months, characterizing the immission situation during a month in the heating period (January 2021) and a month in spring with less heating, were analyzed concerning the PM2.5 immission in detail.
The results can be summarized as follows:
- -
- The FDS 15 PM2.5-signals correlate with those obtained by the reference systems, but underestimate the measured immission. The correlation coefficient is 0.92 on average.
- -
- The monthly average PM2.5 immissions ranged between 3.5 µg/m3 and 7.9 µg/m3 at the three spots and were below the currently valid PM2.5 annual immission limit value.
- -
- The existing annual average PM2.5 immission limit value (25 µg/m3) is inappropriate to identify and limit locally high immission events.
- -
- In a 4-h average, the PM2.5 immission in the residential area in January 2021 was up to eight times and, at the suburban station, up to six times higher than at the station close to traffic. In May 2021, the differences between the stations were smaller. Here, the measured PM2.5 immission was only up to 3.7-times higher in the residential area in comparison with the urban spot close to traffic.
- -
- The measurements show that the highest PM2.5 immission peaks occured in the residential area. Especially in January 2021, the number of peak immission events was three times higher than at the other two stations, while the situation in May 2021 was similar at the three spots.
- -
- By monitoring the close vicinity of the measuring station in the residential area, it could be shown that emissions of real-world wood stove operation clearly caused the high PM2.5 immission events.
- -
- The analysis revealed that improper exhaust discharge of wood stove emissions contributed to causing the high PM2.5 immissions in the residential area.
- -
- Visual observation proved that exhaust gases are discharged into the recirculation zone of buildings, leading to a downward exhaust gas flow.
- -
- The study demonstrates that current exhaust discharge regulations for existing wood stoves, as outlined in 1. BImSchV, are insufficient to eliminate the pollution of ambient air. The regulation needs to be updated to cover existing units.
- -
- Even tighter regulations (as in VDI 3781 Part 4) can cause high immissions, especially during inversion weather conditions or local structural conditions of building density.
In further investigations, additional residential areas should be evaluated to determine the air quality impacts of wood stove operation in these regions. Furthermore, the chemical composition of particulate matter has to be studied to quantify the amount of PM generated by wood burning. The analysis of other components, e.g., soot and gaseous components (NOx, VOC, and PAH) can also be performed.
Author Contributions
Conceptualization, J.R.D.T. and J.S.; methodology, J.R.D.T. and J.S.; validation, J.R.D.T., J.S., J.M. and A.D.; investigation, J.R.D.T. and J.S.; writing—original draft preparation, J.R.D.T. and J.S.; writing—review and editing, J.R.D.T., J.S., J.M. and A.D.; visualization, J.R.D.T. and J.S.; supervision, J.M. and A.D.; project administration, A.D. All authors have read and agreed to the published version of the manuscript.
Funding
This research received no external funding.
Data Availability Statement
Not applicable.
Acknowledgments
We acknowledge support by the KIT-Publication Fund of the Karlsruhe Institute of Technology. The authors wish to thank LUBW, Landesanstalt für Umwelt Baden-Württemberg, Germany for their support and for providing the data from their measurement station as reference. Furthermore, we would like to acknowledge F. Finger and P. Leidenberger for the technical support in data preparation and Födisch Umweltmesstechnik AG for supplying the fine-dust sensor FDS 15.
Conflicts of Interest
The authors declare that they have no known competing financial interests or personal relationships that could have appeared to influence the work reported in this paper.
References
- Deutsche Akademie der Naturforscher Leopoldina (Ed.) Saubere Luft—Stickstoffoxide und Feinstaub in der Atemluft: Grundlagen und Empfehlungen; Deutsche Akademie der Naturforscher Leopoldina: Halle, Germany, 2019. [Google Scholar]
- WHO Regional Office for Europe (Ed.) Air Quality Guidelines Global Update 2005: Particulate Matter, Ozone, Nitrogen Dioxide and Sulfur Dioxide; WHO Regional Office for Europe: Copenhagen, Denmark, 2005. [Google Scholar]
- World Health Organisation (Ed.) WHO Global Air Quality Guidelines: Particulate Matter (PM2.5 and PM10), Ozone, Nitrogen Dioxide, Sulfur Dioxide and Carbon Monoxide; World Health Organisation: Geneva, Switzerland, 2021. [Google Scholar]
- Federal Ministry of Justice. Neununddreißigste Verordnung zur Durchführung des Bundes-Immissionsschutzgesetzes: 39. BImSchV; Federal Ministry of Justice: Berlin, Germany, 2010. [Google Scholar]
- Crouse, D.L.; Peters, P.A.; Van Donkelaar, A.; Goldberg, M.S.; Villeneuve, P.J.; Brion, O.; Khan, S.; Atari, D.O.; Jerrett, M.; Pope, C.A., III; et al. Risk of Nonaccidental and Cardiovascular Mortality in Relation to Long-term Exposure to Low Concentrations of Fine Particulate Matter: A Canadian National-Level Cohort Study. Environ. Health Perspect. 2012, 120, 708–714. [Google Scholar] [CrossRef] [PubMed]
- Beelen, R.; Raaschou-Nielsen, O.; Stafoggia, M.; Andersen, Z.J.; Weinmayr, G.; Hoffmann, B.; Wolf, K.; Samoli, E.; Fischer, P.; Nieuwenhuijsen, M.; et al. Effects of long-term exposure to air pollution on natural-cause mortality: An analysis of 22 European cohorts within the multicentre ESCAPE project. Lancet 2014, 383, 785–795. [Google Scholar] [CrossRef]
- Sigsgaard, T.; Forsberg, B.; Annesi-Maesano, I.; Blomberg, A.; Bølling, A.; Boman, C.; Bønløkke, J.; Brauer, M.; Bruce, N.; Héroux, M.-E.; et al. Health impacts of anthropogenic biomass burning in the developed world. Eur. Respir. J. 2015, 46, 1577–1588. [Google Scholar] [CrossRef] [PubMed] [Green Version]
- Umweltbundesamt (Ed.) Luftqualität 2020: Vorläufige Auswertung; Umweltbundesamt: Dessau-Roßlau, Germany, 2021. [Google Scholar]
- Rodríguez-Urrego, D.; Rodríguez-Urrego, L. Air quality during the COVID-19: PM2.5 analysis in the 50 most polluted capital cities in the world. Environ. Pollut. 2020, 266, 115042. [Google Scholar] [CrossRef] [PubMed]
- Chauhan, A.; Singh, R.P. Decline in PM2.5 concentrations over major cities around the world associated with COVID-19. Environ. Res. 2020, 187, 109634. [Google Scholar] [CrossRef] [PubMed]
- LUBW Landesanstalt für Umwelt Baden Württemberg (Ed.) Jahreswerte 2019: Ergebnisse für Stickstoffdioxid, Ozon und die Gravimetrischen Feinstaub PM10/PM2.5-Auswertungen; LUBW Landesanstalt für Umwelt Baden Württemberg: Karlsruhe, Germany, 2020. [Google Scholar]
- LUBW Landesanstalt für Umwelt Baden Württemberg (Ed.) Jahreswerte 2020: Ergebnisse für Stickstoffdioxid, Ozon und die Gravimetrischen Feinstaub PM10/PM2.5-Auswertungen; LUBW Landesanstalt für Umwelt Baden Württemberg: Karlsruhe, Germany, 2021. [Google Scholar]
- Stadt Karlsruhe. Aktuelle Karlsruher Kennzahlen. 2020. Available online: https://www.karlsruhe.de/b4/stadtentwicklung/statistik/kennzahlen.de (accessed on 2 February 2022).
- LUBW Landesanstalt für Umwelt Baden Württemberg (Ed.) Messungen von Feinstaub und Staubinhaltsstoffen in Ausgewählten Schwarzwaldtälern: Ergebnisse der Messungen 2019; LUBW Landesanstalt für Umwelt Baden Württemberg: Karlsruhe, Germany, 2020. [Google Scholar]
- Glasius, M.; Ketzel, M.; Wahlin, P.; Jensen, B.; Monster, J.; Berkowicz, R.; Palmgren, F. Impact of wood combustion on particle levels in a residential area in Denmark. Atmos. Environ. 2006, 40, 7115–7124. [Google Scholar] [CrossRef]
- Krecl, P.; Larsson, E.H.; Ström, J.; Johansson, C. Contribution of residential wood combustion and other sources to hourly winter aerosol in Northern Sweden determined by positive matrix factorization. Atmos. Chem. Phys. 2008, 8, 3639–3653. [Google Scholar] [CrossRef] [Green Version]
- Amann, M.; Bertok, I.; Cofala, J.; Gyarfas, F.; Heyes, C.; Klimont, Z.; Schöpp, W.; Winiwarter, W. Baseline Scenarios for the Clean Air for Europe (CAFE) Programme: Final Report; International Institute for Applied Systems Analysis: Laxenburg, Austria, 2005. [Google Scholar]
- Kukkonen, J.; López-Aparicio, S.; Segersson, D.; Geels, C.; Kangas, L.; Kauhaniemi, M.; Maragkidou, A.; Jensen, A.; Assmuth, T.; Karppinen, A.; et al. The influence of residential wood combustion on the concentrations of PM2.5 in four Nordic cities. Atmos. Chem. Phys. 2020, 20, 4333–4365. [Google Scholar] [CrossRef] [Green Version]
- Federal Ministry of Justice. Erste Verordnung zur Durchführung des Bundes-Immissionsschutzgesetzes Verordnung über Kleine und Mittlere Feuerungsanlagen—1. BImSchV; Federal Ministry of Justice: Berlin, Germany, 2010. [Google Scholar]
- Erste Verordnung zur Änderung der Verordnung über kleine und mittlere Feuerungsanlagen. In Bundesgesetzblatt Jahrgang 2021 Teil I Nr. 73; Verlag: Münster, Germany, 2021; Volume 2021.
- Fachbereich Umweltmeteorologie. VDI-Richtlinie 3781 Blatt 4—Ableitbedingungen für Abgase; VDI/DIN-Kommission Reinhaltung der Luft (KRdL)–Normenausschuss, Ed.; VDI Verein Deutscher Ingenieure e.V.: Düsseldorf, Germany, 2017. [Google Scholar]
- Dr. Födisch Umweltmesstechnik AG (Ed.) Feinstaubsensor FDS 15; Dr. Födisch Umweltmesstechnik AG: Markranstädt, Germany, 2020. [Google Scholar]
- Palas GmbH (Ed.) Feinstaubmessgerät Fidas 200S; Palas GmbH: Karlsruhe, Germany, 2021. [Google Scholar]
- Palas GmbH (Ed.) Brevier zur Aerosoltechnik; Palas GmbH: Karlsruhe, Germany, 2011. [Google Scholar]
- OpenStreetMap Contributors. Available online: https://www.openstreetmap.de/karte.html (accessed on 29 September 2021).
- Stadtverwaltung Stutensee Daten & Fakten. Available online: https://www.stutensee.de/unsere-stadt/daten-fakten/ (accessed on 2 February 2022).
- Stadt Karlsruhe Monatliche Höchst- und Tiefstwerte des Jahres 2021. 2021. Available online: https://www.karlsruhe.de/b3/wetter/meteorologische_werte/extremwerte.de (accessed on 15 October 2021).
- Bari, A.; Baumbach, G.; Kuch, B.; Scheffknecht, G. Temporal variation and impact of wood smoke pollution on a residential area in southern Germany. Atmos. Environ. 2010, 44, 3823–3832. [Google Scholar] [CrossRef]
- Jeong, C.-H.; Evans, G.J.; Dann, T.; Graham, M.; Herod, D.; Dabek-Zlotorzynska, E.; Mathieu, D.; Ding, L.; Wang, D. Influence of biomass burning on wintertime fine particulate matter: Source contribution at a valley site in rural British Columbia. Atmos. Environ. 2008, 42, 3684–3699. [Google Scholar] [CrossRef]
- Sippula, O.; Hytönen, K.; Tissari, J.; Raunemaa, T.; Jokiniemi, J. Effect of Wood Fuel on the Emissions from a Top-Feed Pellet Stove. Energy Fuels 2007, 21, 1151–1160. [Google Scholar] [CrossRef]
- Jokiniemi, J.; Hytönen, K.; Tissari, J. Biomass Combustion in Residential Heating: Particulate Measurements, Sampling, and Physiochemical and Toxicological Characteri-Zation: Final Report of the Project Biomass PM within the ERA-NET Bioenergy Programme 2007–2008; University of Kuopio: Kuopio, Finland, 2008. [Google Scholar]
- Saffari, A.; Daher, N.; Samara, C.; Voutsa, D.; Kouras, A.; Manoli, E.; Karagkiozidou, O.; Vlachokostas, C.; Moussiopoulos, N.; Shafer, M.M.; et al. Increased Biomass Burning Due to the Economic Crisis in Greece and Its Adverse Impact on Wintertime Air Quality in Thessaloniki. Environ. Sci. Technol. 2013, 47, 13313–13320. [Google Scholar] [CrossRef] [PubMed]
Figure 1.
Average PM2.5 concentration (annual mean value) in different environments. The values were averaged between multiple measuring stations in Germany in the period from 2010 to 2020 [8].
Figure 1.
Average PM2.5 concentration (annual mean value) in different environments. The values were averaged between multiple measuring stations in Germany in the period from 2010 to 2020 [8].

Figure 2.
Comparison of the annual mean values of selected stations in Karlsruhe (Reinhold-Frank-Street; Nordwest) and the Black Forest (Forbach; Kleines Wiesental; Schuttertal) in 2019 [11,12,14].

Figure 3.
(a) FDS 15 and (b) schematic structure of the particulate matter device [22].
Figure 3.
(a) FDS 15 and (b) schematic structure of the particulate matter device [22].

Figure 4.
Locations of measurement stations in Karlsruhe [25].
Figure 4.
Locations of measurement stations in Karlsruhe [25].

Figure 5.
PM2.5 correlation (based on hour mean values) of FDS 15 to reference device of the measuring stations, (a) suburban and (b) urban.
Figure 5.
PM2.5 correlation (based on hour mean values) of FDS 15 to reference device of the measuring stations, (a) suburban and (b) urban.

Figure 6.
PM2.5 concentration and ambient temperature in January 2021 at the suburban measuring station.
Figure 6.
PM2.5 concentration and ambient temperature in January 2021 at the suburban measuring station.

Figure 7.
Time plot of the three measuring stations: (a) 1–31 January 2021; (b) 1–31 May 2021.

Figure 8.
PM2.5 concentration related to cumulative time during January and May 2021.

Figure 9.
Comparison of the three measurement stations in reference to the urban area (near traffic): (a) 1–31 January 2021; (b) 1–31 May 2021.
Figure 9.
Comparison of the three measurement stations in reference to the urban area (near traffic): (a) 1–31 January 2021; (b) 1–31 May 2021.

Figure 10.
Frequency of concentration ratios of the suburban and residential station in comparison to the urban station (next to traffic): (a) 1–31 January 2021; (b) 1–31 May 2021.
Figure 10.
Frequency of concentration ratios of the suburban and residential station in comparison to the urban station (next to traffic): (a) 1–31 January 2021; (b) 1–31 May 2021.

Figure 11.
Peak analysis of the three measuring stations: (a) 1–31 January 2021; (b) 1–31 May 2021. The numbers at the data points are the corresponding PM2.5 concentrations.
Figure 11.
Peak analysis of the three measuring stations: (a) 1–31 January 2021; (b) 1–31 May 2021. The numbers at the data points are the corresponding PM2.5 concentrations.

Figure 12.
Number of peaks above 25 µg/m3 at the three measuring stations in January and May.

Figure 13.
Two examples of the concentration in the measuring station in the residential area: (a) PM2.5 concentration (based on one minute mean values) of FDS 15 at 22 January 2021; (b) PM2.5 concentration (based on one minute mean values) at 6 March 2021.
Figure 13.
Two examples of the concentration in the measuring station in the residential area: (a) PM2.5 concentration (based on one minute mean values) of FDS 15 at 22 January 2021; (b) PM2.5 concentration (based on one minute mean values) at 6 March 2021.

Figure 14.
(a) Schematic map of PM2.5 source, propagation direction, and location of PM2.5 measurement station in the residential area; (b) picture of PM2.5 source on 20 December 2021, 18:22 (source: Achim Dittler); (c) PM2.5 concentration (based on one minute mean values) at 20–21 December 2021.
Figure 14.
(a) Schematic map of PM2.5 source, propagation direction, and location of PM2.5 measurement station in the residential area; (b) picture of PM2.5 source on 20 December 2021, 18:22 (source: Achim Dittler); (c) PM2.5 concentration (based on one minute mean values) at 20–21 December 2021.

Figure 15.
(a) Picture of chimney installed too low and flow of the exhaust gas into the recirculation zone (picture from 6 March 2021, 18:40; source: Achim Dittler); (b) schematic figure of recirculation zone [21]; (c) picture of an inversion weather situation with drawn-in air boundary and smog underneath (source: Jörg Kachelmann); (d) schematic figure of a higher chimney during inversion weather situation.


Table 1.
PM2.5 immission limit values according to 39. BImSchV and the WHO Air Quality Guideline from 2005 and 2021 [2,3,4].
| Pollutant | Parameter | 39. BImSchV | WHO 2005 | WHO 2021 |
|---|---|---|---|---|
| Immission Limit Value | Guideline Value | |||
| Particulate Matter PM2.5 | Daily average | - | 25 µg/m3 | 15 µg/m3 |
| Annual average | 25 µg/m3 | 10 µg/m3 | 5 µg/m3 | |
Table 2.
Classification of the PM2.5 measuring stations of the LUBW in Baden-Württemberg and their overages in the year 2019 and 2020 [11,12].
| Measuring Stations | Number/– | Exceedances (Annual Mean Value > 10 µg/m3)/– | |
|---|---|---|---|
| 2019 | 2020 | ||
| Near traffic | 8 | 6 | 3 |
| Urban background | 11 | 3 | 0 |
| Rural background | 2 | 0 | 0 |
| Spot measuring point | 1 | 1 | 0 |
| Total | 22 | 10 | 3 |
Table 3.
Technical specifications FDS 15 [22].
Table 3.
Technical specifications FDS 15 [22].
| Parameter | Value |
|---|---|
| Dimensions (w × h × d)/(mm) | 130 × 160 × 90 |
| Weight/(g) | 2000 |
| Ambient temperature/(°C) | −20–50 °C |
| Relative humidity/(%) | 0–95% |
| Measuring principle | Scattered light |
| Measurement range/(µg/m3) | 2–2000 |
| Limit of detection (LOD)/(µg/m3) | 2 |
Table 4.
Technical specifications at Palas Fidas 200S [23].
Table 4.
Technical specifications at Palas Fidas 200S [23].
| Parameter | Value |
|---|---|
| Ambient temperature/(°C) | −20–50 °C |
| Relative humidity/(%) | n/a |
| Measuring principle | Optical light scattering by single particle |
| Measurement range/(µg/m3) | 0–10,000 |
| Limit of detection (LOD)/(µg/m3) | n/a |
Table 5.
PM2.5 data evaluation.
| Pearson Correlation | ||||
|---|---|---|---|---|
| Station | FDS 15 | Correlation Coefficient/(–) | a/(µg/m3) | b/(–) |
| Suburban I | 20055 | 0.94 | 0.71 | 0.67 |
| Urban | 20053 | 0.89 | 0.69 | 0.54 |
Table 6.
Monthly mean value of PM2.5 concentration.
| 1–31 January 2021 | 1–31 May 2021 | ||
|---|---|---|---|
| Station | FDS 15 | Mean Value (Standard Deviation)/(µg/m3) | Mean Value (Standard Deviation)/(µg/m3) |
| Suburban | 20055 | 7.9 (+/−5.2) | 3.9 (+/−2.7) |
| Urban | 20053 | 6.3 (+/−4.3) | 3.5 (+/−2.9) |
| Residential | 20052 | 6.9 (+/−5.2) | 4.1 (+/−3.4) |
Publisher’s Note: MDPI stays neutral with regard to jurisdictional claims in published maps and institutional affiliations. |
© 2022 by the authors. Licensee MDPI, Basel, Switzerland. This article is an open access article distributed under the terms and conditions of the Creative Commons Attribution (CC BY) license (https://creativecommons.org/licenses/by/4.0/).
Share and Cite
MDPI and ACS Style
Thieringer, J.R.D.; Szabadi, J.; Meyer, J.; Dittler, A. Impact of Residential Real-World Wood Stove Operation on Air Quality concerning PM2.5 Immission. Processes 2022, 10, 545. https://0-doi-org.brum.beds.ac.uk/10.3390/pr10030545
AMA Style
Thieringer JRD, Szabadi J, Meyer J, Dittler A. Impact of Residential Real-World Wood Stove Operation on Air Quality concerning PM2.5 Immission. Processes. 2022; 10(3):545. https://0-doi-org.brum.beds.ac.uk/10.3390/pr10030545
Chicago/Turabian StyleThieringer, Julia R. D., Julia Szabadi, Jörg Meyer, and Achim Dittler. 2022. "Impact of Residential Real-World Wood Stove Operation on Air Quality concerning PM2.5 Immission" Processes 10, no. 3: 545. https://0-doi-org.brum.beds.ac.uk/10.3390/pr10030545
Note that from the first issue of 2016, this journal uses article numbers instead of page numbers. See further details here.