Article

Comparison of Knudsen Diffusion and the Dusty Gas Approach for the Modeling of the Freeze-Drying Process of Bulk Food Products

1
Institute of Solid Process Engineering and Particle Technology, Hamburg University of Technology, Denickestrasse 15, 21073 Hamburg, Germany
2
Nestlé Research, 1000 Lausanne, Switzerland
3
Nestlé Product Technology Centre, 1350 Orbe, Switzerland
4
Nestlé, 1800 Vevey, Switzerland
*
Author to whom correspondence should be addressed.
Submission received: 16 February 2022 / Revised: 8 March 2022 / Accepted: 9 March 2022 / Published: 11 March 2022
(This article belongs to the Special Issue Advanced in Dewatering and Drying Processes)

Abstract

:
Freeze-drying is generally used to achieve high quality products and preserve thermal sensitive components; however, it is also considered as a high energy and costly process. Modeling of the process can help to optimize the process to reduce these drawbacks. In this work, a mathematical model is presented to predict the heat and mass transfer behavior for freeze-drying of porous frozen food particles during freeze-drying to optimize the process. For the mass transfer, a comparison between Knudsen diffusion and the more complex dusty-gas approach is performed. Simulation results of a single particle are validated by experiments of single-layer drying to extend the usage of this model from a single particle to a particle bed. For the moisture transfer, adaption parameters are introduced and evaluated. A comparison shows a good agreement of the model with experimental results. The results furthermore suggest a strong correlation of the drying kinetics with pore size and particle porosity. An increase in the pore diameter strongly improves the overall mass transfer rates and hence is a suitable parameter for an effective increase of the drying rates in freeze-drying.

Graphical Abstract

1. Introduction

Freeze-drying is used to dry sensitive products in the food and pharma industry [1] and is seen in comparison to other drying processes as a rather energy and cost intensive technology [2]. Especially in the food industry, it needs to be ensured that in addition to the quality, the drying times are held as short as possible to be competitive with other drying technologies. Freeze-drying consists of three steps: freezing, primary and secondary drying [3,4]. For liquid food materials, e.g., soluble coffee or tea, a part of the water crystallizes and the solution is concentrated during the freezing step. The remaining water is called non-freezable or bound water and remains in the glassy matrix. During primary drying, the crystalline water is sublimated, while during secondary drying the bound water needs to be desorbed from the amorphous food matrix. Both drying steps follow different drying mechanisms and for both, the dried layer forms a resistance for the heat and mass transfer within the drying particle. The understanding of these limiting effects allows for a prediction of the drying times and therefore the possibility to predict the drying kinetics by modeling, which is a powerful and cost-effective tool for process optimization.
Several model approaches were used in the past to describe the freeze-drying process. These mainly focused on drying in vials used predominantly in pharma industry or on tray freeze-drying used for the drying of bulk materials. The approaches range from single particle models to complex pore network models of particle beds on trays.
Many authors studied the freeze-drying process in packed beds: Liapis and Bruttini [5] considered also the freeze-drying of particles in packed beds, where they extended the application to spray-freeze drying which received broad interest [6,7]. The authors used the dusty gas model for the mass transfer, already applied by Song and Yeom [8] and Sheehan and Liapis [9]. Here, a mixture of inert gases and vapor was considered during the drying approach. In the work of Liapis and Bruttini [10], this model was further extended and validated by experimental data derived by Song et al. [7] and Her et al. [11]. The authors found out that the gas flux of inert gases is negligible compared to the vapor flux, during primary drying. The recent approaches of Warning et al. [12] considered the importance of a sublimation width instead of a single sublimation front, adding more precision, but also more complexity to the model. Gruber et al. [13] and Vorhauer-Huget et al. [14] confirmed experimentally that the sublimation front is not homogeneous, but affected by local changes in heat and mass transfer. The complexity applies also to the recent progresses of pore network models as applied by Vorhauer et al. [15]. The pore network model allows the coupling of pores with various sizes, allowing a more precise prediction of the vapor flux and its dependency on pore geometry and arrangement.
The influence of structure parameters on the heat and mass transfer rates were only insufficiently investigated and validated and therefore need further investigation. As discussed in previous publications [3,16], changes in the internal porous structure can have a significant impact on the drying time. Modeling approaches in this direction were already applied and vary strongly in complexity. In general, complex models are able to achieve higher precision, mostly because of a higher degree of freedom. These advantages usually come at the cost of increased computing power and simulation time. Furthermore, in each model different experimental results were used. A comparison between a simple Knudsen diffusion approach and an approach with higher complexity such as the dusty gas model can help to judge the experimental results according to existing models, which was done in this work. For the validation, the structural parameters such as porosity and pore size were varied to observe the change in drying time. Since the focus lies on the change of internal porous structure, the internal mass transfer limitation is of high interest, which is modeled and validated on a single-particle scale.

2. Methodology

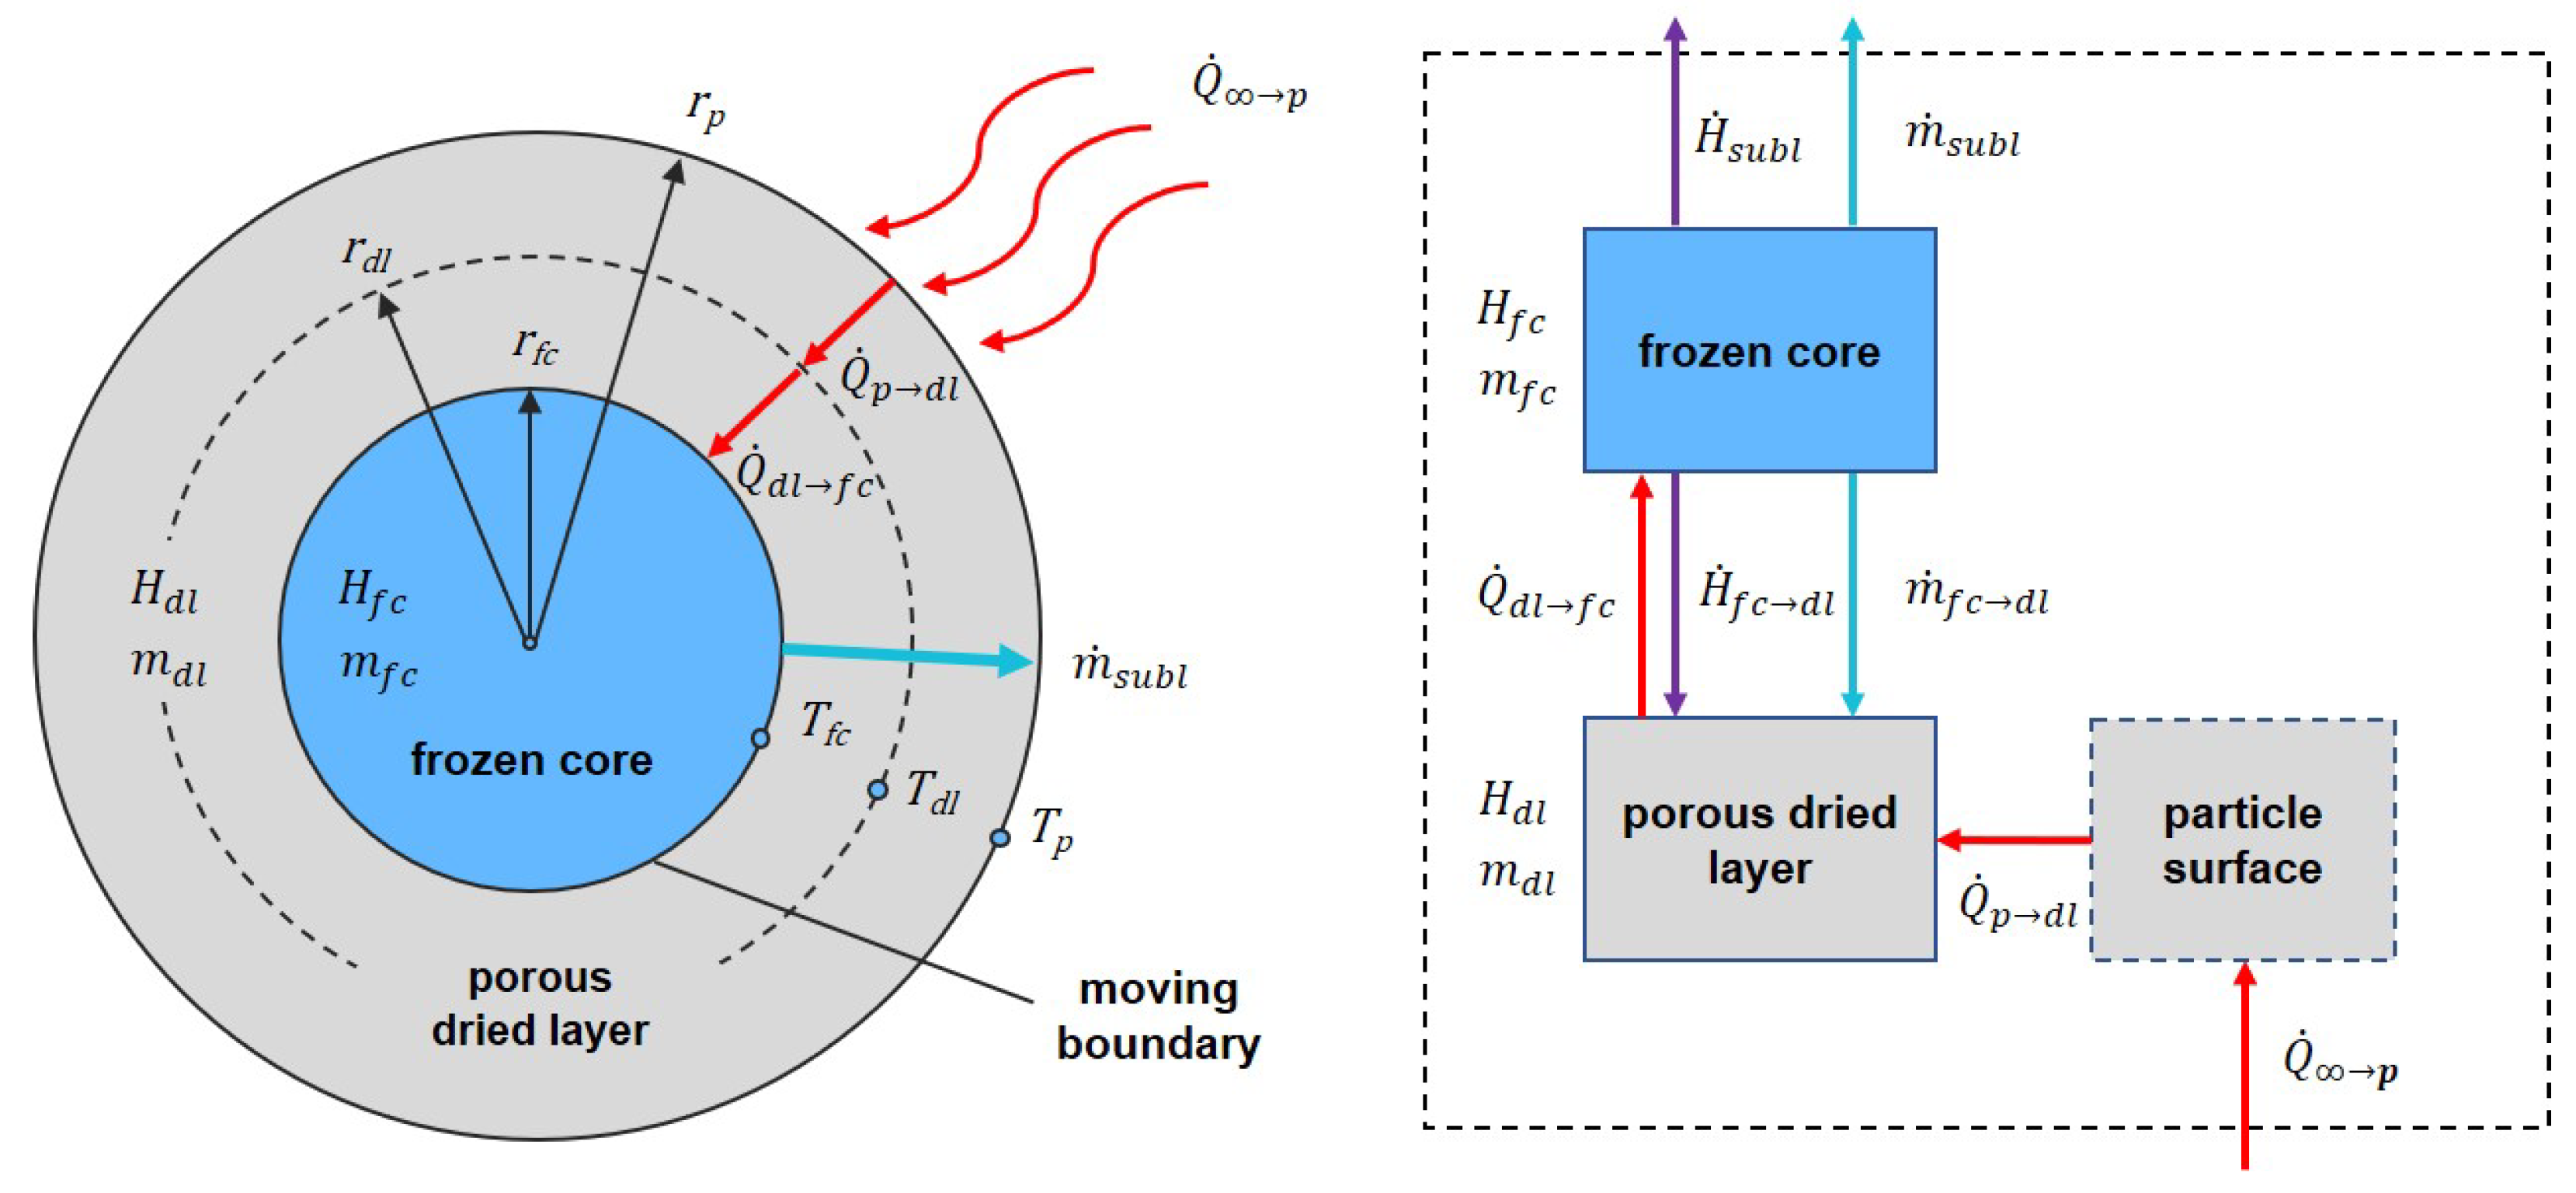
2.1. Model Structure

A shrinking core approach is used to capture the main heat and mass transfer mechanisms of the single-particle freeze-drying process. Therefore, the model considers three distinct regions: a frozen core (index fc), a porous dried layer (index dl) and an infinitesimal particle surface region (index p). The shrinking core model is schematically presented in Figure 1. When the particle dries, the frozen core region shrinks and its boundary moves towards the center of the particle. The water vapor is transported through the pores of the growing dried layer region from the frozen core to the surface. The sublimation process is divided into two different stages: The primary stage considers a pore diffusion transport of the water vapor through the porous layer. For the second stage, a simplified approach of a first-order reaction kinetic is assumed to remove the remaining ice from the particle. The one-dimensional structure of the model allows only for a resolution of the heat and mass transfer along the radial direction. The radiative heat transfer from the bottom and top shelf as well as radiation from the environment to the particle surface are considered. Due to the low pressure environment, convective heat transfer at the particle surface is neglected. From the surface, heat is transferred by conduction through the porous dried layer to the sublimation interface of the frozen core region.
The main assumptions and simplifications of the model are listed below:
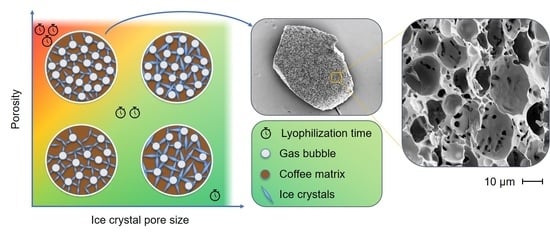
  • Only the vapor transport within the porous structure of the particle is investigated, while the vapor transport within the drying chamber is neglected.
  • The material is homogeneously distributed within each respective model region.
  • The pores all have the same pore diameter and are connected to the outside of the particle. Closed pores are neglected.
  • Material properties are independent of the temperature.
  • Particles have a spherical shape.
  • The influence of the sample holder is neglected and only radiative heat transfer is considered.
  • Only radiative heat transfer in the drying chamber is considered. The particle is modeled as a gray body.
The frozen core and the dried regions are assumed to be ideally mixed, neglecting possible gradients in composition or temperature. The transient behavior of the mass and enthalpy is modeled by a CSTR (continuously stirred tank reactor) approach and are shown below:
d m f c d t = m ˙ s u b l m ˙ f c d l ,
d H f c d t = H ˙ s u b l H ˙ f c d l + Q ˙ d l f c ,
d m d l d t = m ˙ f c d l ,
d H d l d t = H ˙ f c d l Q ˙ d l f c + Q ˙ p d l .
m and H are the mass and the enthalpy of the respective region, m ˙ the mass flow, H ˙ the enthalpy flow and Q ˙ the heat flows between the regions. The mass flow and the enthalpy flow of sublimation, m ˙ s u b l and H ˙ s u b l , respectively, are directly removed from the frozen core. The sublimation results in a shrinking of the frozen core region. While the vapor moves through the pores of the dried layer to the surfaces, the dried matter is removed from the frozen core region and is added to dried layer region, which is expressed by the exchange flows m ˙ f c d l and H ˙ f c d l . The temperature of the frozen core and the dried layer region are calculated by:
T f c = T 0 + h f c h f c , 0 c p , f c ,
T d l = T 0 + h d l h d l , 0 c p , d l ,
with the specific enthalpy h = H / m , the specific heat capacity c p and the reference temperature T 0 .
The infinitesimal particle surface is modeled by a quasi-stationary enthalpy balance, which takes into account the incoming radiative heat transfer and the outgoing conductive heat transfer from the surface into the dried layer as follows:
Q ˙ r a d Q ˙ p d l = ϵ A p σ ( T 4 T p 4 ) k d l · 4 π · ( T p T d l ) · r p · r d l r p r d l = 0 ,
with the emissivity ϵ , the Stefan–Boltzmann constant σ , the thermal conductivity of the dried layer k d l and the radius of the respective region r. The implicit equation is solved internally to calculate the temperature of the particle surface T p .
The conductive heat flow between the dried layer and the frozen core is calculated by:
Q ˙ d l f c = k d l · 4 π · ( T d l T f c ) · r d l · r f c r d l r f c .
The mass flow of dry material from the frozen core to the dried layer and the respective enthalpy flow can be described as a function of the vapor mass flow, which is released from the sublimation process as follows:
m ˙ f c d l = m ˙ s u b l · w w 1 w w ,
H ˙ f c d l = m ˙ f c d l · c p , d l · ( T f c T 0 ) .
where w w is the water weight fraction. The sublimation enthalpy flow is calculated using the equation
H ˙ s u b l = m ˙ s u b l · Δ h s u b l , w ,
with the specific enthalpy of sublimation Δ h s u b l , w .
Calculation of the sublimation mass flow m ˙ subl
The total sublimation mass flow m ˙ s u b l depends on the vapor transport through a single pore and the number of pores which connect the frozen core with the environment. It is calculated by
m ˙ s u b l = ε p · 4 π r f c 2 · m ˙ p o r e ,
where m ˙ p o r e is the vapor mass flux through the porous layer. For the calculation of the vapor mass flux, two different models are applied that are subsequently shown. The Knudsen number K n is used as a measure for the characteristic movement of particles in confined regions and can be calculated by
K n = λ d p o r e = k B T 2 π ς 2 p d p o r e ,
where λ is the mean free path, k B is the Boltzmann constant and ς is the molecular diameter. A Knudsen number above unity describes a mass transfer in pores, which is mainly influenced by molecular wall interactions. A Knudsen number 0.01 < Kn < 1 is in the transition regime between viscous flow and Knudsen flow and for Knudsen numbers Kn≪ 1 a purely viscous flow can be assumed [17].
The Knudsen number is determined for all experiments. The values range between 23 < K n < 84 for the validation experiments, considering a pore size between 2.88 and 10.49 μ m at 30   C at a chamber pressure of 0.4   mbar .
Mass transfer of vapor through the open pores by Knudsen Diffusion
For the simple Knudsen flow approach in case of a transitional flow regime, the sublimation mass flow rate through the porous layer is calculated using Equations (14) and (15):
m ˙ p o r e , K n = D K n R T p w r ,
D K n = 4 3 · d p o r e ϵ p τ p · R T 2 π M ,
where D K n is the Knudsen diffusion coefficient, R is the universal gas constant, M is the molecular weight and p w r the gradient of the partial pressure in radial direction.
Mass transfer of vapor through the open pores by Dusty gas Model
The dusty gas model was shown to predict the mass transfer in catalysts [18,19,20], and was recently used for the modeling of spray freeze-dried coffee particles on trays [5]. The mass flux m ˙ p o r e , D u " is provided by the following equation:
m ˙ p o r e , D u " = M w R g · T d · k 1 + k 2 · p w , d p w , d r ,
where k 1 and k 2 are constants describing the bulk diffusivity and the self-diffusivity, respectively. These constants can be calculated by the following equations, where Equation (17) describes the Knudsen flow term and Equation (18) describes the viscous flow as follows:
k 1 = C 2 · D w , i n 0 · K w C 2 · D w , i n 0 + K m x · P ,
k 2 = K w · K i n C 2 · D w , i n 0 + K m x · P + C 01 μ m x .
K w is the Knudsen diffusivity of water and K i n is the Knudsen diffusivity of the inert gas, which are calculated by Equations (19) and (20). The Knudsen diffusivity of the binary mixture K m x can be calculated by its molar fractions y w and y i n , as shown in Equation (21):
K w = C 1 · R g · T I M w 0.5 ,
K i n = C 1 · R g · T I M i n 0.5 ,
K m x = y w · K w + y i n · K i n .
The viscosity of the vapor phase, which is needed to calculate the viscous flow term, is calculated as function of the temperature:
μ m x = 18.4858 · 10 7 · T I 1.5 T I + 650 .
C 01 , C 1 and C 2 are constants for the Darcy flow permeability, the Knudsen flow permeability and the bulk diffusivity. Liapis and Bruttini [10] propose to calculate these constants as a function of structural parameters such as the porosity ε p , the tortuosity τ p of the particle and the pore diameter d p o r e :
C 1 = ε p τ p · 48.5 · d p o r e R g 0.5 ,
C 2 = ε p τ p .
The expression for the Darcy flow permeability is adjusted in comparison to the literature used, since in this work no particle bed but a single particle is investigated. Therefore, the equation is taken from Kast [17] who gives an expression for the Darcy flow permeability in pores:
C 01 = ε p τ p · d p o r e 2 32 .
The tortuosity τ p is difficult to measure experimentally and is therefore assumed as τ p = 2 , as it was done by other authors for soluble coffee [5,10]. The vapor pressure at the interface as a function of temperature was already proposed by Marti and Mauersberger [21]. It is calculated by:
p w s a t = 10 2663.5 T f c + 12.537 .
Mass transfer of vapor for second drying stage modeled by first-order reaction kinetic
The secondary drying is modeled by a first-order kinetic expression as already shown in previous attempts [5,10]. Therefore, the vapor flow is assumed to decrease with proceeding drying progress, which is characterized by the desorption constant k d e s :
m ˙ d e s = k d e s · c s w .

2.2. Validation Experiments

For the validation of the model, freeze-drying experiments are carried out. For the experiments, the setup as described in [22] is used to structure the material. In addition to the described trials, the samples are gassed with nitrogen using a different overrun. The overrun is defined as the amount of gas V g in comparison to the amount of liquid V l :
O R = V g V l = ρ l ρ f ρ f = V t o t · ρ l m f m f ,
where ρ l and ρ f are the liquid and foam density, respectively, V t o t is the total volume and m f corresponds to the foam mass. To change the internal porous structure, two parameters are changed: (1) the amount of overrun is varied between 50%, 100% and 150% to generate foams with varying porosity and (2) the freezing method is changed. For freezing, the slurry is distributed in a 10 m m layer on a circular aluminum tray with a diameter of 80 m m . Three methods are applied to achieve a change in ice crystal size and structure: Airblast freezing is used inside of a 60   C freezer, using a fan (3212 JH4, EBM-papst, Germany), which is placed 120 m m above the sample. The second way of freezing is carried out by placing the sample on a steel plate inside the freezer at 60   C , using conductive heat transfer on the bottom. For the third method, the sample is placed within of a polystyrene box with a wall thickness of 20 m m into the freezer to reduce the heat transfer and allow for lower freezing rates. The scraping speed inside the SSHE was held constant at 300 rpm and the temperature of the coolant was at 25   C for all trials. After the freezing is completed, the frozen cake is milled and fractionated by sieving at 60   C . Only particles between 2.24   m m and 2.80   m m are considered for the freeze-drying process. For the drying, the experimental setup is used as shown in [22]. A total of 1 g of the frozen granules is placed on a polymer mesh, with a mesh size of 0.5   m m , hanging from a microbalance (Martin Christ Gefriertrocknungsanlagen, Osterode am Harz, Germany) to receive heat by radiation from the bottom and the top. The reduction in moisture is monitored over time with a resolution in time of 1 s and resolution in weight of 1 m g . The drying profile used is summarized in Table 1.
For the analysis of the dried coffee particles, the Sauter mean diameter is calculated from the particle size distribution (PSD) to confirm the homogeneity in particle size of all samples. The PSD is measured (CAMSIZER XT, Retsch GmbH, Haan, Germany) using the particle size based on the measured area x a r e a . Particles smaller than 1 m m are neglected for the Sauter mean diameter calculation, to avoid variance due to abrasion. The pore size distribution and the porosity of the samples are measured by mercury porosimetry (Pascal 140 + 440, Thermo Fisher Scientific Inc., Waltham, MA, USA). A total of 0.15   g of the sample are analyzed at pressures between 0.1   k Pa and 400 M Pa with an accuracy of 0.2%. The pressure ranges allow for the analysis of pore diameters of 3.8 to 116 μ m and 0.0036 to 15 μ m for the different units, respectively. For the determination of the closed pore porosity, a helium pycnometer (AccuPyc 1330, Micromeritics, Norcross, GA, USA) is used. For the precise method to calculate the pore diameter and the closed porosity, refer to [22]. Images of selected samples are taken by scanning electron microscopy to verify the obtained results for the pore structure (Gemini 1530, Carl Zeiss Meditec, Jena, Germany). The particles are sputter-coated with a 40 n m gold layer to avoid interferences during measurements. Magnifications of 25, 100, 400 and 1000 times are performed with an electron beam of 5 k V .

3. Results

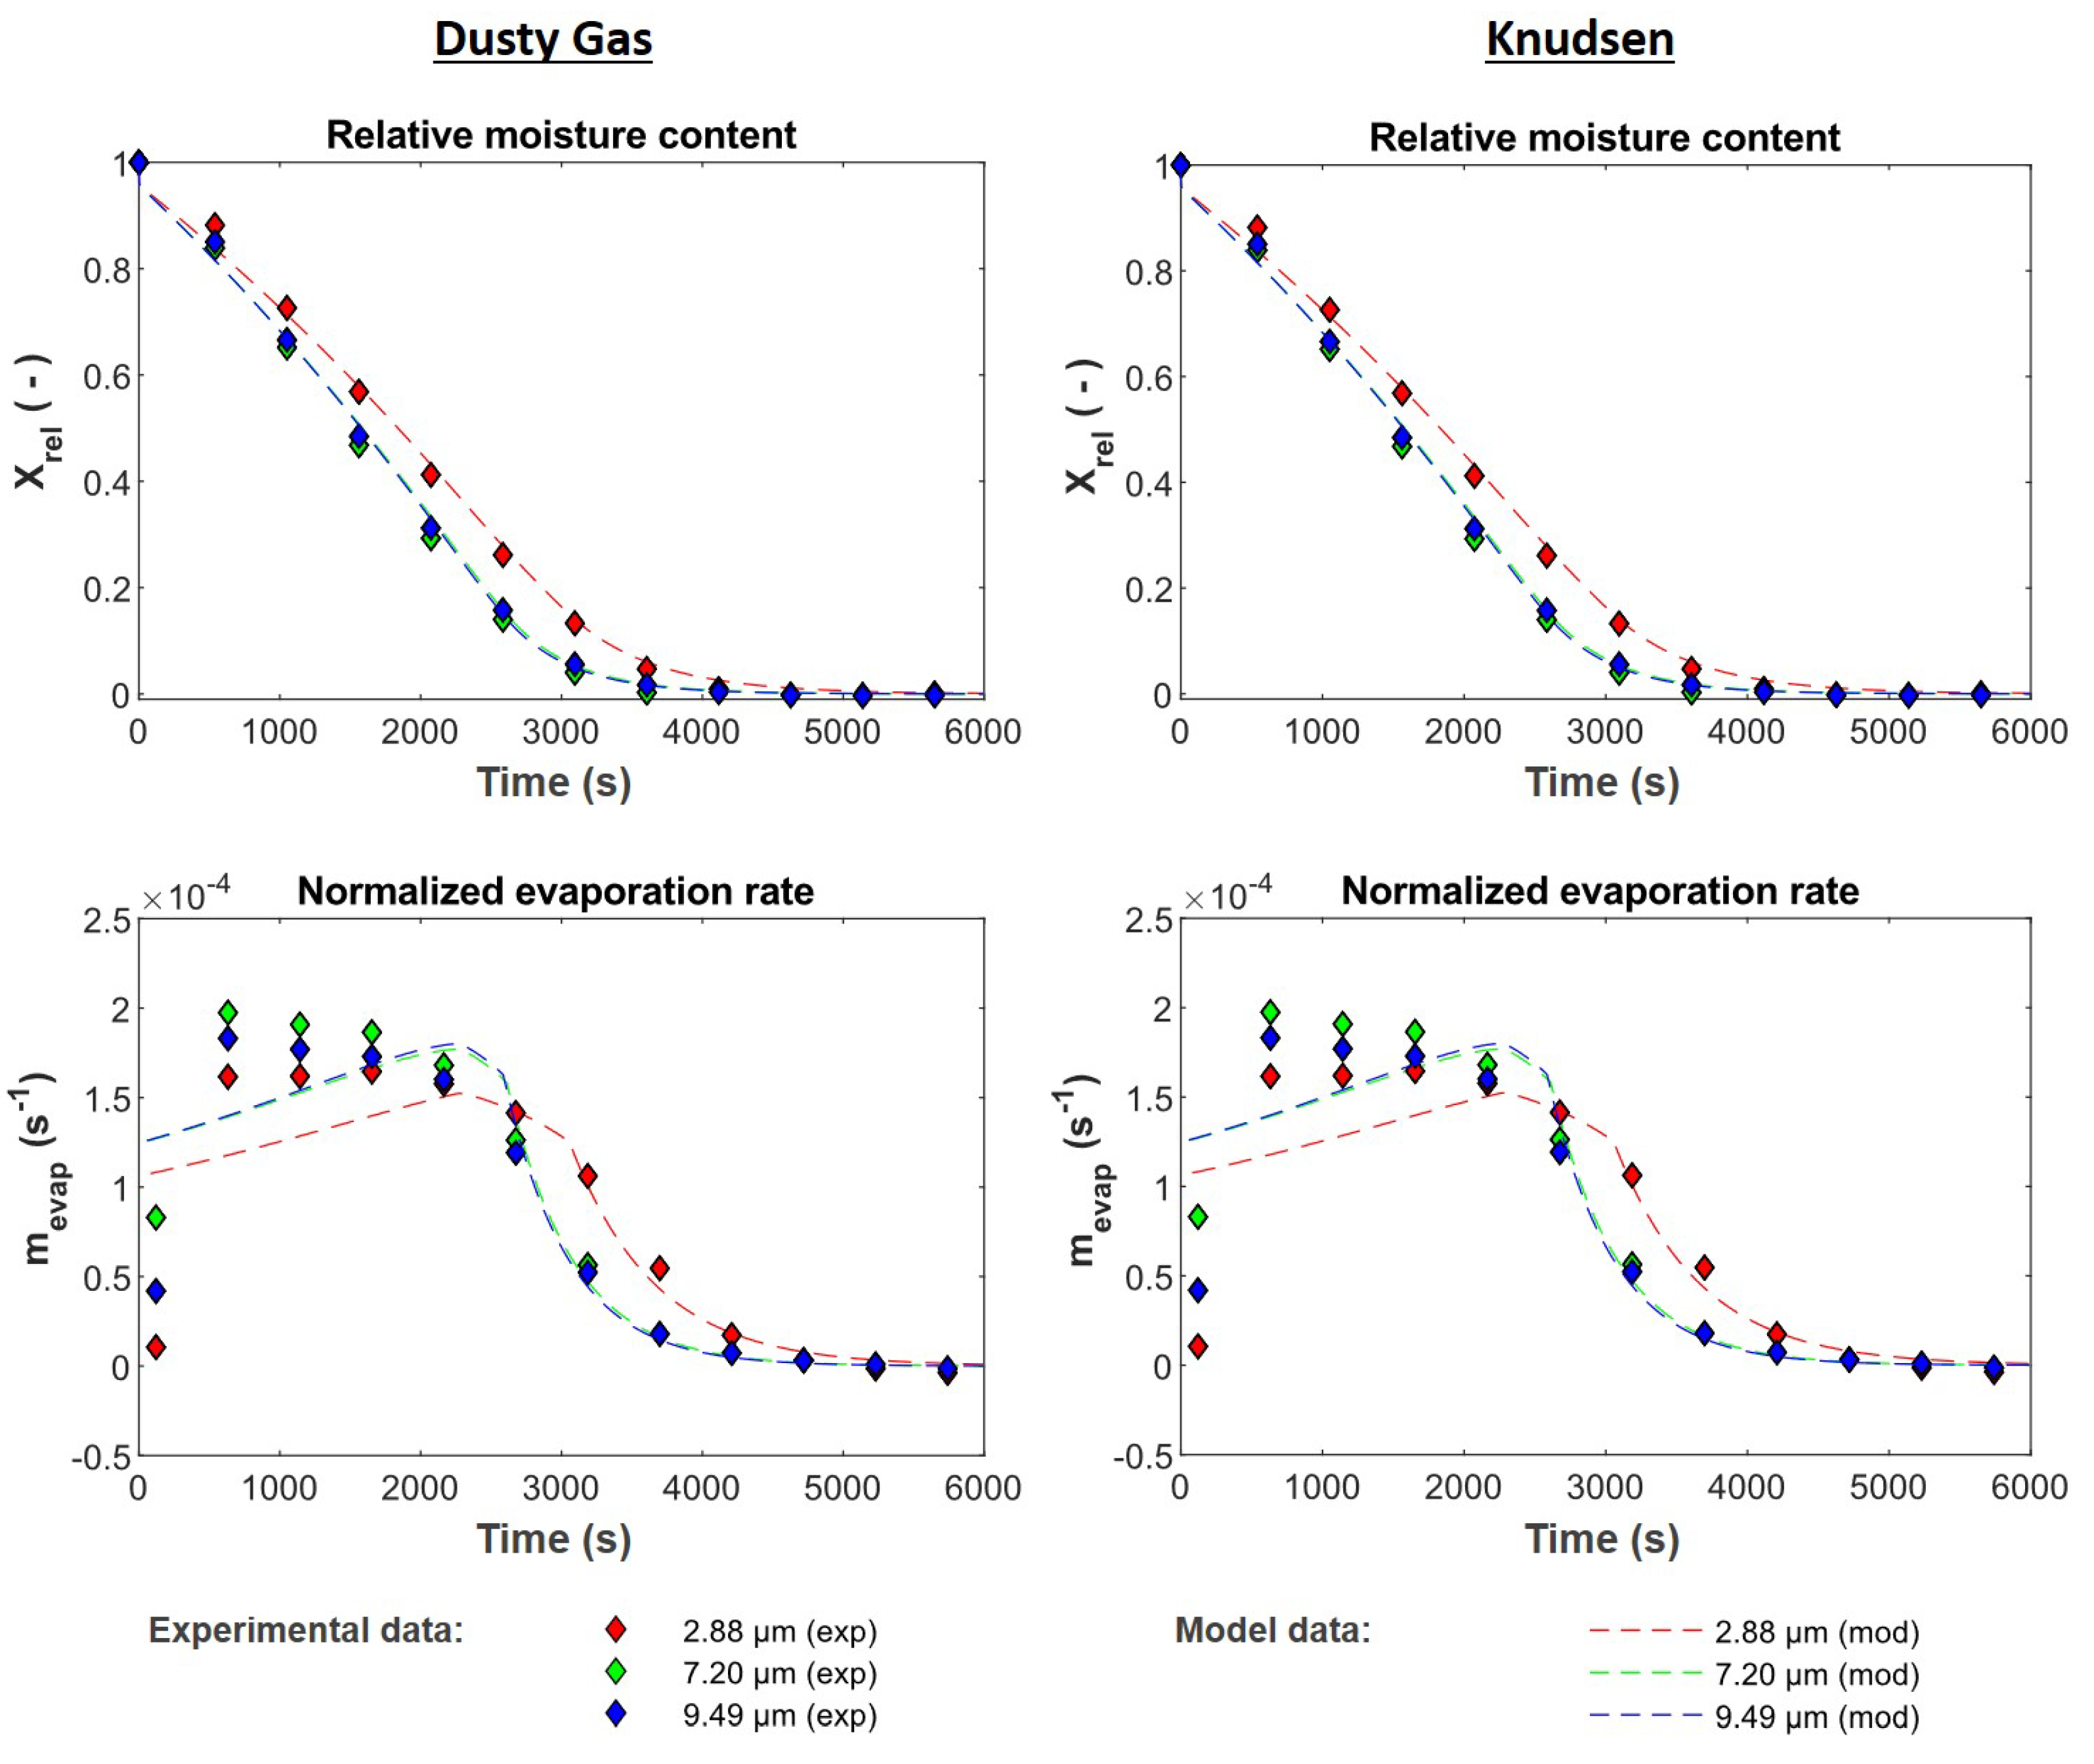
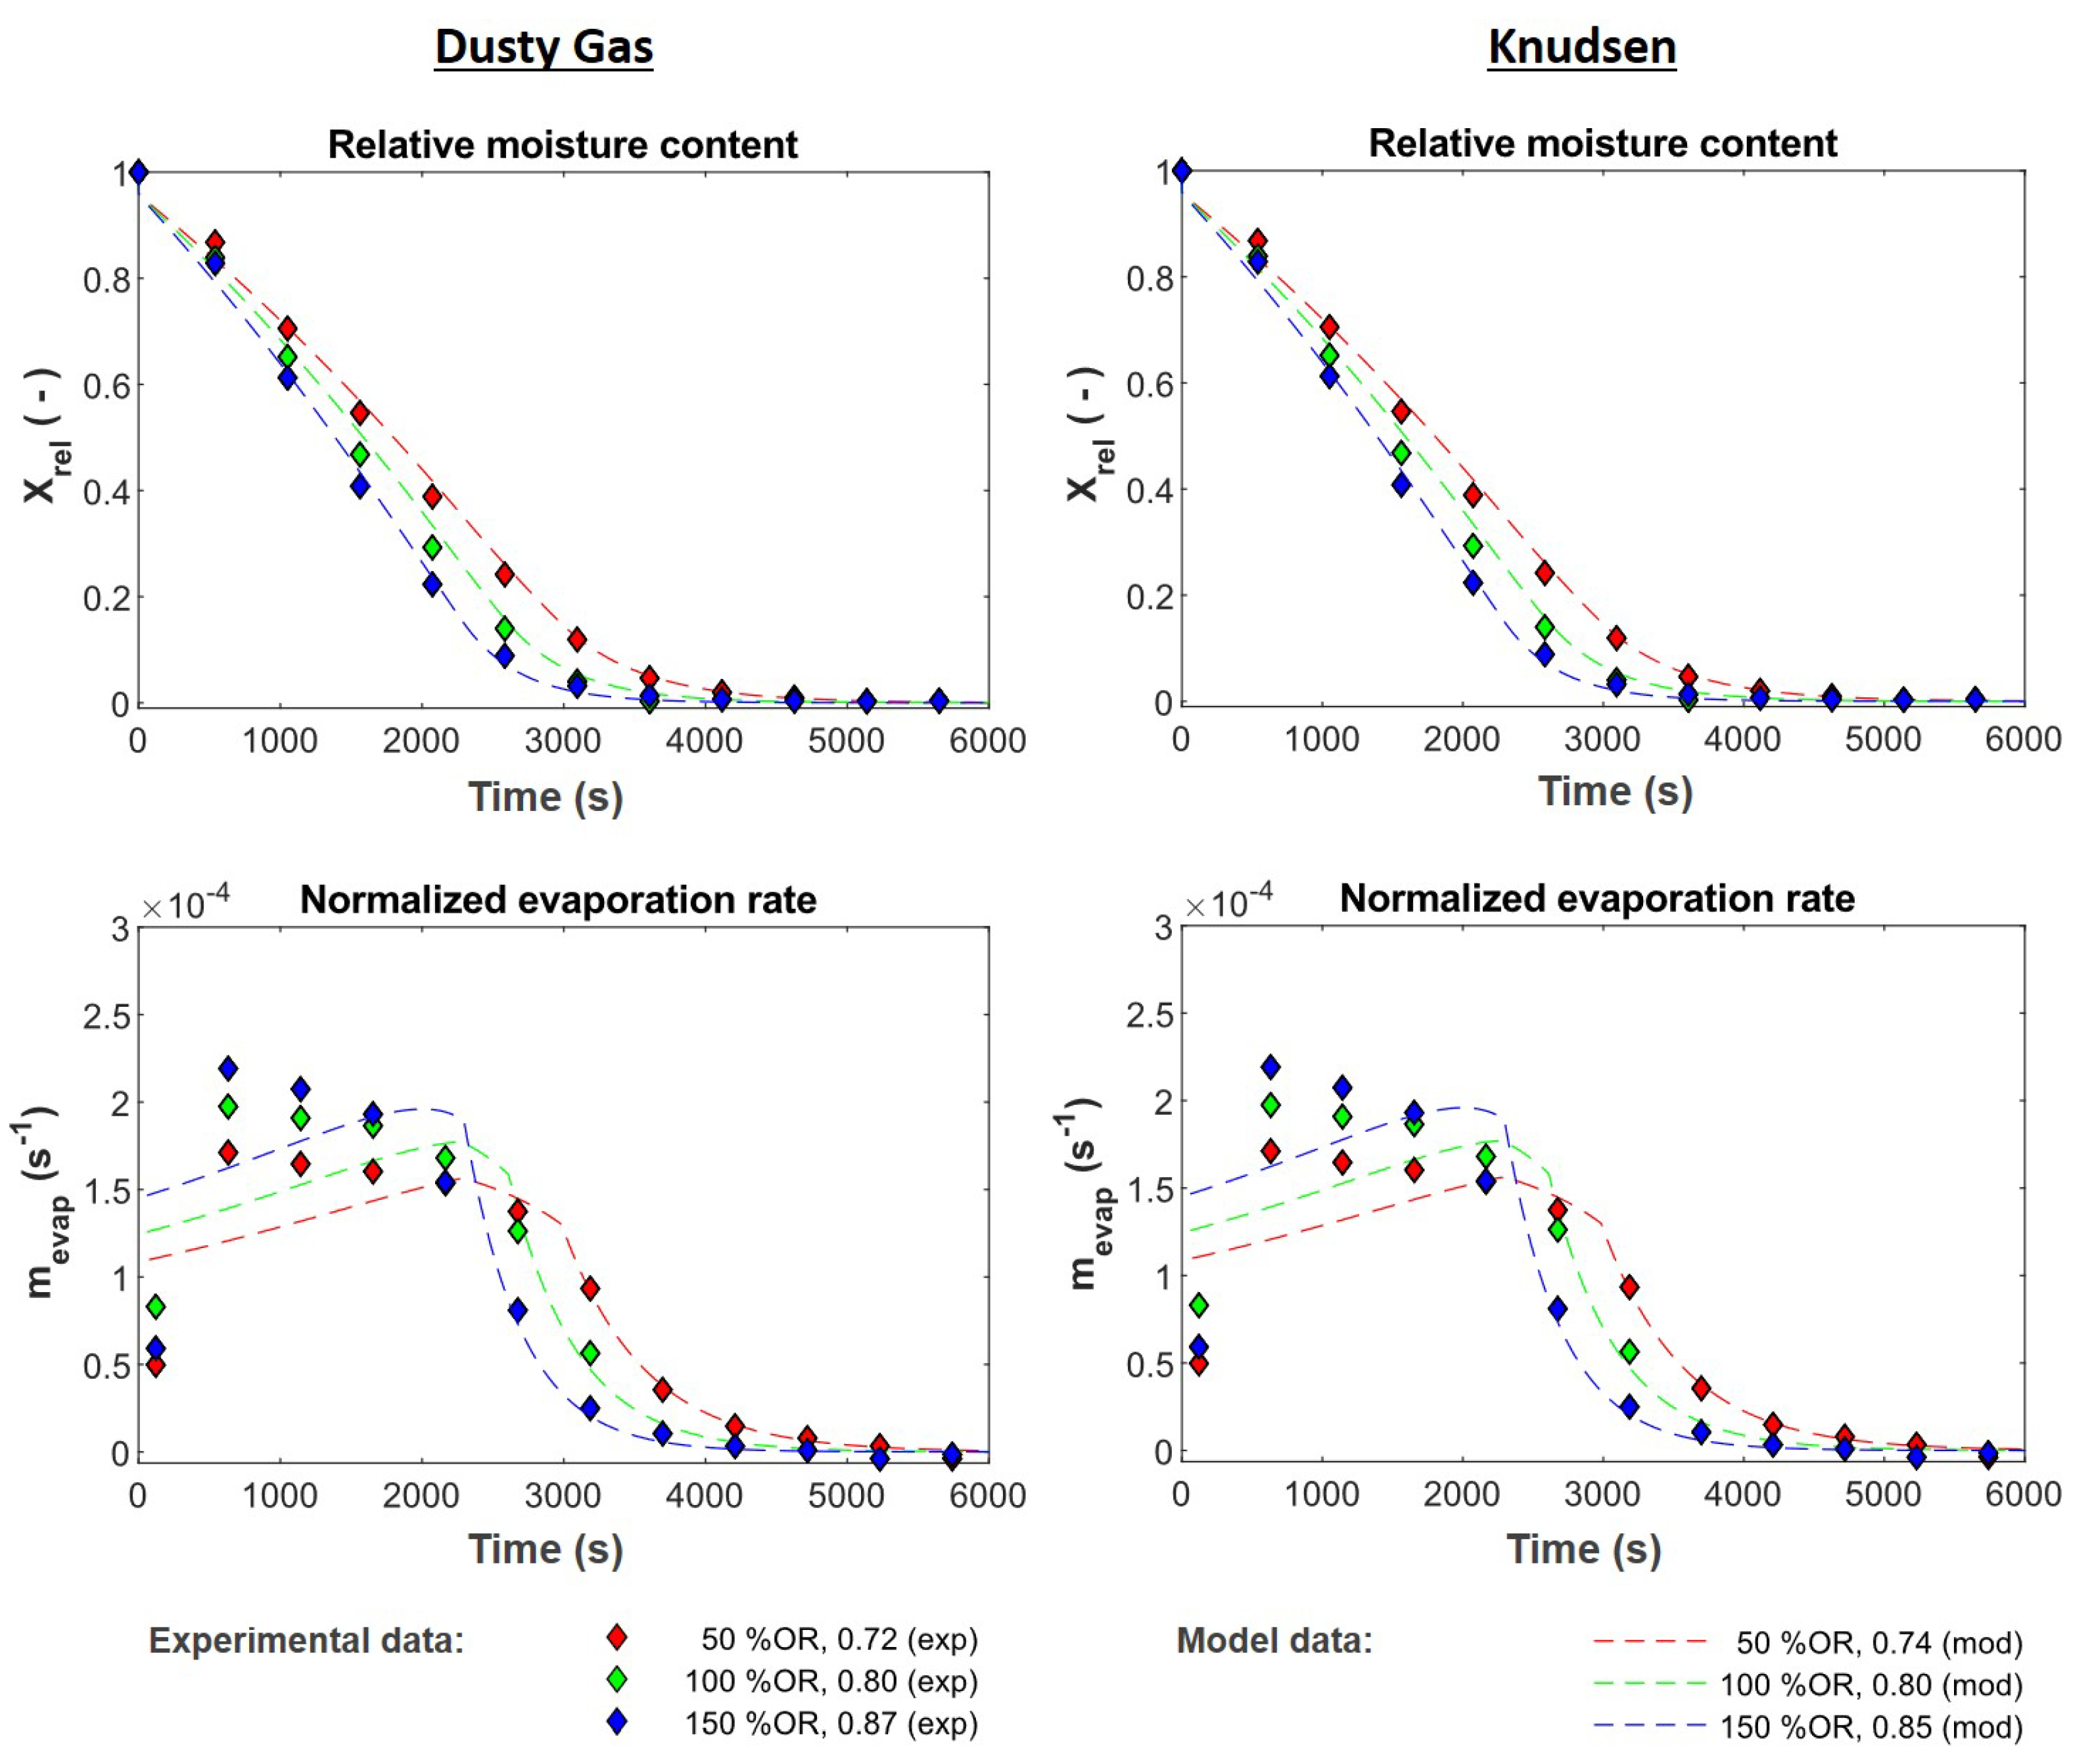
3.1. Experimental Results

To validate the model, experimental data are generated. To compare the drying kinetics and to define the transition between the end of the primary drying and the beginning of secondary drying, the time, which is needed to remove 80% of the water, is referred to as primary drying time. The residual water is removed by desorption during secondary drying. Since primary drying and secondary drying are not strictly separated, a part of the bound water is desorbing during the primary drying step as already discussed by other authors [4,5,8,9].
The structural parameters are summarized in Table 2. For the characterization of the particle diameter, the Sauter mean diameter is chosen, considering the surface area with respect to the volume, since freeze-dried coffee particles are not spherical. The primary drying time t 80 and the averaged evaporation rate m ˙ 80 , m e a n are used as measures for the description of the drying kinetics, where the latter is averaged over 15 s to overcome noice suppression.
In Figure 2, the internal pore structure of the coffee granules is shown for various interconnecting pore sizes, measured by mercury porosimetry. Here, the SEM images proof the range of interconnecting pore diameters, which are connecting the gas pores. The analysis of the images with the software ImageJ shows that gas bubble size can be held constant for all experiments at ( 23.1 ± 4.5 ) μ m .
The results show that an increasing pore diameter leads to decreasing primary drying time. These results go along with the findings of Searles et al. [16], Hottot et al. [3] and our previous findings [22]. Mass transfer limitations seem to become more significant at small pore diameters of 3 μ m or lower, but have less strong effects at higher pore diameters of 7 to 10 μ m .
For the increased porosity, a decreasing trend in drying time can be observed, but the interpretation of experimental data need to be treated with care. At constant sample mass and particle diameter, but increasing overrun, the number of particles is increasing. As only a single layer is observed, the particle surface area available for radiation is increasing, which improves the heat transfer as well. In consequence, an increase of overrun leads to a reduction of the total water amount per particle and increases the drying rates. Therefore, the mean evaporation rate per particle is more meaningful compared to the drying time and shows a decreasing rate with increasing overrun, since heat transfer limitations become dominant.
Due to increased robustness the experiments are conducted using a single layer of material instead of single particle investigations. However, for a single layer of particles, not the complete surface area is available for the heat transfer due to the slightly overlapping of the particles. These effects turn out to be more significant for samples with increasing porosity and are corrected by a fitting parameter f. As shown in previous publications [23,24], vials drying on the edges of the plate dry faster compared to the center vials, since a larger part of the vial surface is exposed to a radiative source. Additionally, the shelves are not the only sources for radiative heat transfer, but also the other surfaces inside the freeze-dryer and their reflection of heat radiated by the front window. Therefore, besides the shelf temperature also an average environmental temperature needs to be defined to adapt the model to experimental conditions. These overlapping effects and the heat source are relevant for the heat transfer and are considered in the model approach as fitting parameters for the radiative heat transfer:
Q ˙ r a d = f ϵ A p σ ( ( g · T s h 4 + ( 1 g ) T a m b 4 ) T p 4 ) ,
where f is the fitting parameter to consider the reduction in surface area for the heat transfer and g gives a ratio between heat transferred by the shelves in comparison to the heat transferred by other sources, where T a m b is the ambient temperature of 20 C .

3.2. Model Results

3.2.1. Validation

Both model approaches are validated with the experimental data. All samples for the validation process have an initial coffee concentration of 50% w/w and are foamed with nitrogen. The samples shown in Section 3.1 differ in their porosity and pore size. In Figure 3, the model results are compared with experimental data, varying the pore size diameters of the coffee granules between 2.88   μ m and 9.49   μ m , keeping the applied overrun constant at 100%.
The total porosity (open and closed pore porosity) is comparable for all samples with 0.79 ± 0.02. The closed pore porosity for all samples ranges between 2 and 5%. The data show that the model can predict the loss of moisture over time, showing a slightly curved profile during primary drying, which is expected as shelf temperature is ramped up. The model and the experiment show that narrow pores of 2.88   μ m decrease the drying rates significantly. Nevertheless, this limitation seems to decrease significantly for pore sizes between 7.2   μ m and 9.5   μ m , where the drying process gets limited rather by heat than mass transfer.
For the evaporation rate, the regions of primary and secondary drying can be observed in model and experiment. During primary drying a constant increase of the evaporation rate is observed, since shelf temperature increases in time. When shelf temperature is constant, a decreased rate is shown with time due to progressing heat and mass transfer limitations. During secondary drying a decay function can be observed, which approximates to an equilibrium value. While in the model primary drying and secondary drying are strictly separated, it can be observed that for the experiments the two mechanisms are overlapping, smoothening the curve in the transition region. Faster drying samples with usually increased pore diameter show a higher evaporation rate during primary drying (green and blue). During a later time-step between 2000 and 2500 s, the water content is decreasing significantly and the red curve shows the highest evaporation rate since primary drying is still not finished. The influence of the porosity on the drying kinetics are shown in Figure 4. The pore size is held constant in a range of ( 6.5 ± 1.18 ) μ m .
It shows that also for the varying porosity, the model fits the experimental data. With an increasing porosity, the drying time is decreasing and the vapor flow characterized by the normalized evaporation rate is increasing. The reason here is that for the experiments, the number of particles are increasing with increasing porosity and constant particle size and sample weight. Therefore, the heat transfer is increased. In the model, the volume of a particle is held constant and thus the surface area per particle stays constant. The amount of water is decreasing per particle. The normalization of the evaporation rate makes both approaches comparable and shows good trends for the primary drying, where low porosity shows the lowest normalized evaporation rate and high porosity shows the highest, as observed in the experiments. For secondary drying, all modeling approaches are in good agreement with the experimental data. In summary, the model shows similar trends in comparison to the experimental data for the Knudsen and the dusty gas approach, where only small deviations can be observed. Table 3 shows coeffcient of determination for both model approaches. A deviation both models is observed in the sixth decimal place. Both models show that an increasing pore diameter can decrease the limitations in mass transfer during primary drying and lead therefore to reduced drying times. An increase in porosity also shows a reduction in the drying time. However, this also leads to a reduction of absolute water content per volume of the particle on top of the improved pore space for vapor transport. The benefits and drawbacks of both parameters are discussed in detail in the sensitivity analysis.

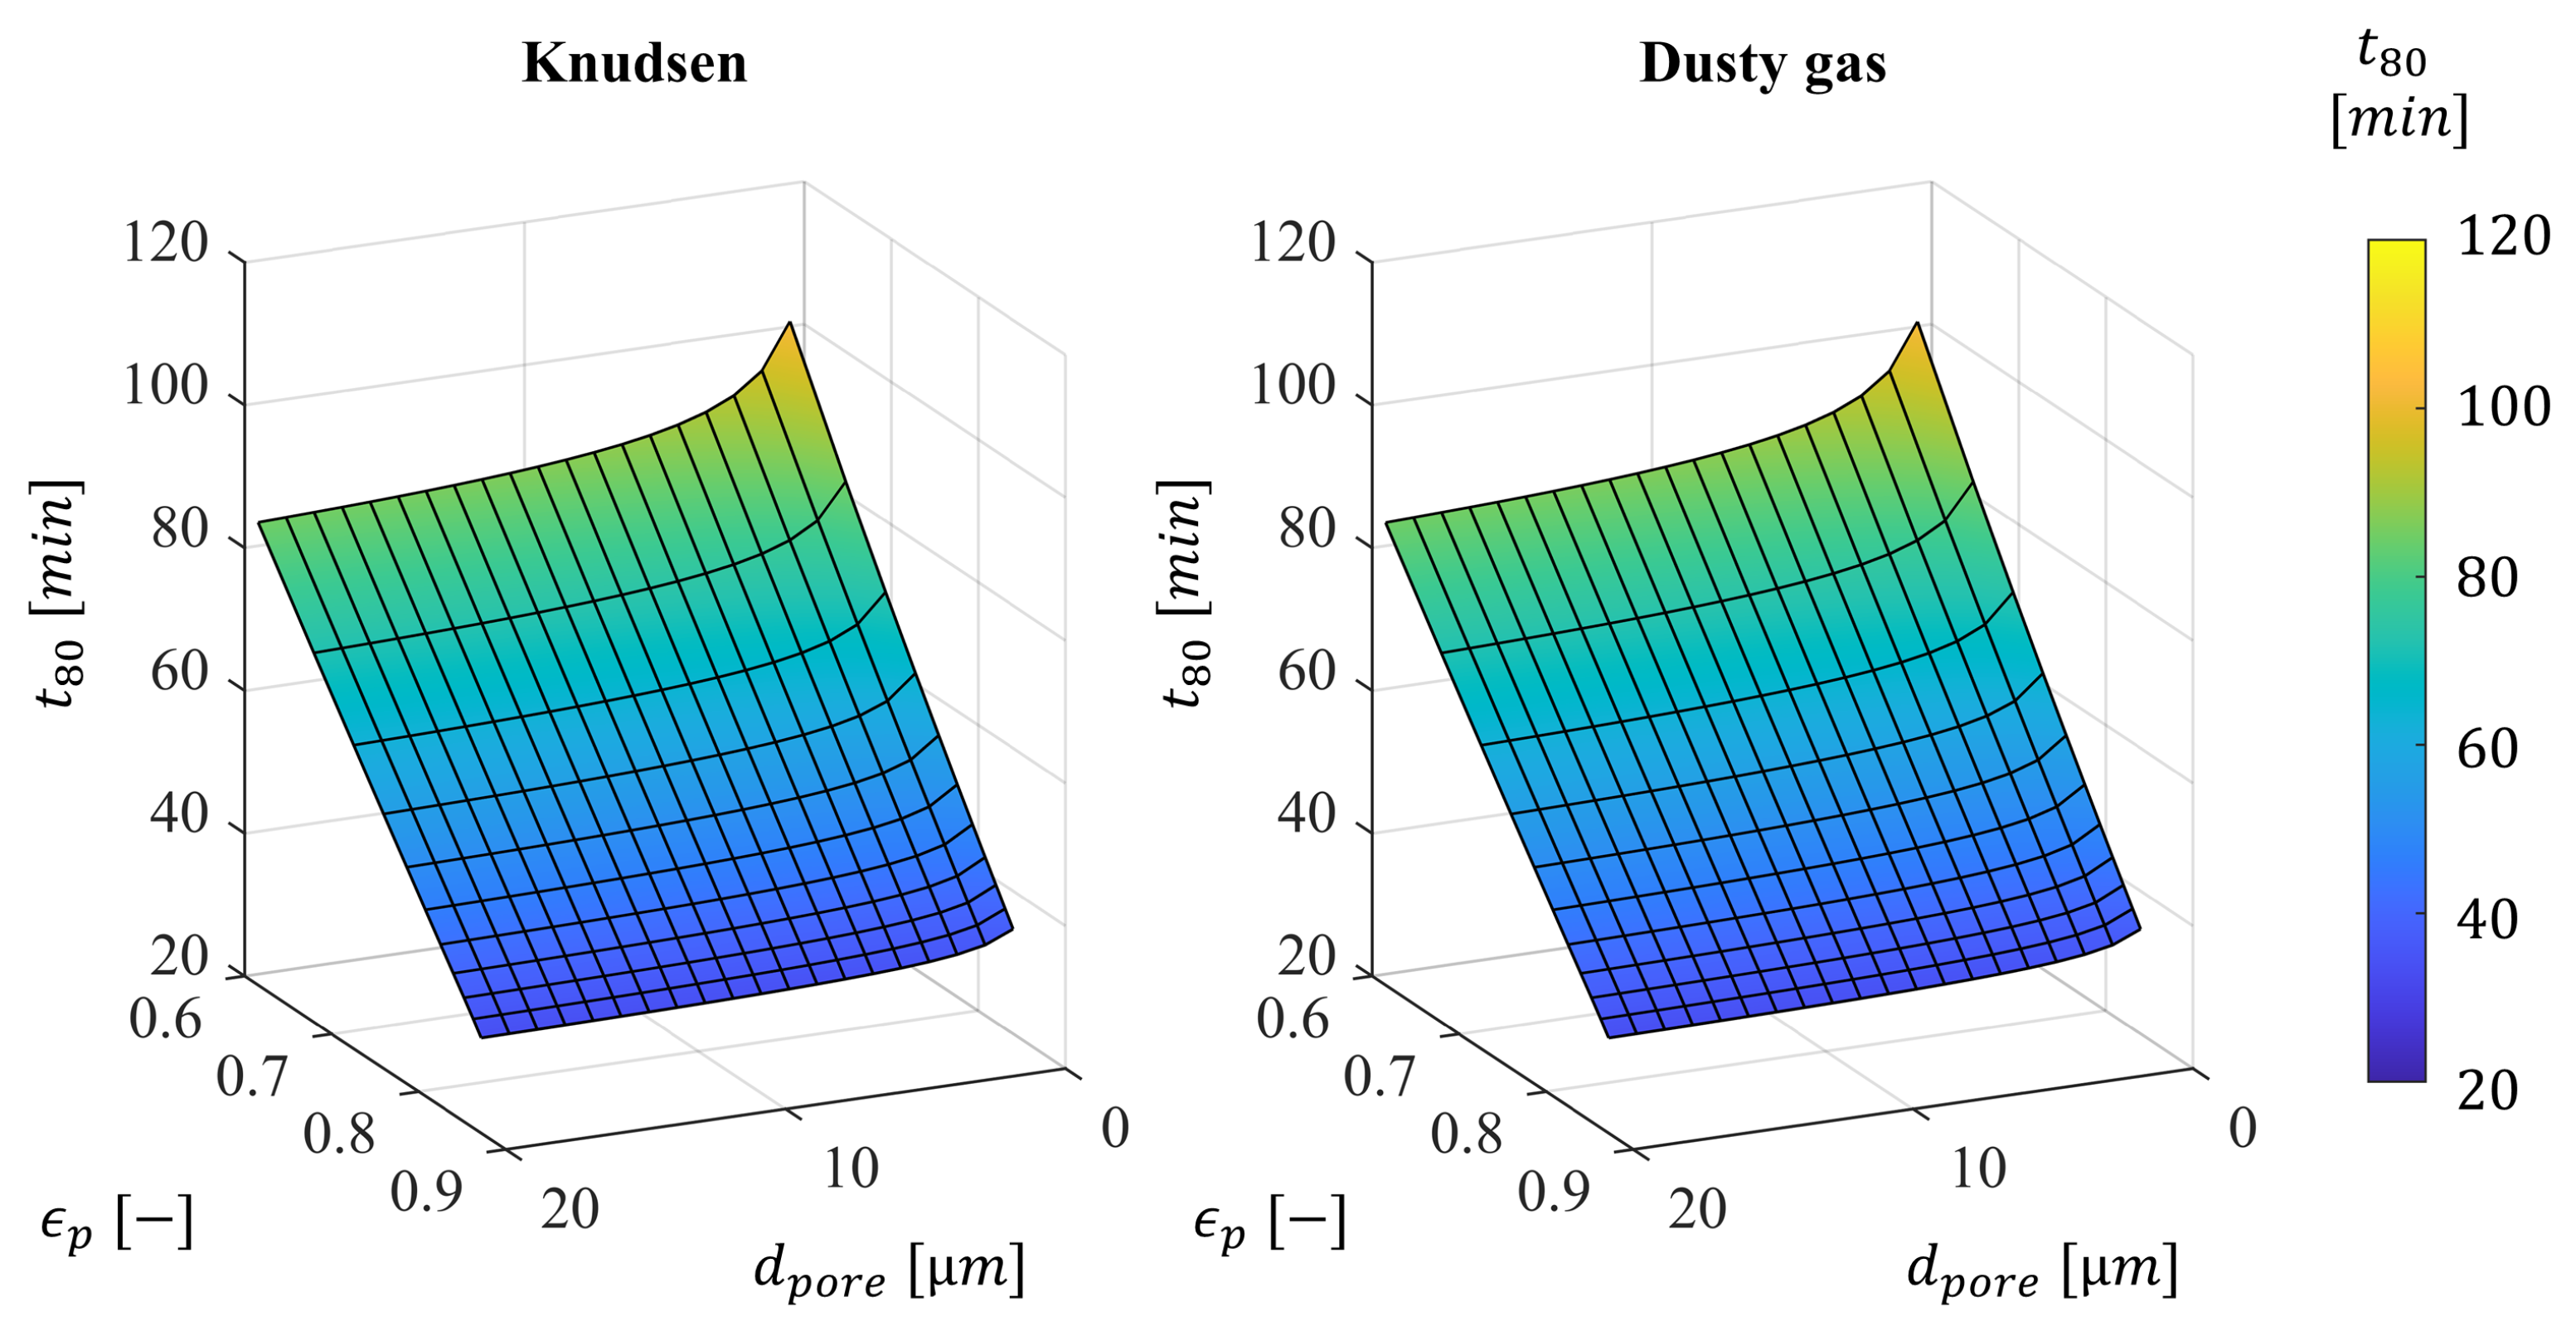
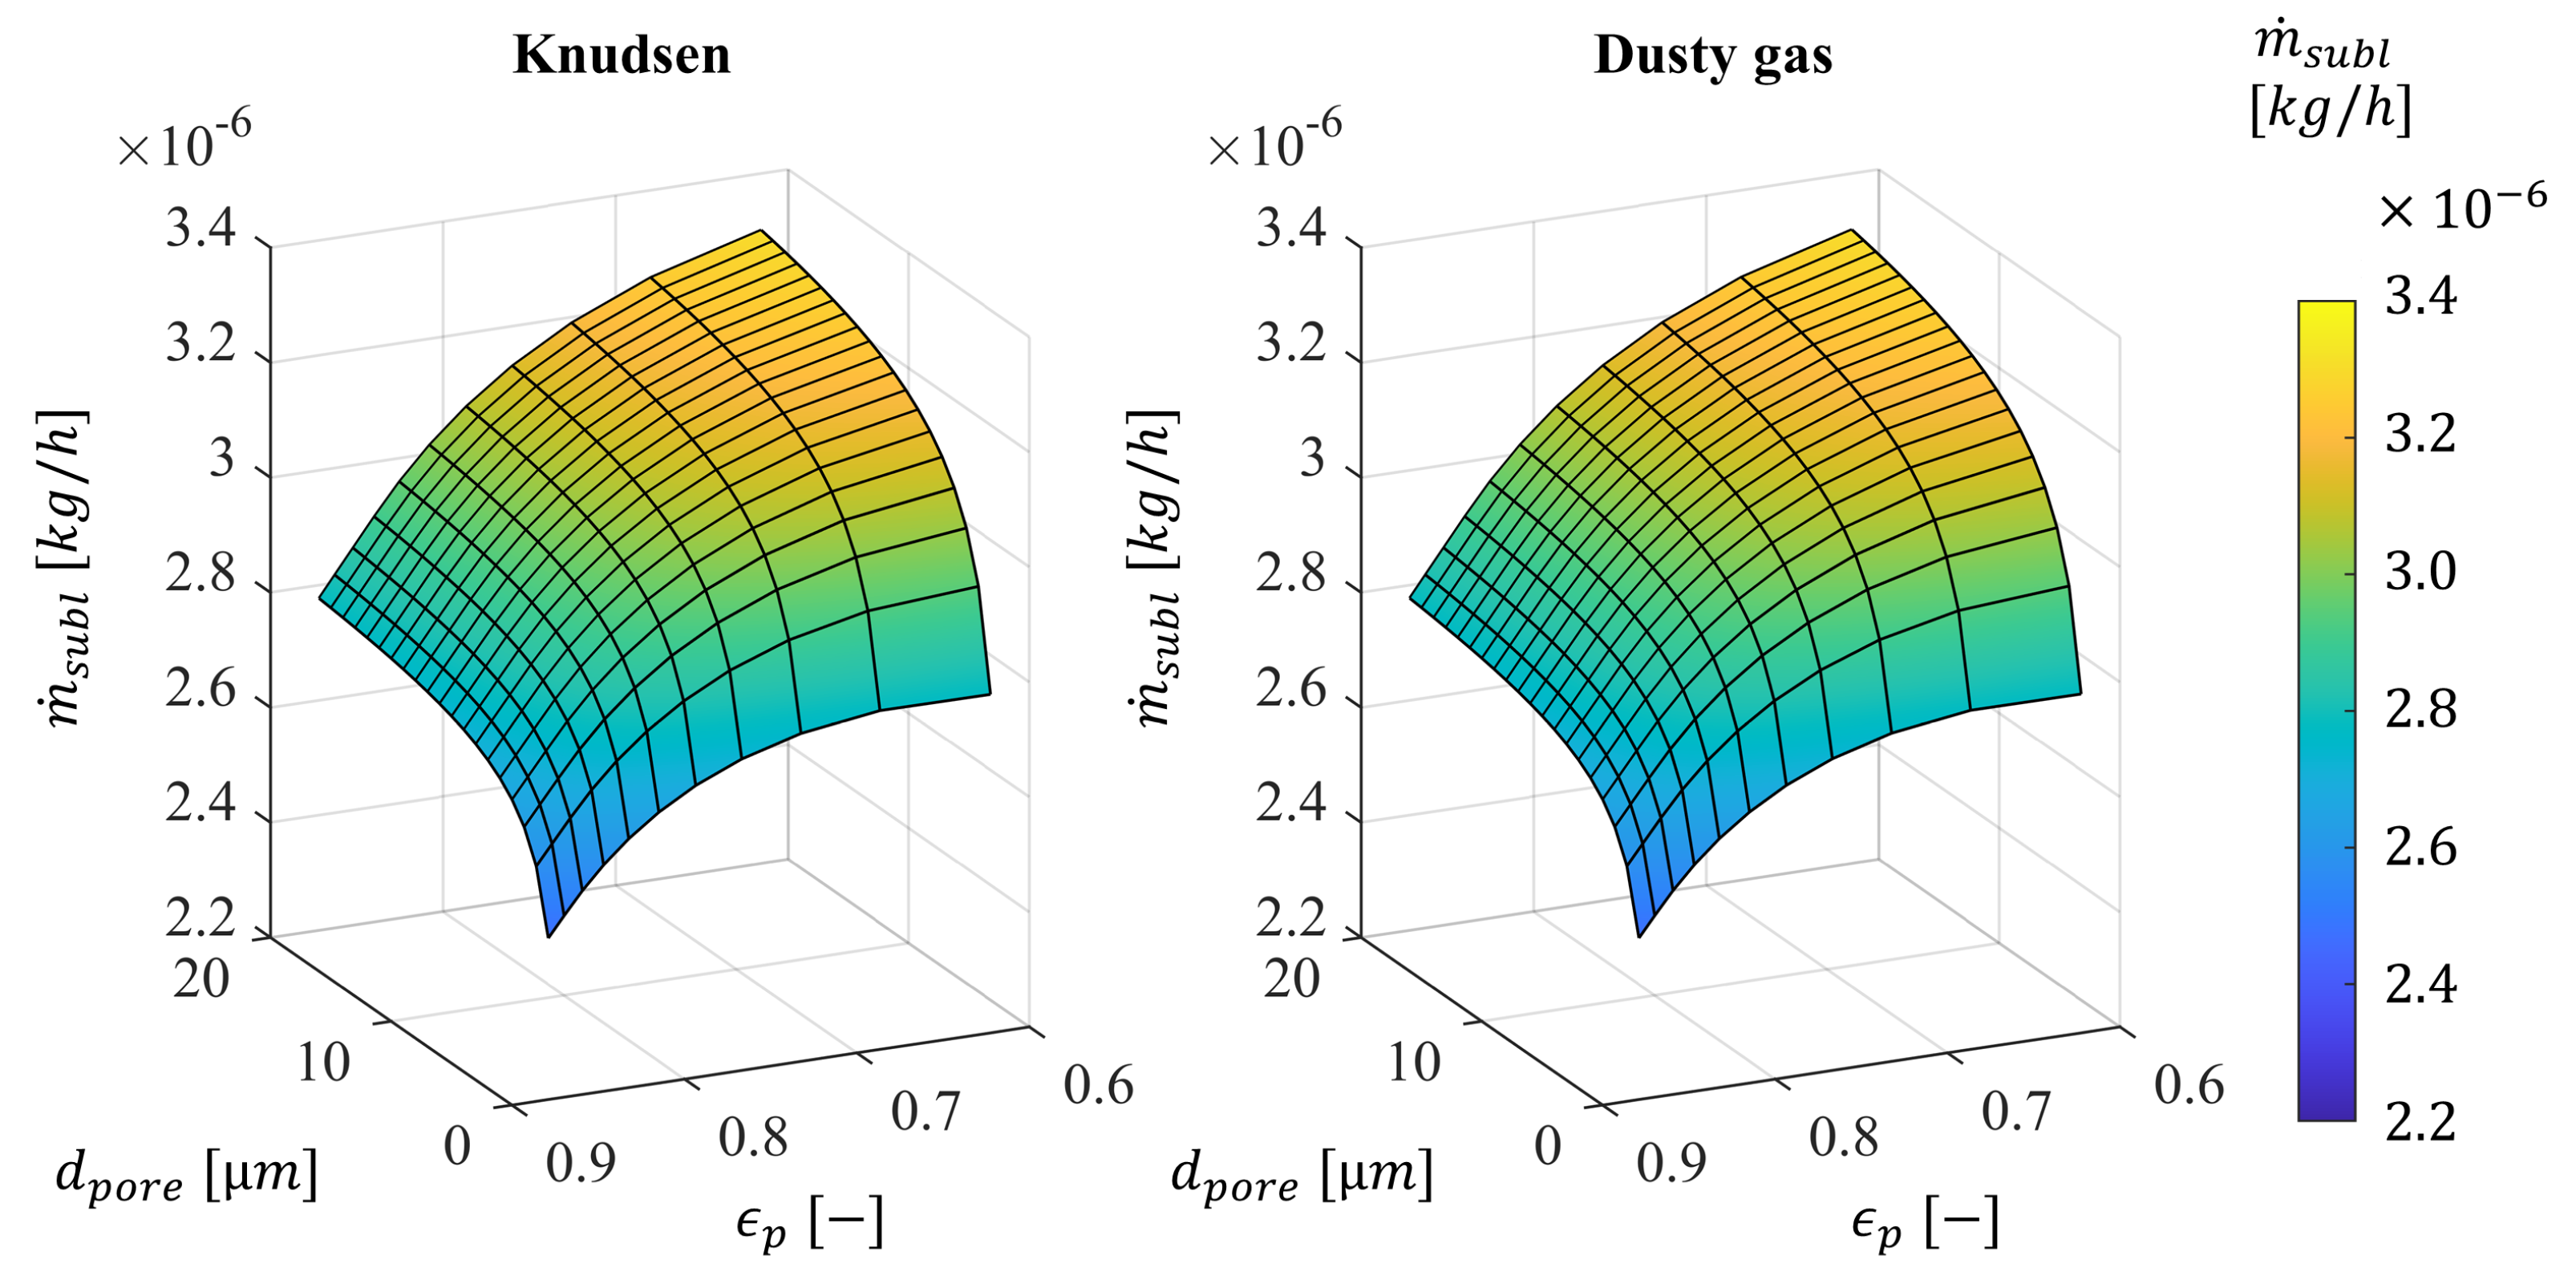
3.2.2. Sensitivity Analysis

For the sensitivity analysis, the model results are extrapolated and the influence of pore diameter and the porosity of the particle on the overall drying time and average sublimation rate is investigated. The pore diameter is varied from 0 to 20 μ m and the porosity is varied from 0.6 to 0.9. In Figure 5, the primary drying time as a function of both structural parameters is shown.
The vapor flow through the porous dried layer is modeled with Knudsen diffusion and with the dusty gas model. For both simulations, the same fitting parameters are used. Both approaches come to similar results in prediction of the drying time, with marginal differences. An increase of the pore diameter or an increase of porosity decreases the primary drying time. As mentioned before a change in porosity shows several overlapping effects: An increase of porosity (1) decreases the amount of water which needs to be evaporated for a single particle, (2) increases the pore volume for the mass transfer and (3) reduces the conductivity of the dried layer and inhibits the heat transfer inside the particle towards the sublimation front. These effects are coupled and therefore complicate an interpretation for the optimal configuration.
To understand the impact of the porosity on the heat and mass transfer mechanisms, the sublimation flow of water vapor needs to be considered to remove the influence of the decreasing water content, as shown in Figure 6. Here, only the dependency of the drying kinetics on pore volume and conductivity is considered.
Again both models show consistent results. It can be observed here that an increasing porosity of the sample reduces the vapor flow significantly. The optimum for both models is shown with 3.3 mgh−1 at a pore size of 20 μ m and an accessible porosity of 0.61 which corresponds to a sample where no gas was injected. With this configuration the optimal amount of vapor can be removed from the system during primary drying. It shows that the influence of porosity is increasing with increasing pore diameter since the freeze-drying process gets increasingly limited by the heat transfer. On the other hand, it shows that an increasing pore diameter has higher influences at low porosities of 60% in comparison to high porosities where the system is anyways limited by the heat transfer. At porosities of almost 0.9 a change in pore diameter from 10 to 20 μ m does not significantly change the results, while a change from 1 to 10 μ m has an impact. The highest limitations are observed at small pore diameters of 1 μ m and high porosities of almost 0.9 .

4. Conclusions

In this work, a mathematical model is presented to predict the freeze-drying time for bulky food materials, validated with experimental data. A Knudsen flow and a dusty gas model were used and compared for the mass transfer through the dried layer. Both model approaches are able to fit the experimental results in terms of moisture loss and sublimation rate over time during the freeze-drying process. The model shows room for improvement in the prediction of the transition regime between primary and secondary drying, where experiments have shown that a significant amount of water is already desorbed, while primary drying is still not completed. Nevertheless, this fact does not show any influence on the correct prediction of the drying kinetics of the model in comparison to the experimental approach. As it can be shown in the sensitivity analysis of this study, the pore size might be the appropriate tool to decrease the mass transfer limitations during freeze-drying. An increase of porosity also shows a reduction of mass transfer resistances, but on the expense of reduced heat transfer through the dried layer of the particle. Therefore, an increase of porosity leads to increasing drying time in the observed range of parameters at the given 50% w/w coffee concentration. Furthermore, a change in porosity affects the density and fragility of the product which can impact the product quality.
Both model approaches, the Knudsen flow and the dusty gas approach, are comparable tools to model the freeze-drying of food granules in a range of pore sizes of 1 to 20 μ m and porosities in the range of 0.6 to 0.9, which are typical for freeze-dried coffee products. In terms of complexity, an exclusive use of Knudsen flow is shown to be sufficient in this pore size range, shown to have a comparable coefficient of determination, where the dusty gas model may be of higher interest for bigger pore diameters or higher pressures, where other transport mechanisms such as viscous flow are dominating.

Author Contributions

Conceptualization, P.L., M.B., V.M., U.K., S.P.; methodology, P.L. and M.B.; software, P.L. and M.B.; validation, P.L. and M.B.; formal analysis, P.L. and M.B.; investigation, P.L.; resources, S.H.; data curation, P.L. and M.B.; writing—original draft preparation, P.L. and M.B.; writing—review and editing, P.L., M.B., V.M., U.K., S.P. and S.H.; visualization, P.L. and M.B.; supervision, V.M., S.P. and S.H.; project administration, S.H.; funding acquisition, S.H. All authors have read and agreed to the published version of the manuscript.

Funding

This research received no external funding.

Institutional Review Board Statement

Not applicable.

Informed Consent Statement

Not applicable.

Data Availability Statement

Not applicable.

Conflicts of Interest

The authors declare no conflict of interest.

Abbreviations

The following abbreviations are used in this manuscript:
OROverrun
PSDParticle size distribution
SEMScanning electron microscopy
SSHEScarped surface heat exchanger

References

  1. Khalloufi, S.; Robert, J.L.; Ratti, C. Solid foods freeze-drying simulation and experimental data. J. Food Process Eng. 2005, 28, 107–132. [Google Scholar] [CrossRef]
  2. Ratti, C. Hot air and freeze-drying of high-value foods: A review. J. Food Eng. 2001, 49, 311–319. [Google Scholar] [CrossRef]
  3. Hottot, A.; Vessot, S.; Andrieu, J. A Direct Characterization Method of the Ice Morphology. Relationship Between Mean Crystals Size and Primary Drying Times of Freeze-Drying Processes. Dry. Technol. 2004, 22, 2009–2021. [Google Scholar] [CrossRef]
  4. Pikal, M.J.; Cardon, S.; Bhugra, C.; Jameel, F.; Rambhatla, S.; Mascarenhas, W.J.; Akay, H.U. The nonsteady state modeling of freeze drying: In-process product temperature and moisture content mapping and pharmaceutical product quality applications. Pharm. Dev. Technol. 2005, 10, 17–32. [Google Scholar] [CrossRef] [PubMed]
  5. Liapis, A.I.; Bruttini, R. A mathematical model for the spray freeze drying process: The drying of frozen particles in trays and in vials on trays. Int. J. Heat Mass Transf. 2009, 52, 100–111. [Google Scholar] [CrossRef]
  6. Sebasti ao, I.B.; Bhatnagar, B.; Tchessalov, S.; Ohtake, S.; Plitzko, M.; Luy, B.; Alexeenko, A. Bulk Dynamic Spray Freeze-Drying Part 1: Modeling of Droplet Cooling and Phase Change. J. Pharm. Sci. 2019, 108, 2063–2074. [Google Scholar] [CrossRef]
  7. Song, C.S.; Yeom, G.S. Experiment and numerical simulation of heat and mass transfer during a spray freeze-drying process of ovalbumin in a tray. Heat Mass Transf. 2009, 46, 39–51. [Google Scholar] [CrossRef]
  8. Sadikoglu, H.; Liapis, A.I. Mathematical Modelling of the Primary and Secondary Drying Stages of Bulk Solution Freeze-Drying in Trays: Parameter Estimation and Model Discrimination by Comparison of Theoretical Results with Experimental Data. Dry. Technol. 1997, 15, 791–810. [Google Scholar] [CrossRef]
  9. Sheehan, P.; Liapis, A.I. Modeling of the primary and secondary drying stages of the freeze drying of pharmaceutical products in vials: Numerical results obtained from the solution of a dynamic and spatially multi-dimensional lyophilization model for different operational policies. Biotechnol. Bioeng. 1998, 60, 712–728. [Google Scholar] [CrossRef]
  10. Liapis, A.I.; Bruttini, R. Fundamentals of modeling and analysis of spray freeze drying: The drying of frozen pharmaceutical and food particles in packed beds. In Proceedings of the 17th International Drying Symposium, Magdeburg, Germany, 3–6 October 2010; pp. 71–80. [Google Scholar]
  11. Her, J.Y.; Song, C.S.; Lee, S.J.; Lee, K.G. Preparation of kanamycin powder by an optimized spray freeze-drying method. Powder Technol. 2010, 199, 159–164. [Google Scholar] [CrossRef]
  12. Warning, A.D.; Arquiza, J.; Datta, A.K. A multiphase porous medium transport model with distributed sublimation front to simulate vacuum freeze drying. Food Bioprod. Process. 2015, 94, 637–648. [Google Scholar] [CrossRef]
  13. Gruber, S.; Vorhauer-Huget, N.; Foerst, P. In situ micro-computed tomography to study microstructure and sublimation front during freeze-drying. Food Struct. 2021, 29, 100213. [Google Scholar] [CrossRef]
  14. Vorhauer-Huget, N.; Mannes, D.; Hilmer, M.; Gruber, S.; Strobl, M.; Tsotsas, E.; Foerst, P. Freeze-Drying with Structured Sublimation Fronts—Visualization with Neutron Imaging. Processes 2020, 8, 1091. [Google Scholar] [CrossRef]
  15. Vorhauer, N.; Först, P.; Schuchmann, H.; Tsotsas, E. Pore network model of primary freeze drying. In Proceedings of the 21th International Drying Symposium, Valencia, Spain, 11–14 September 2018. [Google Scholar] [CrossRef] [Green Version]
  16. Searles, J.A.; Carpenter, J.F.; Randolph, T.W. The ice nucleation temperature determines the primary drying rate of lyophilization for samples frozen on a temperature–controlled shelf. J. Pharm. Sci. 2001, 90, 860–871. [Google Scholar] [CrossRef] [PubMed]
  17. Kast, W.; Hohenthanner, C.R. Mass transfer within the gas-phase of porous media. Int. J. Heat Mass Transf. 2000, 43, 807–823. [Google Scholar] [CrossRef]
  18. Jackson, R. Transport in porous catalysts. In Chemical Engineering Monographs; Elsevier: Amsterdam, The Netherlands, 1977; Volume 4. [Google Scholar]
  19. Mason, E.A.; Malinauskas, A.P.; Malinauskas, A.P. Gas transport in porous media: The dusty-gas model. In Chemical Engineering Monographs; Elsevier: Amsterdam, The Netherlands, 1983; Volume 17. [Google Scholar]
  20. Gloor, P.J.; Crosser, O.K.; Liapis, A.I. Dusty-gas parameters of activated carbon absorbent particles. Chem. Eng. Commun. 1987, 59, 95–105. [Google Scholar] [CrossRef]
  21. Marti, J.; Mauersberger, K. A survey and new measurements of ice vapor pressure at temperatures between 170 and 250 K. Geophys. Res. Lett. 1993, 20, 363–366. [Google Scholar] [CrossRef]
  22. Levin, P.; Meunier, V.; Kessler, U.; Heinrich, S. Influence of Freezing Parameters on the Formation of Internal Porous Structure and Its Impact on Freeze-Drying Kinetics. Processes 2021, 9, 1273. [Google Scholar] [CrossRef]
  23. Wegiel, L.A.; Ferris, S.J.; Nail, S.L. Experimental Aspects of Measuring the Vial Heat Transfer Coefficient in Pharmaceutical Freeze-Drying. AAPS PharmSciTech 2018, 19, 1810–1817. [Google Scholar] [CrossRef] [PubMed]
  24. Rambhatla, S.; Pikal, M.J. Heat and mass transfer scale-up issues during freeze-drying, I: Atypical radiation and the edge vial effect. AAPS PharmSciTech 2003, 4, E14. [Google Scholar] [CrossRef] [PubMed] [Green Version]
Figure 1. Model structure for the freeze-drying process of a single particle using a shrinking core approach. The different model regions, i. e. frozen core, porous dried layer and particle surface, are shown on the left hand side. The image on the right hand side shows the different transfer flows between the model regions.
Processes 10 00548 g001
Figure 2. Scanning electron microscopy images of coffee granules showing the gas bubble size and the size of the interconnecting pores, left behind by ice crystals.
Processes 10 00548 g002
Figure 3. Validation of Knudsen model and dusty gas approach by means of experimental data during the freeze-drying of instant coffee granules by variation of pore size.
Processes 10 00548 g003
Figure 4. Validation of Knudsen model and dusty gas approach by means of experimental data during the freeze-drying of instant coffee granules by variation of overrun and the total porosity of the sample. Measured and calculated porosities for each sample are shown in the legend of each plot.
Processes 10 00548 g004
Figure 5. Primary drying time as a function of mean pore diameter and porosity, modeled by Knudsen diffusion and the dusty gas approach for the mass transfer processes through pores in the dried layer.
Processes 10 00548 g005
Figure 6. Averaged vapor mass flow during the freeze-drying process, modeled by Knudsen diffusion and the dusty gas approach as a function of mean pore diameter and porosity.
Processes 10 00548 g006
Table 1. Drying profile for single-layer drying to determine the freeze-drying kinetics of instant coffee.
StepT start T end P chamber t
( C)( C)(mbar)(min)
1−30−3010131
2−30460.438
346460.490
446250.420
Table 2. Drying time and mean evaporation rate of coffee granules as a function of Sauter mean diameter d 32 , p of the particle size distribution and structural parameters such as mean pore size d 50 , p o r e and open porosity ϵ .
d 32 , p d 50 , pore ϵ p t 80 m ˙ 80 , mean
(mm)(µm)( - )(min)(kg/h)
2.652.880.74344.4 ± 2.22.36 ± 0.20
2.677.200.77139.4 ± 0.13.03 ± 0.00
2.849.490.75939.1 ± 0.53.05 ± 0.04
2.605.340.69244.4 ± 1.23.56 ± 0.10
2.507.710.79637.4 ± 1.62.47 ± 0.11
Table 3. Coefficient of determination of the sample moisture evolution over time during freeze-drying, using the Knudsen approach R K n 2 and the dusty gas approach R D u 2 in comparison to experimental data.
d 32 , p d 50 , pore ϵ p R Kn 2 R Du 2
(mm)(µm)( - )( - )( - )
2.652.880.7430.9956490.995648
2.677.200.7710.9952470.995255
2.849.490.7590.9963400.996339
2.605.340.6920.9966240.996621
2.507.710.7960.9949860.994981
Publisher’s Note: MDPI stays neutral with regard to jurisdictional claims in published maps and institutional affiliations.

