
An Effective Temperature Control Method for Dividing-Wall Distillation Columns


College of Information Science and Technology, Beijing University of Chemical Technology, Beijing 100029, China
*
Authors to whom correspondence should be addressed.
Processes 2022, 10(5), 1018; https://0-doi-org.brum.beds.ac.uk/10.3390/pr10051018
Submission received: 29 April 2022
/
Revised: 17 May 2022
/
Accepted: 17 May 2022
/
Published: 20 May 2022
(This article belongs to the Special Issue Modelling, Monitoring, Control and Optimization for Complex Industrial Processes)
Abstract
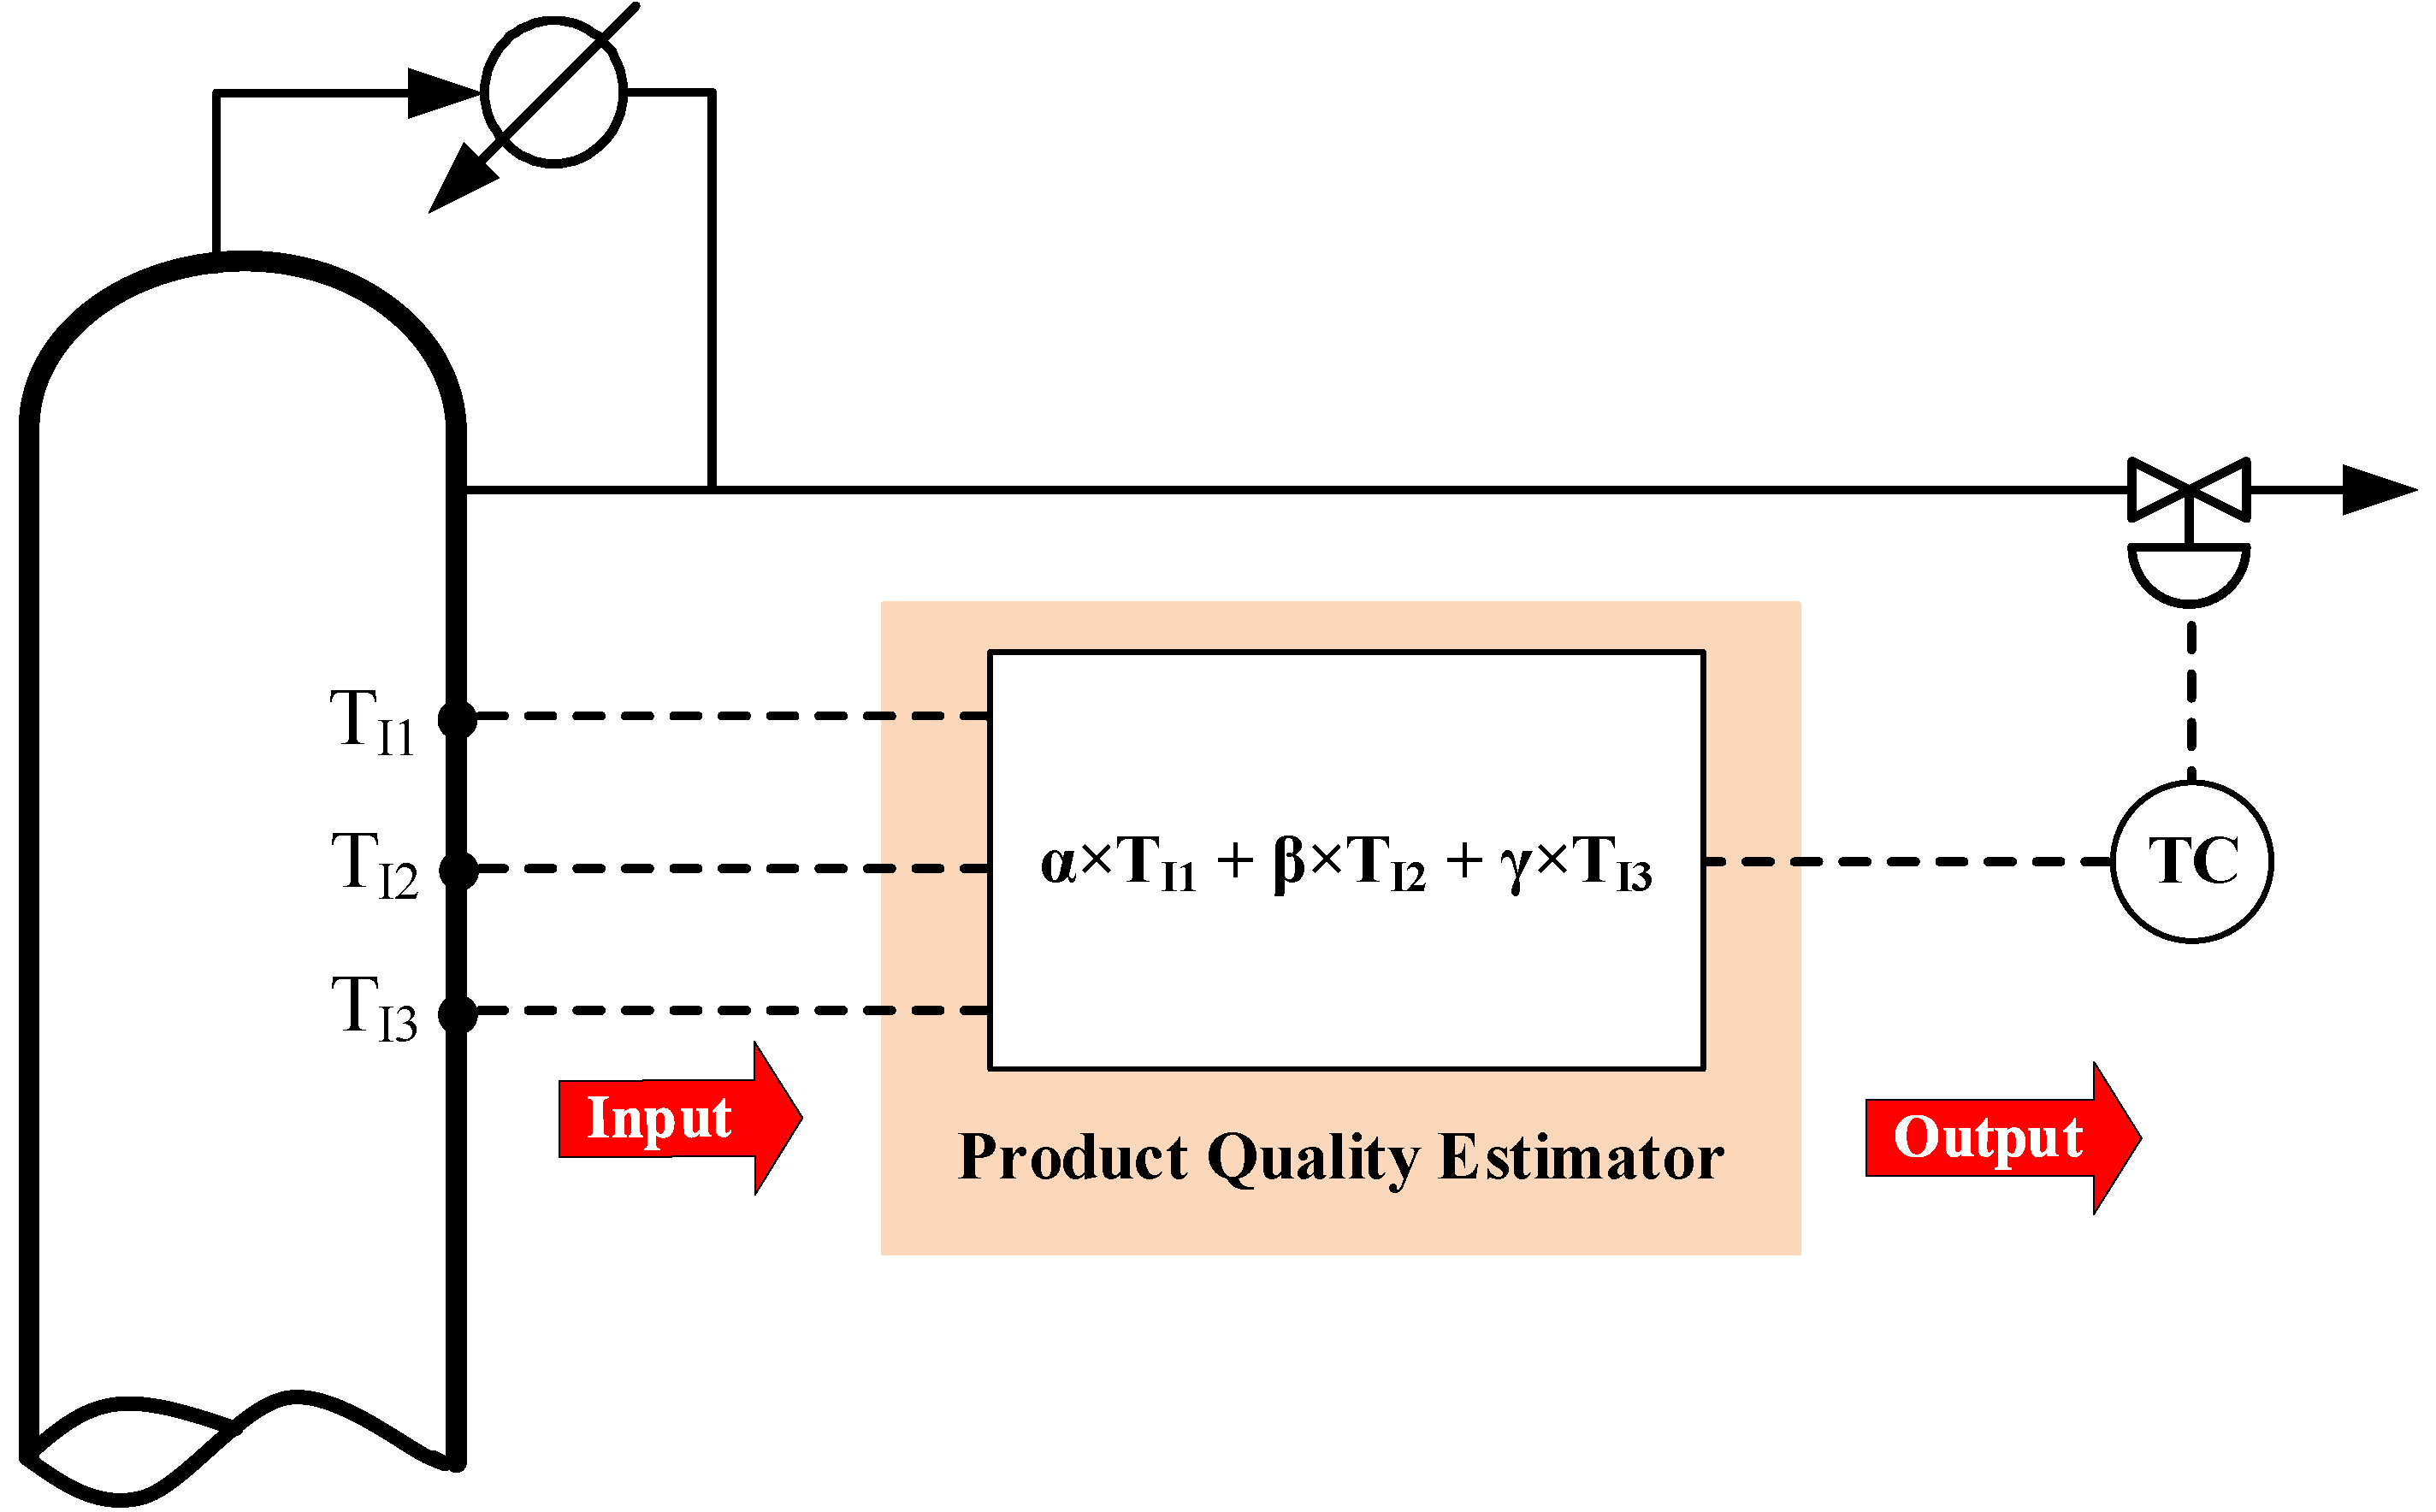
:Temperature control is widely perceived to be superior to direct composition control for the control of dividing-wall distillation columns (DWDCs) due to its advantages in dynamic characteristics. However, because of the limited estimation accuracy to the controlled product purities, the former cannot eliminate the steady-state errors in the maintained product purities as completely as the latter. In order to reduce the steady-state deviations in the maintained product purities, an effective temperature control method is proposed in the current article by means of a kind of simple but effective product quality estimator (PQE). For the proposed PQE, temperatures of three stages located in the controlled column section (TI1, TI2, and TI3) are employed as inputs, and a linear sum of these three inputted stage temperatures (α × TI1 + β × TI2 + γ × TI3) is given as output. A genetic algorithm with an elitist preservation strategy is used to optimize the locations of the three stage temperatures and the values of α, β, and γ to ensure the estimation accuracy of the PQE. Concerning the controls of two DWDCs, i.e., one Petlyuk DWDC separating an ethanol/propanol/butanol ternary mixture and one Kaibel DWDC separating a methanol/ethanol/propanol/butanol quaternary mixture, the effectiveness of the PQE is assessed through comparing the performance of the temperature inferential control scheme using the PQE and the double temperature difference control scheme. According to the dynamic simulation results obtained, the former control scheme displays not only smaller steady-state deviations in the maintained product purities, but also better dynamic characteristics as compared with the latter control scheme. This result fully demonstrates that the proposed PQE can be a useful tool for the temperature inferential control of the DWDC.
1. Introduction
As a typical complex industrial process [1,2], the dividing-wall distillation column (DWDC) is famous for its excellent energy-saving and investment-reducing capacities [3,4,5]. However, it is very hard to achieve its stable operation and strict product quality control due to its characteristics of high nonlinearity and large time delay. This control problem constrains greatly the application of the DWDC in chemical industries [6] and reminds us of the importance of studying the control of the DWDC.
Focusing on the control of the DWDC, a wide range of control methods have been studied, including but not limited to direct composition control [7,8,9,10], composition-temperature cascade control [11,12], and temperature inferential control [13,14,15,16]. Among them, temperature inferential control has the largest application potential in the chemical industry because of its obvious superiorities in dynamic characteristics and equipment investment. The only pity is that temperature inferential control schemes may give rise to large steady-state deviations in the product purities to be maintained due to unpredictable pressure variations within the DWDC. For the purpose of reducing the steady-state deviations in the product purities to be maintained substantially, many studies have been conducted in recent years to give various effective temperature inferential control schemes. For instance, Ling and Luyben gave a temperature difference control (TDC) scheme that involves four temperature difference control loops for controlling the Petlyuk DWDC [17]. Because the effects of pressure variations on the two stage temperatures that form the temperature difference are similar and can offset each other to a certain degree, the estimation accuracy of the temperature difference is less influenced by pressure variations. Therefore, the TDC scheme could achieve stricter product quality control than the conventional temperature control scheme. Wu et al. proposed a double temperature difference control (DTDC) scheme for the control of the Petlyuk DWDC by employing a double temperature difference to estimate the maintained product purity in each control loop [18]. Because the effects of pressure variations on the two temperature differences that form the double temperature difference are similar and can be offset each other, the performance of the DTDC scheme was further improved as compared with the TDC scheme. Not only were the steady-state errors in the maintained product purities obviously reduced, but also the capability of rejecting feed disturbances was improved. Subsequently, Yuan et al. found that it is possible to further increase the estimation accuracy of the double temperature difference to the maintained product purity by carefully coordinating the relationship between the two temperature differences that form the double temperature difference, and developed a new derivation method of the DTDC scheme [19]. According to their dynamic simulation results, the DTDC scheme derived by the new method could result in smaller steady-state errors in the product purities to be maintained as compared with the DTDC scheme derived by the conventional method. Furthermore, Pan et al. developed a pressure-compensated temperature control loop to enhance the control of the lower sidestream product for a Kaibel DWDC [20]. For this pressure-compensated temperature control loop, pressure and temperature of a stage, including primarily binary mixture, were first measured, and the composition of this stage was then inferred to be used as the controlled variable, relying on an equation describing the relationship among the temperature, the pressure, and composition. Although this pressure-compensated temperature control loop is effective, its principle is too complicated to be popular.
Based on the above analysis, we can clearly find that the key to improving the steady-state performance of the temperature inferential control scheme lies in employing appropriate pressure compensation methods. In the current work, we will propose a kind of novel product quality estimator (PQE). It can suppress the adverse effect of pressure variations and provide a more accurate estimation of the product purity to be maintained according to the stage temperatures measured. In the remainder of this article, the structure of the proposed PQE and its design method are firstly elaborated in Section 2. In terms of two DWDCs, including one Petlyuk DWDC separating an ethanol (E)/propanol (P)/butanol (B) ternary mixture (EPB Petlyuk DWDC) and one Kaibel DWDC separating methanol (M)/E/P/B quaternary mixture (MEPB Kaibel DWDC), comparisons between the DTDC scheme derived by the new method (its steady-state and dynamic performances are more excellent than those of the other temperature difference control schemes, and thus it is employed here as a comparison) and the temperature inferential control scheme using the PQE (TC-PQE) are conducted to assess the effectiveness of the PQE in Section 3 and Section 4. An objective evaluation of the proposed PQE is provided in Section 5. Some conclusions are briefly given in Section 6.
2. Structure and Design Method of the Proposed PQE
2.1. Structure of the PQE
Figure 1 gives the schematic of the PQE proposed for the control of the DWDC. Its inputs are temperatures of three stages located in the controlled column section (TI1, TI2, and TI3), and its output is equal to a linear sum of these three inputted stage temperatures (α × TI1 + β × TI2 + γ × TI3). The temperature difference [16,17] and the double temperature difference [18,19] have demonstrated that detecting multiple stage temperatures is an effective method to overcome the adverse effect of pressure variations. This is the main reason why three stage temperatures are measured and inputted in the PQE. Further, someone might ask why the number of the inputted stage temperatures is determined to be three, not two, or a number greater than three. There are mainly the following two reasons: one is that at least three stage temperatures are required if someone wants to clearly and rapidly detect the temperature variations of one column section; the other is that using more temperatures cannot obtain an obvious improvement in detection quality but increases the complexity and equipment cost of the PQE.
2.2. Design Method of the PQE
To ensure the PQE can not only give an accurate inference to the maintained product purity but also has satisfying dynamic characteristics, its six design variables, i.e., the locations of the three inputted stage temperatures and the values of α, β, and γ, must be specially optimized according to the characteristics of the controlled column section before it is used in a certain control loop. To quantitatively evaluate the dynamic characteristics and the estimation accuracy of the PQE, the static gain between the output of the PQE and the manipulated variable and the AAVM of the output of the PQE are employed, respectively. The static gain between the output of the PQE and the manipulated variable can be calculated according to the following procedure. Firstly, a very small variation (0.5%) is given to the manipulated variable; secondly, the steady-state model is run and a new steady state is obtained; finally, the absolute variation in the output of the PQE divided by the absolute variation in the manipulated variable gives the static gain. The bigger static gain means that the PQE has better dynamic characteristics. The AAVM of the output of the PQE indicates the averaged absolute variation magnitude of the output of the PQE for all kinds of disturbances in feed component composition, with the prerequisite of strictly maintaining all controlled product purities to their specifications. The detailed calculation method of the AAVM can be found in our previous article [19] and is no longer given here due to limited space. The smaller AAVM means that the PQE has higher estimation accuracy for the maintained product purity.
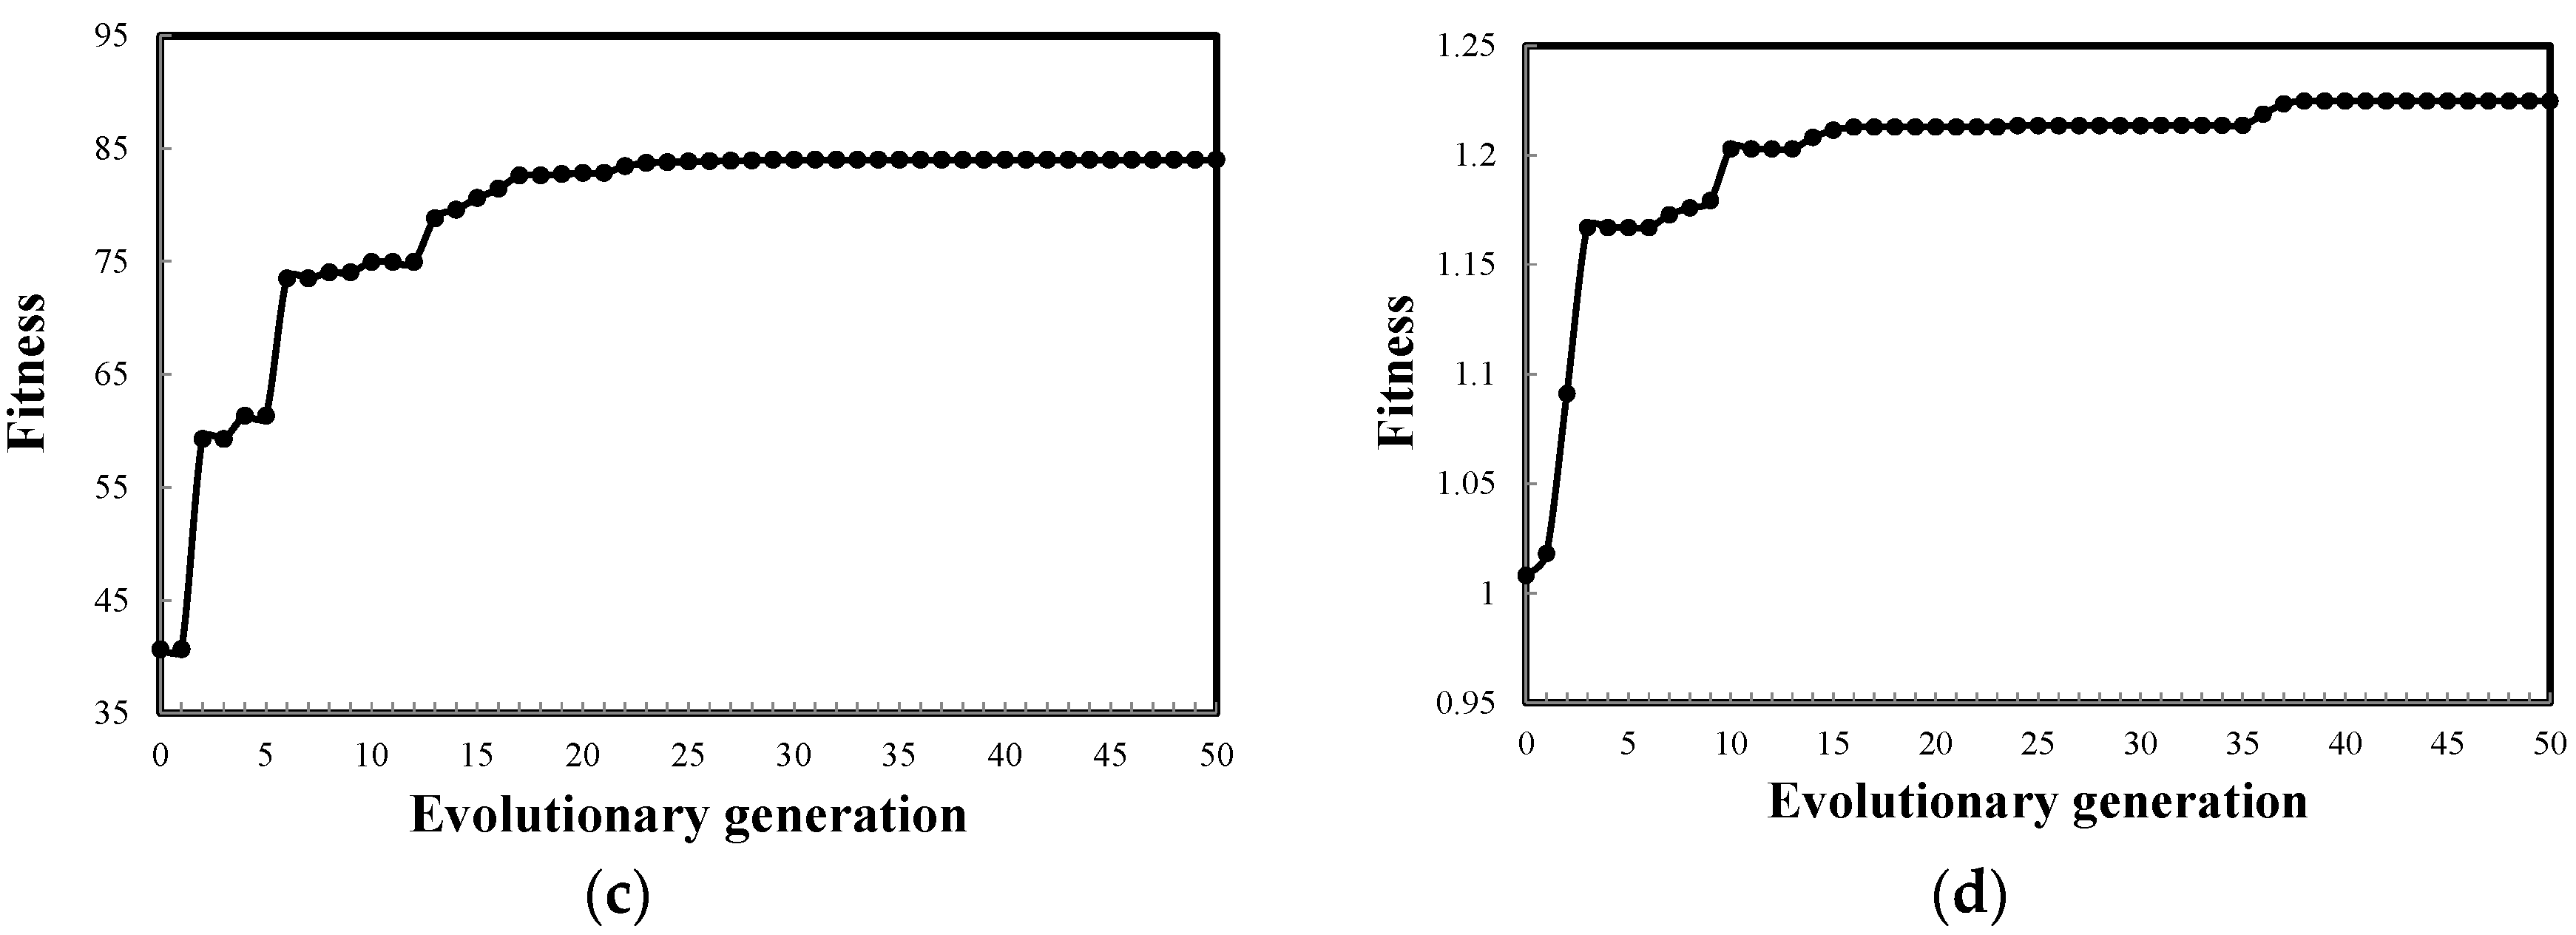
A genetic algorithm with an elitist preservation strategy (as shown in Figure 2) is employed to optimize the six design variables of the PQE. Real coding is adopted, and the values of the six design variables of the PQE are determined as the genes of the individual. Thus, every individual can represent a kind of PQE design. To make sure that the PQE obtained finally has satisfied dynamic characteristics, a constraint condition is given to the PQE. Namely, the static gain between the output of the PQE and the manipulated variable must be greater than a pre-set lower limit. If an individual represents a PQE that does not satisfy this constraint condition, it is illegal and should be abandoned during the optimization process. The reciprocal of the AAVM of the output of the PQE is selected as a fitness function to increase the estimation accuracy of the PQE to the greatest degree. In addition, the genetic algorithm employed here differs from the conventional genetic algorithm in that it involves only three steps of selection, crossover, and mutation. An additional elitist preservation strategy is used to improve global searching ability and efficiency. The elitist is defined as the individual that has the biggest fitness in the population, and the fitness of the elitist of the Nth-generation population can be marked FitN. After the Nth-evolution round, if the fitness of the elitist of the current generation population (FitN) is smaller than that of the last generation population (FitN−1), the bottom 10% of individuals according to the fitness of the current generation population should be replaced by the elitist of the last generation population.
3. Example I: Operation of an EPB Petlyuk DWDC
3.1. Process Design of the EPB Petlyuk DWDC
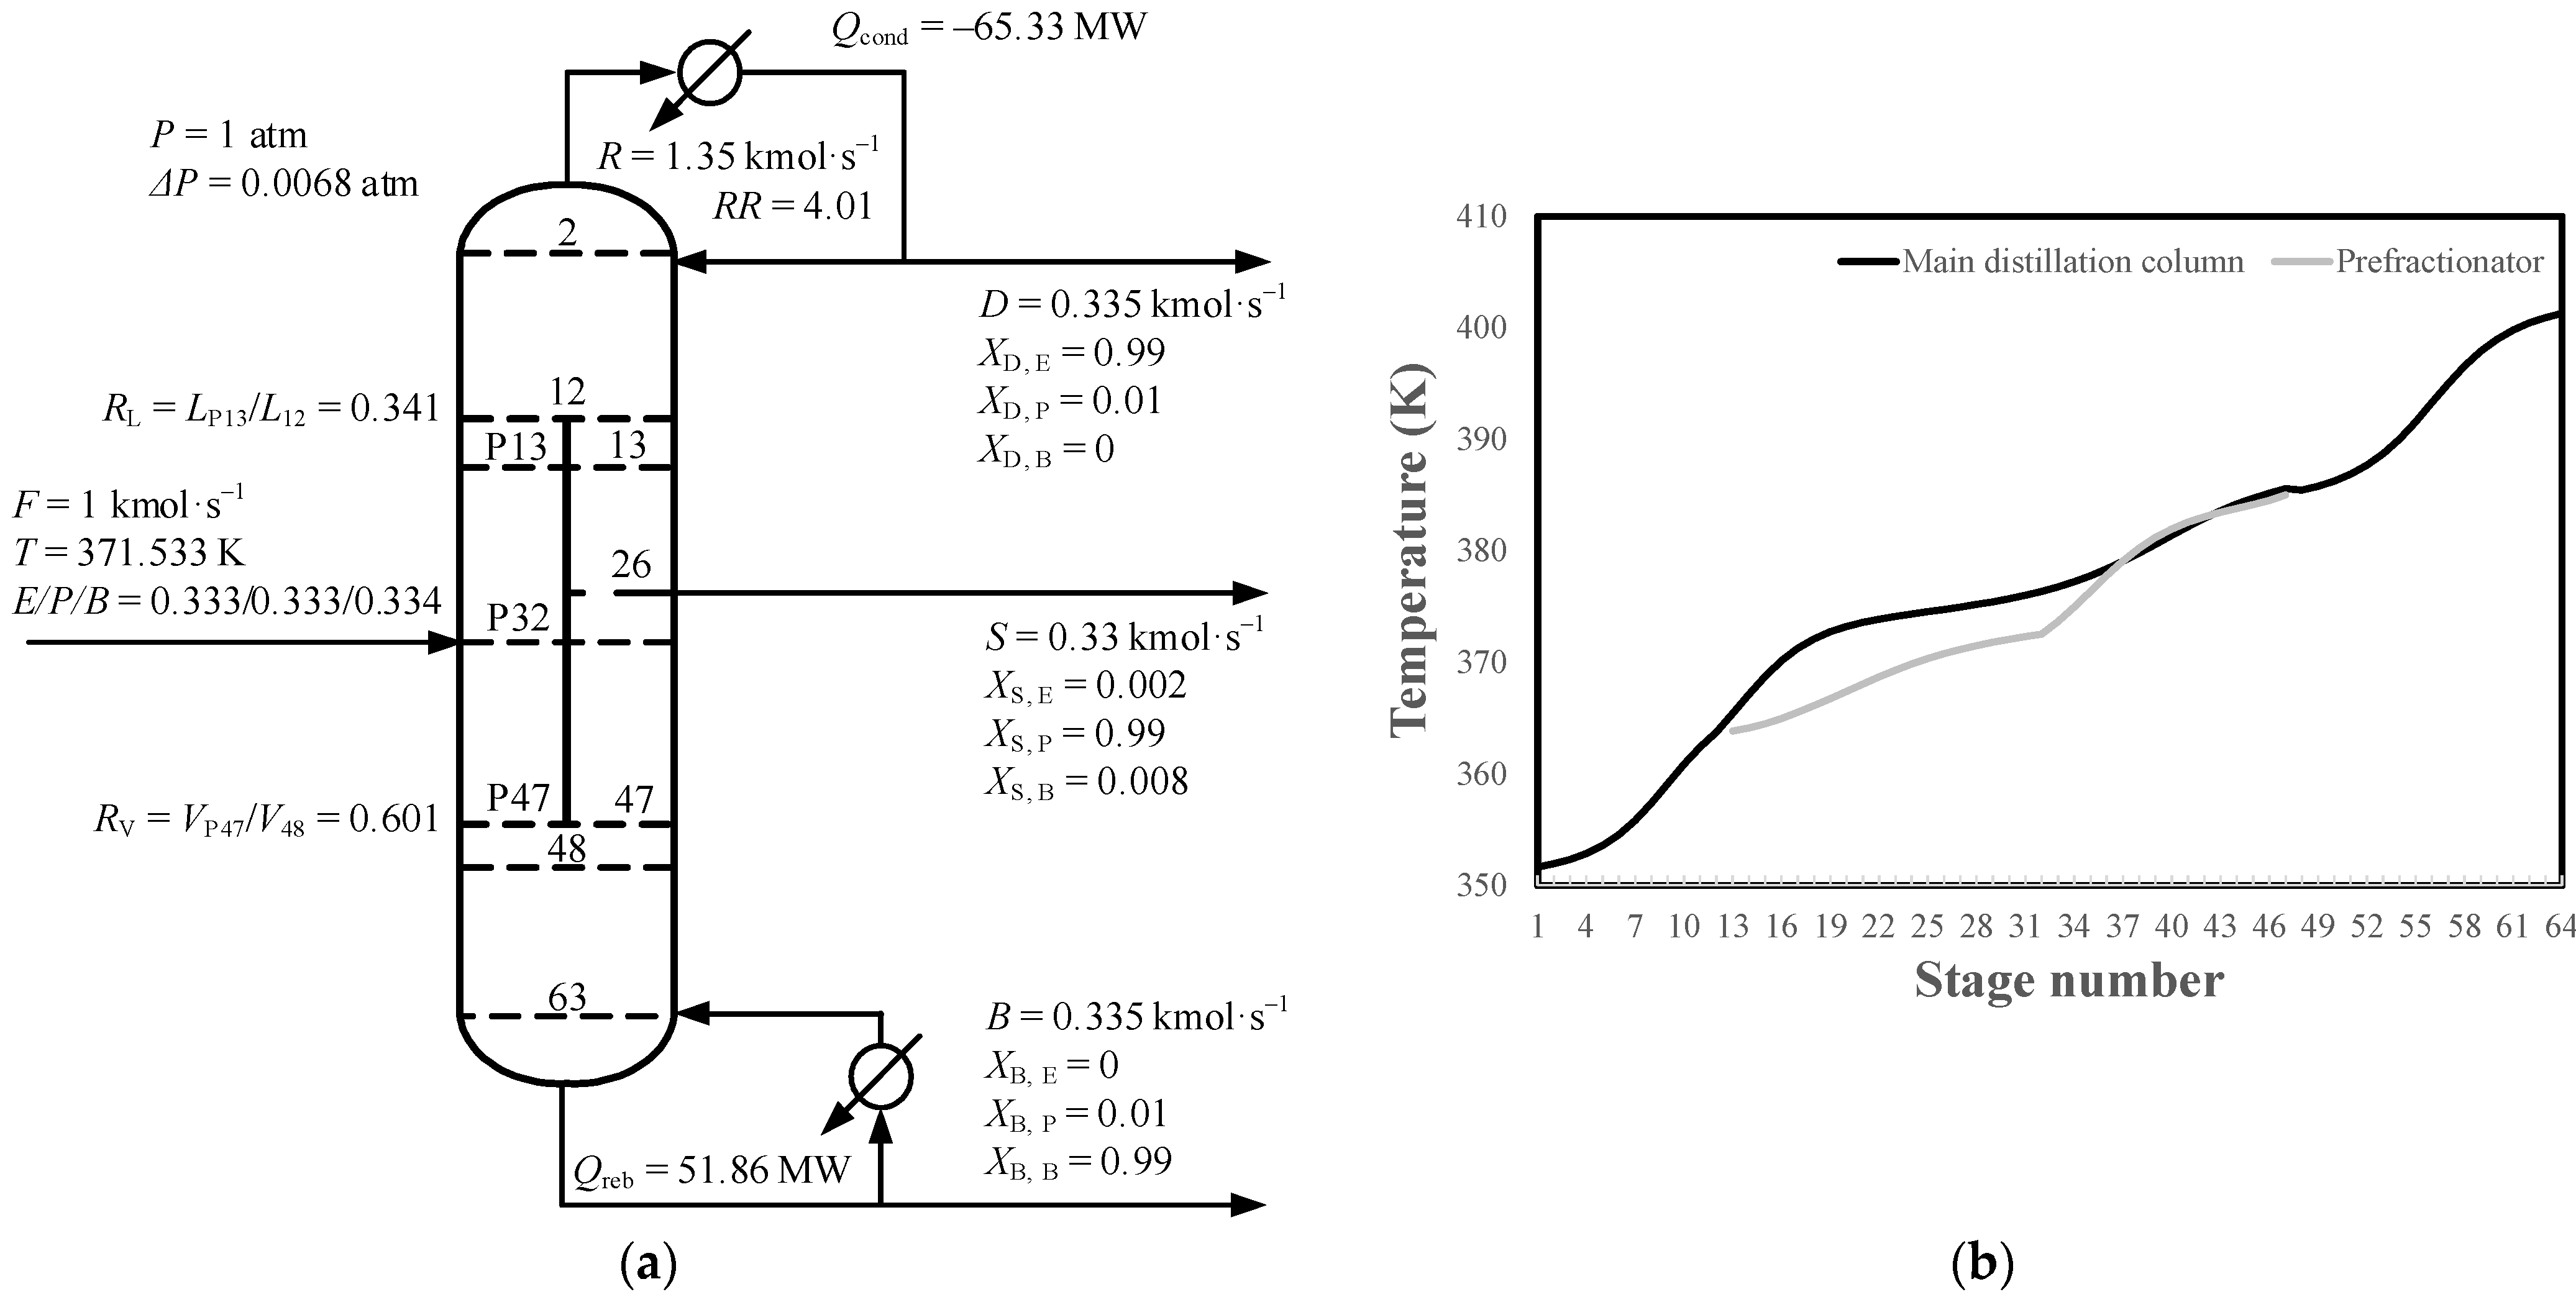
Figure 3a,b display, respectively, the steady-state design of the EPB Petlyuk DWDC and its temperature profile. The mole ratio between the feed components of E, P, and B is 1:1:1. The specifications for the top, sidestream, and bottom products are all 99 mol%. Throughout the work, Aspen Plus and Aspen Dynamics are respectively employed to build steady-state and dynamic models, and the characteristics of the feed are described with the UNIFAC thermodynamic model. Because there is not an available Petlyuk or Kaibel DWDC module in Aspen Plus, we have to use a combination of four Redfrac modules to simulate them. Stage efficiency is set to the default value of Aspen Plus, i.e., 100%. The diameters of the stages are determined by the “Tray Sizing” function of Aspen Plus, and the sizes of the reflux drum and the column bases are calculated to allow for 5 min of liquid holdup when the vessel is 50% full.
3.2. Derivation of the DTDC Scheme
For the DTDC scheme, four double temperature difference control loops with distillation flow rate D, sidestream flow rate S, reboiler heat duty Qreb, and liquid split ratio RL as manipulated variables are employed to maintain the purities of the top, sidestream, bottom, and prefractionator’s top products (liquid composition of component B in the top of the prefractionator), respectively. Figure 4 gives the results of sensitivity analysis and AAVM analysis for the four double temperature difference control loops. With reference to these results, the locations of the sensitive and reference stages of each double temperature difference control loop can be determined, and the resultant DTDC scheme is shown in Figure 5a. As for the detailed method of how to derive the DTDC scheme in terms of the results of sensitivity analysis and AAVM analysis, it can be found in our previous article about the effective derivation of the DTDC scheme [19].
3.3. Derivation of the TC-PQE Scheme
For the sake of fairness, the number of control loops used in the TC-PQE scheme should be the same as that in the DTDC scheme. Therefore, four control loops with D, S, Qreb, and RL as manipulated variables are employed in the TC-PQE scheme, and four specially designed PQE are used in these four control loops to infer the qualities of the top, sidestream, bottom, and prefractionator’s top products, respectively. The design variables of the four PQE are optimized according to the genetic algorithm introduced in Section 2. Here, population size is equal to 2000; evolution generation is equal to 50; crossover and mutation probabilities are respectively equal to between 0.7 and 0.3. For the optimization of the PQE employed in the top, sidestream, bottom, and prefractionator control loops, the locations of the inputted stage temperatures are respectively allowed to be selected from the public rectifying section, the right section of the dividing wall, the public stripping section, and the prefractionator, and the lower limits of the static gains are respectively equal to 1.7027, 1.283, 0.521, and 0.4235 (here, for each control loop, the lower limit is set to be two times the static gain between the sensitive stage temperature and the manipulated variable). Figure 6 displays the optimization processes of the PQE employed in the four control loops using a genetic algorithm. According to the optimization results, four optimal PQE can be obtained, and their detailed parameters are listed in Table 1. Figure 5b displays the resultant TC-PQE scheme.
3.4. Comparison between the DTDC and TC-PQE Schemes
Table 2 tabulates the AAVM of the controlled variable and the static gain between the controlled variable and manipulated variable for each control loop of the DTDC and TC-PQE schemes. It can be clearly found that the control loop of the TC-PQE scheme shows smaller AAVM and bigger static gain than the control loop of the DTDC scheme that maintains the same product purity. This implies that the control loops of the TC-PQE scheme can give not only more accurate estimations of the controlled product purities but also more sensitive responses to the manipulated variables as compared with those of the DTDC scheme.
For the DTDC and TC-PQE schemes, all temperature measurements are assumed to have a one-minute deadtime, and PI controllers are used in all temperature inferential control loops. The Tyreus-Luyben tuning rule embedded in Aspen Dynamics is used to tune these PI controllers [21,22]. The bottom control loop is tuned first because it affects all other control loops. Then, with the bottom control loop on automatic, the top control loop is tuned. Next, with the bottom and top control loop on automatic, the sidestream control loop is tuned. Finally, with the bottom, top, and sidestream control loops on automatic, the prefractionator control loop is tuned. Three rounds of tuning are carried out at least to ensure the quality of the parameters obtained. The resultant controller parameters for the DTDC and TC-PQE schemes are listed in Table 3. Figure 7 shows the variations of the product purities as the EPB Petlyuk DWDC controlled under the DTDC and TC-PQE schemes for ±20% variations in feed compositions. It can be seen that, as compared with the DTDC scheme, the TC-PQE scheme has smaller overshoots in the controlled product purities for all six kinds of feed composition disturbances and shorter setting times for the feed composition disturbances in components P and B. Table 4 tabulates the steady-state deviations in the controlled product purities from the initial 99 mol% product specifications. In most scenarios, the TC-PQE scheme shows smaller steady-state deviations than the DTDC scheme. As for the maximum deviation of the controlled product purities (highlighted using bold type and underlining in Table 4), the TC-PQE scheme is also smaller than the DTDC scheme.
Furthermore, robustness tests are carried out on the DTDC and TC-PQE schemes to make a deeper performance assessment of the proposed PQE. The magnitude of the concerned feed composition disturbance is gradually increased with a step of 2% until the control system fails. In the current article, the following situations will be identified as control system failures: (1). The controlled product purities do not converge; (2). The steady-state deviations in the controlled product purities are greater than 0.5 mol%; (3). Any controller fails. Table 5 tabulates the maximum feed composition disturbances handled by the DTDC and TC-PQE schemes for the EPB Petlyuk DWDC. It can be easily found that the TC-PQE scheme has better robustness as compared to the DTDC scheme since the dynamic characteristic of the PQE is well guaranteed during the optimization process.
4. Example II: Operation of a MEPB Kaibel DWDC
4.1. Process Design of the MEPB Kaibel DWDC
Figure 8a,b give, respectively, the steady-state design of the MEPB Kaibel DWDC and its temperature profile. The mole ratio between feed components M, E, P, and B is 1:1:1:1. The specifications for the top, upper sidestream, lower sidestream, and bottom products are all 99 mol%.
4.2. Derivation of the DTDC Scheme
For the DTDC scheme, four double temperature difference control loops with D, upper sidestream flow rate S1, lower sidestream flow rate S2, and RL as manipulated variables are employed to maintain the purities of the top, upper sidestream, lower sidestream, and prefractionator’s top products (liquid composition of component P in the top of the prefractionator), respectively. Figure 9 gives the results of sensitivity analysis and AAVM analysis for the four double temperature difference control loops. According to these results, the locations of the sensitive and reference stages of the four double temperature difference control loops can be determined, and the resultant DTDC scheme is shown in Figure 10a.
4.3. Derivation of the TC-PQE Scheme
The TC-PQE scheme includes four control loops. Four specially designed PQE are respectively employed in the four control loops to infer the purities of the top, upper sidestream, lower sidestream, and prefractionator’s top products. The settings of population size, evolution generation, crossover probability, and mutation probability are the same as those in Example I. For the optimization of the PQE employed in the top, upper sidestream, lower sidestream, and prefractionator control loops, the locations of the inputted stage temperatures are respectively allowed to be selected from the public rectifying section, the section from stage 21 to stage 40, the section from stage 41 to stage 69, and the prefractionator, and the lower limits of the static gains are respectively equal to 1.843, 9.505, 2.302, and 7.835. Figure 11 displays the optimization processes of the PQE designed for the four control loops using a genetic algorithm. According to the optimization results, four optimal PQE can be obtained, and their detailed parameters are listed in Table 1. Figure 10b displays the resultant TC-PQE scheme.
4.4. Comparison between the DTDC and TC-PQE Schemes
As shown in Table 2, the AAVM of the controlled variable and the static gain between the controlled variable and manipulated variable for each control loop of the DTDC and TC-PQE schemes are given. It is similar to the comparison results obtained in Example I in that the control loop of the TC-PQE scheme shows smaller AAVM and bigger static gain than the control loop of the DTDC scheme that maintains the same product purity.
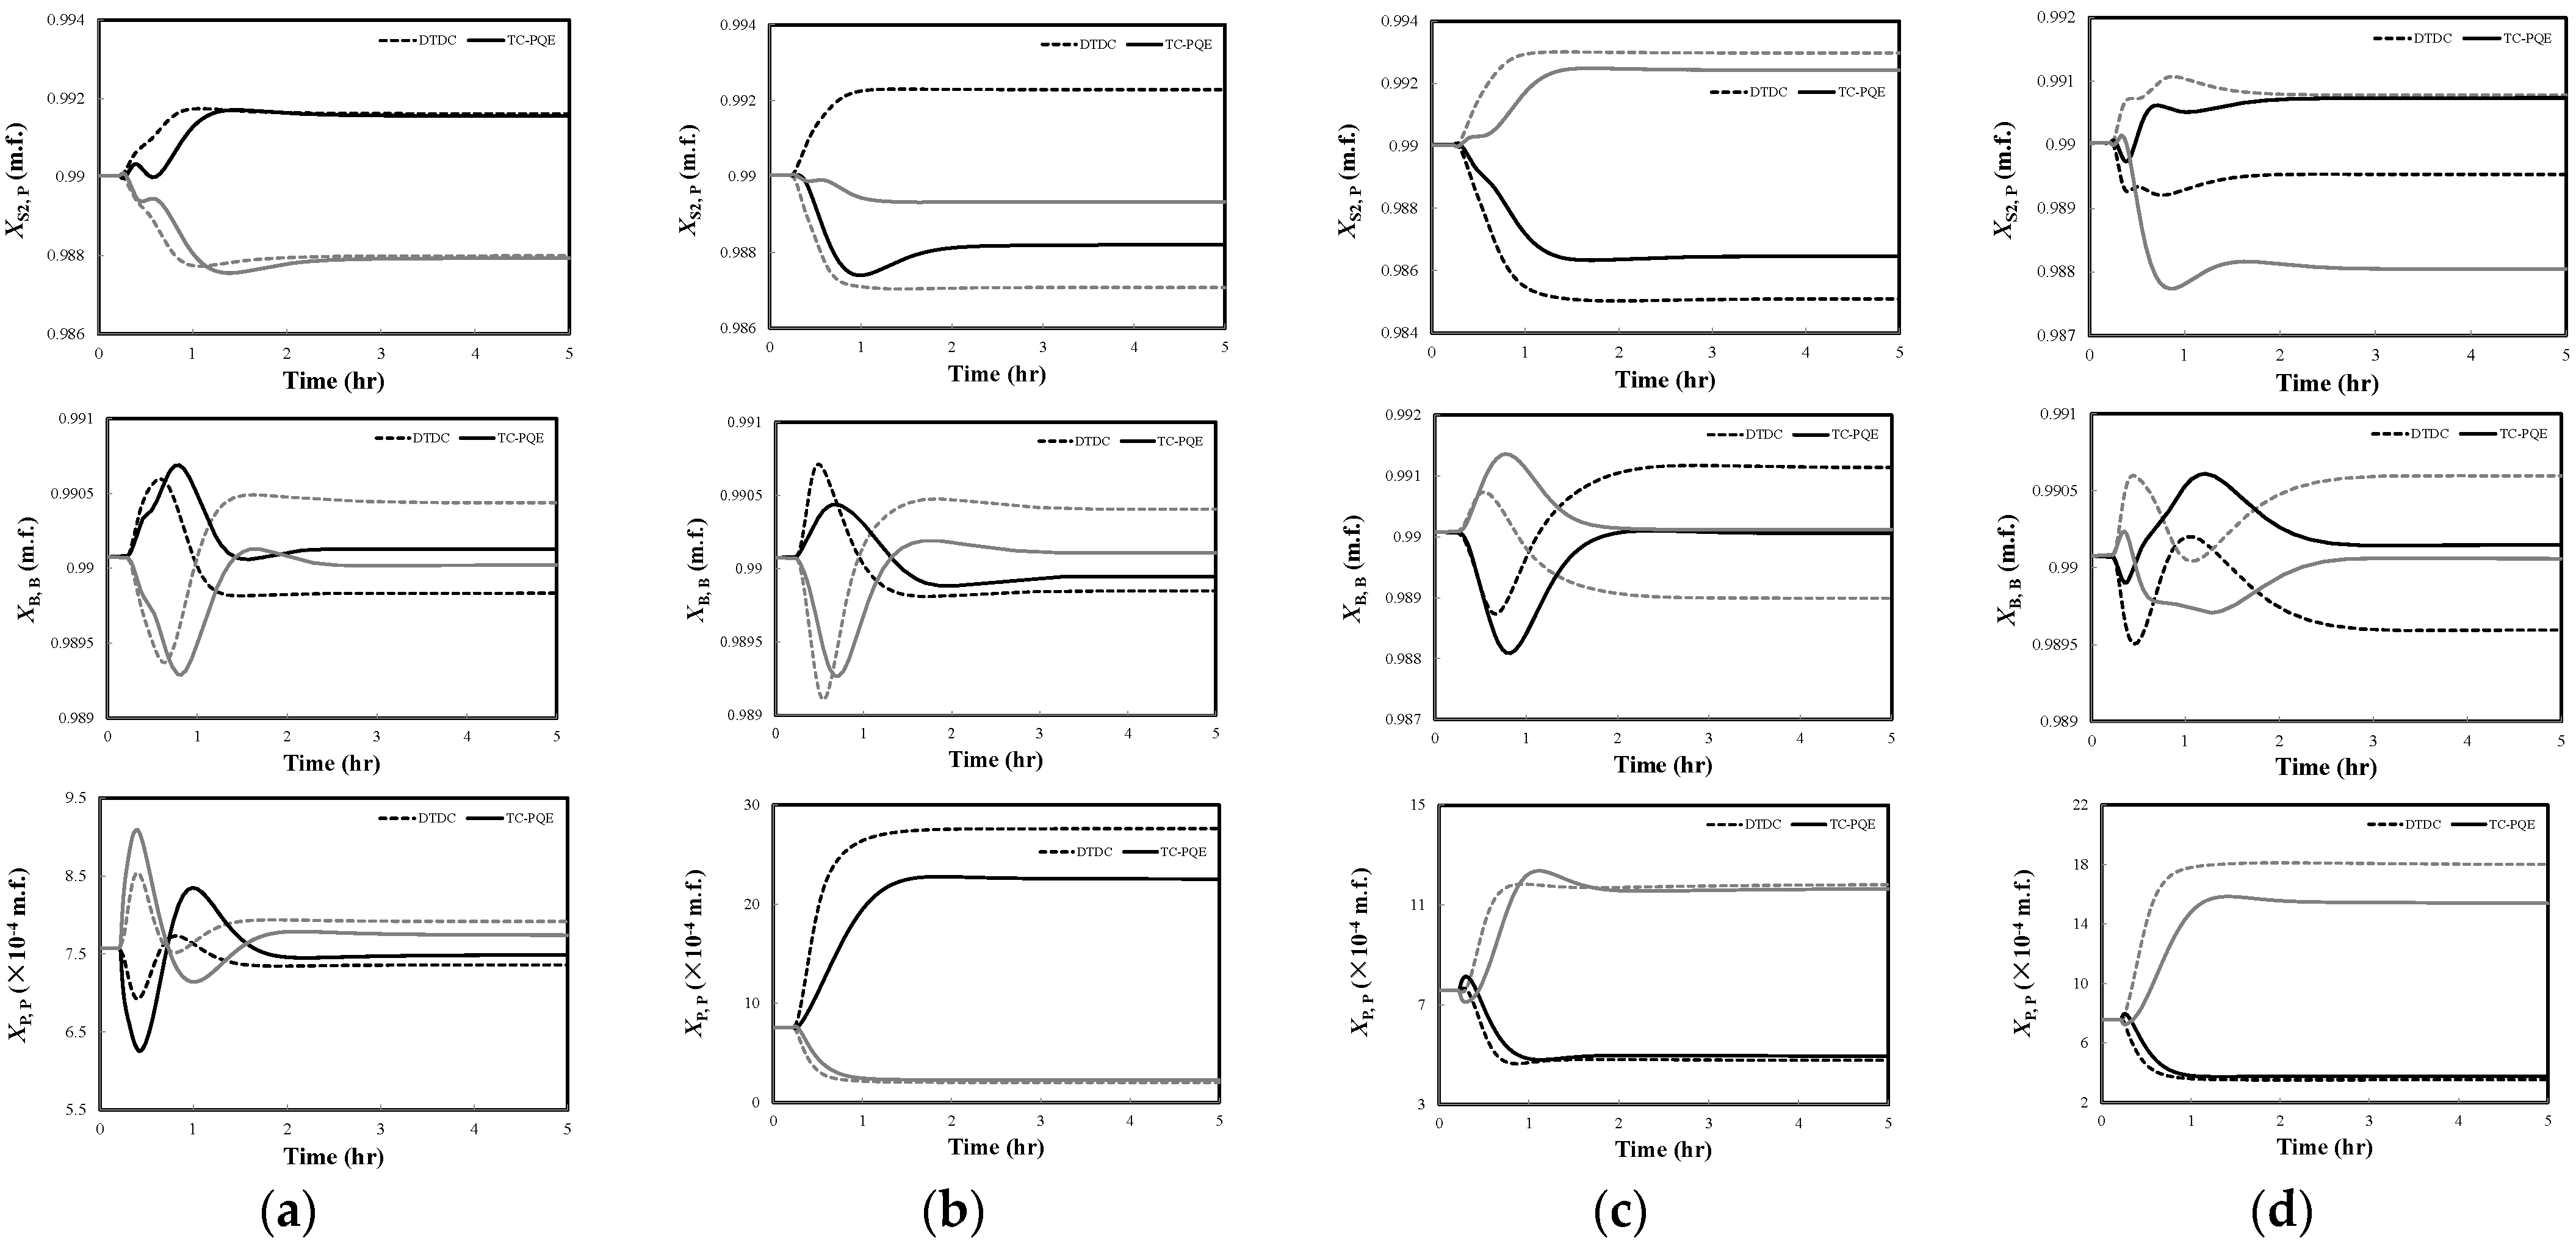
The four control loops of the TC-PQE and DTDC schemes are tuned in the following order: the top control loop, the upper sidestream control loop, the lower sidestream control loop, and the prefractionator control loop. The controller parameters for the DTDC and TC-PQE schemes are tabulated in Table 3. Figure 12 shows the variations of the product purities as the MEPB Kaibel DWDC controlled under the DTDC and TC-PQE schemes for ±20% variations in feed compositions. For the top, upper sidestream, and lower sidestream products, the dynamic performance of the TC-PQE scheme is obviously better than that of the DTDC scheme, with smaller overshoots and shorter settling times. For the bottom and prefractionator’s products, the dynamic performance of the TC-PQE scheme is comparable with that of the DTDC scheme. Table 6 tabulates the steady-state deviations in the controlled product purities from the initial 99 mol% product specifications. As compared with the DTDC scheme, the TC-PQE scheme not only shows smaller steady-state deviations in most scenarios but also has a smaller maximum deviation. Table 5 tabulates the maximum feed composition disturbances handled by the DTDC and TC-PQE schemes for the MEPB Kaibel DWDC. It is the same as the results obtained in Example I that the TC-PQE scheme has better robustness as compared with the DTDC scheme.
5. Discussion
Based on the two DWDC systems studied, the TC-PQE scheme has been demonstrated to be superior to the DTDC scheme. Although they employ the same number of temperature measurements, the former can lead to not only greatly reduced steady-state deviations in the controlled product purities but also substantially improved dynamic responses and robustness capability. The superiority of the TC-PQE schemes can undoubtedly stem from the fact that the PQE employed in its control loops not only provides very accurate estimations of the product purities to be maintained but also has sensitive responses to the manipulated variables. Admittedly, more calculating efforts are needed to optimize the PQE than to derive the double temperature difference. However, because the performance of the temperature inferential control system can be significantly improved by only paying more computation efforts without increasing additional investment costs, the proposed PQE still has a high performance-price ratio.
In addition, due to the fact that the structure of the PQE is general and the principle of optimizing the PQE is simple, the possible application of the proposed PQE is obviously not only limited to the operation of the Petlyuk and Kaibel DWDCs studied in the current work, but also to the operation of the other types of distillation columns, such as the conventional binary distillation column, the reactive distillation column, and the extractive distillation column et al. Namely, the proposed PQE can be a general tool for the control of various distillation columns. All of the above-mentioned advantages lead to the proposed PQE to be a useful tool in the field of process control.
6. Conclusion
In the current article, a kind of simple but effective PQE is proposed to estimate the controlled product purities for the control of the DWDC. It takes three stage temperatures (TI1, TI2, and TI3) as inputs and uses a linear sum of these three inputted stage temperatures (α × TI1 + β × TI2 + γ × TI3) as output. By means of a genetic algorithm using an elitist preservation strategy, the locations of the three inputted stage temperatures and the values of α, β, and γ are carefully determined so that the resultant PQE can have not only high estimation accuracy to the maintained product purity but also satisfy dynamic characteristics. With reference to two DWDCs, i.e., one EPB Petlyuk DWDC and one MEPB Kaibel DWDC, the effectiveness of the proposed PQE is assessed by comparing the performance of the TC-PQE and DTDC scheme. According to the dynamic simulation results obtained, the former is better than the latter because of not only the improved dynamic performances but also the greatly reduced steady-state deviations in the controlled product purities. This fully demonstrates the effectiveness of the proposed PQE.
Author Contributions
Conceptualization, Y.Y.; Funding acquisition, K.H., H.C. and X.Q.; Investigation, Y.Y.; Project administration, K.H., H.C. and X.Q.; Visualization, X.T.; Writing—original draft, Y.Y.; Writing—review and editing, X.T., H.C. and X.Q. All authors have read and agreed to the published version of the manuscript.
Funding
This research was funded by National Natural Science Foundation of China, grant number 21878011 and 21808007.
Conflicts of Interest
The authors declare no conflict of interest.
References
- Gao, Z.; Nguang, S.; Kong, D. Advances in modeling, monitoring, and control for complex industrial systems. Complexity 2019, 2019, 2975083. [Google Scholar]
- Gao, Z.; Chen, M.Z.Q.; Zhang, D. Special issue on “Advances in condition monitoring, optimization and control for complex industrial processes”. Processes 2021, 9, 664. [Google Scholar] [CrossRef]
- Dejanović, I.; Matijašević, L.; Olujić, Ž. Dividing wall column—A breakthrough towards sustainable distilling. Chem. Eng. Process. 2010, 49, 559–580. [Google Scholar] [CrossRef]
- Dejanović, I.; Matijašević, L.; Halvorsen, I.J.; Skogestad, S.; Jansen, H.; Kaibel, B.; Olujić, Ž. Designing four-product dividing wall columns for separation of a multicomponent aromatics mixture. Chem. Eng. Res. Des. 2011, 89, 1155–1167. [Google Scholar] [CrossRef]
- Qian, X.; Jia, S.; Huang, K.; Chen, H.; Yuan, Y.; Zhang, L. Optimal design of kaibel dividing wall columns based on improved particle swarm optimization methods. J. Clean. Prod. 2020, 273, 123041. [Google Scholar] [CrossRef]
- Kiss, A.A.; Bildea, C.S. A control perspective on process intensification in dividing-wall columns. Chem. Eng. Process. 2011, 50, 281–292. [Google Scholar] [CrossRef]
- Dwivedi, D.; Halvorsen, I.J.; Skogestad, S. Control structure selection for three-product petlyuk (dividing-wall) column. Chem. Eng. Process. 2013, 64, 57–67. [Google Scholar] [CrossRef]
- Dwivedi, D.; Halvorsen, I.J.; Skogestad, S. Control structure selection for four-product petlyuk column. Chem. Eng. Process. 2013, 67, 49–59. [Google Scholar] [CrossRef]
- Kiss, A.A.; Rewagad, R.R. Energy efficient control of a BTX dividing-wall column. Comput. Chem. Eng. 2011, 35, 2896–2904. [Google Scholar] [CrossRef]
- Yuan, Y.; Huang, K.; Chen, H.; Qian, X.; Zang, L.; Zhang, L.; Wang, S. Comparing composition control structures for Kaibel distillation columns. Processes 2020, 8, 218. [Google Scholar] [CrossRef] [Green Version]
- Wang, S.J.; Wong, D.S.H. Controllability and energy efficiency of a high-purity divided wall column. Chem. Eng. Sci. 2007, 62, 1010–1025. [Google Scholar] [CrossRef]
- Jia, S.; Qian, X.; Yuan, X.; Skogestad, S. Control structure comparison for three-product petlyuk column. Chin. J. Chem. Eng. 2018, 26, 1621–1630. [Google Scholar] [CrossRef]
- Kim, K.; Lee, M.; Park, S. Two-point temperature control structure selection for dividing-wall distillation columns. Ind. Eng. Chem. Res. 2012, 51, 15683–15695. [Google Scholar] [CrossRef]
- Fan, G.; Jiang, W.; Qian, X. Comparison of stabilizing control structures for four-product kaibel column. Chem. Eng. Res. Des. 2016, 109, 675–685. [Google Scholar] [CrossRef]
- Villegas-Uribe, C.A.; Alcάntara-Avila, J.R.; Medina-Herrera, N.; Gόmez-Gonzάlez, R.; Tututi-Avila, S. Temperature control of a kaibel, agrawal and sargent dividing-wall distillation columns. Chem. Eng. Process. 2021, 159, 108248. [Google Scholar] [CrossRef]
- Qian, X.; Liu, R.; Huang, K.; Chen, H.; Yuan, Y.; Zhang, L.; Wang, S. Comparison of temperature control and temperature difference control for a Kaibel dividing wall column. Processes 2019, 7, 773. [Google Scholar] [CrossRef] [Green Version]
- Ling, H.; Luyben, W.L. Temperature control of the BTX divided-wall column. Ind. Eng. Chem. Res. 2010, 49, 189–203. [Google Scholar] [CrossRef]
- Wu, N.; Huang, K.; Luan, S. Operation of dividing-wall distillation columns. 2. A double temperature difference control scheme. Ind. Eng. Chem. Res. 2013, 52, 5365–5383. [Google Scholar] [CrossRef]
- Yuan, Y.; Huang, K.; Chen, H.; Zhang, L.; Wang, S. Configuring effectively double temperature difference control schemes for distillation columns. Ind. Eng. Chem. Res. 2017, 56, 9143–9155. [Google Scholar] [CrossRef]
- Pan, H.; Wu, X.; Qiu, J.; He, G.; Ling, H. Pressure compensated temperature control of kaibel divided-wall column. Chem. Eng. Sci. 2019, 203, 321–332. [Google Scholar] [CrossRef]
- Luyben, W.L. Distillation Design and Control Using Aspen Simulation; John Wiley & Sons: New York, NY, USA, 2006. [Google Scholar]
- Gao, R.; Gao, Z. Pitch control for wind turbine systems using optimization, estimation and compensation. Renew. Energy 2016, 91, 501–515. [Google Scholar] [CrossRef]
Figure 1.
Schematic of the PQE proposed for controlling the DWDC.

Figure 2.
Overview of the genetic algorithm with elitist preservation strategy.

Figure 3.
Example of the EPB Petlyuk DWDC: (a) steady-state design; (b) temperature profile.

Figure 4.
Results of the sensitivity analysis and AAVM analysis (Example I): (a) top control loop; (b) sidestream control loop; (c) bottom control loop; (d) prefractionator control loop. (Red pentagram: sensitive stage; green triangle: reference stage).
Figure 4.
Results of the sensitivity analysis and AAVM analysis (Example I): (a) top control loop; (b) sidestream control loop; (c) bottom control loop; (d) prefractionator control loop. (Red pentagram: sensitive stage; green triangle: reference stage).

Figure 5.
Two temperature inferential control schemes studied (Example I): (a) DTDC scheme; (b) TC-PQE scheme.
Figure 5.
Two temperature inferential control schemes studied (Example I): (a) DTDC scheme; (b) TC-PQE scheme.

Figure 6.
Optimization of the PQE employed in the four control loops of the TC-PQE scheme (Example I): (a) top control loop; (b) sidestream control loop; (c) bottom control loop; (d) prefractionator control loop.
Figure 6.
Optimization of the PQE employed in the four control loops of the TC-PQE scheme (Example I): (a) top control loop; (b) sidestream control loop; (c) bottom control loop; (d) prefractionator control loop.

Figure 7.
Variations of the product purities as maintained with the DTDC and TC-PQE schemes for ±20% variations in feed compositions (Example I): (a) E; (b) P; (c) B. (Black line: positive disturbance; grey line: negative disturbance).
Figure 7.
Variations of the product purities as maintained with the DTDC and TC-PQE schemes for ±20% variations in feed compositions (Example I): (a) E; (b) P; (c) B. (Black line: positive disturbance; grey line: negative disturbance).

Figure 8.
Example of the MEPB Kaibel DWDC: (a) steady-state design; (b) temperature profile.

Figure 9.
Results of the sensitivity analysis and AAVM analysis (Example II): (a) top control loop; (b) sidestream control loop; (c) bottom control loop; (d) prefractionator control loop. (Red pentagram: sensitive stage; green triangle: reference stage).
Figure 9.
Results of the sensitivity analysis and AAVM analysis (Example II): (a) top control loop; (b) sidestream control loop; (c) bottom control loop; (d) prefractionator control loop. (Red pentagram: sensitive stage; green triangle: reference stage).

Figure 10.
Two temperature inferential control schemes studied (Example II): (a) DTDC scheme; (b) TC-PQE scheme.
Figure 10.
Two temperature inferential control schemes studied (Example II): (a) DTDC scheme; (b) TC-PQE scheme.

Figure 11.
Optimization of the PQE employed in the four control loops of the TC-PQE scheme (Example II): (a) top control loop; (b) upper sidestream control loop; (c) lower sidestream control loop; (d) prefractionator control loop.
Figure 11.
Optimization of the PQE employed in the four control loops of the TC-PQE scheme (Example II): (a) top control loop; (b) upper sidestream control loop; (c) lower sidestream control loop; (d) prefractionator control loop.


Figure 12.
Variations of the product purities as maintained with the DTDC and TC-PQE schemes for ±20% variations in feed compositions (Example II): (a) M; (b) E; (c) P; (d) B. (Black line: positive disturbance; grey line: negative disturbance).
Figure 12.
Variations of the product purities as maintained with the DTDC and TC-PQE schemes for ±20% variations in feed compositions (Example II): (a) M; (b) E; (c) P; (d) B. (Black line: positive disturbance; grey line: negative disturbance).


Table 1.
Optimization results of the PQE employed in the four control loops of the TC-PQE Scheme (Examples I and II).
Table 1.
Optimization results of the PQE employed in the four control loops of the TC-PQE Scheme (Examples I and II).
| System | Control Loop | TI1 | TI2 | TI3 | α | β | γ |
|---|---|---|---|---|---|---|---|
| Example I | Top | T2 | T8 | T12 | 2.5436 | −3.5962 | 1.7618 |
| Sidestream | T14 | T24 | T34 | 2.1465 | 4.1458 | −3.7670 | |
| Bottom | T53 | T58 | T63 | −1.3321 | 3.5541 | −1.5087 | |
| Prefractionator | TP14 | TP21 | TP26 | −1.5082 | 3.5383 | −1.9755 | |
| Example II | Top | T8 | T13 | T18 | −2.9537 | −1.2432 | 2.2666 |
| Upper sidestream | T21 | T22 | T40 | −4.9737 | −4.9668 | 2.0480 | |
| Lower sidestream | T49 | T61 | T64 | −0.6192 | −2.2745 | 3.2625 | |
| Prefractionator | TP33 | TP40 | TP45 | −4.0334 | 3.7216 | −2.9252 |
Table 2.
AAVM and static gains for the four control loops of the DTDC and TC-PQE schemes (Examples I and II).
Table 2.
AAVM and static gains for the four control loops of the DTDC and TC-PQE schemes (Examples I and II).
| System | Scheme | Control Loop | AAVM | Static Gain |
|---|---|---|---|---|
| Example I | TC-PQE | Top | 0.0264 | 1.7027 |
| Sidestream | 0.1600 | 1.2830 | ||
| Bottom | 0.0262 | 0.5210 | ||
| Prefractionator | 0.0142 | 0.4235 | ||
| DTDC | Top | 0.0412 | 1.0155 | |
| Sidestream | 0.2633 | 0.9806 | ||
| Bottom | 0.0387 | 0.2620 | ||
| Prefractionator | 0.0757 | 0.2832 | ||
| Example II | TC-PQE | Top | 0.0014 | 1.8430 |
| Upper sidestream | 0.3435 | 9.5064 | ||
| Lower sidestream | 0.0119 | 2.3020 | ||
| Prefractionator | 0.8165 | 7.8350 | ||
| DTDC | Top | 0.0218 | 0.6165 | |
| Upper sidestream | 0.7426 | 8.7710 | ||
| Lower sidestream | 0.0529 | 0.7140 | ||
| Prefractionator | 1.5454 | 7.4735 |
Table 3.
Controller parameters of the DTDC and TC-PQE schemes (Examples I and II).
| System | Scheme | Controller | KC | TI (min) |
|---|---|---|---|---|
| Example I | TC-PQE | TC1 | 5.30 | 38.28 |
| TC2 | 14.88 | 27.72 | ||
| TC3 | 2.78 | 9.24 | ||
| TC4 | 1.28 | 18.48 | ||
| DTDC | TC1 | 0.91 | 36.96 | |
| TC2 | 0.75 | 23.76 | ||
| TC3 | 0.36 | 10.56 | ||
| TC4 | 0.31 | 30.36 | ||
| Example II | TC-PQE | TC1 | 3.27 | 15.84 |
| TC2 | 31.31 | 13.20 | ||
| TC3 | 8.35 | 25.08 | ||
| TC4 | 7.92 | 22.44 | ||
| DTDC | TC1 | 0.27 | 15.84 | |
| TC2 | 0.30 | 13.20 | ||
| TC3 | 2.45 | 30.36 | ||
| TC4 | 0.34 | 18.48 |
Table 4.
Steady-state deviations for ±20% variations in feed compositions of E, P, and B (Example I).
Table 4.
Steady-state deviations for ±20% variations in feed compositions of E, P, and B (Example I).
| Scenario | Product Purity | Steady-State Deviation (mol%) | |
|---|---|---|---|
| TC-PQE | DTDC | ||
| +20% ZE | XD, E | 2.32 × 10⁻⁴ | 8.76 × 10⁻⁴ |
| XS, P | −2.26 × 10⁻⁴ | −10.89 × 10⁻⁴ | |
| XB, B | 0.44 × 10⁻⁴ | 0.57 × 10⁻⁴ | |
| XP, B | 0.14 × 10⁻⁴ | −13.32 × 10⁻⁴ | |
| −20% ZE | XD, E | 3.08 × 10⁻⁴ | −2.54 × 10⁻⁴ |
| XS, P | −3.35 × 10⁻⁴ | −3.51 × 10⁻⁴ | |
| XB, B | 0.03 × 10⁻⁴ | −1.05 × 10⁻⁴ | |
| XP, B | −0.39 × 10⁻⁴ | 12.35 × 10⁻⁴ | |
| +20% ZP | XD, E | 1.80 × 10⁻⁴ | −2.29 × 10⁻⁴ |
| XS, P | −4.75 × 10⁻⁴ | −7.46 × 10⁻⁴ | |
| XB, B | 0.45 × 10⁻⁴ | 3.24 × 10⁻⁴ | |
| XP, B | −3.29 × 10⁻⁴ | 10.80 × 10⁻⁴ | |
| −20% ZP | XD, E | 0.99 × 10⁻⁴ | 9.35 × 10⁻⁴ |
| XS, P | −7.56 × 10⁻⁴ | −6.85 × 10⁻⁴ | |
| XB, B | 2.10 × 10⁻⁴ | −1.36 × 10⁻⁴ | |
| XP, B | −3.36 × 10⁻⁴ | −18.21 × 10⁻⁴ | |
| +20% ZB | XD, E | 0.41 × 10⁻⁴ | 0.91 × 10⁻⁴ |
| XS, P | 3.72 × 10⁻⁴ | 7.88 × 10⁻⁴ | |
| XB, B | 3.50 × 10⁻⁴ | 1.41 × 10⁻⁴ | |
| XP, B | −4.08 × 10⁻⁴ | −6.87 × 10⁻⁴ | |
| −20% ZB | XD, E | 0.29 × 10⁻⁴ | 1.27 × 10⁻⁴ |
| XS, P | 3.02 × 10⁻⁴ | 1.41 × 10⁻⁴ | |
| XB, B | 2.09 × 10⁻⁴ | 6.79 × 10⁻⁴ | |
| XP, B | −3.93 × 10⁻⁴ | −5.02 × 10⁻⁴ | |
Table 5.
Maximum feed composition disturbances handled by the DTDC and TC-PQE schemes (Examples I and II).
Table 5.
Maximum feed composition disturbances handled by the DTDC and TC-PQE schemes (Examples I and II).
| Example I | Example II | |||
|---|---|---|---|---|
| TC-PQE | DTDC | TC-PQE | DTDC | |
| +ZM | – | – | 40% | 38% |
| −ZM | – | – | −40% | −40% |
| +ZE | 22% | 20% | 28% | 28% |
| −ZE | −44% | −32% | −58% | −30% |
| +ZP | 30% | 28% | 26% | 20% |
| −ZP | −28% | −26% | −50% | −40% |
| +ZB | 36% | 32% | 42% | 40% |
| −ZB | −40% | −34% | −30% | −42% |
Table 6.
Steady-state deviations for ±20% variations in feed compositions of M, E, P, and B (Example II).
Table 6.
Steady-state deviations for ±20% variations in feed compositions of M, E, P, and B (Example II).
| Scenario | Product Purity | Steady-State Deviation (mol%) | Scenario | Product Purity | Steady-State Deviation (mol%) | ||
|---|---|---|---|---|---|---|---|
| TC-PQE | DTDC | TC-PQE | DTDC | ||||
| +20% ZM | XD, M | 0.74 × 10⁻⁴ | −5.81 × 10⁻⁴ | +20% ZP | XD, M | 0.10 × 10⁻⁴ | 2.18 × 10⁻⁴ |
| XS1, E | −3.99 × 10⁻⁴ | −10.29× 10⁻⁴ | XS1, E | 7.80 × 10⁻⁴ | 11.71 × 10⁻⁴ | ||
| XS2, P | 15.21 × 10⁻⁴ | 15.76 × 10⁻⁴ | XS2, P | −35.73 × 10⁻⁴ | −49.46 × 10⁻⁴ | ||
| XB, B | 0.51 × 10⁻⁴ | −2.42 × 10⁻⁴ | XB, B | −0.18 × 10⁻⁴ | 10.58 × 10⁻⁴ | ||
| XP, B | −0.08 × 10⁻⁴ | −0.21 × 10⁻⁴ | XP, B | −2.63 × 10⁻⁴ | −2.80 × 10⁻⁴ | ||
| −20% ZM | XD, M | 0.63 × 10⁻⁴ | 6.66 × 10⁻⁴ | −20% ZP | XD, M | 0.04 × 10⁻⁴ | −2.04 × 10⁻⁴ |
| XS1, E | −1.66 × 10⁻⁴ | 10.87 × 10⁻⁴ | XS1, E | −12.08 × 10⁻⁴ | −15.06 × 10⁻⁴ | ||
| XS2, P | −21.02 × 10⁻⁴ | −20.42 × 10⁻⁴ | XS2, P | 23.90 × 10⁻⁴ | 29.45 × 10⁻⁴ | ||
| XB, B | −0.53 × 10⁻⁴ | 3.60 × 10⁻⁴ | XB, B | 0.44 × 10⁻⁴ | −10.87 × 10⁻⁴ | ||
| XP, B | 0.17 × 10⁻⁴ | 0.34 × 10⁻⁴ | XP, B | 4.08 × 10⁻⁴ | 4.25 × 10⁻⁴ | ||
| +20% ZE | XD, M | 0.06 × 10⁻⁴ | 2.36 × 10⁻⁴ | +20% ZB | XD, M | 0.14 × 10⁻⁴ | 2.05 × 10⁻⁴ |
| XS1, E | −19.76 × 10⁻⁴ | −21.36 × 10⁻⁴ | XS1, E | 7.74 × 10⁻⁴ | 12.14 × 10⁻⁴ | ||
| XS2, P | −18.27 × 10⁻⁴ | 22.55 × 10⁻⁴ | XS2, P | 7.14 × 10⁻⁴ | −4.99 × 10⁻⁴ | ||
| XB, B | −1.31 × 10⁻⁴ | −2.25 × 10⁻⁴ | XB, B | 0.74 × 10⁻⁴ | −4.80 × 10⁻⁴ | ||
| XP, B | 14.94 × 10⁻⁴ | 20.05 × 10⁻⁴ | XP, B | −3.81 × 10⁻⁴ | −4.04 × 10⁻⁴ | ||
| −20% ZE | XD, M | 0.06 × 10⁻⁴ | −2.20 × 10⁻⁴ | −20% ZB | XD, M | 0.02 × 10⁻⁴ | −1.96 × 10⁻⁴ |
| XS1, E | 15.34 × 10⁻⁴ | 13.96 × 10⁻⁴ | XS1, E | −11.39 × 10⁻⁴ | −16.51 × 10⁻⁴ | ||
| XS2, P | −6.99 × 10⁻⁴ | −29.64 × 10⁻⁴ | XS2, P | −19.80 × 10⁻⁴ | 7.50 × 10⁻⁴ | ||
| XB, B | 0.40 × 10⁻⁴ | 3.30 × 10⁻⁴ | XB, B | −0.28 × 10⁻⁴ | 5.16 × 10⁻⁴ | ||
| XP, B | −5.29 × 10⁻⁴ | −5.55 × 10⁻⁴ | XP, B | 7.78 × 10⁻⁴ | 10.40 × 10⁻⁴ | ||
Publisher’s Note: MDPI stays neutral with regard to jurisdictional claims in published maps and institutional affiliations. |
© 2022 by the authors. Licensee MDPI, Basel, Switzerland. This article is an open access article distributed under the terms and conditions of the Creative Commons Attribution (CC BY) license (https://creativecommons.org/licenses/by/4.0/).
Share and Cite
MDPI and ACS Style
Yuan, Y.; Tao, X.; Huang, K.; Chen, H.; Qian, X. An Effective Temperature Control Method for Dividing-Wall Distillation Columns. Processes 2022, 10, 1018. https://0-doi-org.brum.beds.ac.uk/10.3390/pr10051018
AMA Style
Yuan Y, Tao X, Huang K, Chen H, Qian X. An Effective Temperature Control Method for Dividing-Wall Distillation Columns. Processes. 2022; 10(5):1018. https://0-doi-org.brum.beds.ac.uk/10.3390/pr10051018
Chicago/Turabian StyleYuan, Yang, Xinyi Tao, Kejin Huang, Haisheng Chen, and Xing Qian. 2022. "An Effective Temperature Control Method for Dividing-Wall Distillation Columns" Processes 10, no. 5: 1018. https://0-doi-org.brum.beds.ac.uk/10.3390/pr10051018
Note that from the first issue of 2016, this journal uses article numbers instead of page numbers. See further details here.